Article

Recycled Paper Sludge (RPS)-Derived Nanocellulose: Production, Detection and Water Treatment Application

1
School of Chemistry, Raymond and Beverly Sackler Faculty of Exact Sciences, Tel Aviv University, Tel Aviv 6997801, Israel
2
School of Mechanical Engineering, Faculty of Engineering, Tel Aviv University, Tel Aviv 6997801, Israel
*
Authors to whom correspondence should be addressed.
Appl. Sci. 2022, 12(6), 3077; https://doi.org/10.3390/app12063077
Submission received: 18 February 2022 / Revised: 12 March 2022 / Accepted: 15 March 2022 / Published: 17 March 2022
(This article belongs to the Special Issue Nanocellulose: From Biomass to Advanced Applications)

Abstract

:

Featured Application

This work suggests a practical solution for recycled paper sludge (RPS) by its conversion into a natural and sustainable resource, which can further be used for water treatment applications, such as dye adsorption, as an alternative for the current non-environmentally friendly waste management practices.

Abstract

Paper production and recycling result in large amounts of recycled paper sludge (RPS) that is currently being disposed of in very costly and unsustainable practices, raising the importance of developing green solutions for waste management. The use of nanocellulose (NC) as the next generation of materials has gained much attention due to its economic potential. However, there are substantial challenges in NC extraction, detection, and quantification methods. In this study, NC was produced from RPS as a means of converting waste into a resource. The process included a short, 30 min ozonation (21 mg O3/g RPS), which allowed a sufficient delignification and facilitated the following hydrolysis step. Among all tested durations, a 4-h hydrolysis with 64% w/w sulfuric acid resulted in the highest NC production. Fluorescent staining by calcofluor white was used for simple and low-cost detection of NC in-situ. Crude NC showed a significant 63% dye uptake of 0.1 ppm acid red 131 within 30 min. Compared to the standard disposal methods of RPS, its utilization for NC production supports the circular economy concept and significantly contributes to the development of cellulose bio-based nanomaterials for water treatment applications.

1. Introduction

Recycled paper sludge (RPS), an undesirable byproduct of the paper and cardboard industry [1], consists of varying quantities of organic and inorganic substances, based on the origin and production method [2], and can amount to up to 40% of the paper’s original mass [3]. This waste mainly originates from wood materials, composed of 40–80% cellulose, 5–15% hemicellulose, and some traces of polyphenolic lignin [4]. In Israel, for example, RPS is mainly created in Hadera’s Papermill and consists of 75% cellulose [5]. Most RPS is handled globally either by incineration, landfilling, or landspreading [6], resulting in serious environmental issues, such as groundwater contamination and greenhouse gas emissions [7,8].
Compared to other natural materials, cellulose is deemed an inexhaustible feedstock source due to its innovation and limitless versatility when adapted in nanoscale science [9,10,11,12,13]. The dimensions and crystallinity level of nanocellulose (NC)depend on its origin and extraction method [14,15]. In addition to its large surface area, supramolecular structure, high crystallinity (>70%), chemically adaptable surface, and upgraded mechanical properties [16,17,18,19,20], NC is also biodegradable and biocompatible [21], which makes it a promising candidate for numerous applications [22].
NC has been widely used as a low-cost green material for many laboratory-scale applications, including membranes, supercapacitors, biosensors, water filters, and more [23,24,25,26,27]. One of the most serious challenges in NC extraction is its dispersal in water, as its properties are dictated by its hydrophobic and amphiphilic character [28]. The behavior of such a complex system is on account of the balance between different intermolecular interactions [29,30], whose manipulation can motivate the solubility of NC in aqueous solutions [31].
The extraction of NC from plant-based biomass is achieved in two main steps: (1) delignification pretreatment and (2) separation into nanoscale components [9]. Pretreatment is crucial for exposing the cellulosic content from its surrounding lignin [32], making it readily available for the separation step.
Ozonation was recently presented as an effective pretreatment for plant-based materials [33]. Among other alternatives, it is one of the most promising oxidative delignification treatments as it increases the hydrolysis efficiency [34] with minimal effect on the cellulosic content [35]. The ability to perform ozonation at room temperature [36] is very convenient and cost-effective as only partial lignin removal is necessary for successful NC extraction [37]. Following that, the glycosidic bonds in the cellulose’s amorphous regions are destroyed, usually by acid hydrolysis [38,39,40,41] (Figure 1), while the crystalline parts remain intact [42]. When using sulfuric acid, as well as bond breakage that extracts NC, the acid also replaces an OH group with an anionic sulfate group on the NC’s surface [43,44,45,46,47], increasing its solubility in water.
After its production, the detection and quantification processes of NC are very costly, time-consuming, and do not provide precise data on the reaction’s kinetics. Usually, the method of Chemical Oxygen Demand (COD) is used. However, it is quite a long process [48] in which errors are often inevitable due to the presence of lignin and hemicellulose residues [49].
Calcofluor white (CFW), a fluorescence agent, is standard for detecting cell material in plants [50,51]. Owing to its high affinity to polysaccharides, particularly cellulosic composites [52,53], this derivative of synthetic polyaromatic hydrocarbon is widely used in the dye industry as a whitening agent in textile and paper manufacture [54]. A study published in 1980 by Herth and Schnepf [50] about the binding of CFW to polysaccharide fibrils suggested that this dye is adsorbed oriented parallel to the microfibrillar longitudinal axis. Although the exact binding mechanism is still unclear, it significantly increases the fluorescence signal [55].
Peretz et al. (2019) [56] have suggested a robust, selective detection method suitable for routine measurements in NC production. Two types of cellulose composites were examined in their study: crystalline nanocellulose (CNC) and carboxymethyl cellulose (CMC), a cellulose derivative with very low crystallinity and high solubility in water [57]. CNC staining resulted in a significantly higher fluorescence signal, proportional to its concentration in optimal pH = 12–13.
This study demonstrates NC production from RPS by an ozonation pretreatment, followed up by sulfuric acid hydrolysis, and then its detection in-situ by CFW fluorescent staining, as well as its ability to adsorb acid red 131 dye, as a means of converting paper-based waste into a valuable bio-based resource for water treatment applications.

2. Materials and Methods

2.1. Chemicals

NC powder for analysis and calibration was purchased from Nanografi (Çankaya/Ankara, Turkey). Sulfuric acid was purchased from Bio-Lab (Jerusalem, Israel). Calcofluor white (CFW) stain, sodium carbonate, and tannic acid were purchased from Sigma-Aldrich (Rehovot, Israel). Potassium hydroxide was purchased from Merck (Darmstadt, Germany). Acid red 131 dye was obtained from Colourtex Ltd. (Gujarat, India). All aqueous solutions were made with deionized water (DIW) (Direct-Q3 UV System, Millipore, Bay City, MI, USA).

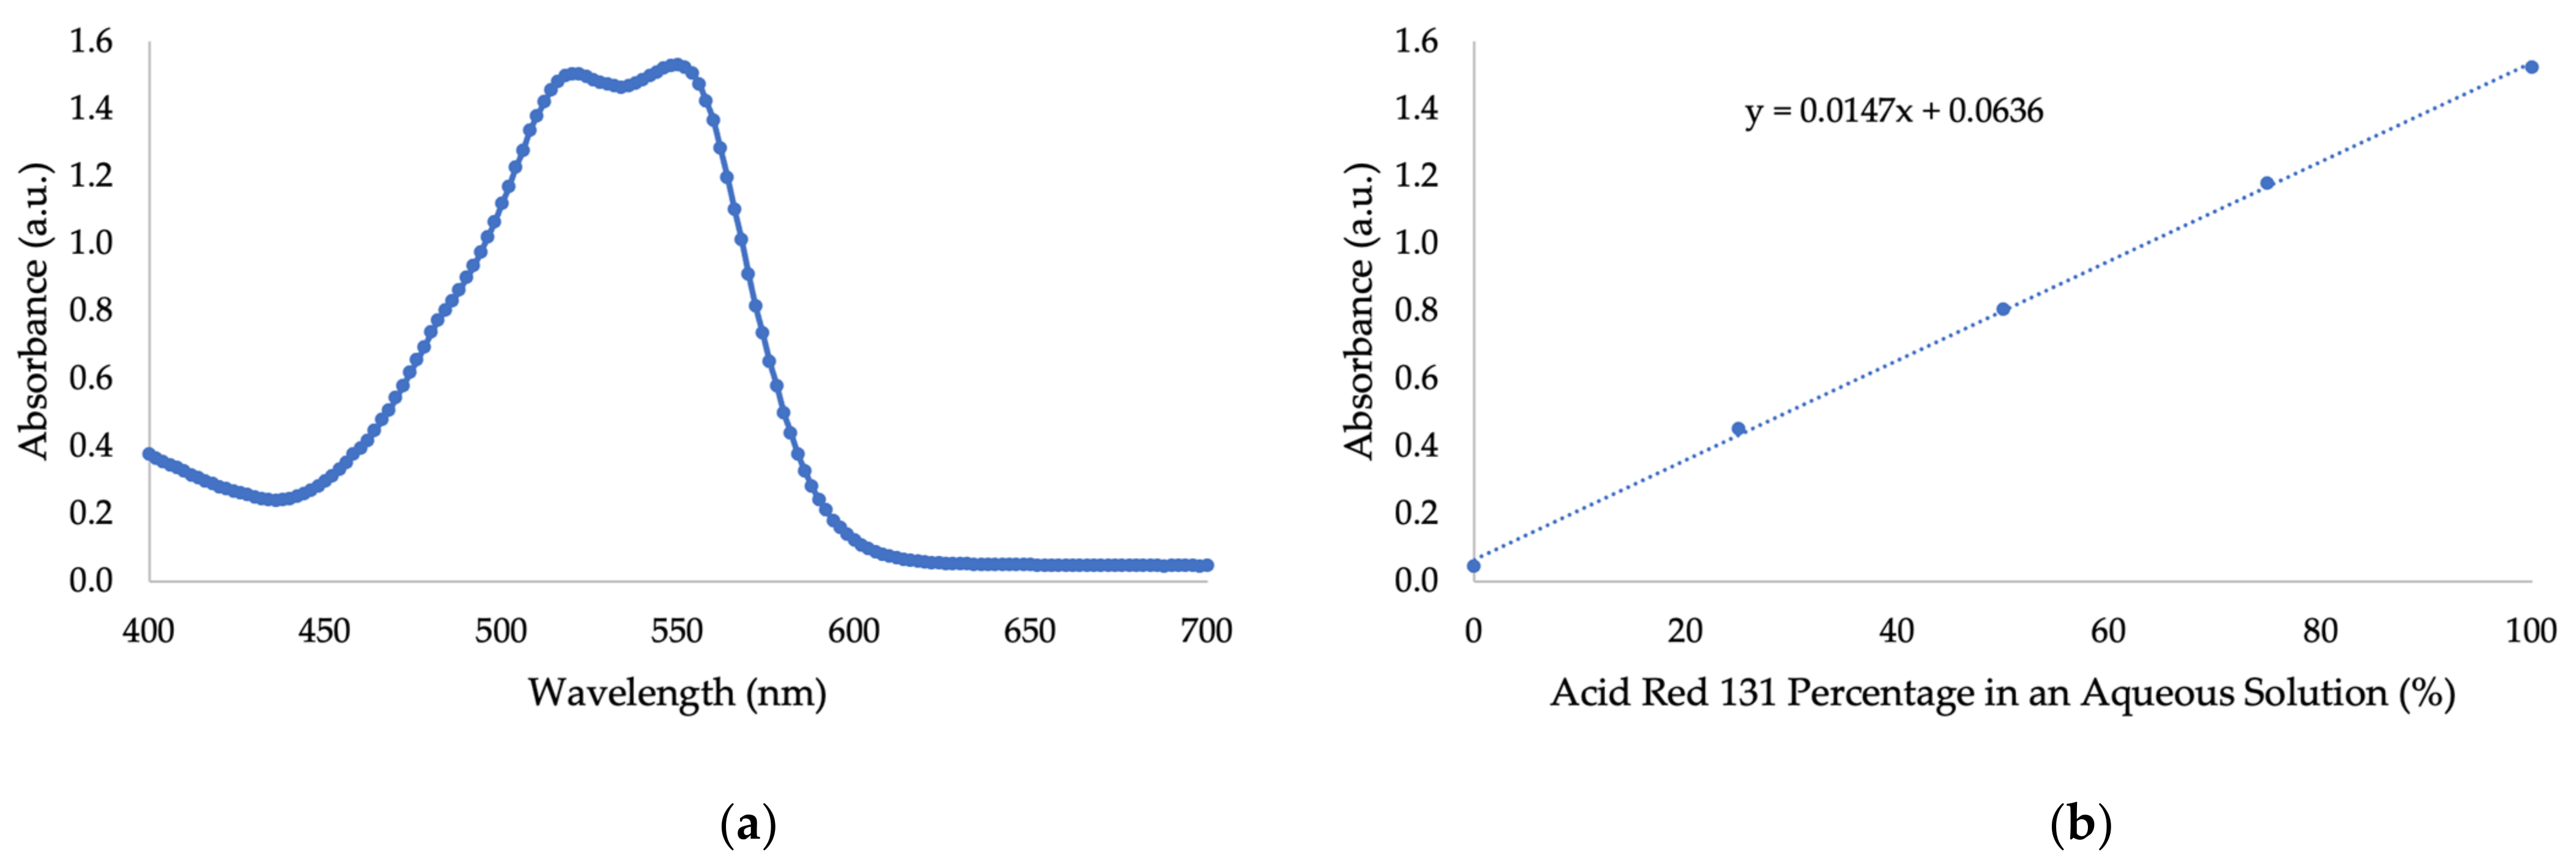
2.2. UV/Vis Absorbance of Nanocellulose and Sulfuric Acid

A total of 5.54 g of pure NC powder was mixed with 200 mL DIW to obtain a 2.77% w/w solution. This 2.77% w/w NC solution was mixed with 32% w/w sulfuric acid to obtain final concentrations of 0%, 0.25%, 0.5%, 1% NC and 0%, 1%, 3%, 6% sulfuric acid. Samples of 200 µL were placed in a flat-bottomed clear 96-well plate (Costar®, Washington, DC, USA), of which absorption was measured using Spark 10M plate reader (Tecan, Switzerland) at a wavelength range of 400–700 nm. Three wells were dedicated for each sample and their average was taken as the final result.

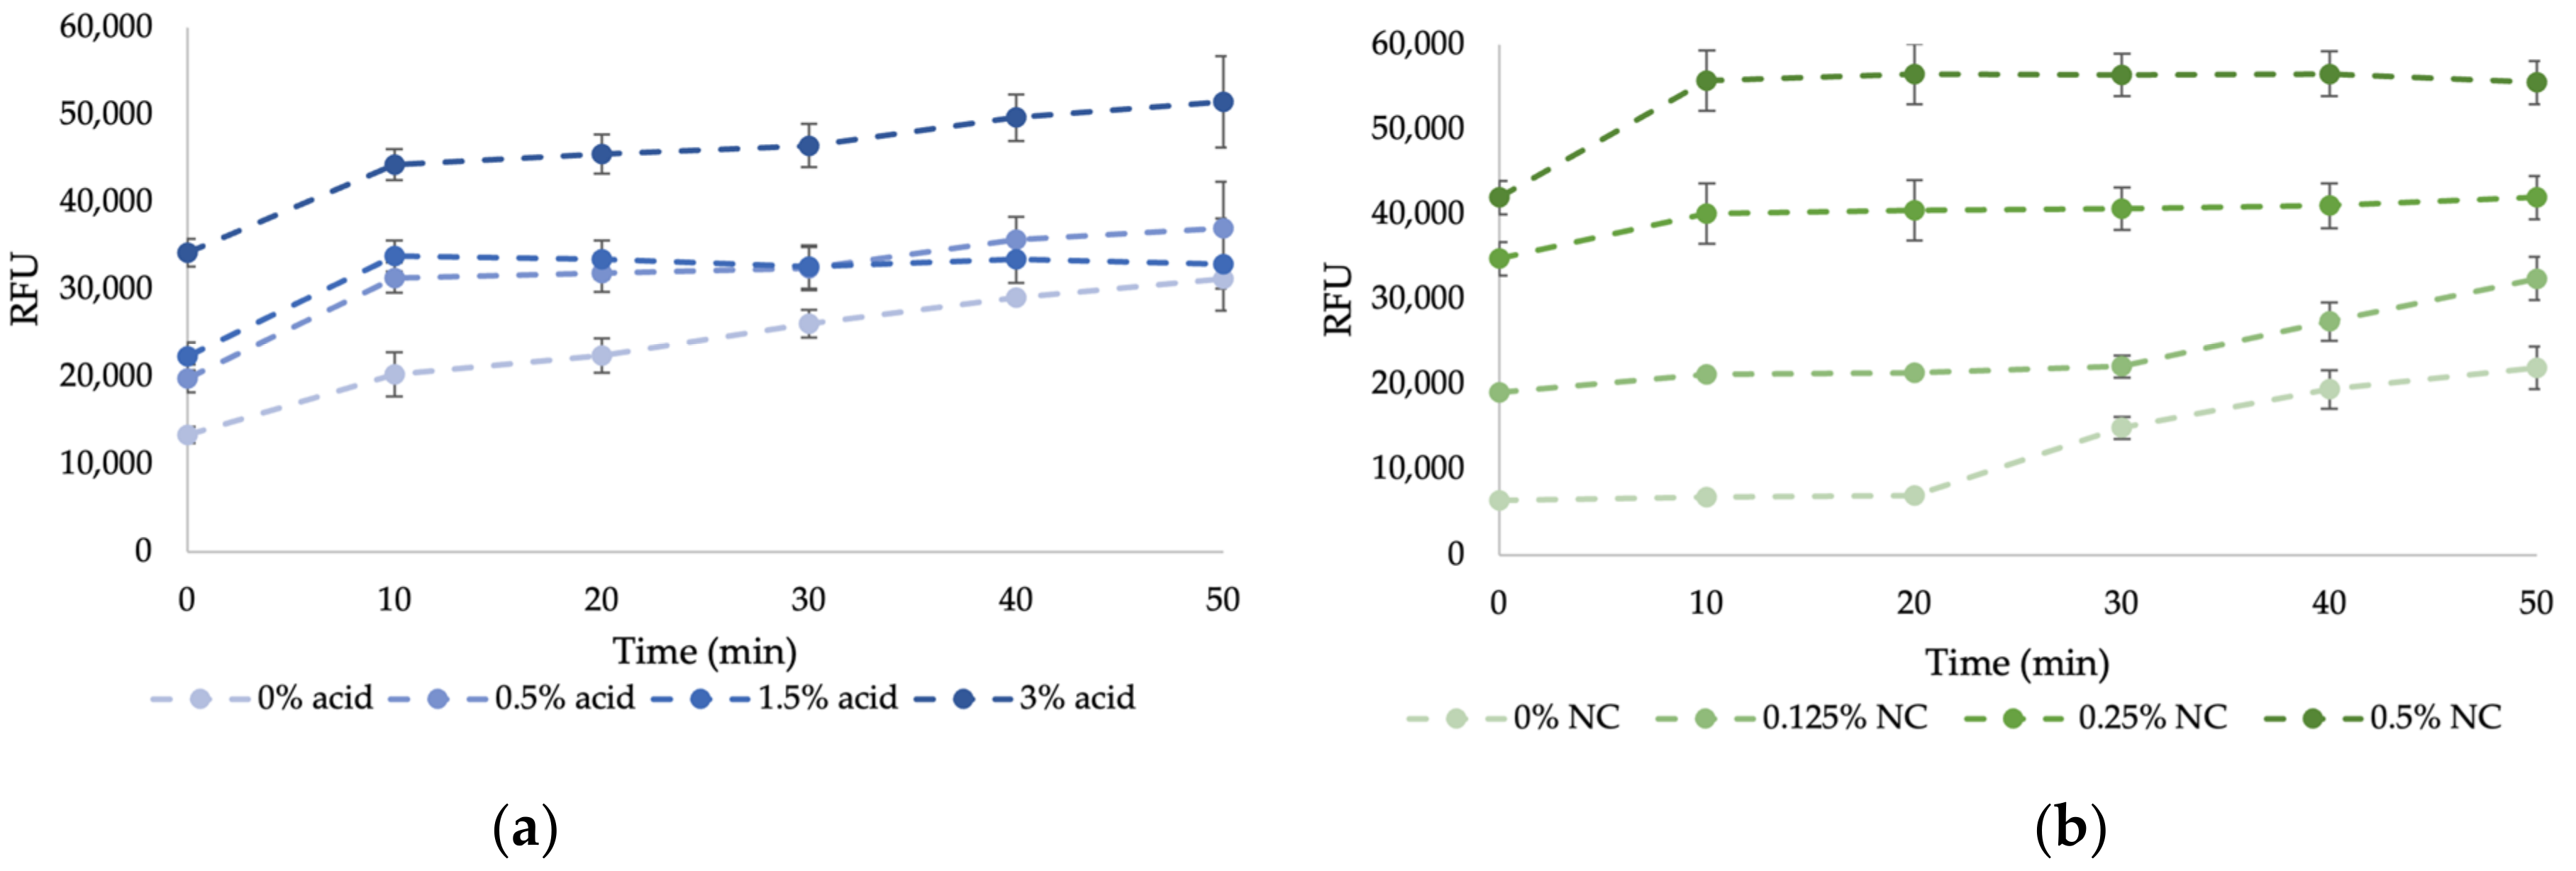
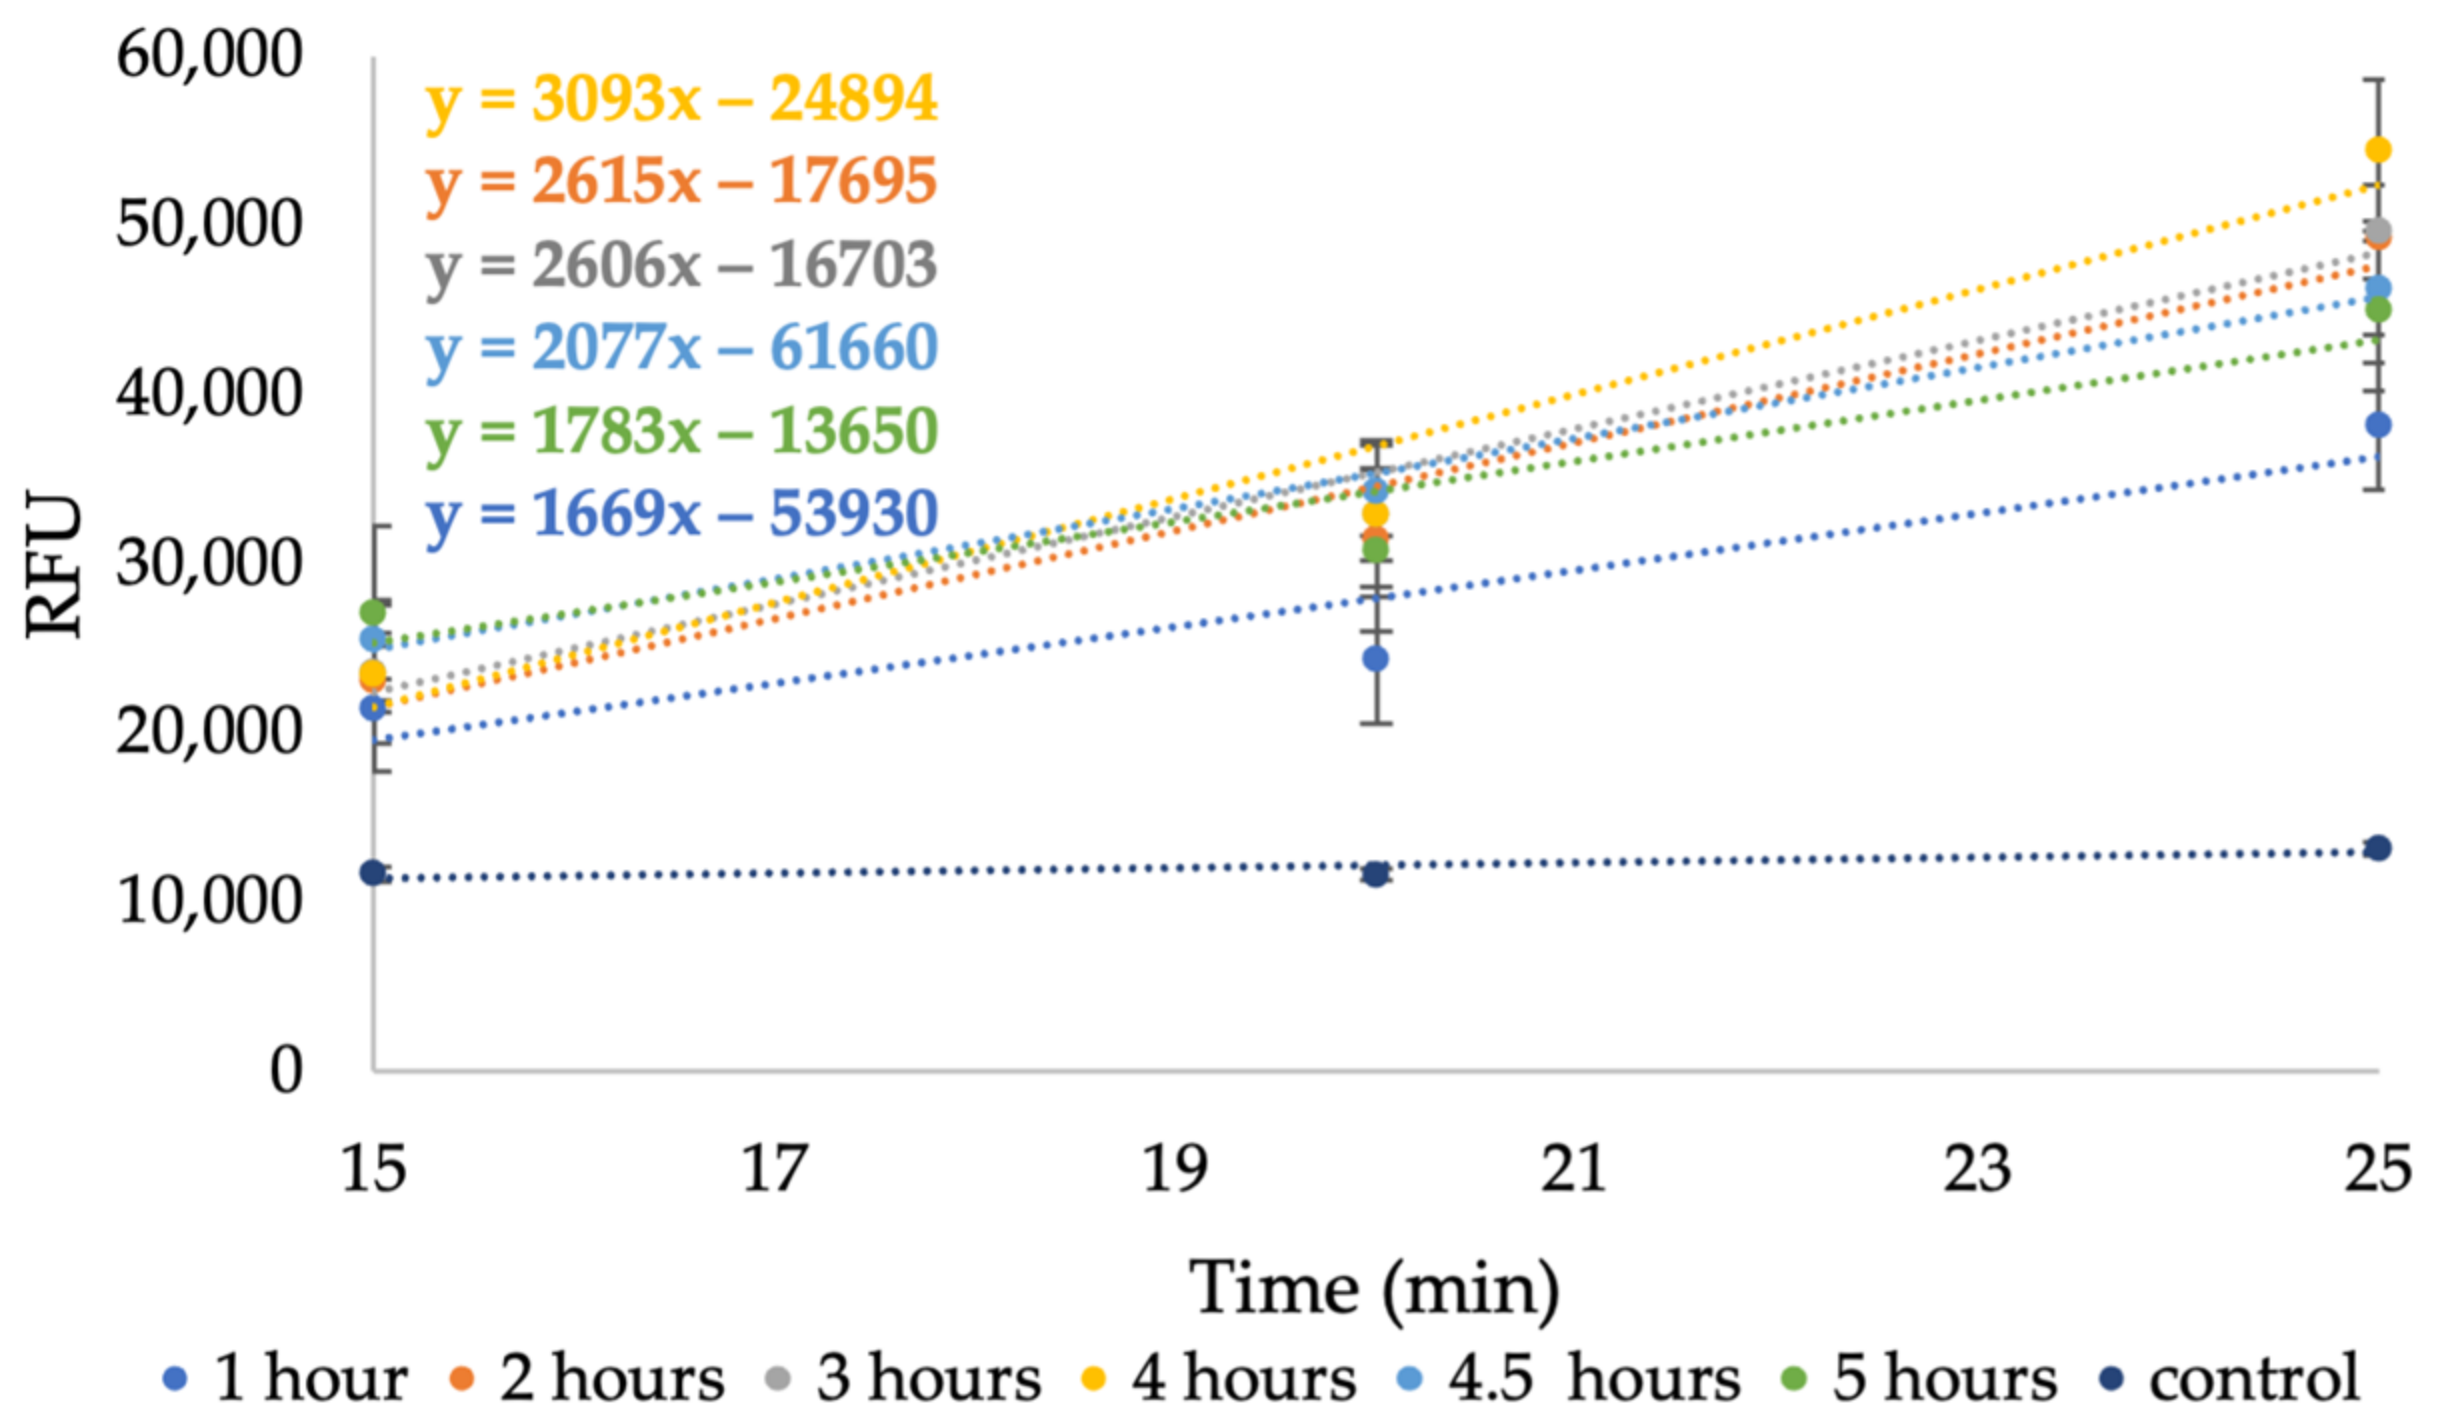
2.3. In-Situ Detection of Nanocellulose by Calcofluor White Fluorescence Staining

Detection of NC using a fluorescence agent was based on the protocol by Peretz et al. (2019) [56]. NC samples of 100 µL were placed in a flat-bottomed black 96-well plate (Nunc™, Roskilde, Denmark), then mixed with 20 µL of CFW fluorescent stain (0.5 g/L) and 80 µL of 9M KOH solution to obtain pH = 13. The fluorescence signal was measured using Spark 10M plate reader (Tecan, Switzerland). Signals were reported in the device’s relative fluorescence units (RFU), calculated from the SparkControl software. Excitation was measured at 355 nm and emission at 433 nm. The plate was kept in continuous shaking mode to prevent sedimentation of NC, and the temperature was maintained at 30 °C. Fluorescence reading was taken every 5 or 10 min with a maximum incubation time of 20–50 min (depending on the analysis). Three wells were dedicated for each sample, and their average was taken as the final result. A calibration curve suggested by Peretz et al. (2019) was used to convert the obtained RFU signals into NC concentration. Accordingly, the same calibration curve was prepared in the lab to compare and validate the results.

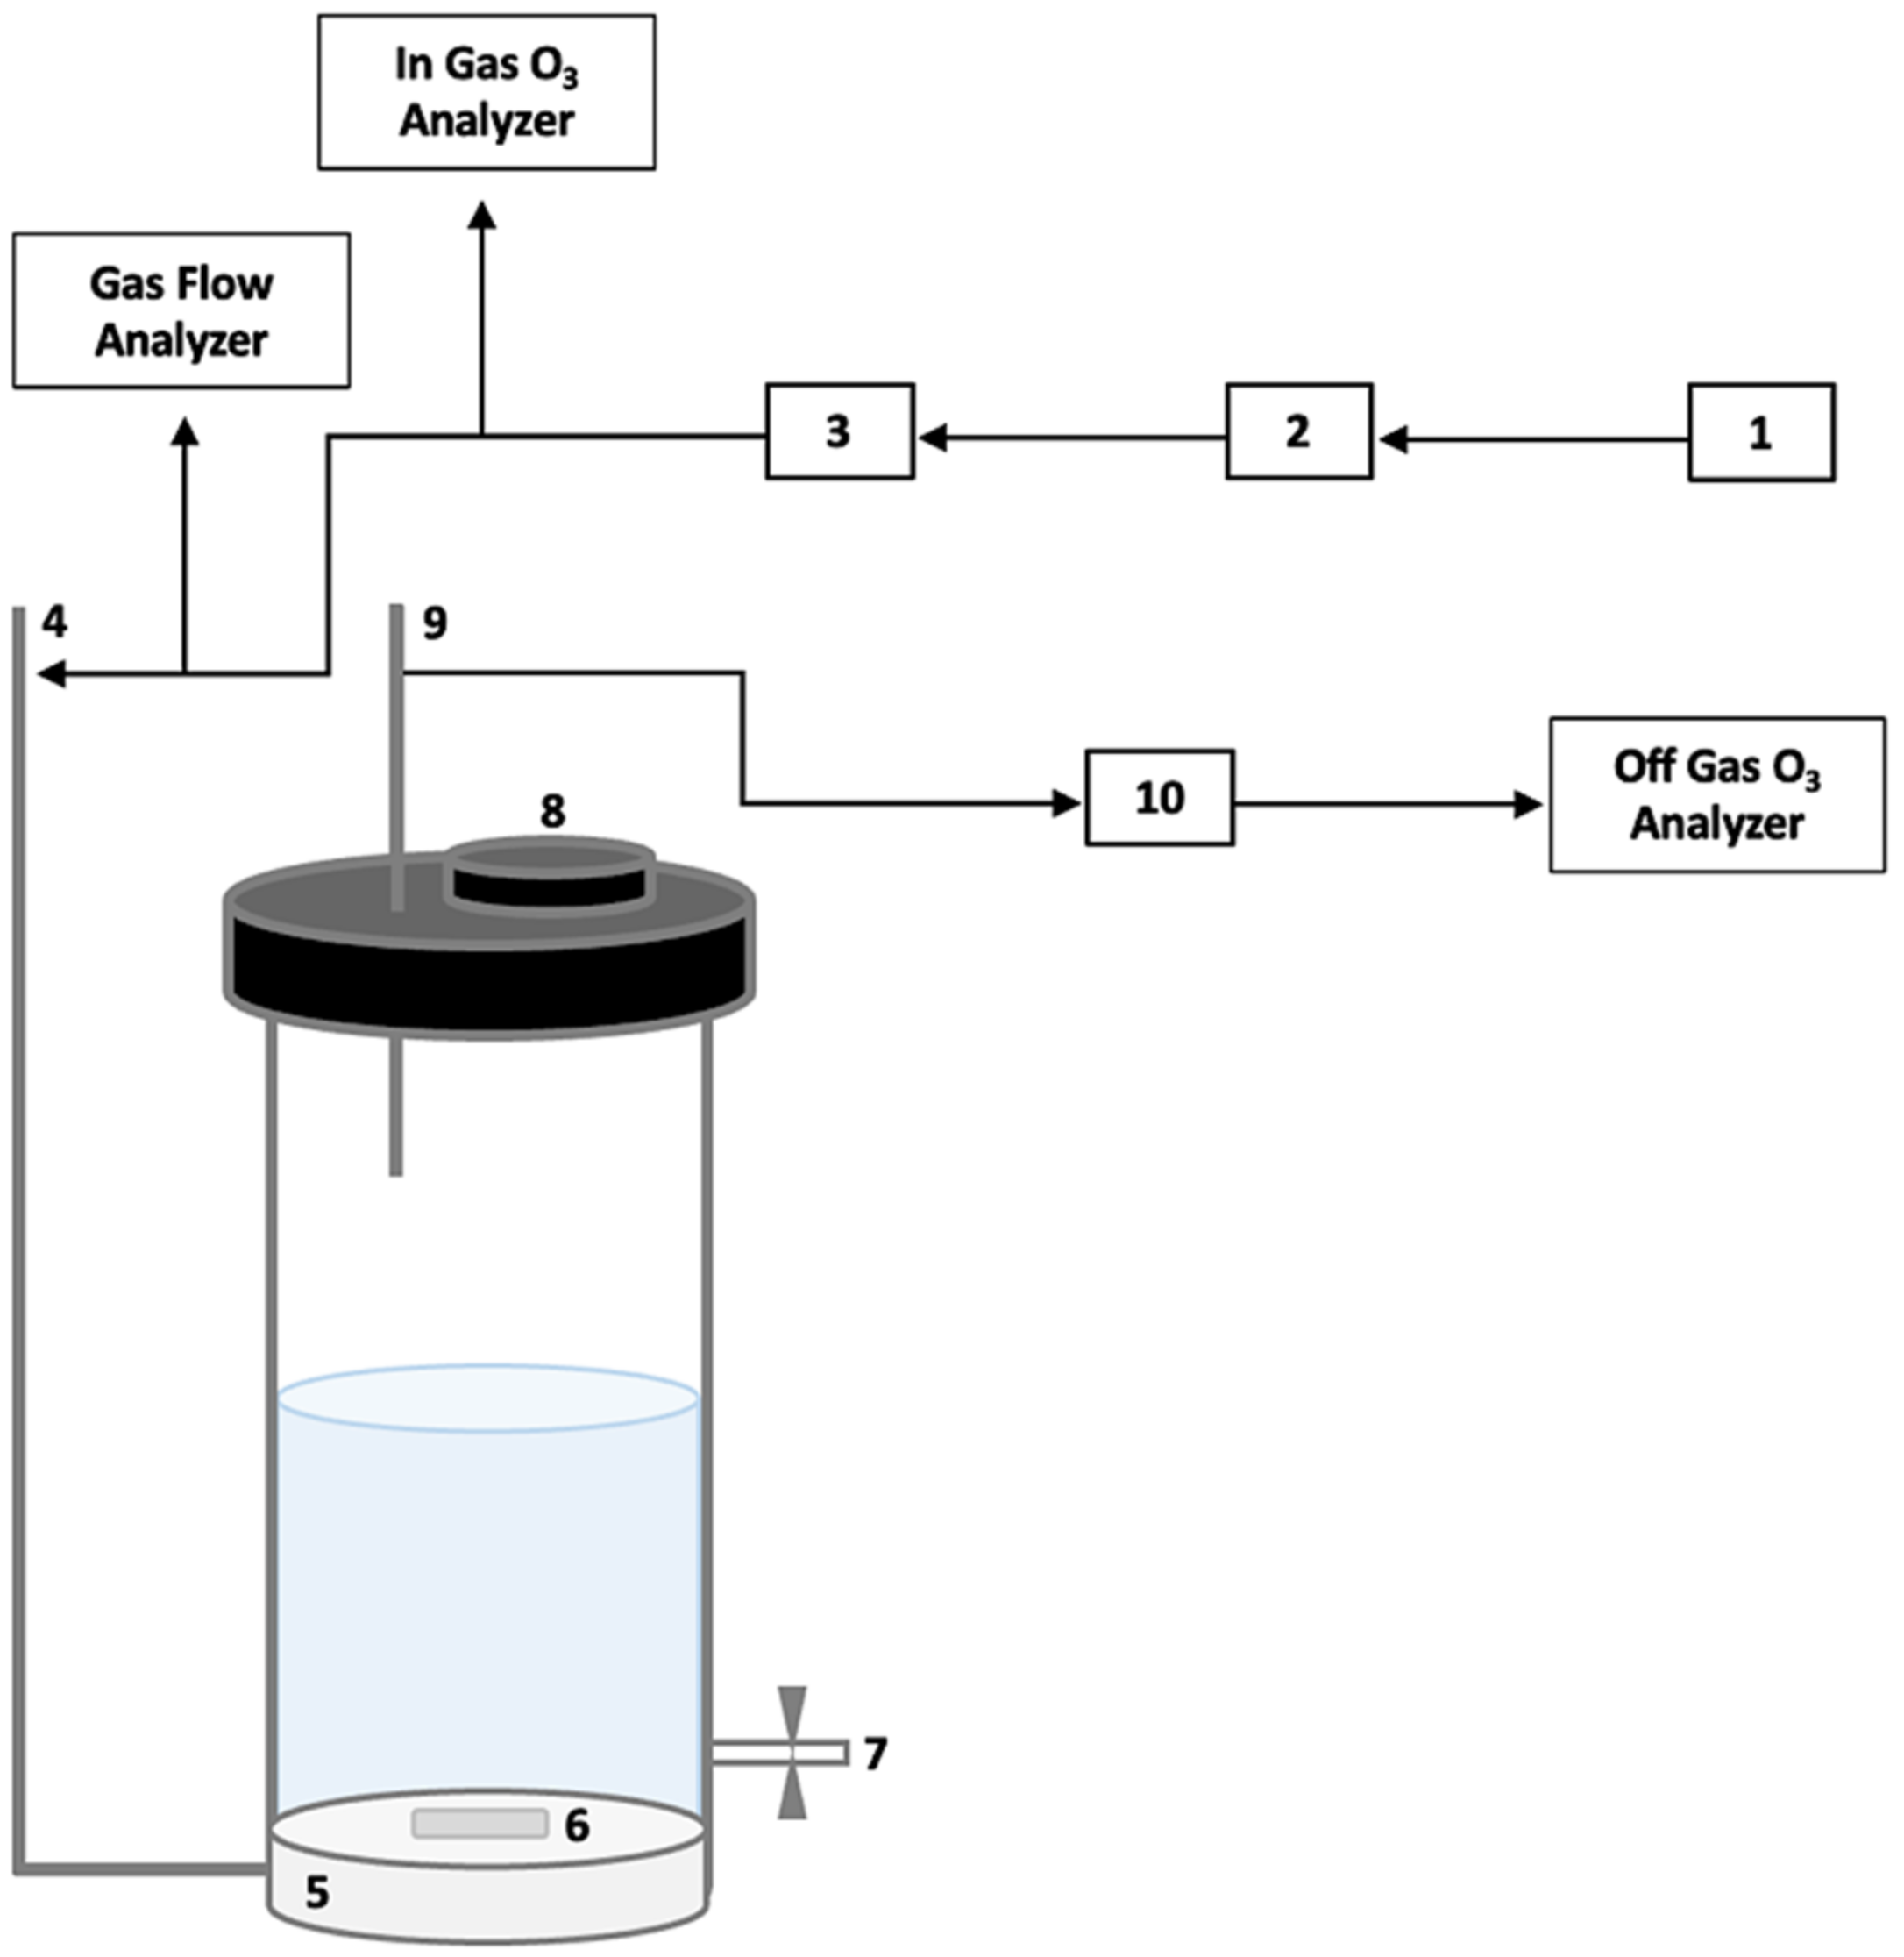
2.4. Ozonation Pretreatment

Ozonation was conducted in a semi-batch reactor that allows a continuous addition of ozone to a fixed amount of water with RPS (Figure 2). An oxygen-fed generator generated ozone (up to 4 g/h; BMT 802 N, Germany), and the oxygen/ozone mixture was bubbled directly into the reactor by a 4 cm3 ceramic diffuser, with a nominal pore size of 25 µm. A glass reactor of 20 cm in height and 7 cm in diameter was filled with a mixture of 10 g RPS in 400 mL DIW. Ozonation was conducted for 30 min at room temperature with continuous magnetic stirring and an average gas flow rate of 0.30 L/min. The concentration of ozone at the input and output was continuously monitored. A 2 mL sample was taken each 10 min. Transferred ozone dose (TOD) is an empirical parameter determining the amount of accumulated ozone that reacts with the examined material. Despite its everyday use for micropollutant elimination prediction in municipal wastewater ozonation, TOD can also determine ozone accumulation in lignocellulosic materials [41]. The ozone dose was estimated by continuous measurements of its concentration in the gas phase at the reactor’s input and output. The total consumed ozone dose was 21 mg/g RPS.
  TOD mg   O 3 L = ( C O 3 in C O 3 out ) [ mg / L ] · GFR [ L / min ] · Δ t V   L
where CO3(in) is the ozone concentration in the input stream, CO3(out) is the ozone concentration in the output stream; representing the ozone that did not react, GFR is the gas flow rate, Δt is the time interval between measurements set at 1 minute, and V is the volume of the reactor’s content.

2.5. Production of Nanocellulose from Whatman Filter Paper

An amount of 5 g of Whatman filter paper no. 1 (Whatman®, Sigma-Aldrich, Rehovot, Israel) was ground in a 250 W laboratory blade mill (MRC Ltd., Holon, Israel) and mixed with 100 mL of 64% sulfuric acid for 3 h at 45 °C and continuous magnetic stirring. A 5 mL sample was taken at different time points (0, 15, 30, 45, 60, 90, 120, and 180 min) and mixed with 45 mL of cold DIW to terminate the hydrolysis reaction. Each sample was centrifuged 2–3 times (6000 rpm, 15 min) for solid removal and the supernatant was analyzed in a fluorescence test for NC detection, according to Section 2.3. The longer hydrolysis (5 h) was conducted the same way, while a sample was taken each 30 min after the first 3 h of reaction. Both experiments were performed three times and their average was taken as the final result.

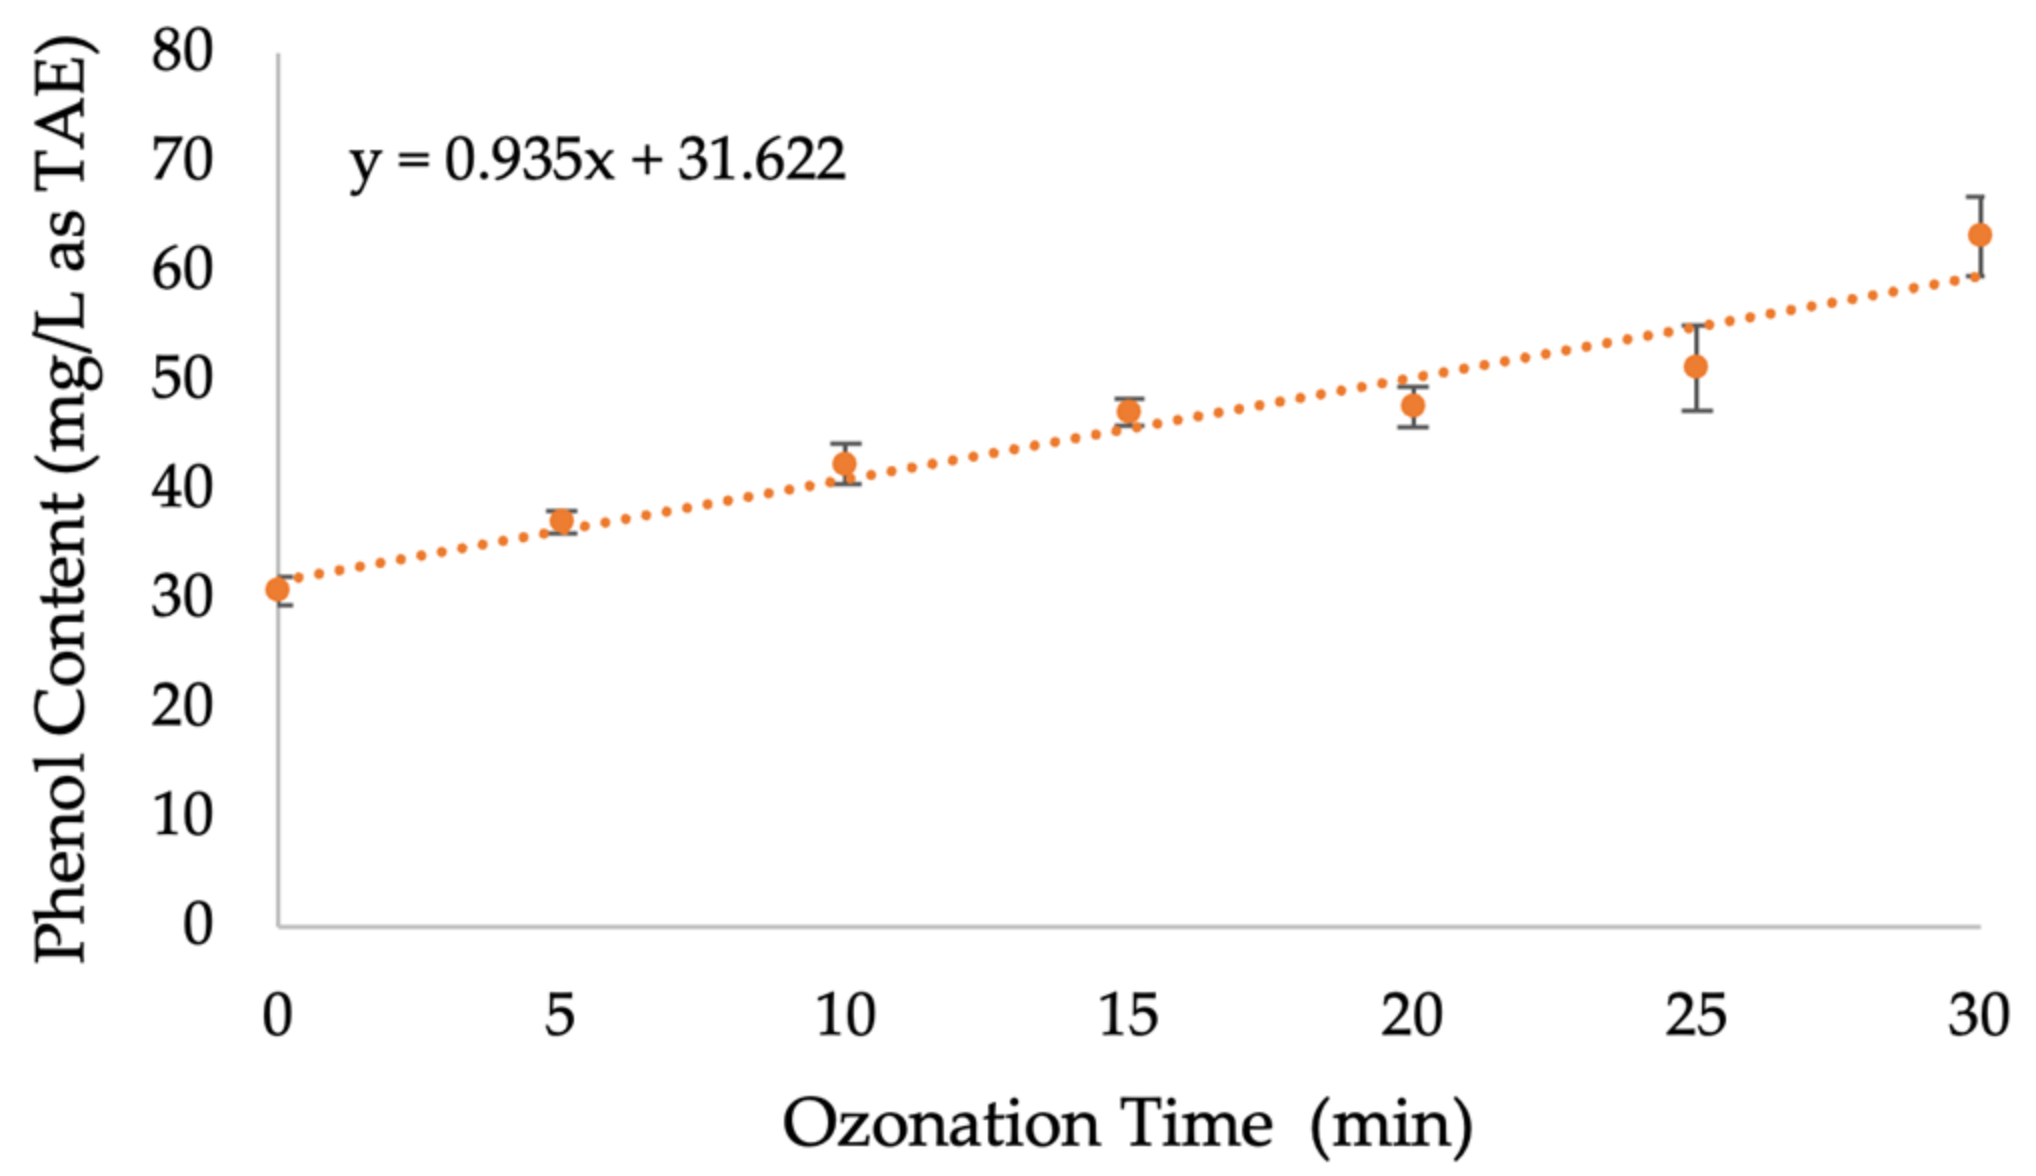
2.6. Determination of Phenolic Content Released from RPS during Ozonation Pretreatment

Folin–Ciocalteu reagent is used to determine phenolic content by colorimetric in vitro analysis [58,59,60]. This blue chromophore is constituted by a phosphotungstic–phosphomolybdenum complex, whose absorption is proportionate to phenols concentration [61,62]. Due to increased delocalization energy when losing a proton, phenols are at equilibrium with phenolate ions in aqueous solutions [47], which react with the Folin–Ciocalteu (F–C) reagent under acidic conditions, resulting in a blue color with typical absorption at 765 nm [63]. Phenolic content that is released from RPS material to the surrounding water during ozonation indicates biomass delignification. The total phenol content released from RPS during ozonation was determined using the Folin–Ciocalteu (F–C) method, according to Carnegie Institute of Science’s protocol [64], with tannic acid instead of gallic acid (due to shortage). A calibration curve was prepared using tannic acid (Figure A3 in Appendix A) and phenol concentrations were reported as tannic acid equivalents (TAE). Then, 0.1 mL of post-ozonation sample, which was taken directly from the reactor’s liquid content, was placed in a 1 mL tube, and 0.2 mL of 10% v/v F–C reagent was added. The samples were incubated for 5 min at 95 °C, and 0.8 mL of 700 mM sodium carbonate solution was added to each of them. The samples were then incubated at room temperature for an additional 2 h. In total, 200 μL of each sample was placed in a flat-bottomed clear 96-well plate (Costar®, USA), and their absorbance was determined at 765 nm using a multimode microplate reader (Spark 10M, Tecan, Männedorf, Switzerland). Three wells were dedicated for each sample and their average was taken as the final result.

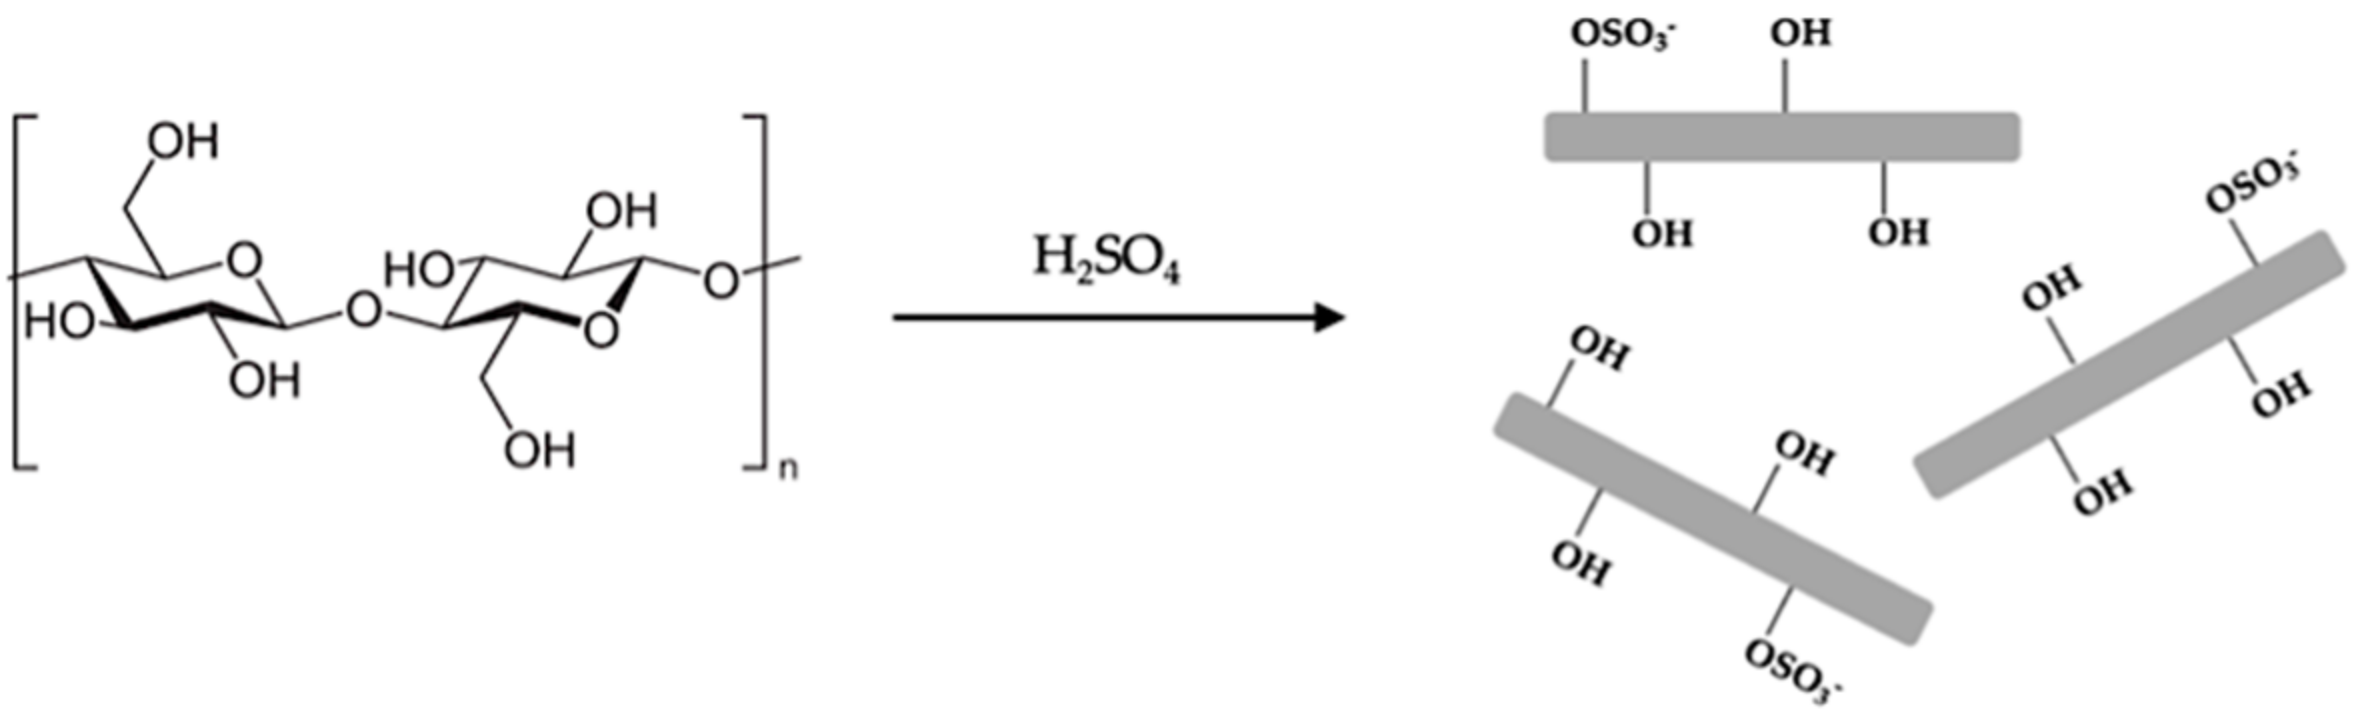
2.7. Production of Nanocellulose from Recycled Paper Sludge (RPS)

RPS material was received from Hadera’s Papermill (Hadera, Israel). During the recycling process, paper wastes are first mixed with water to create a slurry, which is then separated based on the length of its fibers; fibers longer than 2.6 mm undergo fine cleaning, in which the residues are collected on an extra-fine screen where the filtrate along with the short (<2.6 mm) remaining fibers are considered RPS. The RPS is dried, ground in a 250 W laboratory blade mill (MRC Ltd., Israel), and sieved through a 2 mm mesh wire screen (450 W, ALS Ltd., Giv’at Shmuel, Israel) to remove plastic particles, sand, and dirt. First, hydrolysis was conducted on a non-pretreated RPS; 5 g of raw RPS was mixed with 100 mL of 64% w/w sulfuric acid for 5 h at 45 °C with constant magnetic stirring. A 5 mL sample was taken each hour for the first 4 h, then each 30 min for a total of 5 h, and mixed with 45 mL of cold DIW to terminate the hydrolysis reaction. The complete experiment after a pretreatment was conducted similarly after ozonation of 30 min (a total of 21 mg ozone/g RPS) at room temperature, according to Section 2.4. All samples were centrifuged 2–3 times (6000 rpm, 15 min) for solid removal, and the supernatant was analyzed in a fluorescence test for NC detection, according to Section 2.3. Each experiment was performed three times and their average was taken as the final result.

2.8. Zeta Potential Measurements

Zeta potential, also known as electrokinetic potential, is an interfacial parameter applied in many scientific fields, principally for investigating technological processes and characterization of natural and synthetic fibers [65,66,67]. It originates from the accumulation of electrical charges in an electrical double layer formed at a solid/liquid interface [68]. Zeta potential measurements provide an insight into the solid’s surface charge and adsorption properties, which provide information on its condition and characteristics in a polar medium. The zeta potential of both Whatman filter paper and RPS was determined from streaming potential measurements using an electrokinetic analyzer (SurPASS™3, Anton Paar GmbH, Graz, Austria) equipped with a conductivity probe and a pH electrode. Both samples were ground and dried at 50 °C, placed in the cylindrical compartment of the measuring cell and compressed to create a sample plug with controlled permeability to water flow. An electrolyte (0.01 M NaCl solution) streamed through the sample plug generated a streaming potential. The pressure difference between both ends of the sample plug varied continuously between 200–600 mbar (starting at 600 mbar). Streaming potential measurements were taken in a pH range of 2–6 (starting at pH = 6) obtained by titrating the samples with 0.05 M HCl solution. Titration was performed from high to low pH to suppress any effect of the acid on the biomass’ properties and any influence of varying ionic strength on the analysis. The pH range was selected to monitor the impact of ozonation on the surface charge of the biomass, as well as determine the isoelectric point (IEP) of the corresponding sample. Three measurements were taken at each pH value, and their average was taken as the final result.

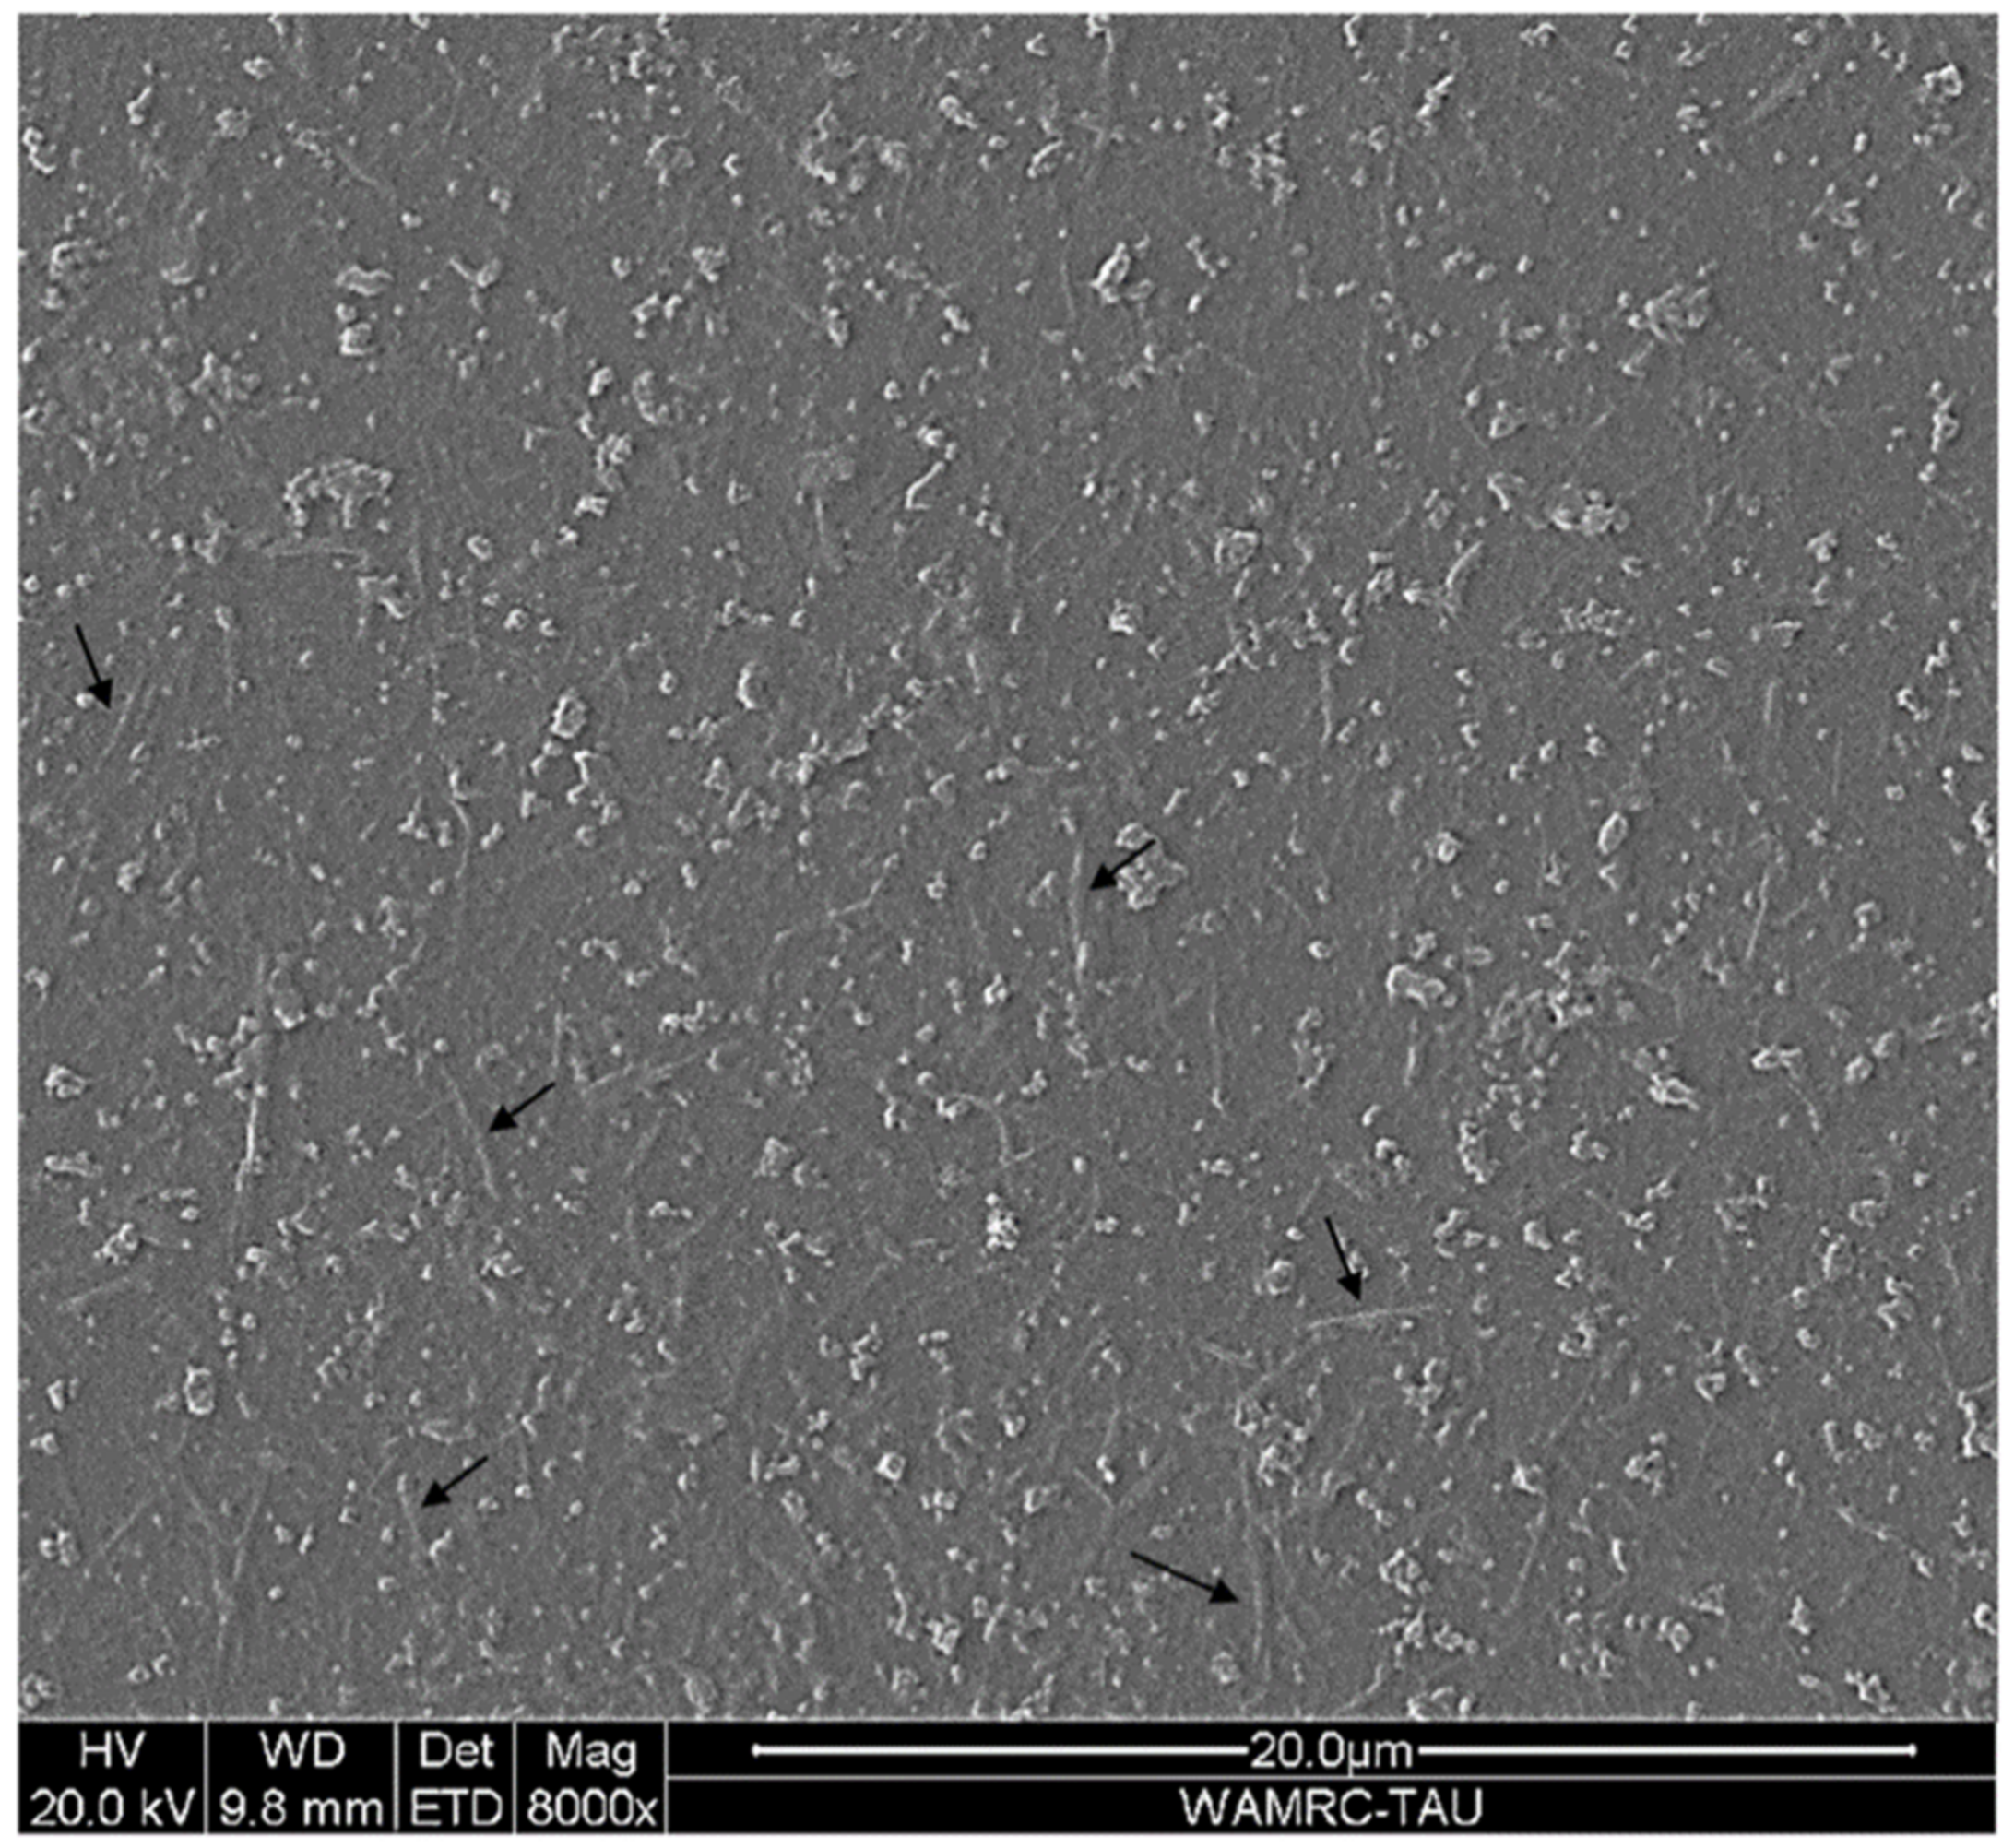
2.9. Scanning Electron Microscopy (SEM) Imaging

SEM imaging was performed with a Quanta 200 FEG environmental scanning electron microscope equipped with a field-emission electron gun (FEG). A drop of NC suspension was dried in ambient conditions for several days on a silica wafer, coated with conductive palladium and placed directly into the SEM. Imaging was performed by Hitachi S3200 N SEM-EDS system at 20 kV accelerating voltage.

2.10. Adsorption of Acid Red 131 Dye by Crude NC

A crude NC solution obtained according to Section 2.5 that presented the highest RFU signal increase according to Section 2.3, was chosen to test its ability as a sorbent of acid red 131 dye. A total of 2 mg of pure acid red 131 dye powder was mixed with 200 mL of DIW to obtain a 10-ppm stock solution and diluted to obtain a 0.2 ppm solution. Dye’s absorption spectrum was obtained to determine its optimal wavelength, which was also used to obtain a calibration curve (Figure A7a,b in Appendix A). The crude NC solution was diluted and mixed with the dye solution at a 1:1 ratio to obtain final concentrations of 0.1 ppm dye and 1 ppm NC. These solutions were constantly mixed at room temperature. The first sample was taken after 30 min, another one was taken after 45 and 60 min, and the last sample was taken after another 30 min, resulting in 90 min in total. Each sample was centrifuged (6000 rpm, 5 min) for solids removal, then, 200 μL of the supernatant was placed in a flat-bottomed clear 96-well plate (Costar®, USA), and its absorbance was measured at 550 nm, a characteristic peak (Figure A7a in Appendix A), using a multimode microplate reader (Spark 10M, Tecan, Männedorf, Switzerland). Three wells were dedicated for each sample and their average was taken as the final result.

3. Results

3.1. UV/Vis Absorbance of Nanocellulose and Sulfuric Acid

The absorbance of pure NC in varying sulfuric acid solutions was examined according to Section 2.2. Figure 3 demonstrates the relation between absorbance and NC concentration in varying sulfuric acid solutions at λ = 400 nm, based on Figure A1 in Appendix A. In the visible range, NC absorbance increases with concentration, and the absorbance of sulfuric acid remains similar to the control measurement of DIW (i.e., 0% acid). The absorbance of NC increases with the presence of sulfuric acid. Obtaining a similar slope for different acid concentrations (>0%) indicates that acid concentration does not affect the signal; only its presence does. This result is reasonable as sulfuric acid modifies the NC’s surface during their reaction, which increases the NC’s absorption overall. The signal remains proportional to the concentration of NC only.

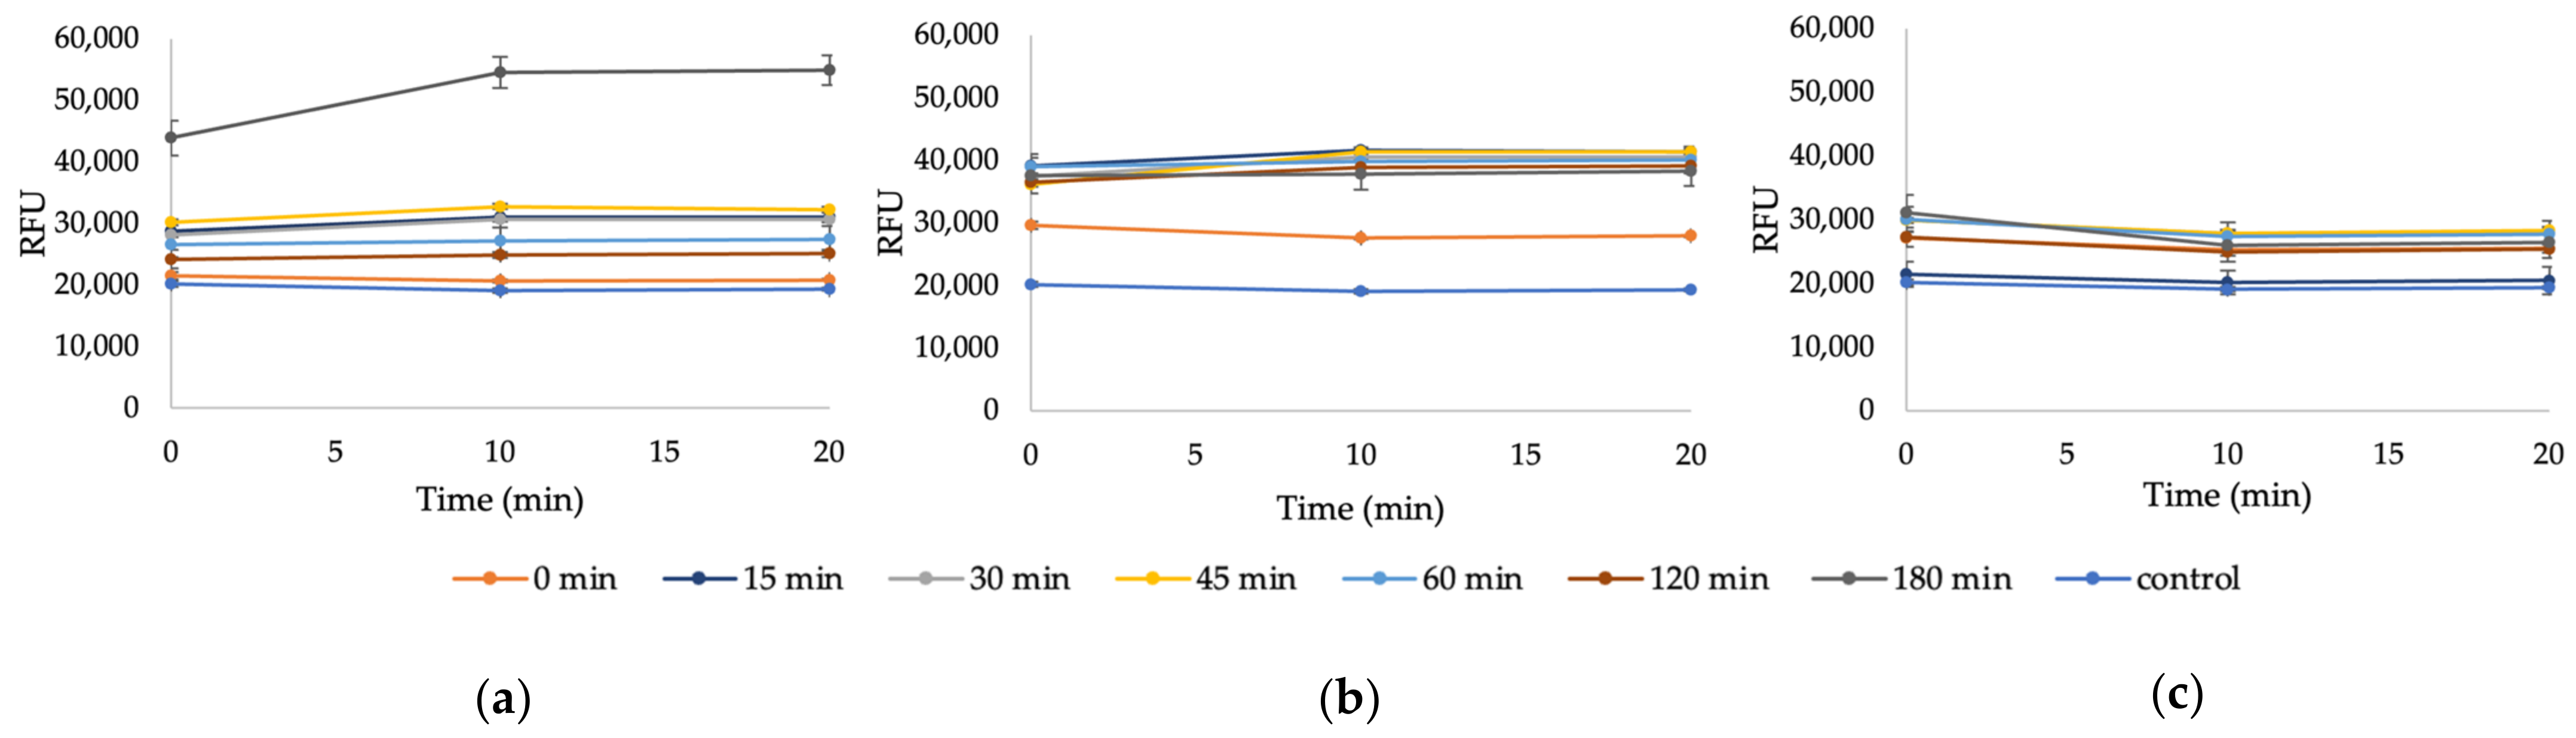
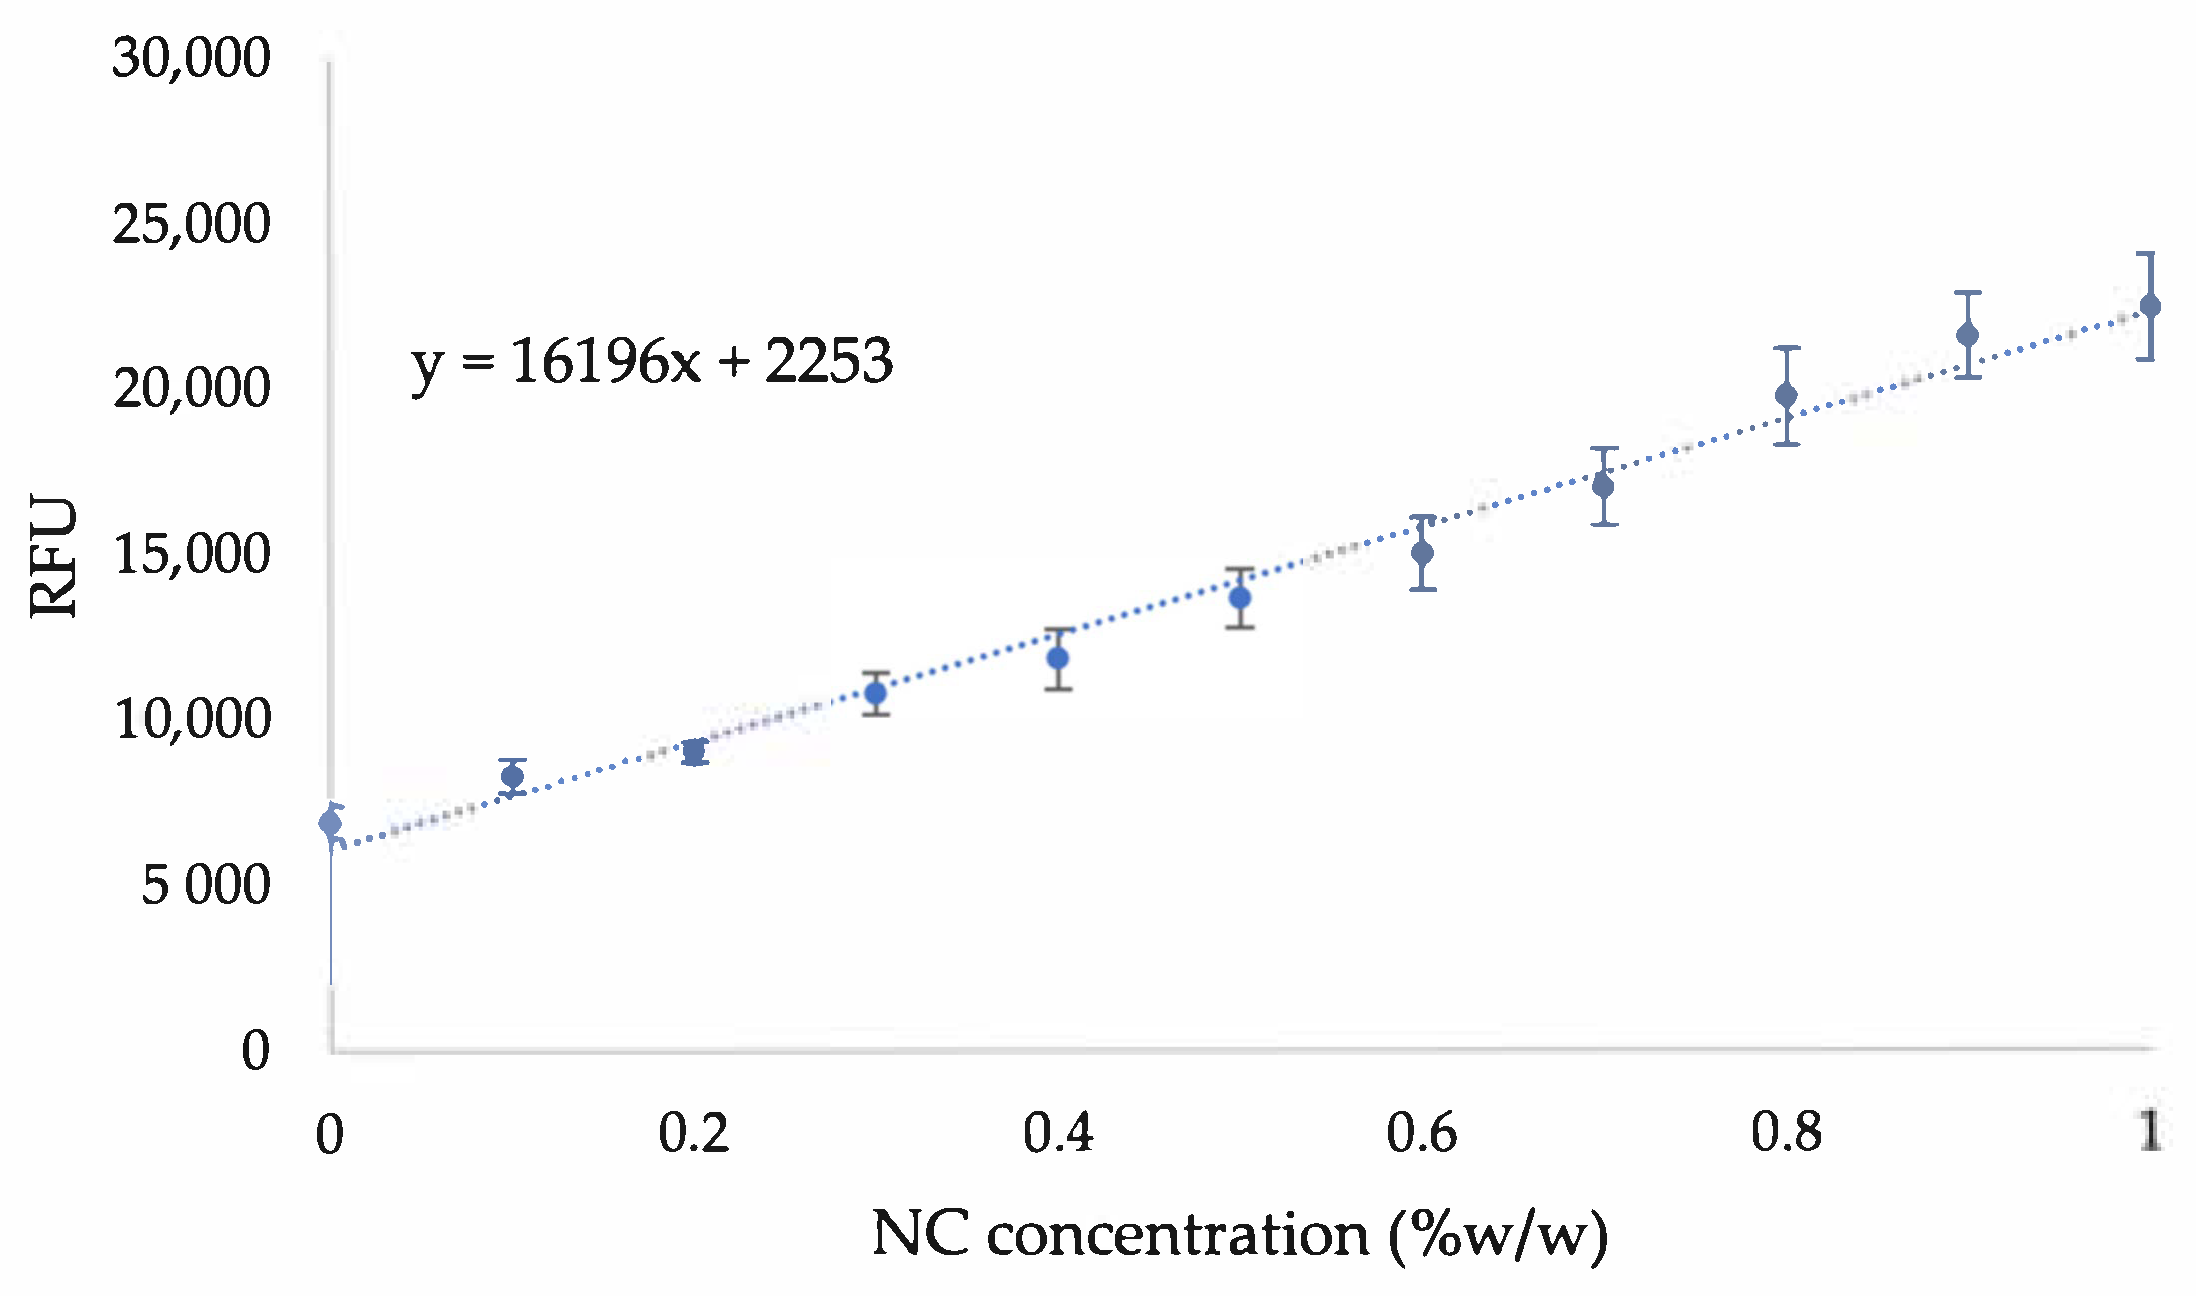
3.2. In-Situ Detection of Nanocellulose by Calcofluor White Fluorescence Staining

The fluorescence signal of pure NC, which was dyed with CFW (i.e., a fluorescence agent) and pre-mixed with sulfuric acid, was examined to simulate post-hydrolysis conditions. KOH solution was added to ensure optimal pH = 13 for dye activity. Figure 4 demonstrates an increase in relative fluorescence units (RFU) with NC concentration (Figure 4b). However, not only the obtained signal was evaluated but also the increase in it, indicating NC dispersal in the solution. The RFU signal also increases with sulfuric acid concentration (Figure 4a), probably due to the modification of NC by it, as the negatively charged sulfate group introduced to the NC’s surface facilitates its dissolution in water. Another possible effect of the acid may be on the CFW binding to the NC in a way that increases the signal. Nonetheless, further investigation must be conducted to confirm or refute the latter hypothesis; relevant information has not been found in previous studies.
To ensure that any obtained RFU signal indicates NC only, a control test was conducted with a similar solution content but without NC (Figure A2 in Appendix A). No increase in the signal was detected during the first 30 min; then, it increased dramatically. This can explain the rise in the signal in the previous results with 0% NC at a similar time. To validate future results obtained by this method, all fluorescence tests were conducted for up to 30 min. Generally, it seems that the presence of acid does not affect negatively the binding of CFW to NC, as long as the final solution is held at the optimal alkaline conditions of pH = 13.

3.3. Production of Nanocellulose from Whatman Filter Paper

Before working with recycled paper sludge (RPS), the NC production process was demonstrated using an ideal source of cellulose, Whatman filter paper no. 1, according to Section 2.5, to create a model testing protocol. After a 3-h hydrolysis and two centrifugations (6000 rpm, 15 min), the desired signal increase in the supernatant was not obtained (Figure A4 in Appendix A), concluding that a 3-h reaction is not enough for efficient NC production at the chosen conditions, thus, a longer hydrolysis was conducted. Figure 5 demonstrates the RFU signals of NC produced from Whatman filter paper immediately after hydrolysis (3–5 h) and after one and two centrifugations (6000 rpm, 15 min). Increasing the hydrolysis duration increased the RFU signal. One centrifugation, which resulted in a slightly turbid white supernatant, indicating NC suspension, seemed enough to release the produced NC, as the signal flattened out after the second centrifugation.
Several attempts were made to quantify the data for obtaining NC concentration. As a basis of comparison, COD tests were used for NC concentration analysis for three different hydrolysis durations (Figure 5a), which was calculated according to Equation (2) suggested by Wang et al. (2012) [13] (Table 1). Two calibration curves were used, the one suggested by Peretz et al. (2019) [56] and the one prepared in the lab according to the same reported protocol (Figure A5 in Appendix A).
  NC mg L = COD   value 1.185
The lab-prepared calibration curve provided an equation that differed considerably from that presented in the work of Peretz et al. (2019) [56], although the sample preparation and measurement were conducted by the same reported protocol. Unfortunately, the obtained results from both calibration curves were neither practical nor comparable as the order of magnitude did not fit the COD test results. Hence, the produced NC could not be quantified with the CFW fluorescent staining method. Nevertheless, the COD tests confirmed that the initial reaction time was not long enough for efficient NC production; only 0.98% yield was obtained after a 3-h sulfuric acid hydrolysis. This result is consistent with the behavior of RFU signals for the same samples, meaning that CFW stain is efficient for NC detection in-situ. In other words, CFW fluorescent staining allows real-time detection of NC, while the increase in the fluorescence signal is proportional to its dispersal in the solution.

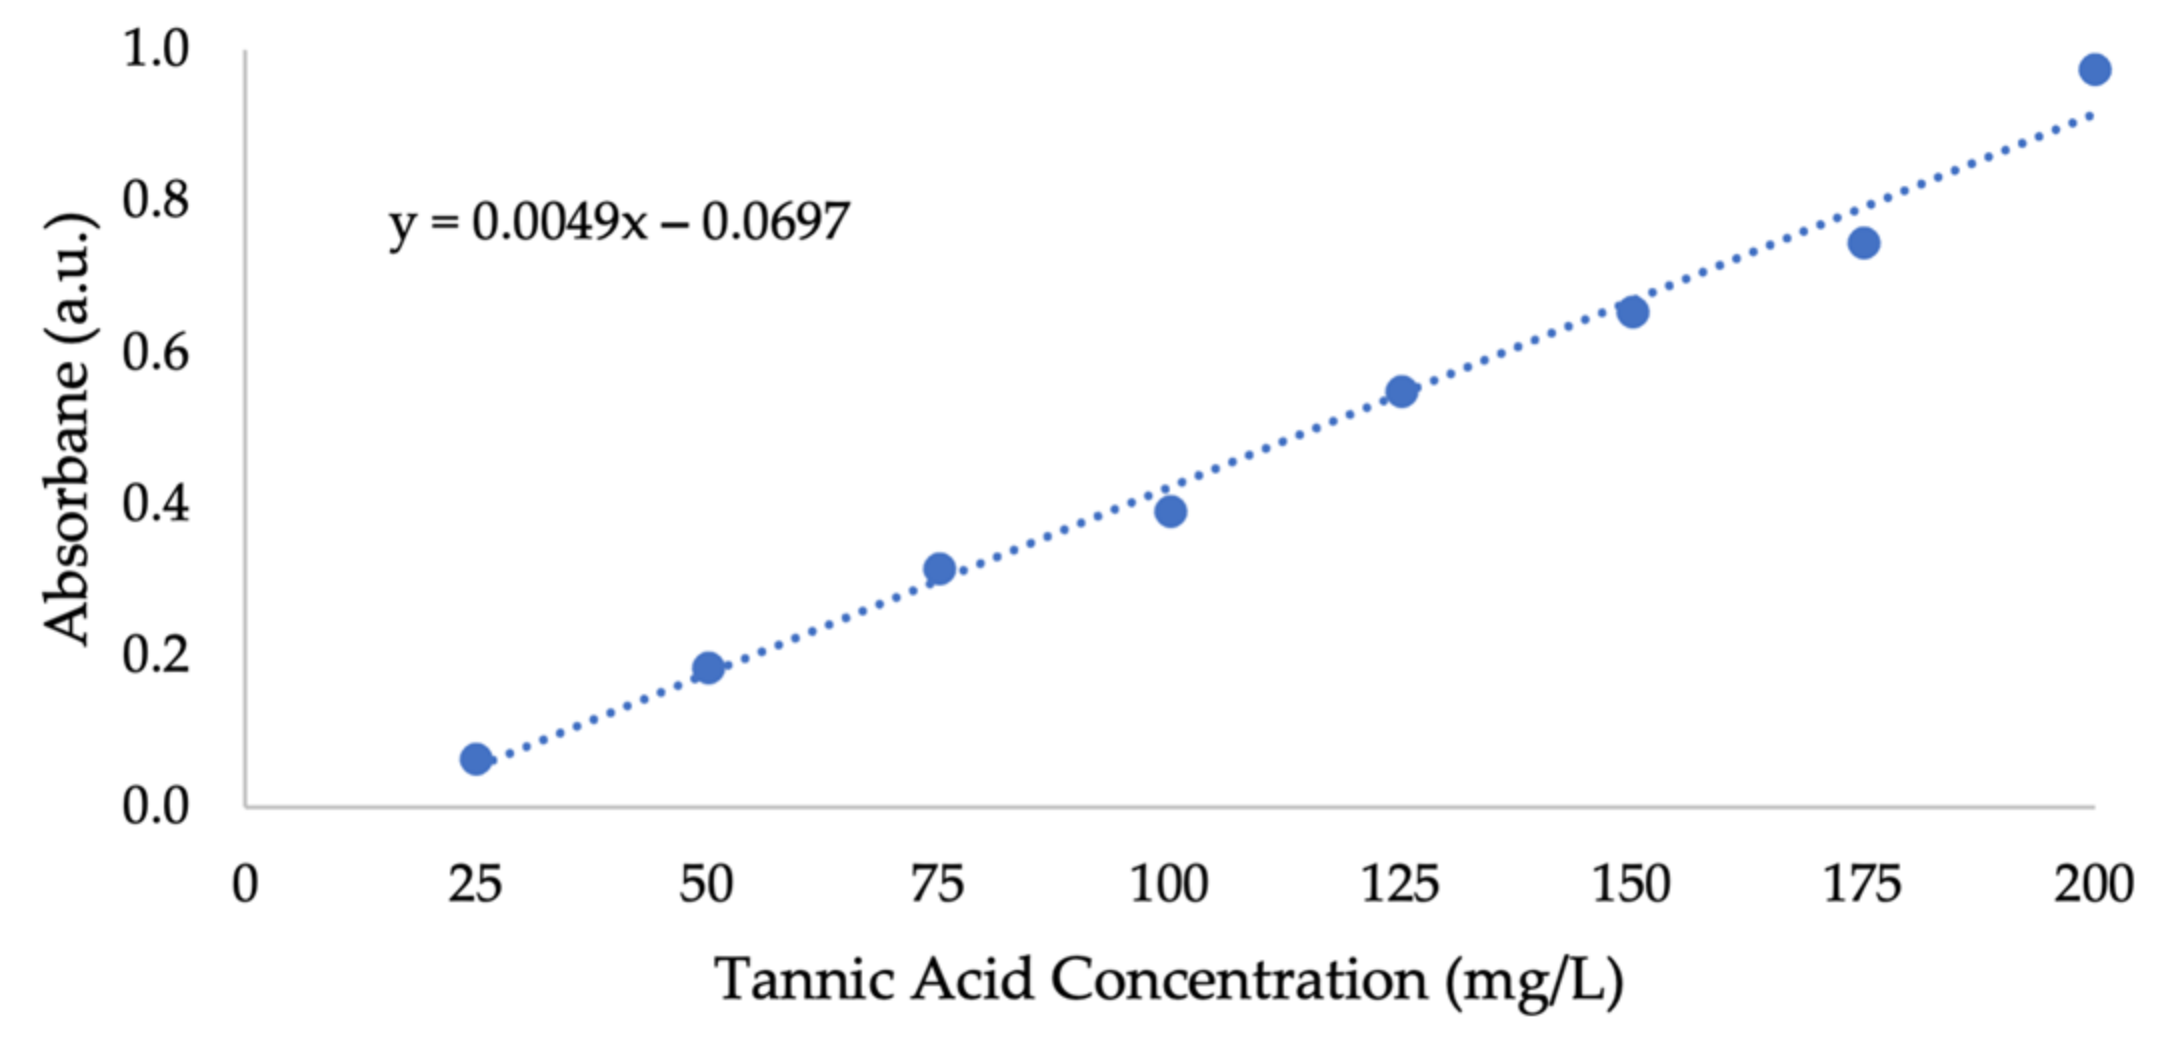
3.4. Determination of Phenolic Content Released from RPS during Ozonation Pretreatment

Figure 6 demonstrates an increase in the total phenol content released from RPS with ozonation time. This increase suggests that phenolic content is quickly released, exposing the cellulosic content of RPS. The hypothesis of lignin depolymerization during ozonation is strengthened. The ozonation duration is crucial not only for the efficiency of delignification but also for preventing further degradation of the exposed cellulosic content; long ozonation treatments might result in the degradation of soluble phenolic compounds as a result of oxidative chemical changes, which either mineralize the phenolic compounds or oxidize them to organic intermediates [69,70].

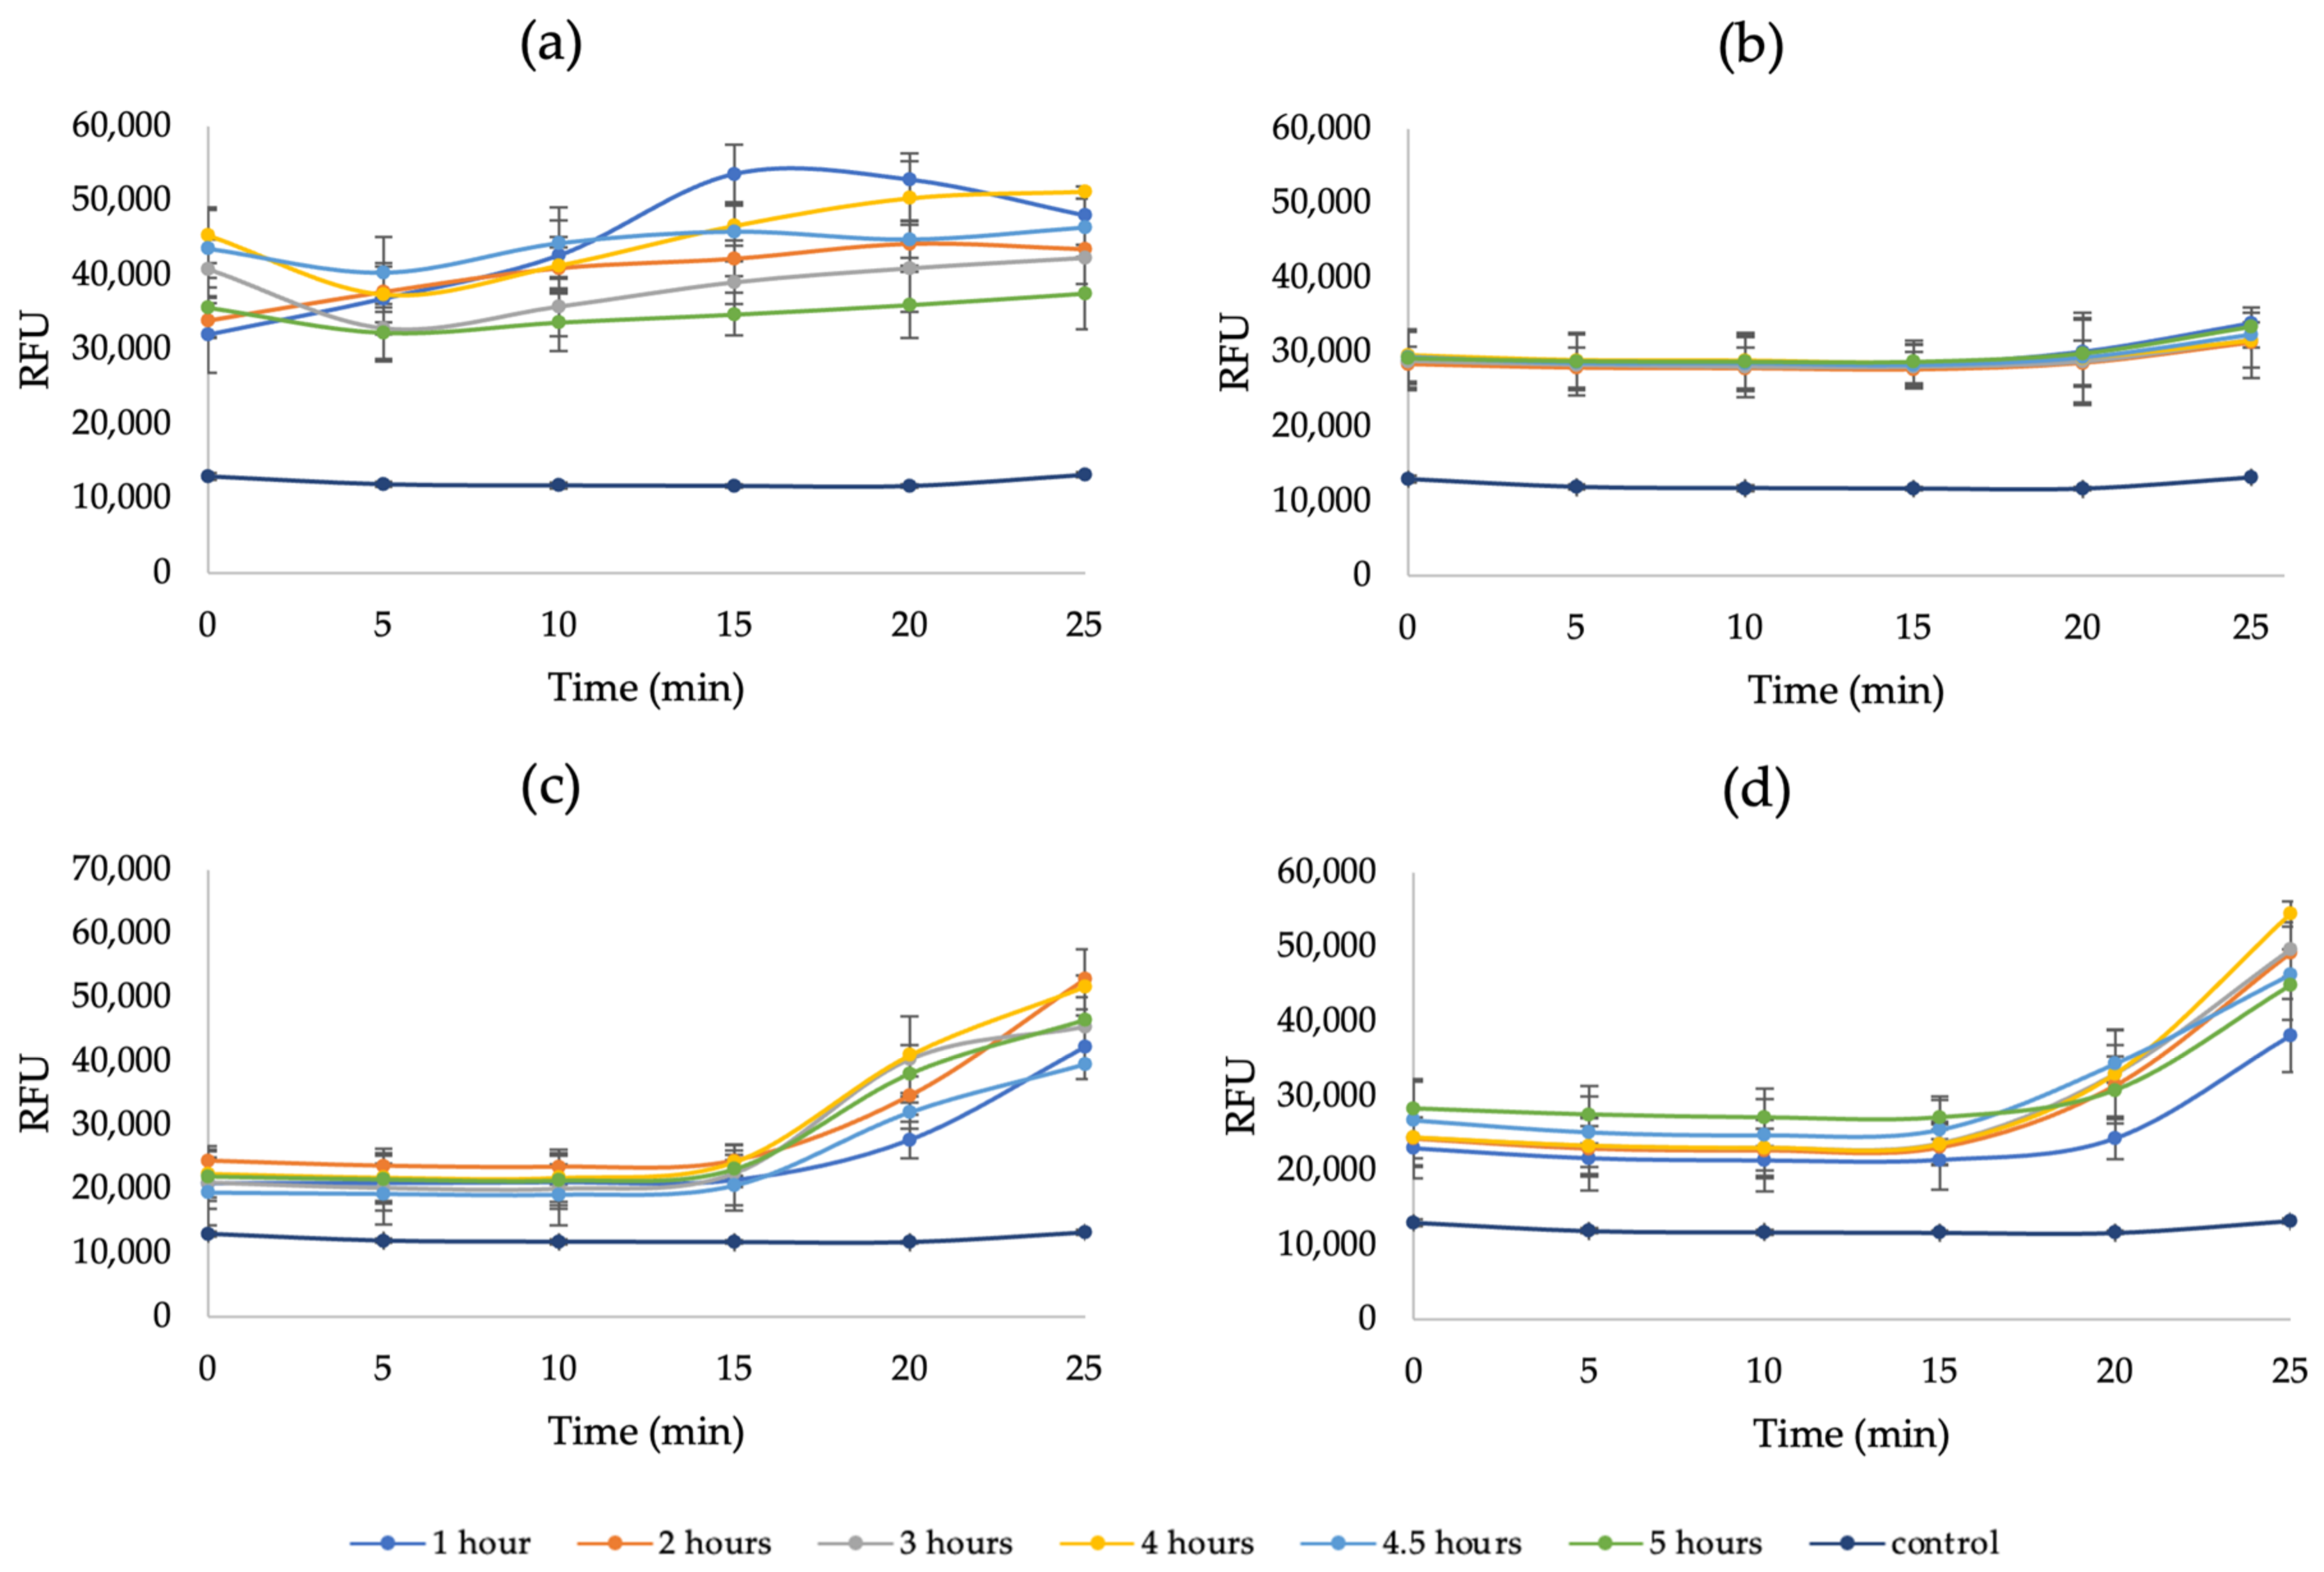
3.5. Production of Nanocellulose from Recycled Paper Sludge (RPS)

First, the hydrolysis of RPS was examined without a pretreatment. As assumed, signals indicating NC were not obtained, indicating that without a pretreatment, NC is not produced due to the lignin that surrounds the cellulosic content of the biomass and prevents access to it. Figure A6 in Appendix A demonstrates the results after a 30-min ozonation pretreatment (Section 2.4) and then hydrolysis of RPS. Unlike Whatman filter paper, the RPS solution gradually darkened during hydrolysis as the biomass was broken down. In addition, as only partial lignin removal was necessary, traces of lignin remained in the pretreated RPS. Along with RPS being naturally brown, lignin also imparts a dark color [71,72]. After dilution and centrifugation (Section 2.7), a slightly turbid white supernatant was obtained, indicating NC suspension, similar to samples obtained from the hydrolysis of Whatman filter paper.
An important hypothesis worth mentioning is that the hydrothermal conversion of biomass derivatives under exothermic reactions triggered by dehydrating agents with acidic properties (e.g., H2SO4) may lead to the formation of a carbon nanoparticle (CNP). This process is carried out at atmospheric pressure and exhibits a color change toward yellow, red, or brown [73]. Having fluorescence properties, a CNP may interfere with fluorescence signals of different origins. However, obtaining no color change during Whatman paper hydrolysis, yet similar turbid white solutions from both biomass after centrifugation, serves evidence that the dark color originates from RPS breakdown only. Moreover, obtaining no fluorescence signal when testing these solutions alone, strengthens the belief that NC fluorescent detection requires a fluorescence agent. Consequently, CFW significantly increased the fluorescence signals, detecting NC.
Figure 7 demonstrates the last three data points in the increasing range (15–25 min) of each hydrolysis time and their slope. These specific data points were chosen as they exhibit the most considerable change in the signal. The yellow curve, representing a hydrolysis duration of 4 h, exhibits the largest slope; hence, a 4-h hydrolysis produced the highest NC amount among all other tested durations. To quantify the NC yield of the 4-h sample for its further use as a dye sorbent, the COD test was used; a 10% yield was noted.
When further comparing the results obtained from Whatman filter paper and RPS, the signals’ increase was obtained at the same range (30,000–50,000 RFU). This may indicate similar solution behavior for NC produced from pretreated RPS and a pure source of cellulose (i.e., Whatman filter paper). Although the conditions of the entire procedure were not fully optimized for obtaining maximum NC yield, this initial result constitutes a promising step in the method development process. These results suggest that after a pretreatment (i.e., delignification), RPS demonstrates a similar behavior as a pure cellulosic source, confirming that ozonation exposes the cellulosic content of the biomass.
SEM imaging of the obtained NC is presented in Figure 8. Rod-shaped particles were observed with an average diameter and length of 165 nm and 2431 nm, respectively, suggesting cellulose nanofibrils. Understanding NC’s morphology is essential for its efficient application; Bharimalla et al. (2015) reported that NC with a high diameter to length ratio is suitable for filters and sorbents [74], similar to the application proposed in the current study.

3.6. Zeta Potential Measurements

Figure 9 demonstrates the streaming potential coupling coefficient (dU/dP) of Whatman filter paper and RPS. Both cellulosic sources exhibit a negative streaming potential coupling coefficient; hence, a negative zeta potential. For Whatman filter paper, there is a decrease in dU/dP with increasing pH up to pH = 6, whereas for RPS, there is a decrease in dU/dP with increasing pH up to pH = 4. In other words, RPS exhibits a larger zeta potential as its dU/dP measurements are lower than those of Whatman filter paper. The samples’ isoelectric point (IEP) was estimated by extrapolation of the polynomial fit (dashed lines) of the available data, representing the pH in which the substance’s water solubility is minimal. The IEP of Whatman filter paper is around pH = 3, and for RPS it is around pH = 1. Such extrapolation allows screening of the region of interest about IEPs. Note that at pH = 3, the solution is fully titrated (0.05 M HCl); thus, it is impossible to take measurements at pH < 3. The evolution of the streaming potential coupling coefficient with pH for RPS is comparable with cotton, regenerated cellulose, and lignocellulosic fibers [75]. The contribution of the examined structure of the fiber and the tendency to swell in aqueous solutions is responsible for the differences in their zeta potential.

3.7. Adsorption of Acid Red 131 Dye by Crude NC

Figure 10 demonstrates the decrease in acid red 131 dye’s absorbance over time when it is mixed with crude NC for 30, 45, 60, and 90 min (Section 2.10), which indicates dye adsorption, and the content of dye during the adsorption process, which was calculated using a calibration curve (Figure A7b in Appendix A). After 30 min of constant mixing, 37% (0.037 mg/L) of the dye remained in the solution, meaning that 63% (0.063 mg/L) was adsorbed. The dye’s absorbance signal did not change considerably during the remaining reaction time and reached a plateau after 60 min.

4. Discussion

Calcofluor white fluorescence staining is a suitable method for selective NC detection in-situ. Nevertheless, method optimization is required for the efficient quantification of the produced NC. Short ozonation (30 min; 21 mg ozone/g RPS) allows a sufficient delignification of RPS, facilitating the extraction of NC in the following hydrolysis step, without damaging the obtained phenolic content. A 4-h hydrolysis of both Whatman filter paper and RPS resulted in the highest fluorescence signal increase. A comparison between both cellulosic sources showed that the cellulosic content of RPS could be easily exposed with an appropriate pretreatment. Similar fluorescence signals obtained from both a pretreated RPS and a pure cellulosic source (i.e., Whatman filter paper) strengthen the hypothesis that different sources of cellulose in which the cellulosic content is exposed will potentially require similar reaction conditions for NC production. Nonetheless, further optimization is required for increasing NC yield. Although the removal of acid red 131 dye by crude NC did not reach close to the desired 90%, a significant dye uptake of 63% (0.063 mg/L) was obtained after a short time (30 min). This, along with 10% NC yield, provides a proof of concept for the methods and ideas proposed in the preliminary study. The relatively high zeta potential exhibited by RPS and reflected in its high surface charge can significantly contribute to its remnants’ application as wastewater pollutants sorbent, along with the produced NC, as well as its dissolution ability to produce higher NC concentrations per volume unit. Further examination of NC’s size repeatability is required, or the development of a prediction method to the desired size—a fundamental capability for the efficient adjustment of obtained NC in potential applications. Compared to standard RPS disposal methods, its use for NC production holds a promising opportunity of converting waste into a resource, and thus, highly contributing to the development of cellulose bio-based nanomaterials for water treatment applications, as well as to sustainability and circular economy in the paper industry. With optimization and adjustment, the proposed methods can also be implemented to other industrial cellulose-rich wastes.

Author Contributions

Conceptualization, methodology, and supervision, R.P., and H.M.; formal analysis, data curation, and draft preparation, A.M.; review, editing, and visualization, A.M., R.P., H.M., and V.K.V. All authors have read and agreed to the published version of the manuscript.

Funding

This research was funded by Israel Science Foundation (ISF) grant number 1685/18.

Institutional Review Board Statement

Not applicable.

Informed Consent Statement

Not applicable.

Data Availability Statement

Data are available from co-authors upon reasonable request.

Acknowledgments

The authors thank Hadera Paper, Israel, for providing the RPS materials for this work.

Conflicts of Interest

The authors declare no conflict of interest.

Appendix A. Additional Figures

Figure A1. The absorbance of (a) NC and (b) sulfuric acid in 400–700 nm.
Applsci 12 03077 g0a1
Figure A2. Kinetic fluorescence control test; varying concentrations of sulfuric acid, 0.4% KOH (pH = 13), 0.1% CFW.
Applsci 12 03077 g0a2
Figure A3. Tannic acid calibration curve.
Applsci 12 03077 g0a3
Figure A4. The RFU of Whatman filter paper after 0–3 h of 64% sulfuric acid hydrolysis at 45 °C (a) before centrifugation, (b) after one centrifugation (6000 rpm, 15 min), and (c) after two centrifugations (6000 rpm, 15 min); 0.4% KOH (pH = 13), 0.1% CFW.
Applsci 12 03077 g0a4
Figure A5. Fluorescence calibration curves of NC treated with CFW stain.
Applsci 12 03077 g0a5
Figure A6. The RFU of a 3-h pretreated RPS hydrolysis: (a) before centrifugation, (b) after 1 centrifugation, (c) after 2 and (d) 3 centrifugations (6000 rpm, 15 min); 0.4% KOH (pH = 13), 0.1% CFW.
Applsci 12 03077 g0a6
Figure A7. UV–vis spectra (a) and a calibration curve (b) of acid red 131 dye.
Applsci 12 03077 g0a7

References

  1. Bajpai, P. Generation of waste in pulp and paper mills. In Management of Pulp and Paper Mill Waste; Springer: Cham, Switzerland, 2015; pp. 9–17. [Google Scholar]
  2. Lekha, P.; Andrew, J.E.; Gibril, M.; Sithole, B. Pulp and Paper mill sludge: A potential resource for producing high-value products. J. Tech. Assoc. Pulp Pap. Ind. S. Afr. 2017, 1, 16. [Google Scholar]
  3. Peretz, R.; Mamane, H.; Wissotzky, E.; Sterenzon, E.; Gerchman, Y. Making cardboard and paper recycling more sustainable: Recycled paper sludge for energy production and water-treatment applications. Waste Biomass Valoriz. 2021, 12, 1599–1608. [Google Scholar] [CrossRef]
  4. Nair, A.S.; Al-Battashi, H.; Al-Akzawi, A.; Annamalai, N.; Gujarathi, A.; Al-Bahry, S.; Dhillon, G.S.; Sivakumar, N. Waste office paper: A potential feedstock for cellulase production by a novel strain Bacillus velezensis ASN1. Waste Manag. 2018, 79, 491–500. [Google Scholar] [CrossRef] [PubMed]
  5. Peretz, R.; Sterenzon, E.; Gerchman, Y.; Vadivel, V.K.; Luxbacher, T.; Mamane, H. Nanocellulose production from recycled paper mill sludge using ozonation pretreatment followed by recyclable maleic acid hydrolysis. Carbohydr. Polym. 2019, 216, 343–351. [Google Scholar] [CrossRef]
  6. KSH Solutions Inc. Pulp and Paper Mill Sludge Disposal Methods; KSH Solutions Inc.: North Charleston, SC, USA, 2013; Available online: https://www.ksh.ca/wp-content/uploads/2015/10/EN_Pulp-and-Paper-Mill-Sludge-Disposal-Methods_20jan2015.pdf (accessed on 19 December 2021).
  7. Faubert, P.; Barnabé, S.; Bouchard, S.; Côté, R.; Villeneuve, C. Pulp and paper mill sludge management practices: What are the challenges to assess the impacts on greenhouse gas emissions? Resour. Conserv. Recycl. 2016, 108, 107–133. [Google Scholar] [CrossRef] [Green Version]
  8. Zhang, C.; Xu, T.; Feng, H.; Chen, S. Greenhouse gas emissions from landfills: A review and bibliometric analysis. Sustainability 2019, 11, 2282. [Google Scholar] [CrossRef] [Green Version]
  9. Trache, D.; Hussin, M.H.; Haafiz, M.M.; Thakur, V.K. Recent progress in cellulose nanocrystals: Sources and production. Nanoscale 2017, 9, 1763–1786. [Google Scholar] [CrossRef] [Green Version]
  10. Thakur, V.K. Nanocellulose Polymer Nanocomposites: Fundamentals and Applications; John Wiley & Sons: Hoboken, NJ, USA, 2014. [Google Scholar]
  11. Kalia, S.; Kaith, B.S.; Kaur, I. Cellulose Fibers: Bio-and Nano-Polymer Composites: Green Chemistry and Technology; Springer Science & Business Media: Berlin/Heidelberg, Germany, 2011. [Google Scholar]
  12. Dufresne, A. Nanocellulose: From Nature to High Performance Tailored Materials; Walter de Gruyter GmbH & Co. KG: Berlin, Germany, 2012. [Google Scholar]
  13. Eichhorn, S.J. Cellulose nanowhiskers: Promising materials for advanced applications. Soft Matter 2011, 7, 303–315. [Google Scholar] [CrossRef]
  14. Kumari, A.; Singla, R.; Guliani, A.; Walia, S.; Acharya, A.; Yadav, S.K. Nanoscale materials in targeted drug delivery. In Nanoscale Materials in Targeted Drug Delivery, Theragnosis and Tissue Regeneration; Springer: Singapore, 2016; pp. 1–19. [Google Scholar]
  15. Jonoobi, M.; Oladi, R.; Davoudpour, Y.; Oksman, K.; Dufresne, A.; Hamzeh, Y.; Davoodi, R. Different preparation methods and properties of nanostructured cellulose from various natural resources and residues: A review. Cellulose 2015, 22, 935–969. [Google Scholar] [CrossRef]
  16. Habibi, Y. Key advances in the chemical modification of nanocelluloses. Chem. Soc. Rev. 2014, 43, 1519–1542. [Google Scholar] [CrossRef]
  17. Abitbol, T.; Rivkin, A.; Cao, Y.; Nevo, Y.; Abraham, E.; Ben-Shalom, T.; Lapidot, S.; Shoseyov, O. Nanocellulose, a tiny fiber with huge applications. Curr. Opin. Biotechnol. 2016, 39, 76–88. [Google Scholar] [CrossRef]
  18. Moon, R.J.; Martini, A.; Nairn, J.; Simonsen, J.; Youngblood, J. Cellulose nanomaterials review: Structure, properties, and nanocomposites. Chem. Soc. Rev. 2011, 40, 3941–3994. [Google Scholar] [CrossRef]
  19. Dias, O.A.T.; Konar, S.; Leão, A.L.; Yang, W.; Tjong, J.; Sain, M. Current state of applications of nanocellulose in flexible energy and electronic devices. Front. Chem. 2020, 8, 420. [Google Scholar] [CrossRef]
  20. Lin, N.; Huang, J.; Dufresne, A. Preparation, properties, and applications of polysaccharide nanocrystals in advanced functional nanomaterials: A review. Nanoscale 2012, 4, 3274–3294. [Google Scholar] [CrossRef]
  21. Vartiainen, J.; Pöhler, T.; Sirola, K.; Pylkkänen, L.; Alenius, H.; Hokkinen, J.; Tapper, U.; Lahtinen, P.; Kapanen, A.; Putkisto, K.; et al. Health and environmental safety aspects of friction grinding and spray drying of microfibrillated cellulose. Cellulose 2011, 18, 775–786. [Google Scholar] [CrossRef]
  22. Habibi, Y.; Lucia, L.A.; Rojas, O.J. Cellulose nanocrystals: Chemistry, self-assembly, and applications. Chem. Rev. 2010, 110, 3479–3500. [Google Scholar] [CrossRef]
  23. Sacui, I.A.; Nieuwendaal, R.C.; Burnett, D.J.; Stranick, S.J.; Jorfi, M.; Weder, C.; Foster, E.J.; Olsson, R.T.; Gilman, J.W. Comparison of the properties of cellulose nanocrystals and cellulose nanofibrils isolated from bacteria, tunicate, and wood processed using acid, enzymatic, mechanical, and oxidative methods. ACS Appl. Mater. Interfaces 2014, 6, 6127–6138. [Google Scholar] [CrossRef]
  24. Fang, W.; Arola, S.; Malho, J.M.; Kontturi, E.; Linder, M.B. Laaksonen, P. Noncovalent dispersion and functionalization of cellulose nanocrystals with proteins and polysaccharides. Biomacromolecules 2016, 17, 1458–1465. [Google Scholar] [CrossRef]
  25. Gaspar, D.; Fernandes, S.N.; De Oliveira, A.G.; Fernandes, J.G.; Grey, P.; Pontes, R.V.; Pereira, L.; Martins, R.; Godinho, M.H.; Fortunato, E. Nanocrystalline cellulose applied simultaneously as the gate dielectric and the substrate in flexible field effect transistors. Nanotechnology 2014, 25, 094008. [Google Scholar] [CrossRef] [Green Version]
  26. Hoeng, F.; Denneulin, A.; Bras, J. Use of nanocellulose in printed electronics: A review. Nanoscale 2016, 8, 13131–13154. [Google Scholar] [CrossRef]
  27. Kargarzadeh, H.; Mariano, M.; Huang, J.; Lin, N.; Ahmad, I.; Dufresne, A.; Thomas, S. Recent developments on nanocellulose reinforced polymer nanocomposites: A review. Polymer 2017, 132, 368–393. [Google Scholar] [CrossRef]
  28. Glasser, W.G.; Atalla, R.H.; Blackwell, J.; Malcolm Brown, R.; Burchard, W.; French, A.D.; Klemm, D.O.; Nishiyama, Y. About the structure of cellulose: Debating the Lindman hypothesis. Cellulose 2012, 19, 589–598. [Google Scholar] [CrossRef]
  29. Lindman, B.; Karlström, G.; Stigsson, L. On the mechanism of dissolution of cellulose. J. Mol. Liq. 2010, 156, 76–81. [Google Scholar] [CrossRef]
  30. Medronho, B.; Romano, A.; Miguel, M.G.; Stigsson, L.; Lindman, B. Rationalizing cellulose (in) solubility: Reviewing basic physicochemical aspects and role of hydrophobic interactions. Cellulose 2012, 19, 581–587. [Google Scholar] [CrossRef]
  31. Petrucci, R.H. General Chemistry: Principles and Modern Applications, 6th ed.; Pearson: Prentice Hall, NJ, USA, 1993; pp. 785–808. [Google Scholar]
  32. Szymańska-Chargot, M.; Chylińska, M.; Gdula, K.; Kozioł, A.; Zdunek, A. Isolation and characterization of cellulose from different fruit and vegetable pomaces. Polymers 2017, 9, 495. [Google Scholar] [CrossRef]
  33. Rosen, Y.; Mamane, H.; Gerchman, Y. Short ozonation of lignocellulosic waste as energetically favorable pretreatment. Bioenergy Res. 2019, 12, 292–301. [Google Scholar] [CrossRef]
  34. Kumar, A.K.; Sharma, S. Recent updates on different methods of pretreatment of lignocellulosic feedstocks: A review. Bioresour. Bioprocess. 2017, 4, 7. [Google Scholar] [CrossRef] [Green Version]
  35. Travaini, R.; Martín-Juárez, J.; Lorenzo-Hernando, A.; Bolado-Rodríguez, S. Ozonolysis: An advantageous pretreatment for lignocellulosic biomass revisited. Bioresour. Technol. 2016, 199, 2–12. [Google Scholar] [CrossRef] [Green Version]
  36. Contreras Iglesias, S. Degradation and Biodegradability Enhancement of Nitrobenzene and 2,4-Dichlorophenol by Means of Advanced Oxidation Processes based on Ozone. Ph.D. Thesis, University of Barcelona, Barcelona, Spain, November 2002. Available online: https://www.tesisenred.net/bitstream/handle/10803/1520/TOL167A.pdf?sequence=1 (accessed on 6 February 2022).
  37. Tian, D.; Chandra, R.P.; Lee, J.S.; Lu, C.; Saddler, J.N. A comparison of various lignin-extraction methods to enhance the accessibility and ease of enzymatic hydrolysis of the cellulosic component of steam-pretreated poplar. Biotechnol. Biofuels 2017, 10, 157. [Google Scholar] [CrossRef]
  38. Hemmati, F.; Jafari, S.M.; Taheri, R.A. Optimization of homogenization-sonication technique for the production of cellulose nanocrystals from cotton linter. Int. J. Biol. Macromol. 2019, 137, 374–381. [Google Scholar] [CrossRef] [PubMed]
  39. Lu, P.; Hsieh, Y.L. Preparation and characterization of cellulose nanocrystals from rice straw. Carbohydr. Polym. 2012, 87, 564–573. [Google Scholar] [CrossRef] [PubMed]
  40. Wang, R.; Chen, L.; Zhu, J.Y.; Yang, R. Tailored and integrated production of carboxylated cellulose nanocrystals (CNC) with nanofibrils (CNF) through maleic acid hydrolysis. ChemNanoMat 2017, 3, 328–335. [Google Scholar] [CrossRef]
  41. Peretz, R.; Gerchman, Y.; Mamane, H. Ozonation of tannic acid to model biomass pretreatment for bioethanol production. Bioresour. Technol. 2017, 241, 1060–1066. [Google Scholar] [CrossRef] [PubMed]
  42. Ng, H.M.; Sin, L.T.; Tee, T.T.; Bee, S.T.; Hui, D.; Low, C.Y.; Rahmat, A.R. Extraction of cellulose nanocrystals from plant sources for application as reinforcing agent in polymers. Compos. Part B Eng. 2015, 75, 176–200. [Google Scholar] [CrossRef]
  43. Foster, E.J.; Moon, R.J.; Agarwal, U.P.; Bortner, M.J.; Bras, J.; Camarero-Espinosa, S.; Chan, K.J.; Clift, M.J.; Cranston, E.D.; Eichhorn, S.J.; et al. Current characterization methods for cellulose nanomaterials. Chem. Soc. Rev. 2018, 47, 2609–2679. [Google Scholar] [CrossRef] [Green Version]
  44. Bondeson, D.; Mathew, A.; Oksman, K. Optimization of the isolation of nanocrystals from microcrystalline cellulose by acid hydrolysis. Cellulose 2006, 13, 171–180. [Google Scholar] [CrossRef]
  45. Liu, C.; Li, B.; Du, H.; Lv, D.; Zhang, Y.; Yu, G.; Mu, X.; Peng, H. Properties of nanocellulose isolated from corncob residue using sulfuric acid, formic acid, oxidative and mechanical methods. Carbohydr. Polym. 2016, 151, 716–724. [Google Scholar] [CrossRef]
  46. Abitbol, T.; Kloser, E.; Gray, D.G. Estimation of the surface sulfur content of cellulose nanocrystals prepared by sulfuric acid hydrolysis. Cellulose 2013, 20, 785–794. [Google Scholar] [CrossRef]
  47. Bruice, P.Y. Organic Chemistry, 8th ed.; Pearson: London, UK, 2016; pp. 259–260, 340, 702–704. [Google Scholar]
  48. Wang, Q.Q.; Zhu, J.Y.; Reiner, R.S.; Verrill, S.P.; Baxa, U.; McNeil, S.E. Approaching zero cellulose loss in cellulose nanocrystal (CNC) production: Recovery and characterization of cellulosic solid residues (CSR) and CNC. Cellulose 2012, 19, 2033–2047. [Google Scholar] [CrossRef]
  49. Bian, H.; Chen, L.; Dai, H.; Zhu, J.Y. Integrated production of lignin containing cellulose nanocrystals (LCNC) and nanofibrils (LCNF) using an easily recyclable di-carboxylic acid. Carbohydr. Polym. 2017, 167, 167–176. [Google Scholar] [CrossRef]
  50. Herth, W. Calcofluor white and Congo red inhibit chitin microfibril assembly of Poterioochromonas: Evidence for a gap between polymerization and microfibril formation. J. Cell Biol. 1980, 87, 442–450. [Google Scholar] [CrossRef]
  51. Maddar, F.M.; Perry, D.; Brooks, R.; Page, A.; Unwin, P.R. Nanoscale surface charge visualization of human hair. Anal. Chem. 2019, 91, 4632–4639. [Google Scholar] [CrossRef]
  52. Harrington, B.J.; Raper, K.B. Use of a fluorescent brightener to demonstrate cellulose in the cellular slime molds. Appl. Microbiol. 1968, 16, 106–113. [Google Scholar] [CrossRef]
  53. Herth, W.; Schnepf, E. The fluorochrome, calcofluor white, binds oriented to structural polysaccharide fibrils. Protoplasma 1980, 105, 129–133. [Google Scholar] [CrossRef]
  54. Harrington, B.J.; Hageage, G.J., Jr. Calcofluor white: A review of its uses and applications in clinical mycology and parasitology. Lab. Med. 2003, 34, 361–367. [Google Scholar] [CrossRef]
  55. Harrington, B.J.; Hageage, G.J., Jr. Calcofluor white: Tips for improving its use. Clin. Microbiol. Newsl. 1991, 13, 3–5. [Google Scholar] [CrossRef]
  56. Peretz, R.; Mamane, H.; Sterenzon, E.; Gerchman, Y. Rapid quantification of cellulose nanocrystals by Calcofluor White fluorescence staining. Cellulose 2019, 26, 971–977. [Google Scholar] [CrossRef]
  57. Alves, L.; Medronho, B.; Antunes, F.E.; Fernández-García, M.P.; Ventura, J.; Araújo, J.P.; Romano, A.; Lindman, B. Unusual extraction and characterization of nanocrystalline cellulose from cellulose derivatives. J. Mol. Liq. 2015, 210, 106–112. [Google Scholar] [CrossRef]
  58. Folin, O.; Ciocalteu, V. On tyrosine and tryptophane determinations in proteins. J. Biol. Chem 1927, 73, 627–650. [Google Scholar] [CrossRef]
  59. Margraf, T.; Karnopp, A.R.; Rosso, N.D.; Granato, D. Comparison between Folin-Ciocalteu and Prussian Blue assays to estimate the total phenolic content of juices and teas using 96-well microplates. J. Food Sci. 2015, 80, C2397–C2403. [Google Scholar] [CrossRef]
  60. Singleton, V.L.; Orthofer, R.; Lamuela-Raventós, R.M. Analysis of total phenols and other oxidation substrates and antioxidants by means of folin-ciocalteu reagent. In Methods in Enzymology; Academic Press: Cambridge, MA, USA, 1999; Volume 299, pp. 152–178. [Google Scholar]
  61. Kamboj, A.; Gupta, R.; Rana, A.; Kaur, R. Application and analysis of the Folin Ciocalteu method for the determination of the total phenolic content from extracts of Terminalia bellerica. Eur. J. Biomed. Pharm. Sci. 2015, 2, 201–215. [Google Scholar]
  62. Schofield, P.; Mbugua, D.M.; Pell, A.N. Analysis of condensed tannins: A review. Anim. Feed Sci. Technol. 2001, 91, 21–40. [Google Scholar] [CrossRef]
  63. Box, J.D. Investigation of the Folin-Ciocalteu phenol reagent for the determination of polyphenolic substances in natural waters. Water Res. 1983, 17, 511–525. [Google Scholar] [CrossRef]
  64. Spectranomics Protocols: Total Phenol and Tannin Determination, Carnegie Institution for Science 2011; Modified from Ainsworth and Gillespie (2007) for Phenols, Toth and Pavia (2001) and Makaar (2007) for Tannins. Zenodo.org. Available online: https://zenodo.org/record/3247631/files/CSP_protocol_Phenols_Tannins_Analysis.pdf?download=1 (accessed on 19 December 2021).
  65. Stana-Kleinschek, K.; Ribitsch, V. Electrokinetic properties of processed cellulose fibers. Colloids Surf. A Physicochem. Eng. Asp. 1998, 140, 127–138. [Google Scholar] [CrossRef]
  66. Grancaric, A.M.; Tarbuk, A.; Pusic, T. Electrokinetic properties of textile fabrics. Coloration Technol. 2005, 121, 221–227. [Google Scholar] [CrossRef]
  67. Adamczyk, Z.; Nattich, M.; Zaucha, M. Electrokinetics of particle covered surfaces. Curr. Opin. Colloid Interface Sci. 2010, 15, 175–183. [Google Scholar] [CrossRef]
  68. Bukšek, H.; Luxbacher, T.; Petrinić, I. Zeta potential determination of polymeric materials using two differently designed measuring cells of an electrokinetic analyzer. Acta Chim. Slov. 2010, 57, 700–706. [Google Scholar]
  69. Daskal, S.; Ayalon, O.; Shechter, M. The state of municipal solid waste management in Israel. Waste Manag. Res. 2018, 36, 527–534. [Google Scholar] [CrossRef]
  70. Oz, Y.B.; Mamane, H.; Menashe, O.; Cohen-Yaniv, V.; Kumar, R.; Kruh, L.I.; Kurzbaum, E. Treatment of olive mill wastewater using ozonation followed by an encapsulated acclimated biomass. J. Environ. Chem. Eng. 2018, 6, 5014–5023. [Google Scholar]
  71. Horwath, W. Carbon cycling and formation of soil organic matter. In Soil Microbiology, Ecology, and Biochemistry; Academic Press: Cambridge, MA, USA, 2007; pp. 303–339. [Google Scholar]
  72. Zhang, Y.; Naebe, M. Lignin: A review on structure, properties, and applications as a light-colored UV absorber. ACS Sustain. Chem. Eng. 2021, 9, 1427–1444. [Google Scholar] [CrossRef]
  73. Reverberi, A.P.; Vocciante, M.; Bruzzone, A.G.; Fabiano, B. A Critical Analysis on Green and Low-Temperature Methods for the Production of Carbon Nanoparticles. Chem. Eng. Trans. 2021, 86, 805–810. [Google Scholar]
  74. Bharimalla, A.K.; Deshmukh, S.P.; Patil, P.G.; Vigneshwaran, N. Energy efficient manufacturing of nanocellulose by chemo-and bio-mechanical processes: A review. World J. Nano Sci. Eng. 2015, 5, 204. [Google Scholar] [CrossRef] [Green Version]
  75. Luxbacher, T. Electrokinetic properties of natural fibres. In Handbook of Natural Fibres; Woodhead Publishing: Sawston, UK, 2020; pp. 323–353. [Google Scholar]
Figure 1. Cellulose hydrolysis by sulfuric acid.
Applsci 12 03077 g001
Figure 2. A semi-batch ozonation reactor: (1) oxygen gas and flow rate gauge, (2) air drier and humidity indicator, (3) O3 gas generator, (4) O3 gas input, (5) O3 gas diffuser, (6) magnetic stirrer, (7) sampling port, (8) solution input, (9) O3 gas output, (10) dryer for O3-saturated air.
Applsci 12 03077 g002
Figure 3. NC absorbance at λ = 400 nm in varying sulfuric acid concentrations.
Applsci 12 03077 g003
Figure 4. (a) RFU of 0.5% NC in varying sulfuric acid concentrations and (b) RFU of varying NC concentrations in 3% sulfuric acid. Each curve represents a different NC and sulfuric acid mixture, with a fixed 0.4% KOH (pH = 13) and 0.1% CFW.
Applsci 12 03077 g004
Figure 5. The RFU of Whatman filter paper after 3–5 h of 64% sulfuric acid hydrolysis at 45 °C (a) before centrifugation, (b) after one centrifugation (6000 rpm, 15 min), and (c) after two centrifugations (6000 rpm, 15 min); 0.4% KOH (pH = 13), 0.1% CFW.
Applsci 12 03077 g005
Figure 6. Total phenol content released from RPS during its ozonation pretreatment.
Applsci 12 03077 g006
Figure 7. The RFU signal increase rate for 1–5 h hydrolysis between 15–25 min of testing.
Applsci 12 03077 g007
Figure 8. SEM imaging of the obtained NC particles (size bar is 20 μm).
Applsci 12 03077 g008
Figure 9. Streaming potential coupling coefficient (dU/dP) of Whatman filter paper and RPS. Dashed lines represent an extrapolation simulating the isoelectric point (IEP).
Applsci 12 03077 g009
Figure 10. The absorbance signal of acid red 131 dye over time when it is mixed with crude NC for 30, 45, 60, and 90 min (a) and acid red 131 dye’s content over time during its adsorption by crude NC (b). Initial concentrations: 0.1 ppm dye and 1 ppm crude NC.
Applsci 12 03077 g010
Table 1. COD test results of 30-, 120- and 180-min hydrolysis of Whatman filter paper.
Hydrolysis (min)COD (mg/L)NC (mg/L)Yield
304553820.76%
1204944170.83%
1805784880.98%
Publisher’s Note: MDPI stays neutral with regard to jurisdictional claims in published maps and institutional affiliations.

