Article

Study on Deformation Characteristics of Low-Highway Subgrade under Traffic Load

1
Shandong Express Group Co., Ltd., Jinan 250061, China
2
School of Qilu Transportation, Shandong University, 12550, East Second Ring Road, Jinan 250002, China
3
School of Civil Engineering, Shandong University, 17922, Jingshi Road, Jinan 250061, China
*
Authors to whom correspondence should be addressed.
Appl. Sci. 2022, 12(7), 3406; https://doi.org/10.3390/app12073406
Submission received: 19 February 2022 / Revised: 22 March 2022 / Accepted: 25 March 2022 / Published: 27 March 2022
(This article belongs to the Section Civil Engineering)

Abstract

:
Highway subgrade bears millions of traffic loads over the years, and its strength, stiffness, and long-term stability gradually decline. In this paper, dynamic triaxial tests were carried out to study the time evolution and spatial distribution of strain and pore pressure of highway-subgrade soil under the action of traffic load. The influence of traffic load on subgrade deformation was analyzed. Furthermore, a numerical-calculation model of the subgrade was established. The deformation characteristics of subgrade under driving load were analyzed. The main conclusions can be drawn as follows: (1) With the increase in loading times, the cumulative strain and pore pressure can be roughly divided into three stages: rapid-growth stage, slow-growth stage, and equilibrium stage. (2) The influence of traffic load on the cumulative strain and pore-water pressure of subgrade soil decreases rapidly with the increase in depth. (3) The amplitude of traffic load has a tremendous influence on the strain and pore pressure of subgrade soil, especially for shallow subgrade. (4) As the distance from the subgrade surface increases, the maximum deformation appears at the edge of the subgrade.

1. Introduction

Expressways have become the central infrastructure for interregional transportation, due to their advantages such as fast speed, high efficiency, and large carrying capacity [1,2,3]. As the main force-bearing part of the road, the subgrade bears millions of traffic loads over many years [4]. Its strength, rigidity, and long-term stability will directly affect the road’s service performance and service life. Under the action of high-speed, heavy-duty, and large-flow traffic cyclic loads, the subgrade-material particles often slide and squeeze to cause the particles to rearrange and move [5,6]. Under long-term traffic load, the subgrade-filler skeleton is not stable, which leads to the gradual deterioration of the service performance of the subgrade structural layer, resulting in road diseases such as excessive settlement, uneven settlement, and road-surface cracking [6,7,8].
With the innovation of test apparatus, engineers have developed dynamic modules based on static triaxial tests. At present, the dynamic triaxial test has become one of the main methods to research the dynamic deformation characteristics of the soil [9,10]. Experts and scholars have studied the dynamic characteristics of soil structures to meet the design requirements of actual complex projects. In the early stage, the experimental study of dynamic characteristics is mainly based on seismic load. The test has the characteristics of high confining pressure, enormous strain, and a small number of cycles [11,12,13]. However, subgrade fillings are mainly subjected to traffic loads, and their stress state is characterized by low confining pressure and low dynamic-stress amplitude [14]. The strain is mainly elastic response, and under the action of large long-term cycles of load, it is manifested as plastic-strain accumulation [15,16]. Therefore, it is necessary to carry out many cyclic triaxial tests to deeply study the deformation behavior of subgrade fillings under long-term traffic loads [17,18]. On the other hand, many experts and scholars have conducted much research on the dynamic-response characteristics of subgrade under the action of traffic load by using numerical calculation methods based on actual engineering [19,20,21]. However, because the attenuation rule of subgrade-filling modulus under the action of traffic load is not clear, the traditional numerical calculation can only qualitatively analyze the rule of subgrade deformation under traffic load.
Therefore, this paper carried out a dynamic triaxial test to study the time-evolution rule and spatial-distribution rule of the accumulated strain and pore-pressure ratio of subgrade soil under the action of traffic load. The numerical-calculation model of subgrade settlement under traffic load was established, and the deformation characteristics of subgrade under dynamic cyclic load were studied.

2. Dynamic Triaxial Test of Subgrade Soil under Traffic Load

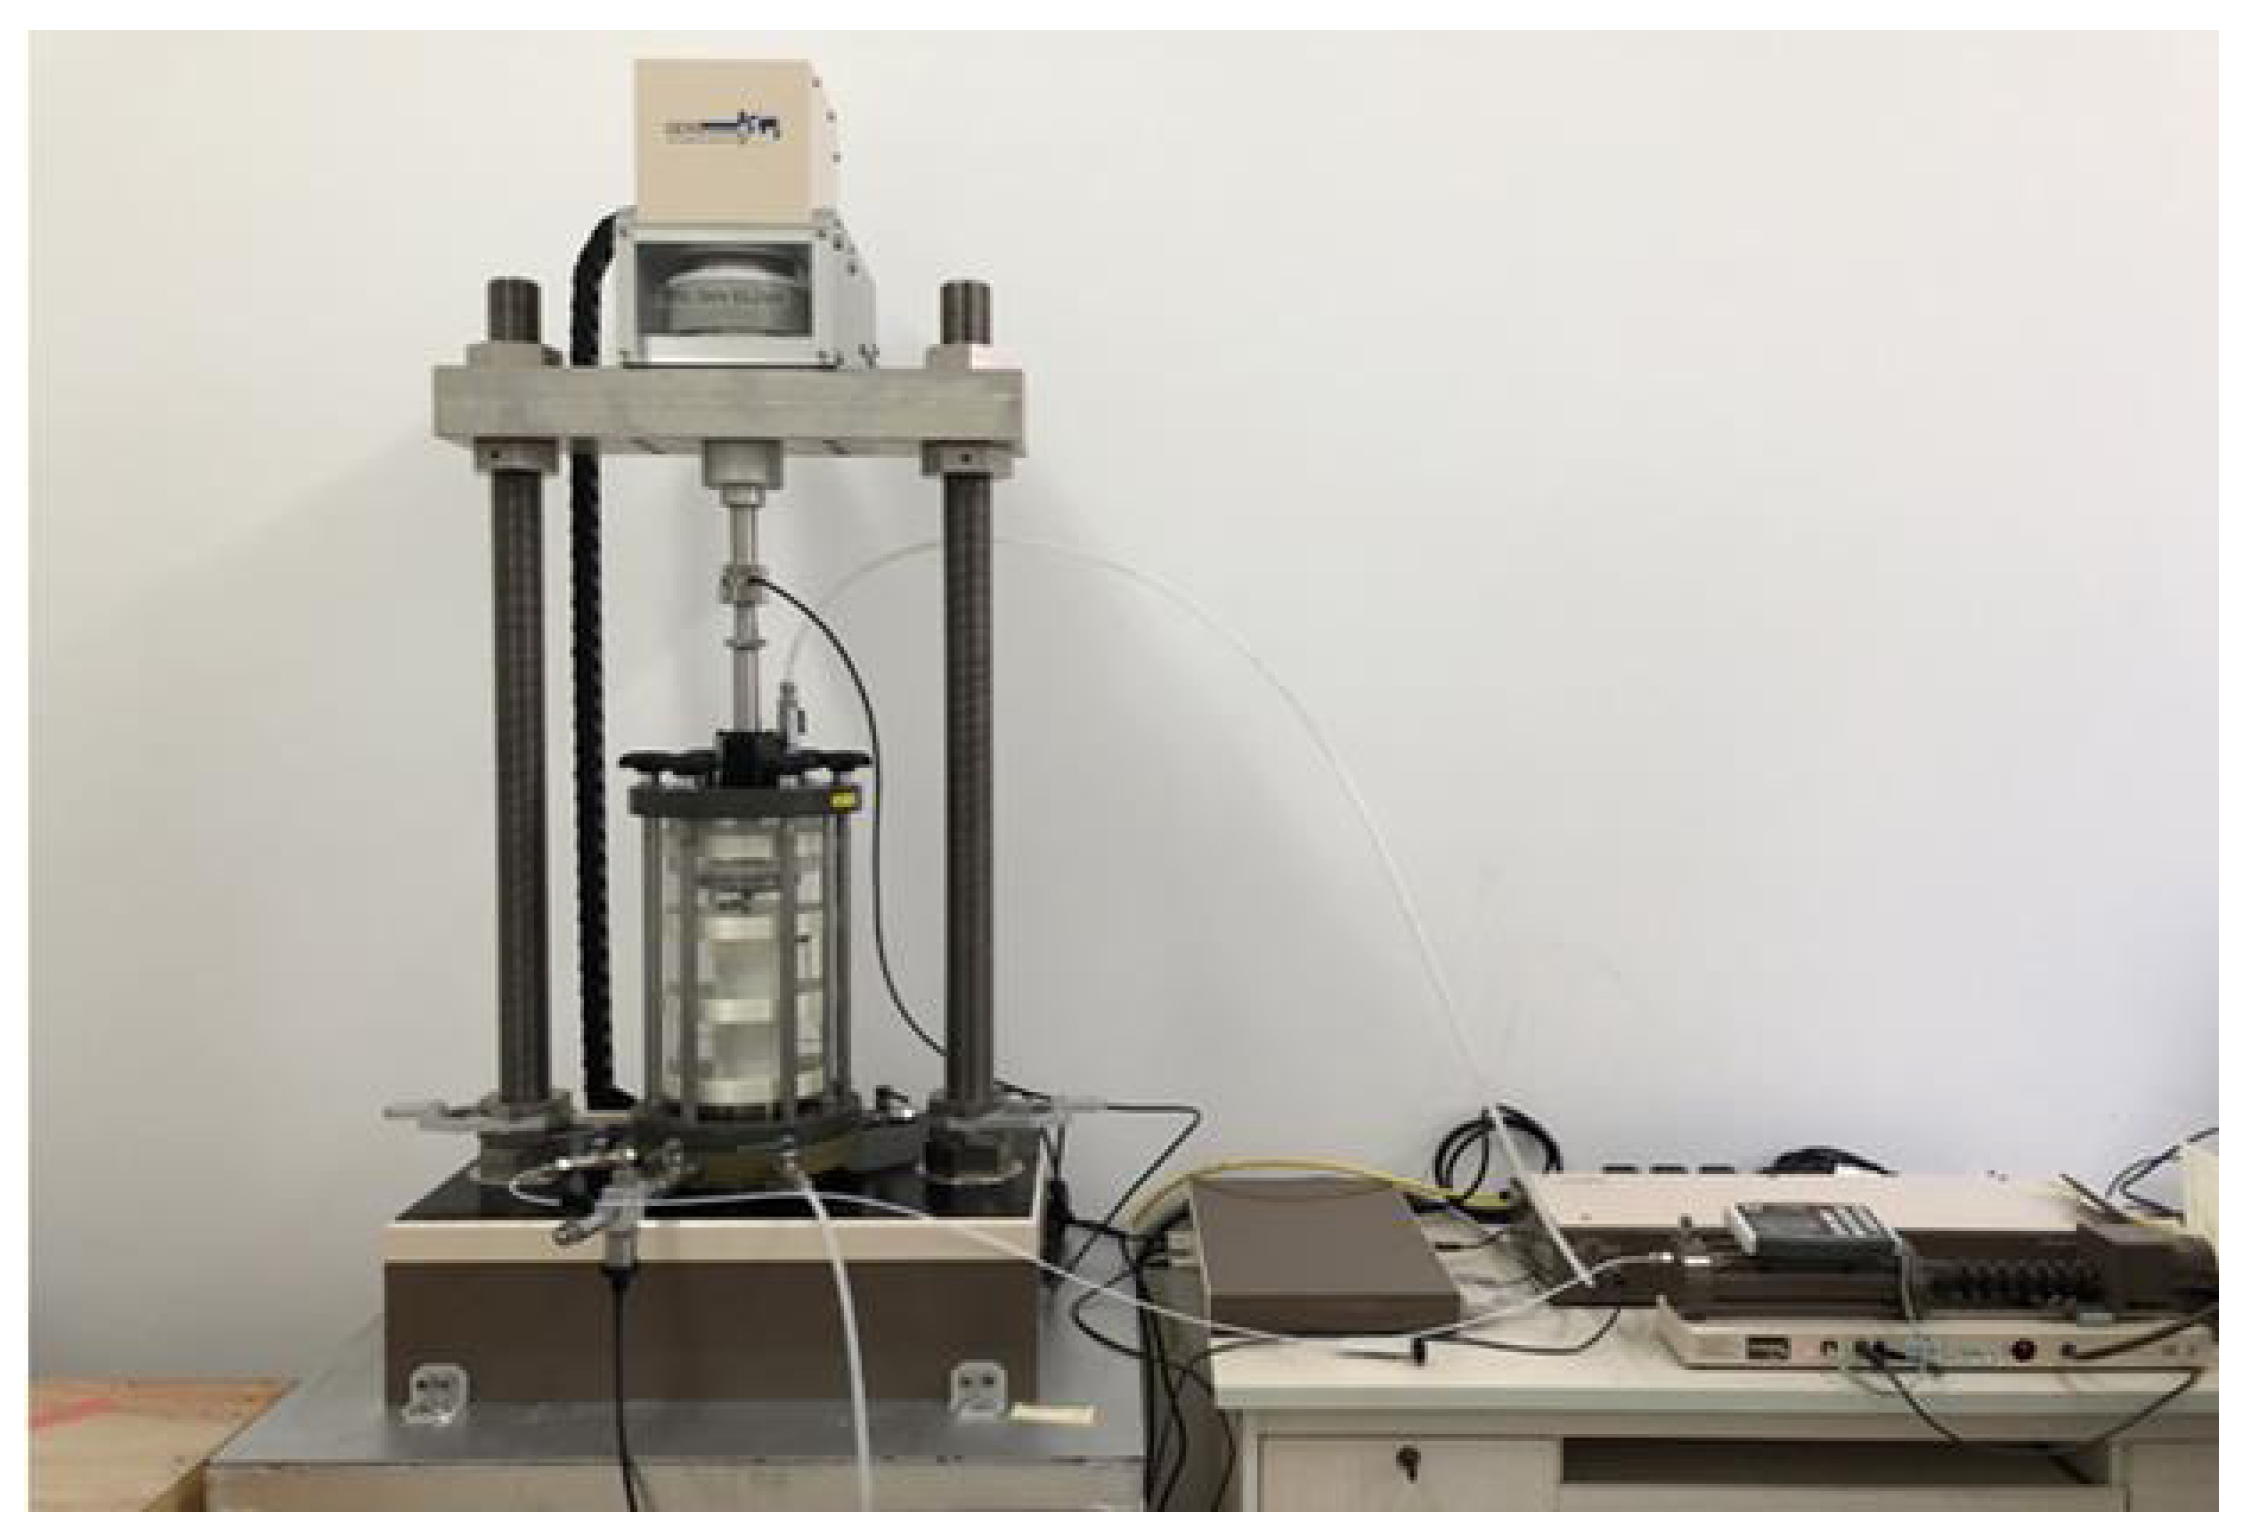
2.1. Test Equipment and Materials

The Eldyn dynamic triaxial apparatus produced by GDS was used as the test apparatus (Figure 1). The equipment’s data-acquisition system can collect pore-water pressure, strain, axial force, and back-pressure volume [9]. Representative subgrade-soil samples were selected for laboratory tests. The soil used for the test was taken from the extension project of the Zibo West to the Laiwu section of the Bin-Lai Expressway. The particle gradation curve of the test-soil sample is shown in Figure 2. The particle size distribution curve of the test-soil sample changed slowly, with the non-uniformity coefficient CU = 20.0 and the curvature coefficient CC = 3.20. The content of particles larger than 0.075 mm is less than 10%, and that of particles smaller than 0.005 mm is more than 26%.
A Proctor Compaction Test obtained the optimum water content. The compaction power in the compaction test was 598.2 kJ/m3. The liquid-plastic limit combined tester determined the liquid-plastic limit of test-soil samples. A triaxial compression test measured soil samples’ cohesion and internal friction angle. The soil properties of the testing samples are listed in Table 1.

2.2. Testing Scheme

The testing scheme is listed in Table 2. It can be seen that the tests aim to investigate the deformation mechanism of subgrade soil under traffic load. The test is designed according to the wheel-axle load and subgrade depth, affecting the subgrade deformation.
The amplitude of traffic load in this test was determined by axle-load spectrum. This test considered the axle-load distribution of three different types of single axle, double axle, and triple axle. According to Bin-Lai Expressway’s traffic-volume investigation results, each type was converted into standard axle times, and each type was converted into a vehicle with corresponding weight. It was found that the peak area the of axle-load spectrum occurred in axle loads of 50 kN, 130 kN, and 240 kN, respectively.
Figure 3 is the schematic diagram of subgrade stress under traffic load. The additional stress of traffic load is related to the single-wheel load and the depth of the subgrade soil layer. The calculation formula of additional subgrade stress caused by wheel-concentrated load is shown in Formula (1). In the consolidation process, the hydraulic conductivity of the alluvial fill will change significantly. The vertical stress of the subgrade under different depths and different axial loads calculated by Formula (1) is shown in Table 3.
σ Z = α P 1 / Z n
where α is the stress coefficient, the reference value is 0.4775; P 1 is the concentrated load converted from the wheel load; Z n is the buried depth of the action point causing additional stress under the action of the centerpoint of the concentrated load of the road wheel.
The subgrade height of the low expressway is generally controlled within 5 m. Therefore, the subgrade depths are 0.5 m, 1.5 m, and 2.5 m. The vibration frequency reflects the speed of vehicles on the road. This test refers to the statistical results of traffic-load frequency in the relevant literature, and the vibration frequency of traffic load in this test is set as 1 Hz.

2.3. Testing Procedure

(1)
The on-site soil samples were put into the oven to dry for 24 h. Then, the dried soil samples were crushed into powder by the pulverizer and passed through a 2 mm screen.
(2)
The soil sample with an optimum moisture content of 17.01% was prepared by adding distilled water into the screened soil sample. After mixing evenly, the soil sample was put into a plastic bag and sealed for 24 h to make the water thoroughly and evenly mixed with the soil.
(3)
Before making the triaxial specimen, the moisture content of the soil sample was measured again to ensure that the error between the measured value and the optimal moisture content was not more than 1%. First, a layer of Vaseline was applied on the inner wall of the sample cylinder (50 mm × 100 mm), and then the prepared soil sample was smashed into the compacting instrument in five layers.
(4)
The prepared triaxial specimens were put into a vacuum saturator for vacuum saturation and soaked in water for three days.
(5)
The gas in the water pipe of the triaxial test device was discharged by the needle tube, and the sample was installed on the base of the triaxial tester.
(6)
The saturation of triaxial specimens was tested. The ratio of pore-pressure increment to confining-pressure increment, after confining pressure, was used as the evaluation index of saturation. If the saturation was above 0.95, the triaxial test would be started directly. If the saturation was less than 0.95, back pressure would be applied at the top of the sample until the saturation reached 0.95.
(7)
The specimens were consolidated. In this test, isobaric consolidation ( σ 1 = σ 3 ) was adopted to apply equal lateral and axial pressures to the specimens. The standard completed in the consolidation stage was wrong with the code for the soil test. The reference source was not found. For reference, the change of consolidation displacement within 1 h is not more than 0.1 cm3.
(8)
After the sample reached the consolidation standard, the dynamic load was applied according to the test-design condition, and soil deformation, pore pressure, and other parameters are monitored.

3. Test Results

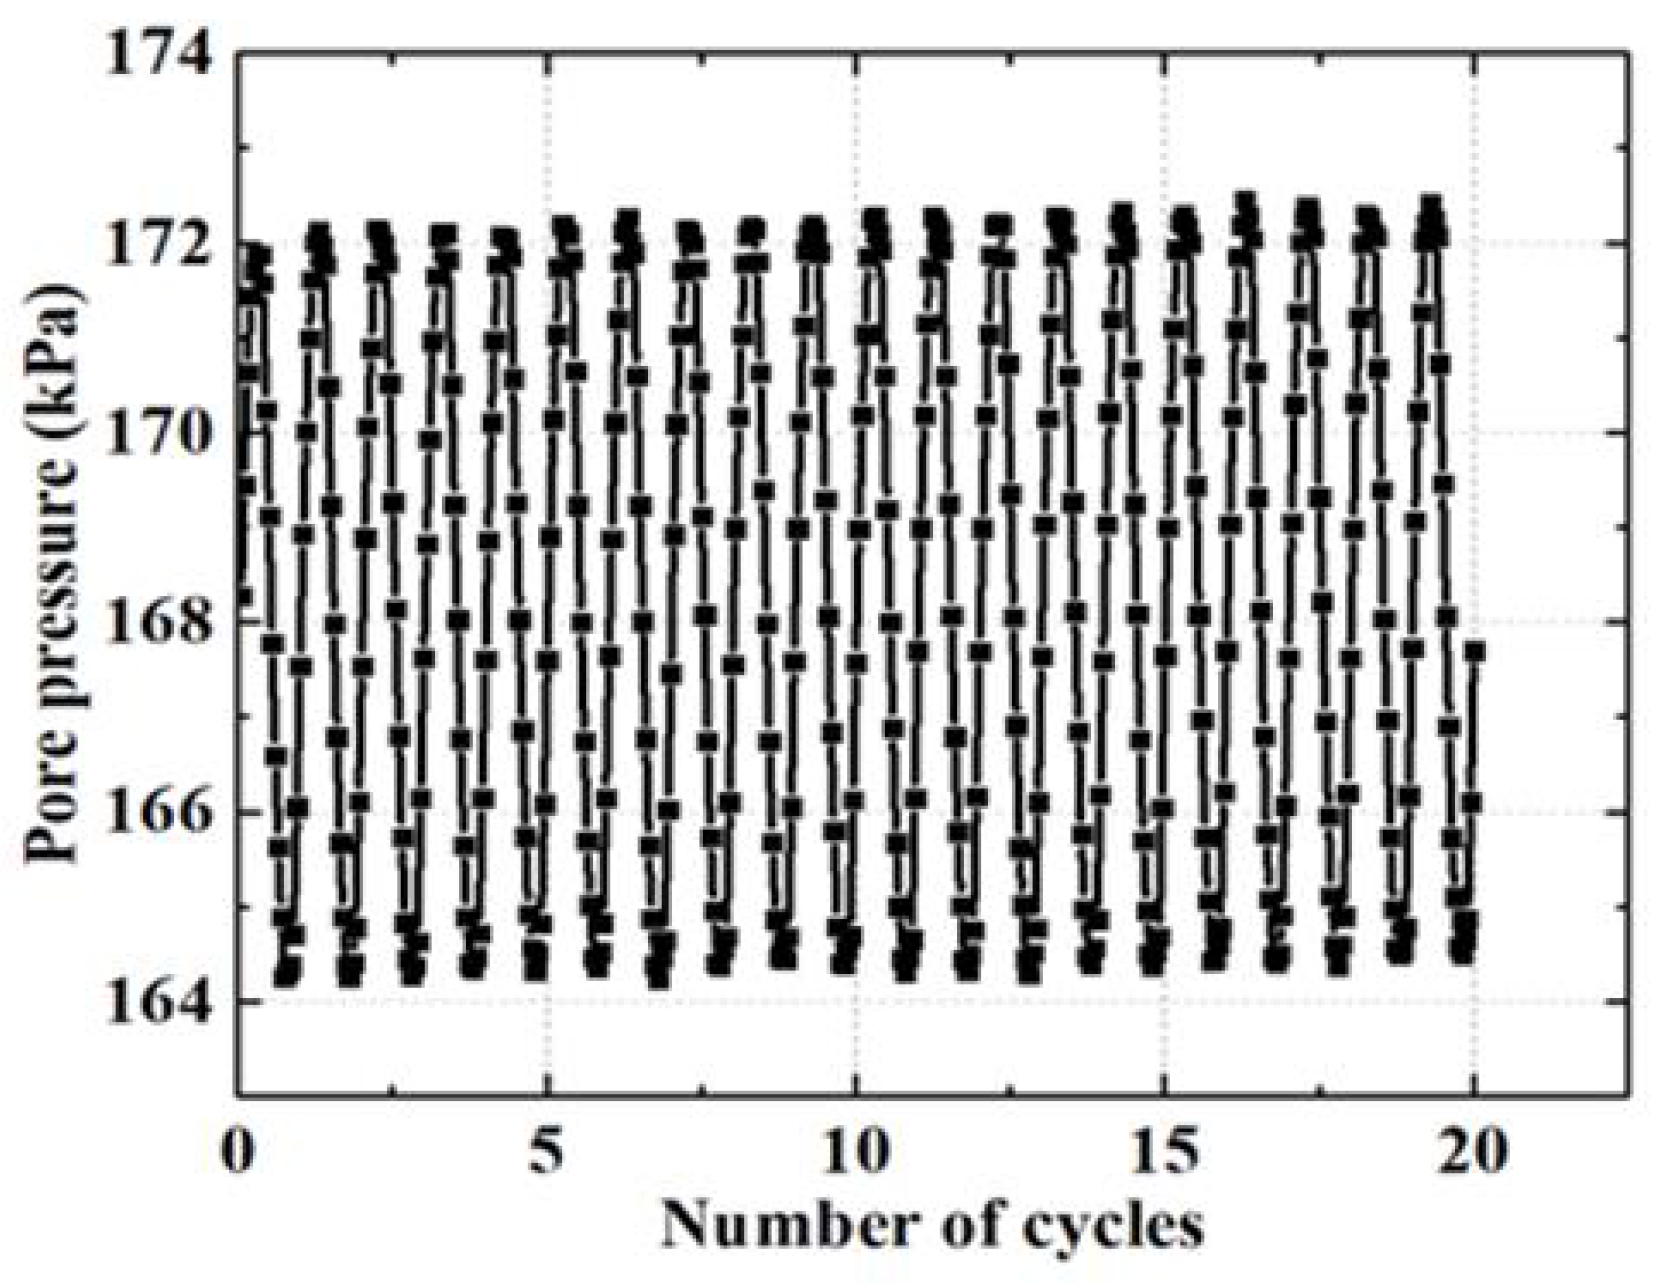
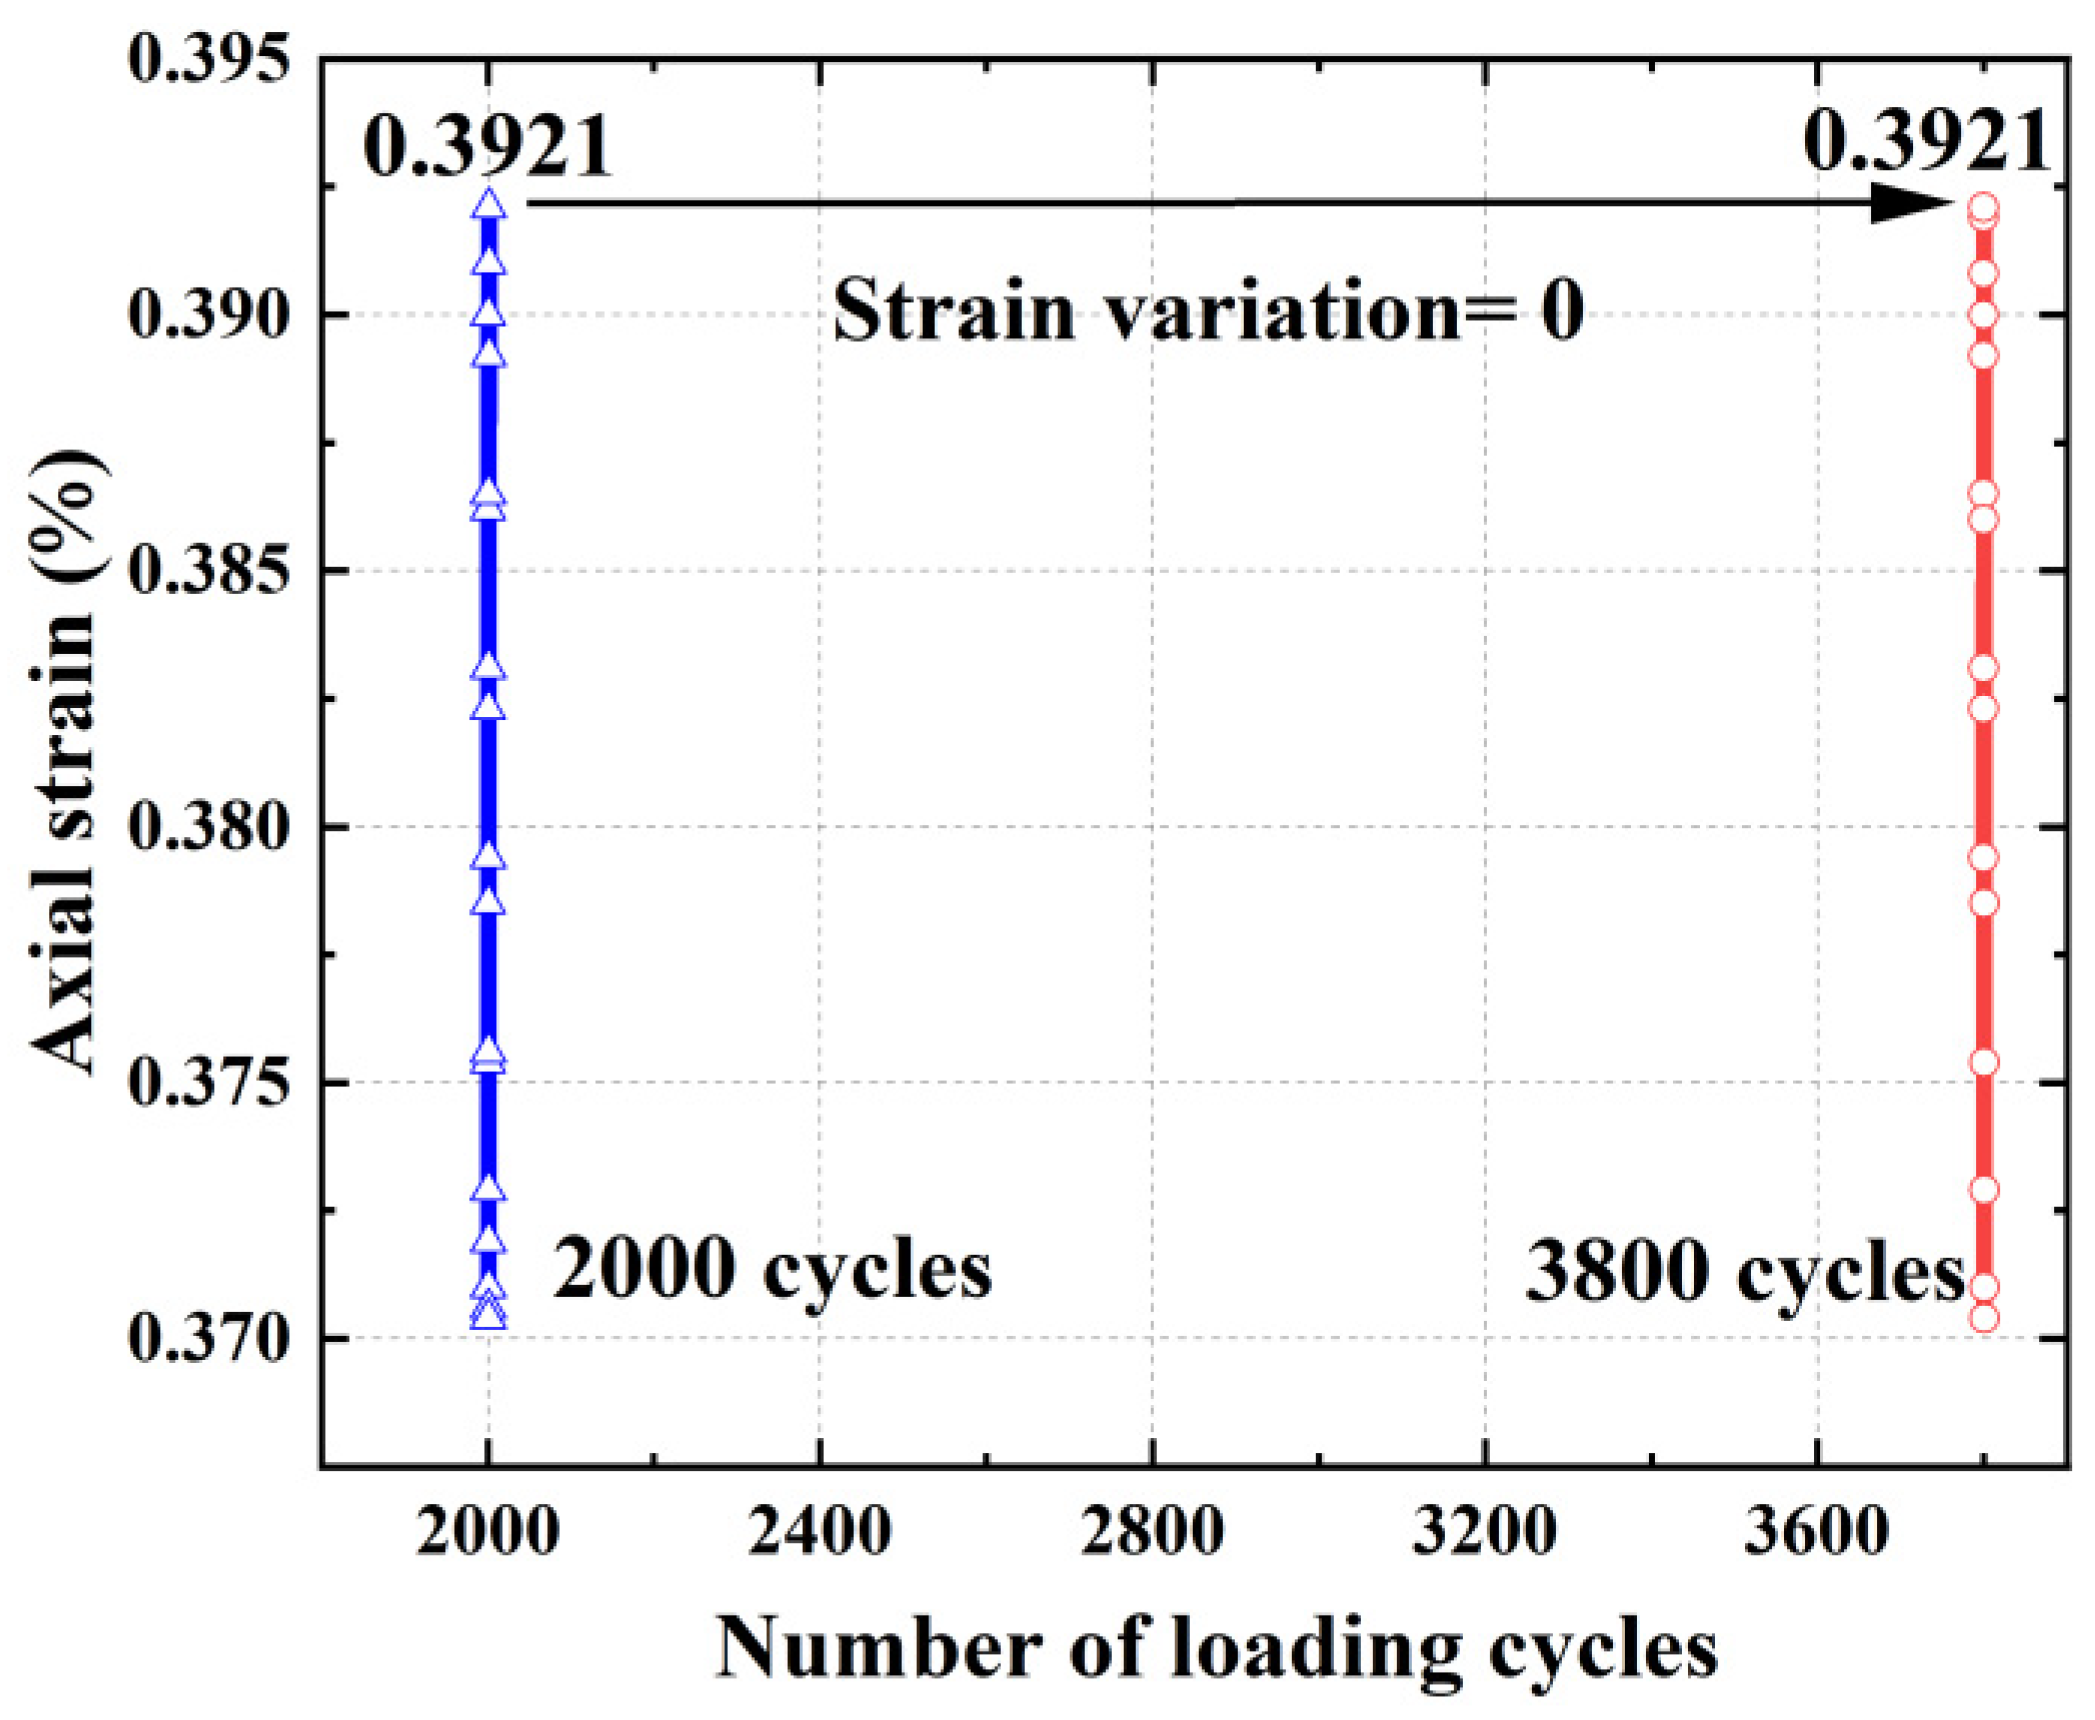
3.1. Criteria for End of Cyclic Loading

Taking working condition I-2 as an example, the curves of axial force, axial strain, and pore-water pressure with the increase in cycle times in the dynamic-loading test are shown in Figure 4, Figure 5, Figure 6 and Figure 7. The axial force is applied in a sinusoidal cycle with the specified amplitude, and the variation curve of the axial strain and pore-water pressure increases slowly with the increase in vibration times, and the soil-strain and pore-water-pressure changes are not obvious due to the small traffic load. Therefore, the criterion of dynamic-load stopping is that the axial strain is stable, that is, the difference in axial strain within half an hour is less than 0.001. It can be seen from Figure 8 that after 2000–3800 cycles, the strain almost remains unchanged, indicating that the deformation of subgrade soil has reached a stable state and the loading can be stopped.

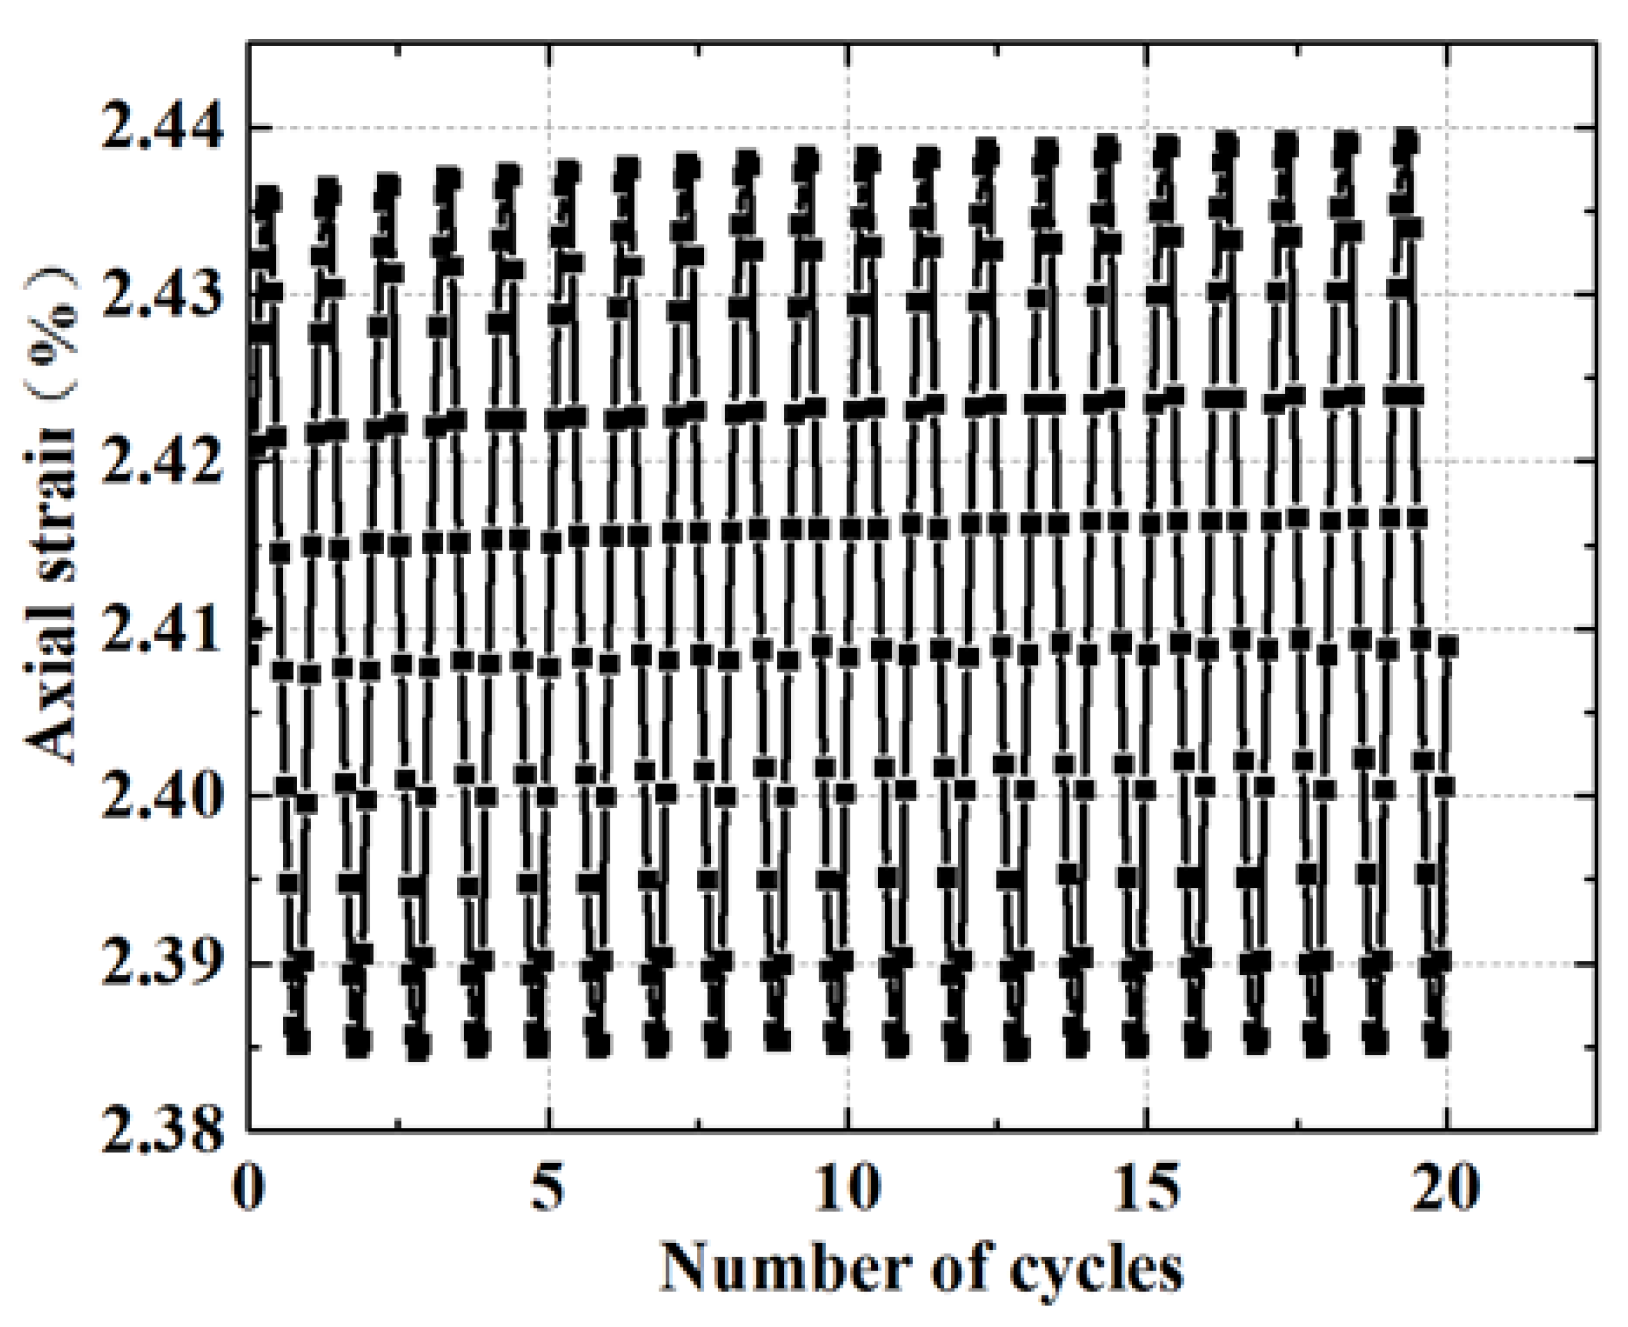
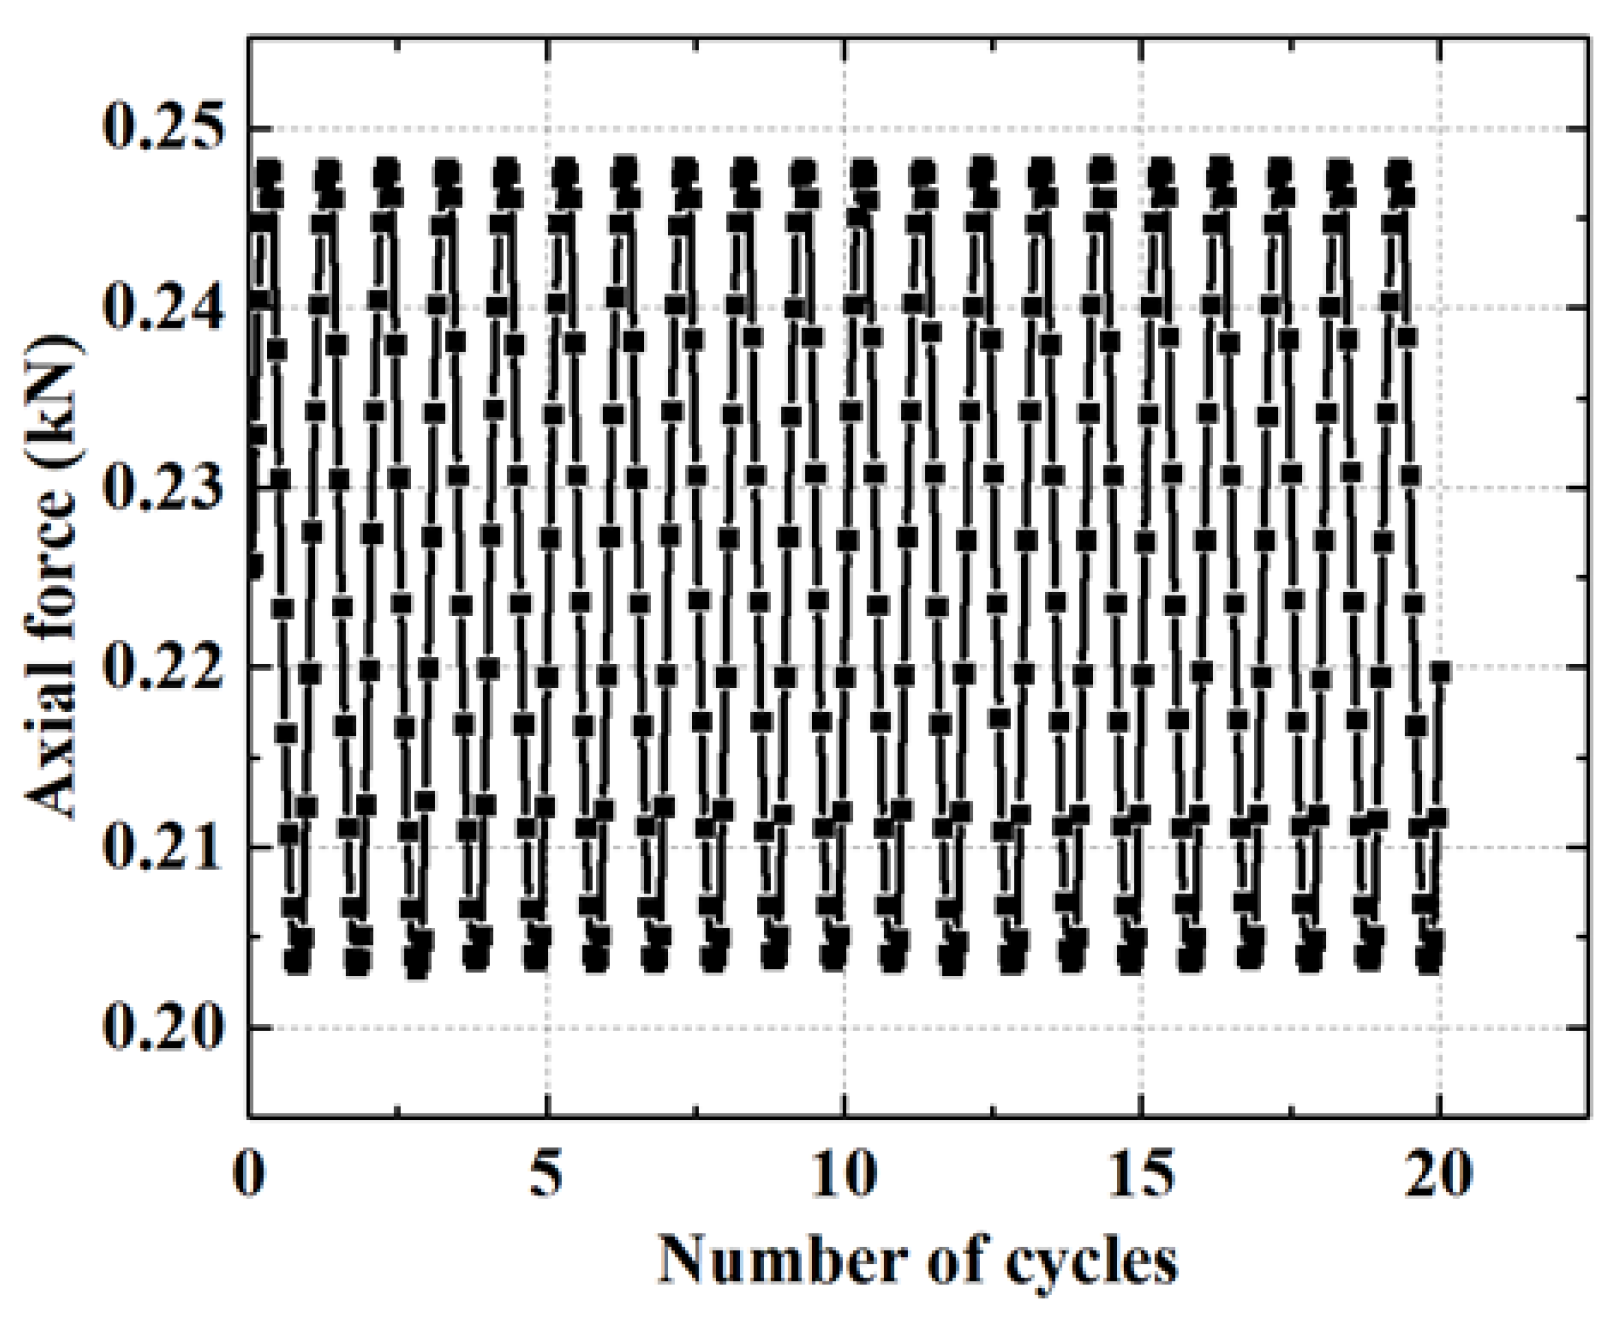
3.2. Time-History Evolution Rule of Subgrade-Soil Dynamic Response

3.2.1. Evolution Rule of Cumulative Strain

The variation characteristics of cumulative strain with vibration number under cyclic load are shown in Figure 8 and Figure 9. Because the amplitude of traffic load is generally small, the cumulative strain of subgrade soil caused by it is slight, all within 0.1. At the initial stage of loading (within about 1000 cycles), the cumulative strain of the soil sample increases significantly, and the strain increases almost linearly. The strain increase can reach more than 50% of the total strain variation. There is an obvious turning point in the development of the curve. When the load reaches half of the total number of cycles, the strain-growth rate slows down.

3.2.2. Evolution Rule of Pore-Pressure Ratio

The pore-pressure ratio is the ratio of pore-water-pressure increment and lateral effective consolidation stress under cyclic stress. It can be seen from Figure 10 and Figure 11 that the variation curve of the pore-water-pressure ratio is roughly the same as that of the cumulative strain. Under low cyclic stress, the pore-water pressure increased rapidly in the elastic stage, and the variation of pore-water pressure in the first half of the curve could reach about 60% of the total increase. Then, the growth of the curve slowed down, and the curve remained stable when it was loaded to 2/3 of the total number of cycles.

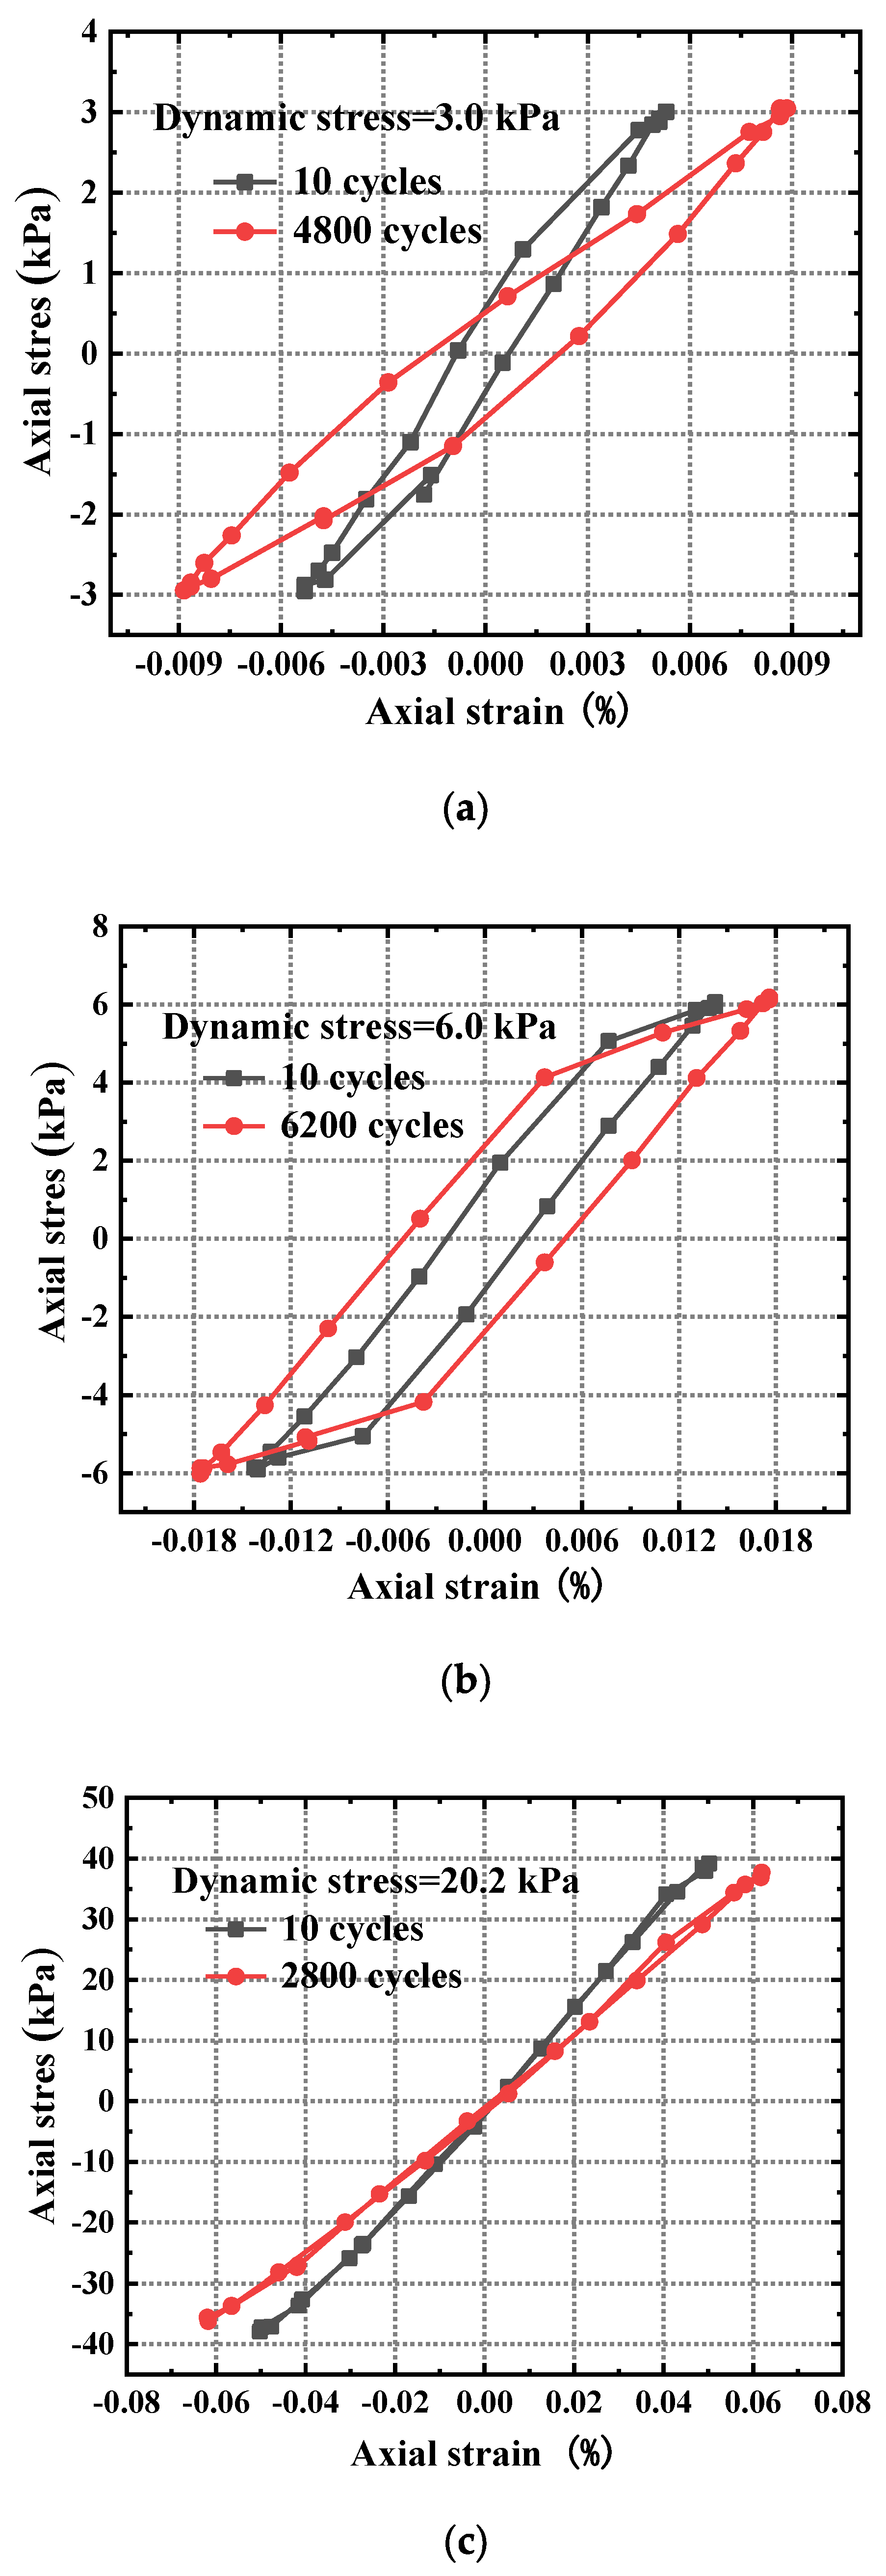
3.2.3. Hysteresis Curve

Figure 12 shows the stress–strain hysteretic curve of subgrade soil under different axial-load conditions with a buried depth of 2.5 m. The ordinate of the hysteretic curve represents the magnitude of deviated stress. The amplitude of dynamic stress exerted on the sample in the test is a constant value, so the curve’s height remains unchanged in the vertical direction. The abscissa represents the axial strain, and the curve extends horizontally to both sides.
Due to the sudden force acting on the soil during the initial loading, the strain produced is unstable, and there is an error. Therefore, the soil parameters change to the initial state at the 10th cycle. It can be seen from the figure that with the increase in the number of cycles, the slope of the stress–strain hysteresis loop decreases, and its area tends to increase.

3.3. Spatial Distribution of Dynamic Response of Traffic Load

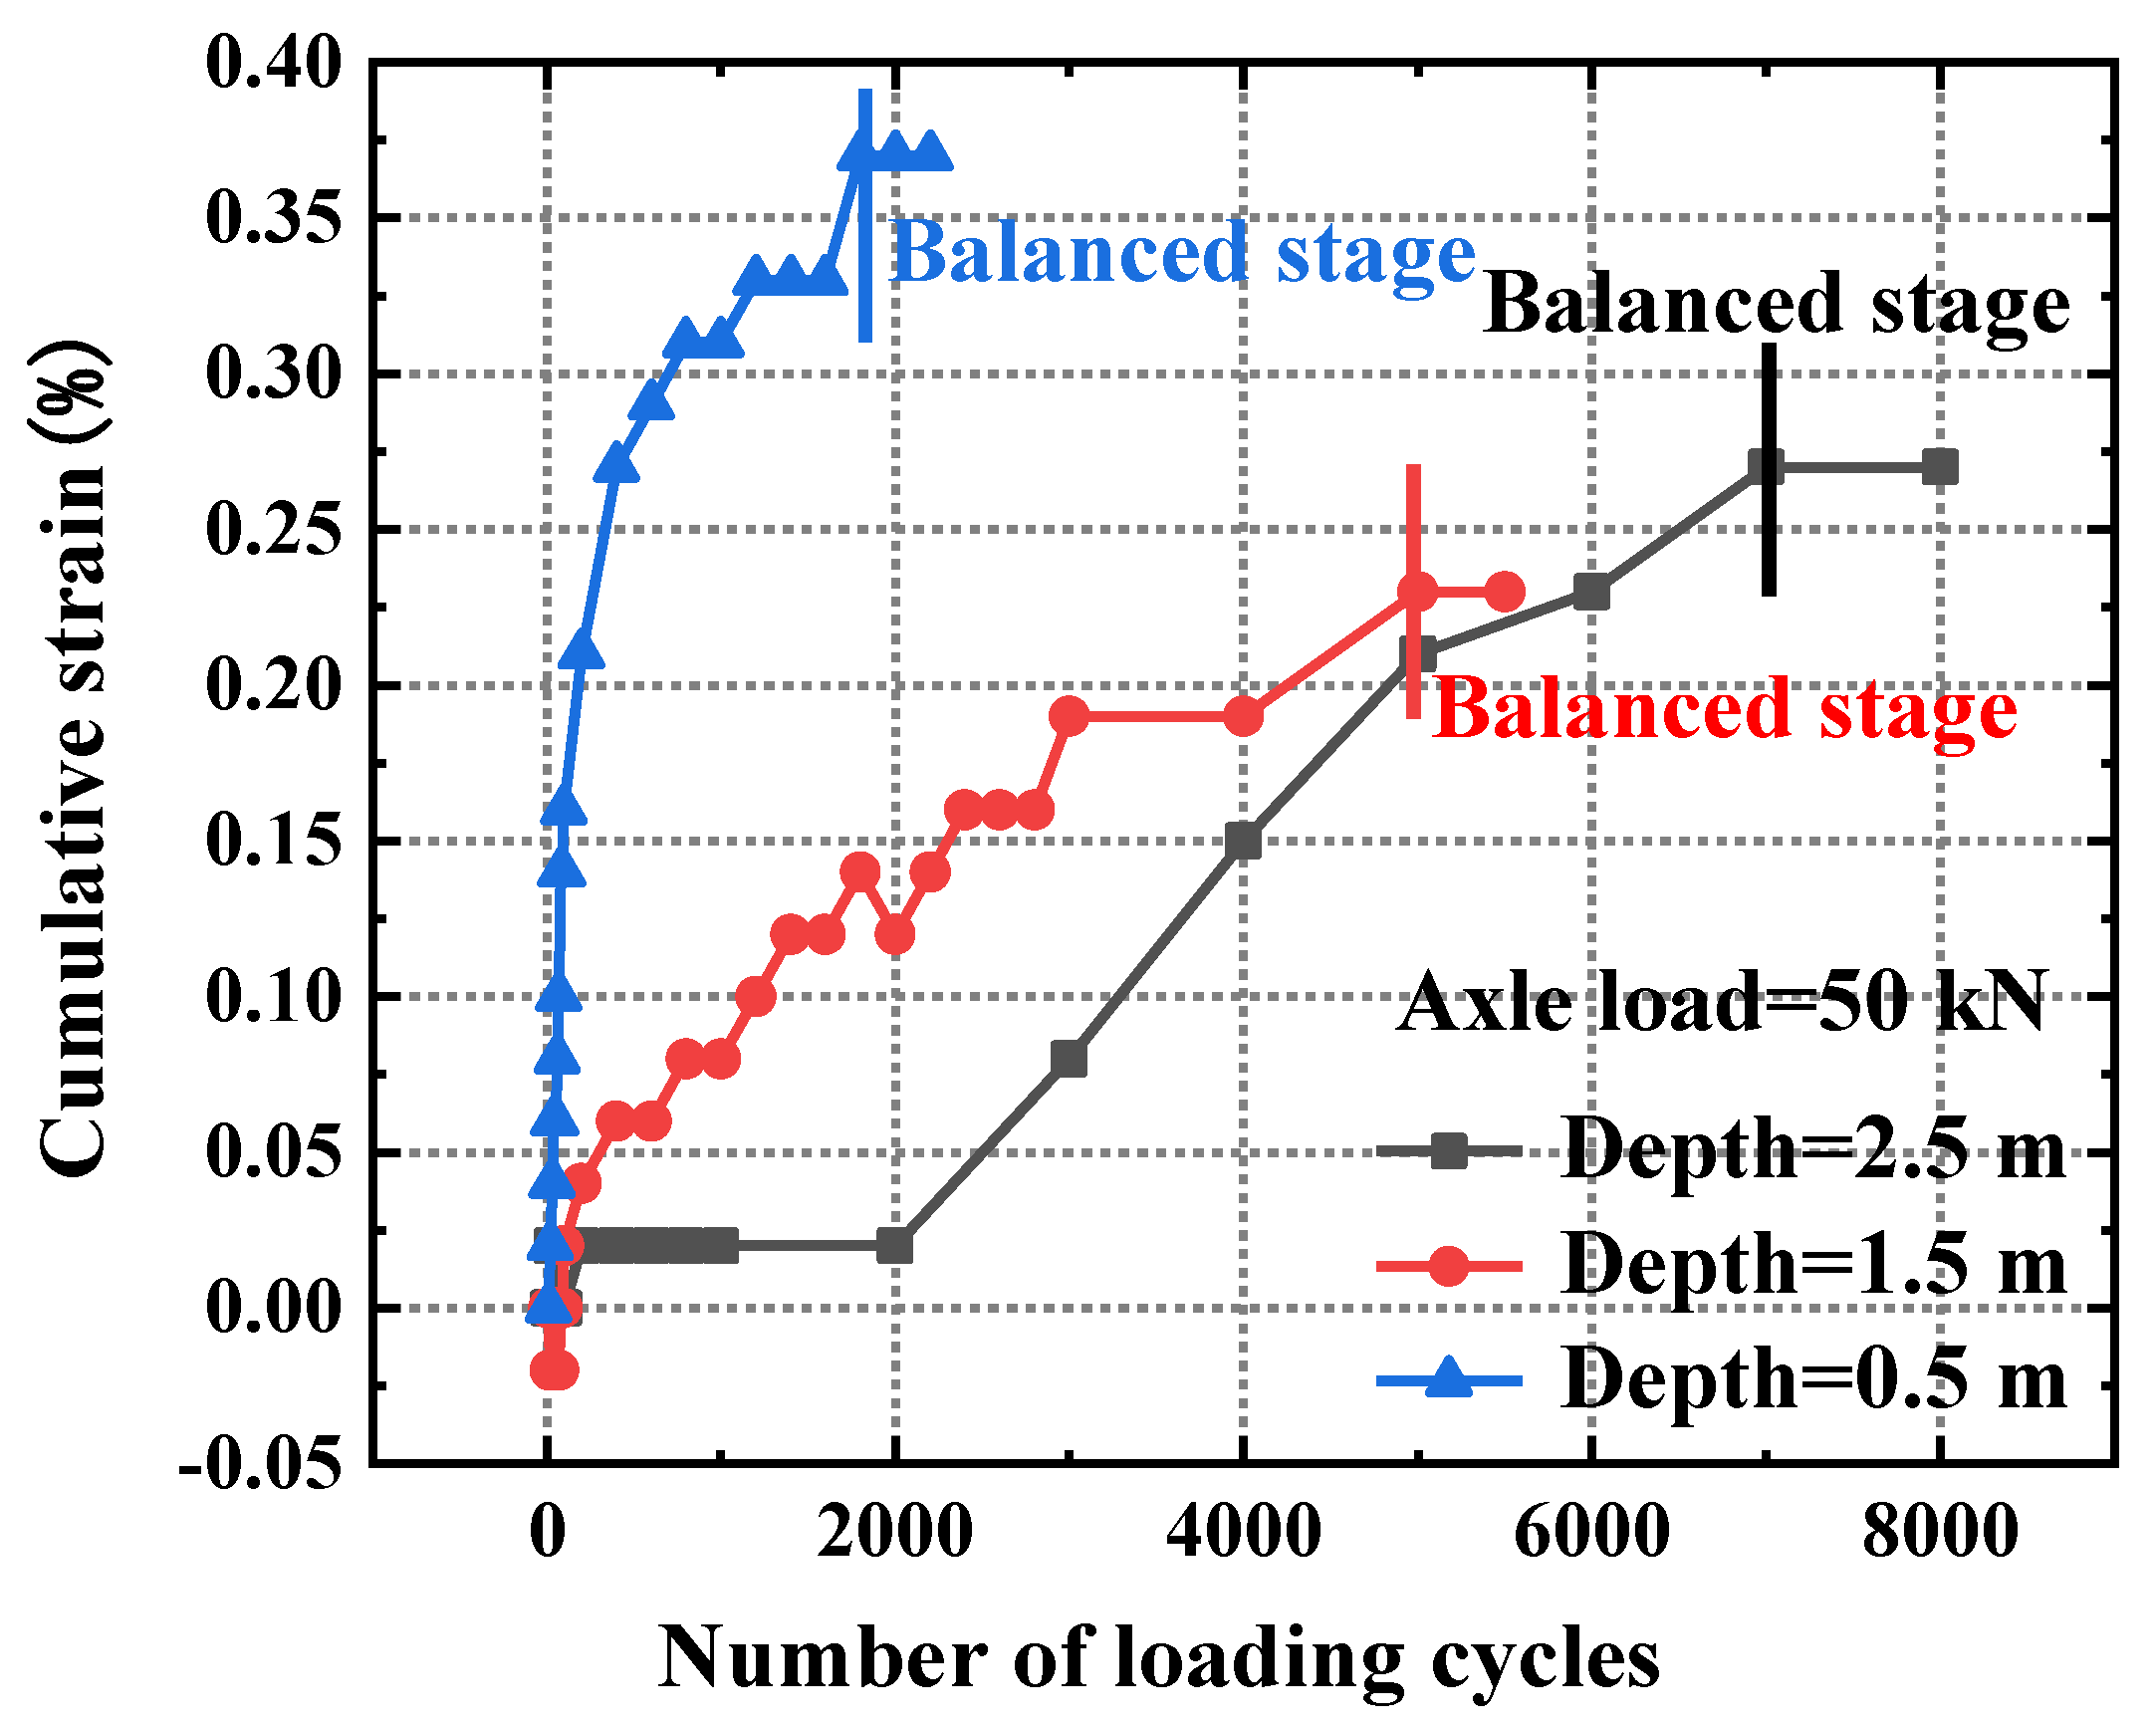
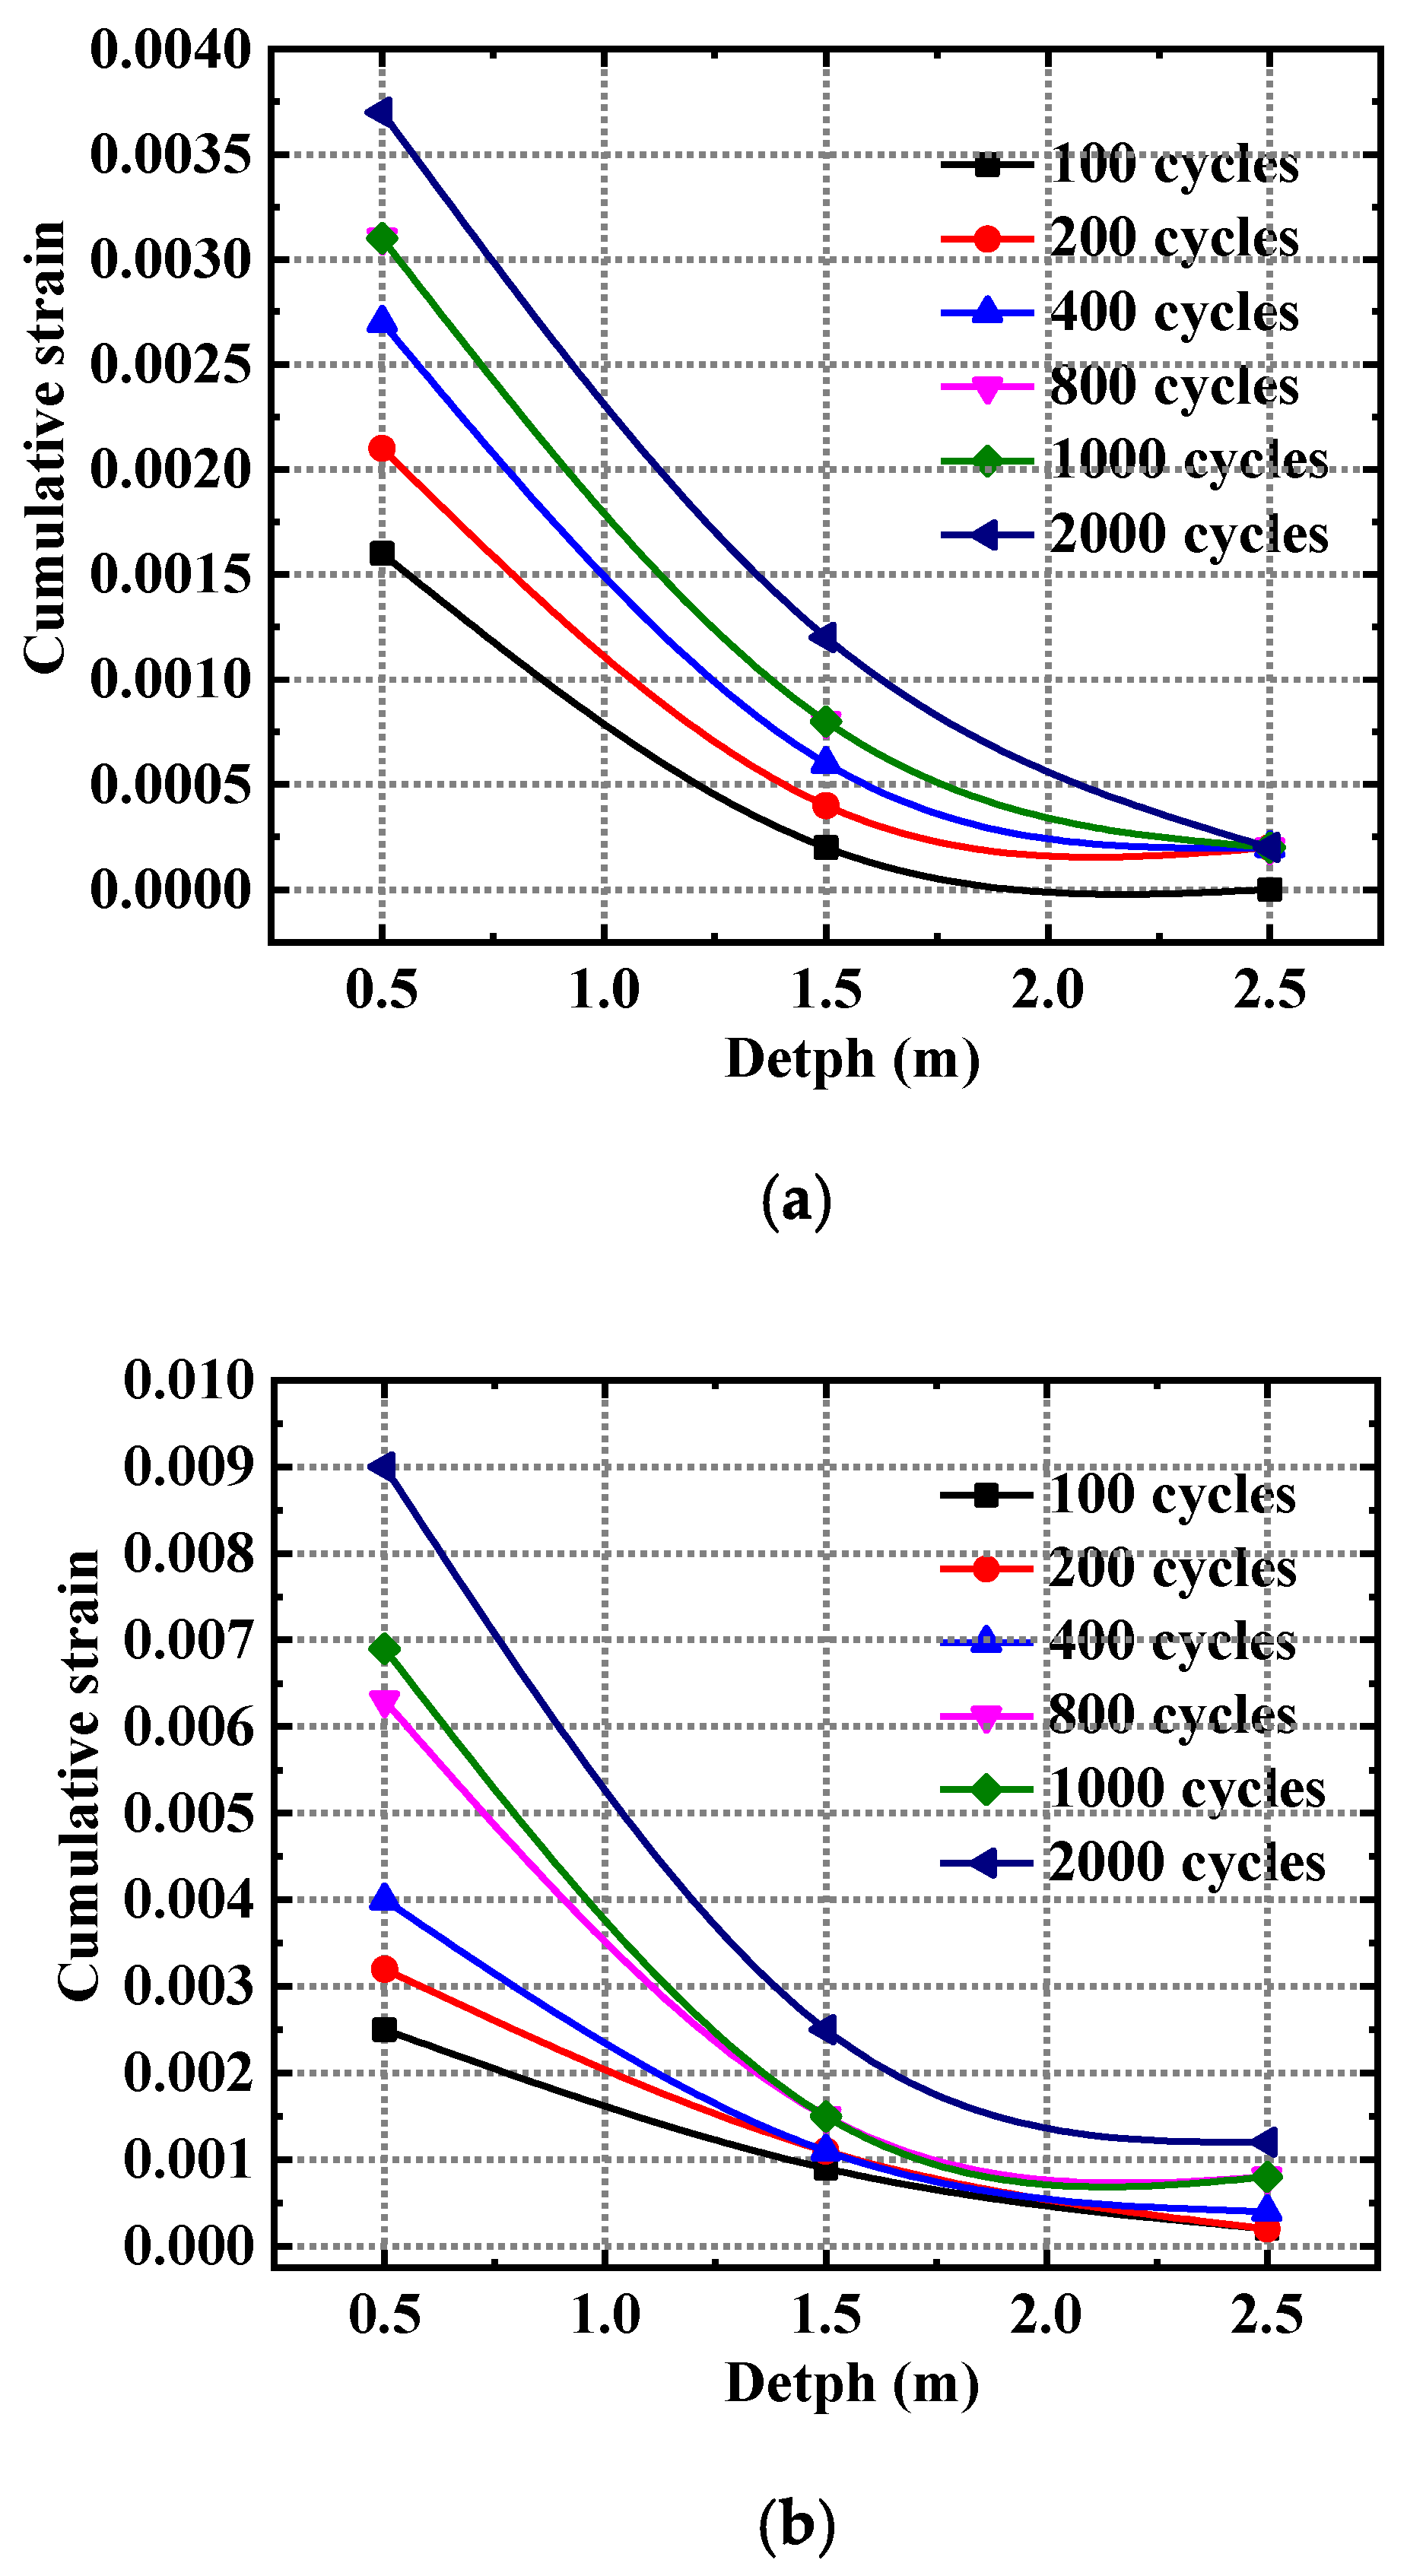
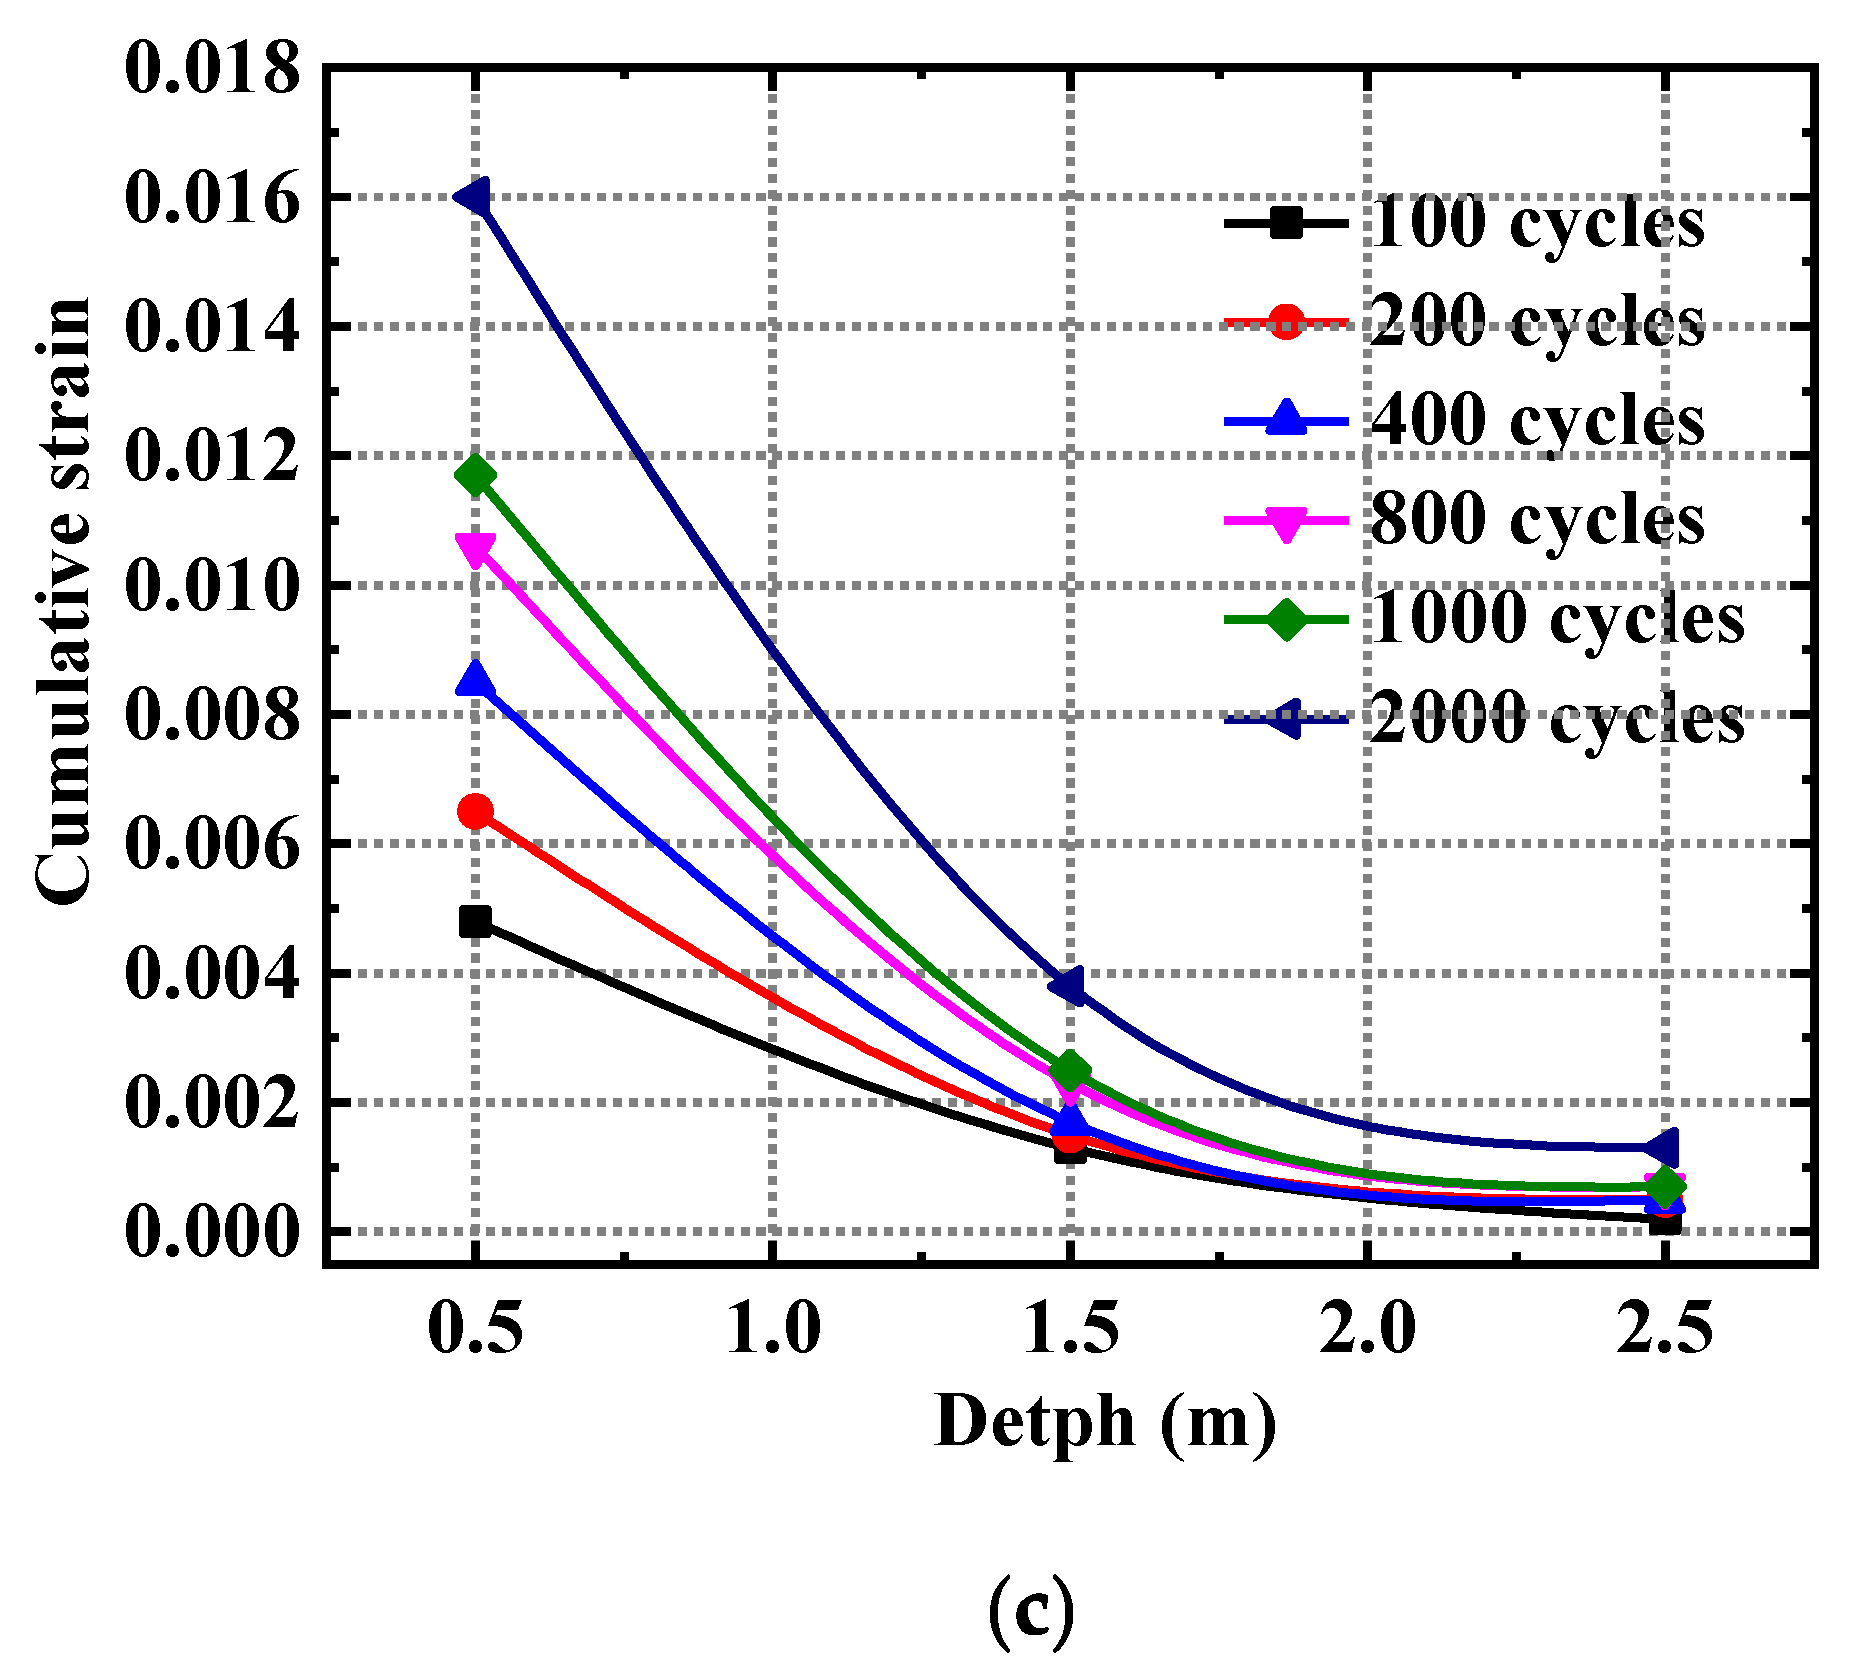
3.3.1. Spatial Distribution of Cumulative Strain

The spatial distribution of the dynamic response of traffic load is shown in Figure 13. The dynamic load produces a significant strain variation at the road surface with a subgrade depth of less than 1.5 m. When the subgrade depth ≥ 1.5 m, the load effect gradually weakens. It indicates that the deeper the subgrade soil is buried, the greater the surrounding pressure is and the closer the soil particles are arranged, resulting in the force of road-traffic load on the soil decreasing with the increase in depth. Therefore, the deformation of shallow roadbeds caused by traffic load can not be ignored during highway construction.

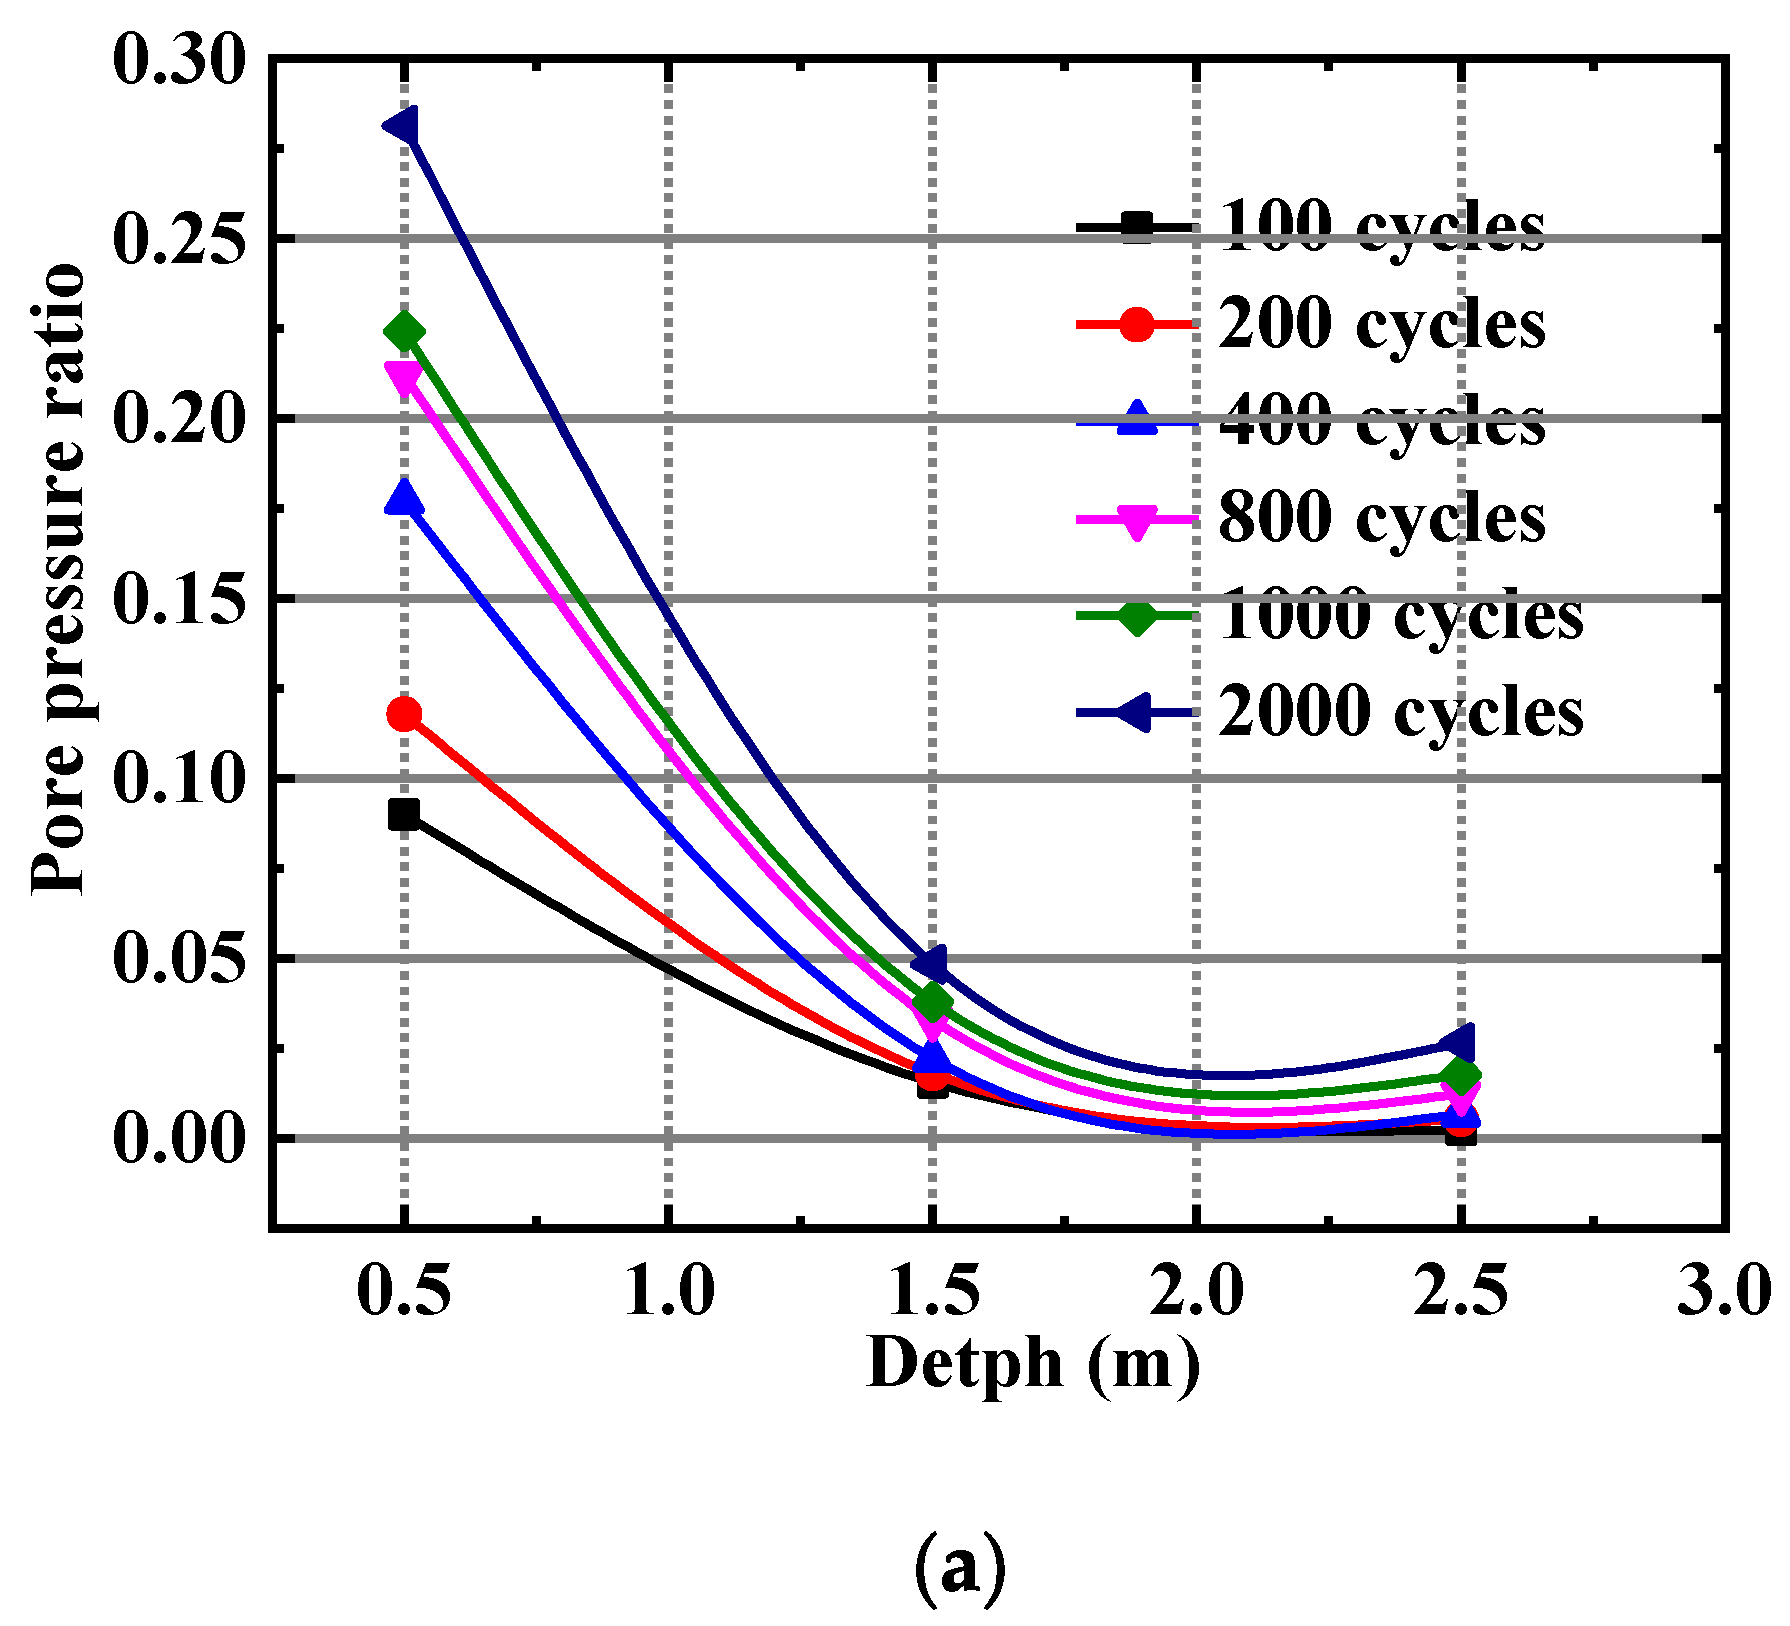
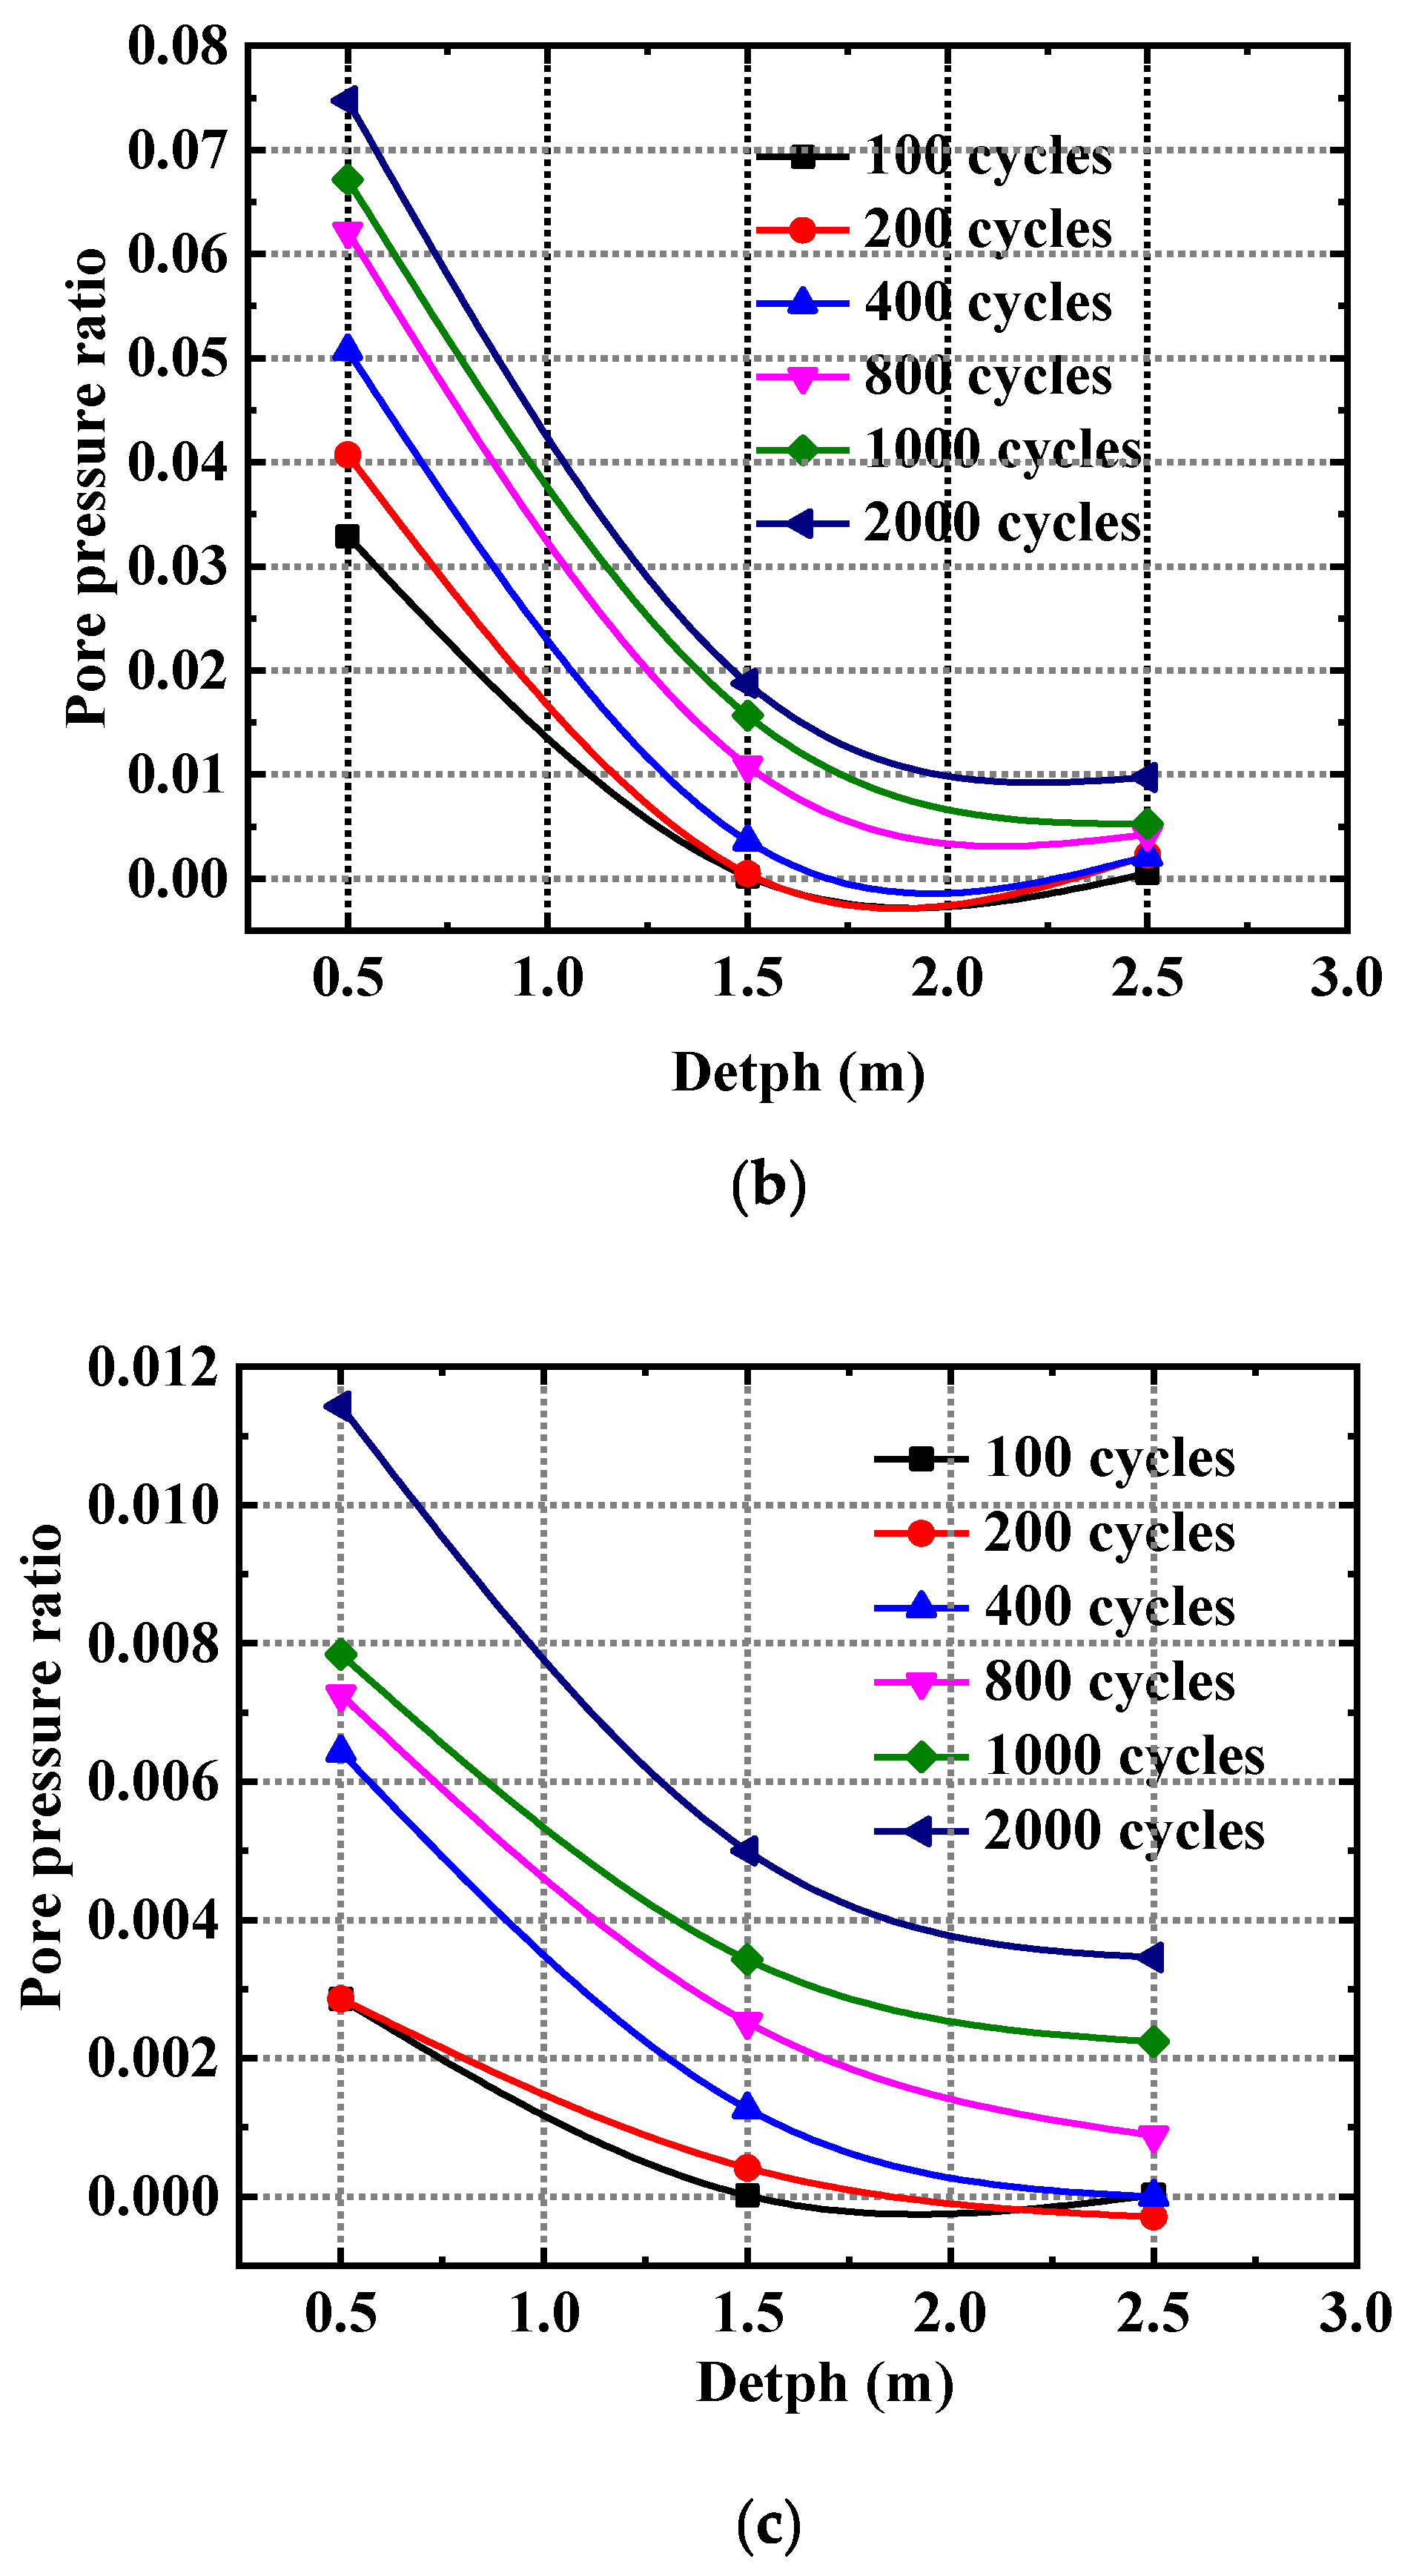
3.3.2. Spatial Distribution of Pore-Pressure Ratio

The concentrated load p = 240 kN is taken as an example. It can be seen from Figure 14 that the development rule of the pore-water-pressure ratio is consistent with the cumulative strain. The pore-water pressure in the first half of the curve decreases rapidly, which indicates that the pore-water pressure is greatly affected by the depth within 1.5 m below the subgrade surface. The pore-water pressure changes gently in the latter half of the curve; when the depth increases from 1.5 m to 2.5 m, the pore pressure of the subgrade is basically no longer affected by the depth factor.

3.4. Influence of Traffic-Load Amplitude

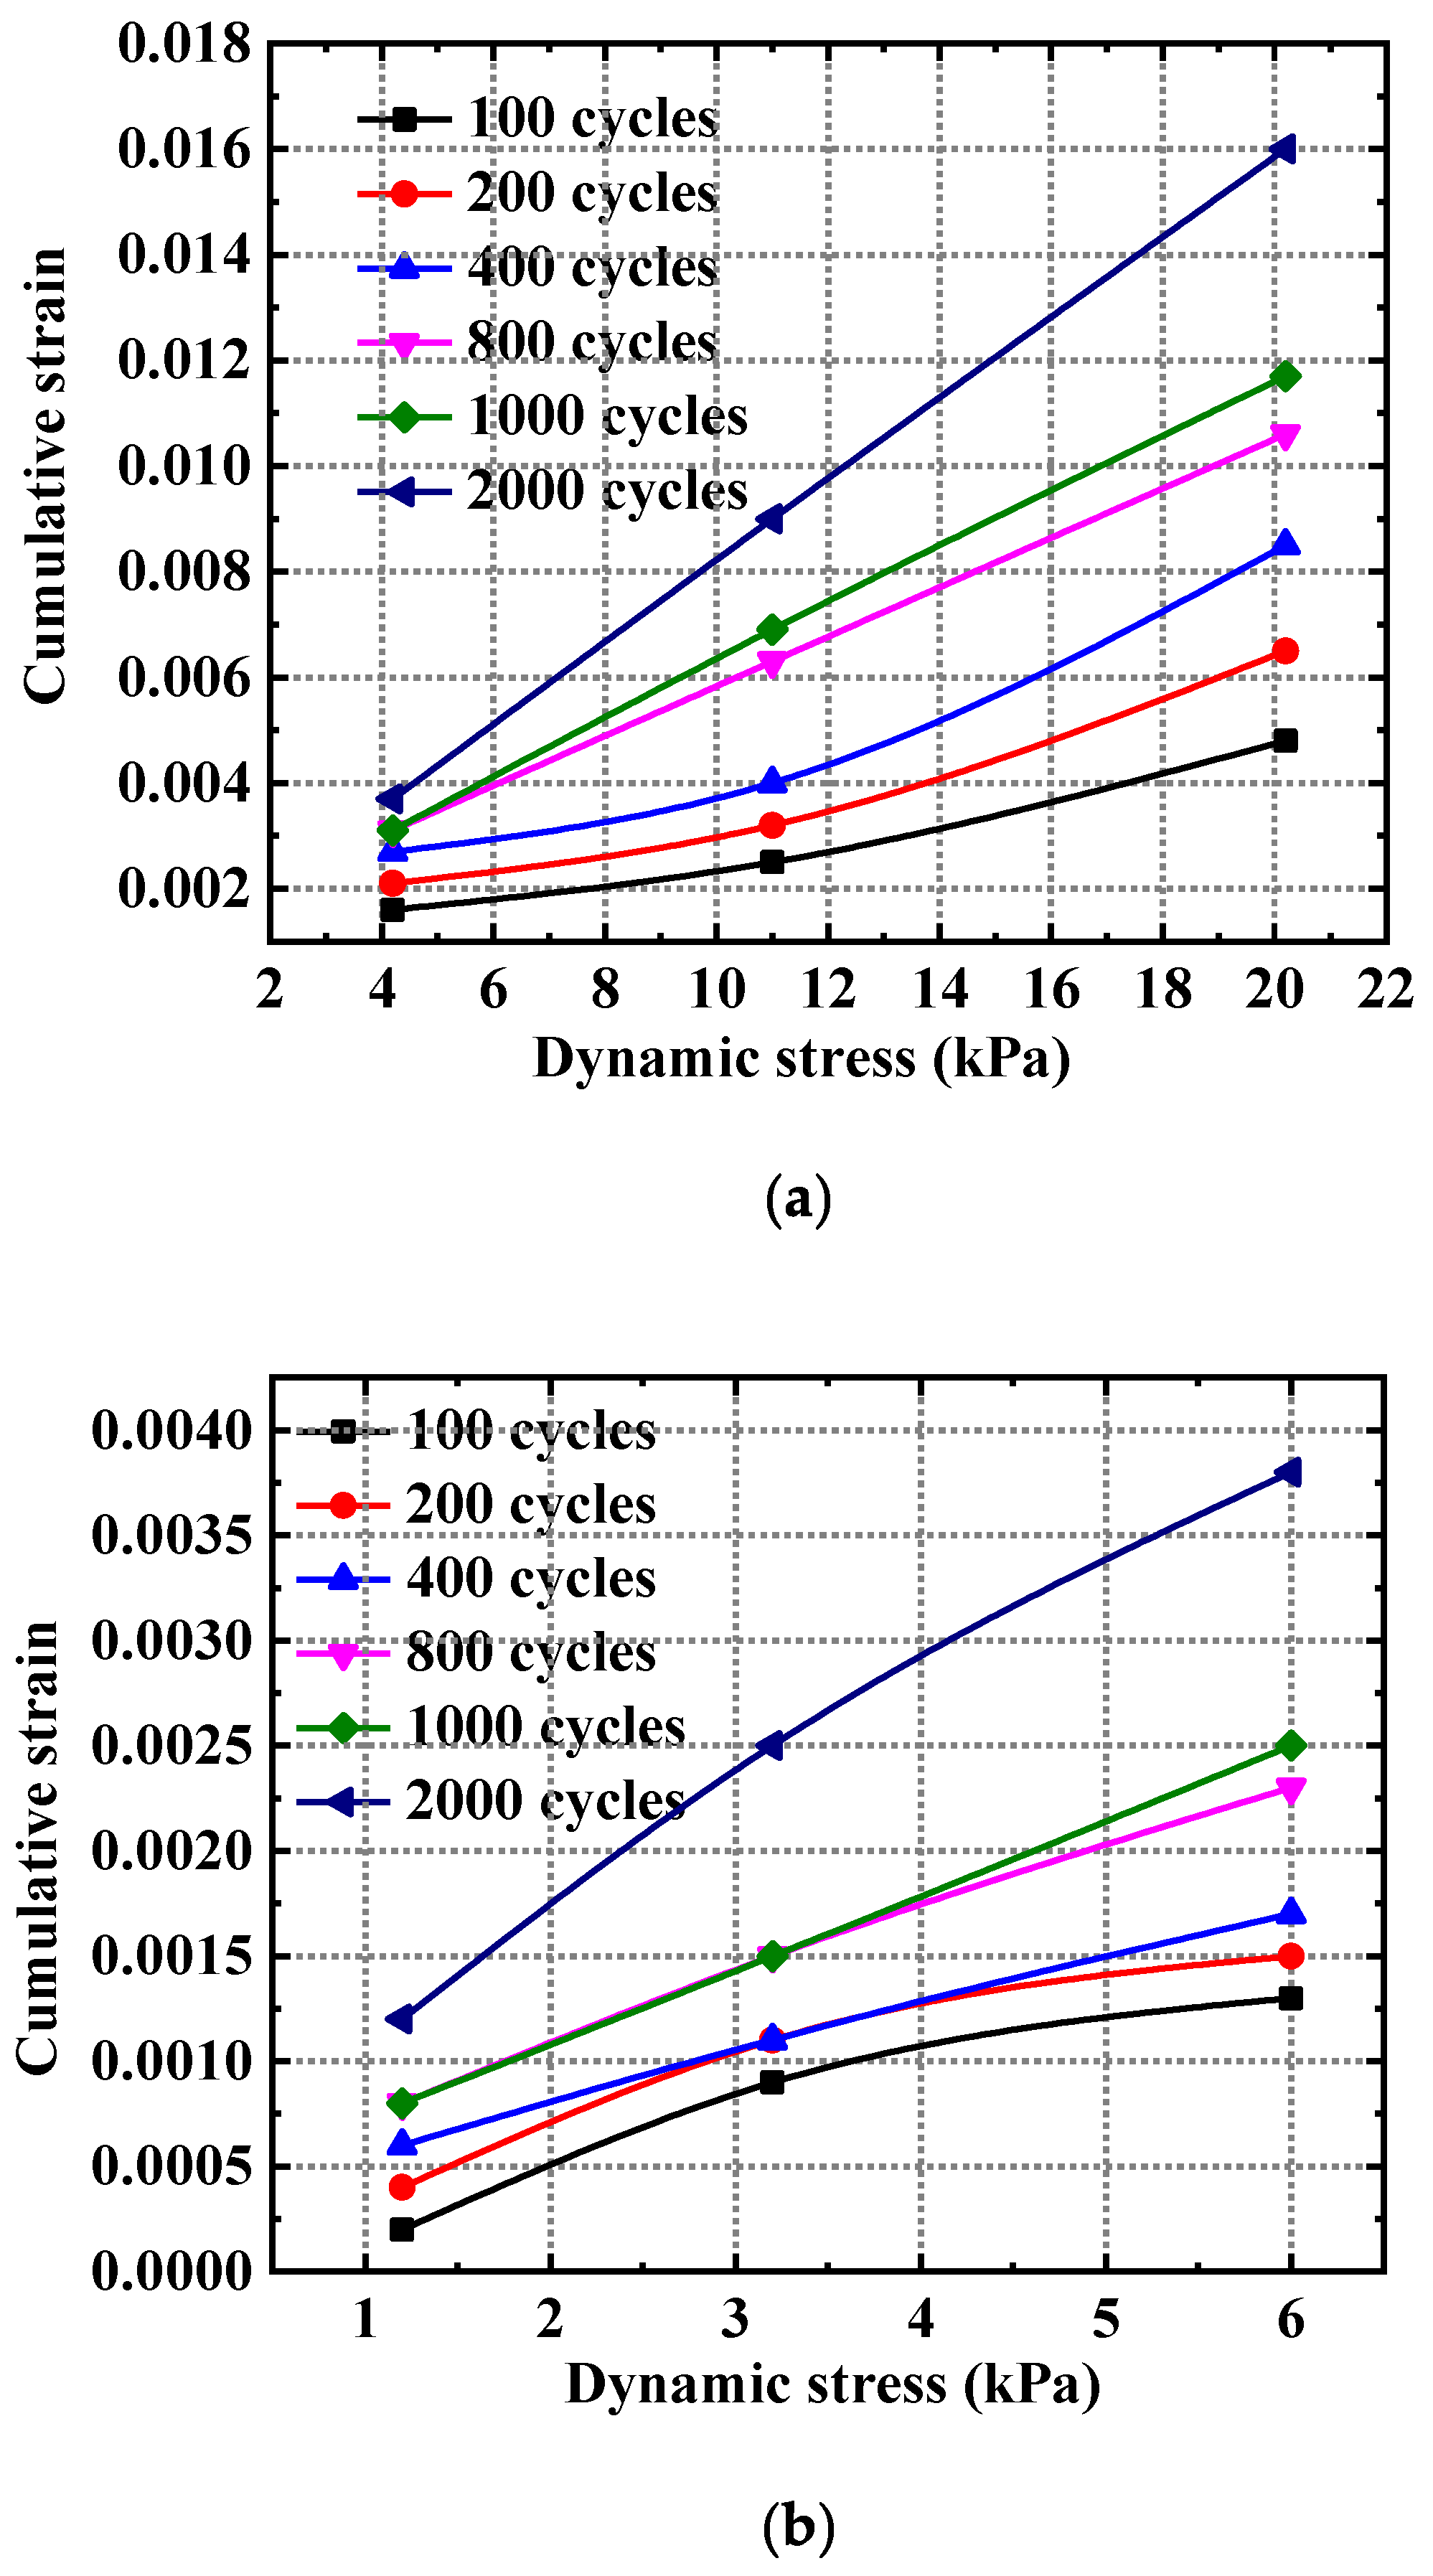
3.4.1. Influence Rule of Traffic-Load Amplitude on Strain

The variation rule of the cumulative strain of subgrade soil under different dynamic stresses is shown in Figure 15, and the curve of cumulative strain increases linearly with dynamic stress. The growth trend of the two curve sections is roughly the same, and the greater the dynamic load, the stronger the dynamic response. When the depth of the subgrade is 0.5 m and 1.5 m, the accumulated strain of the subgrade soil increases by more than three times. When the depth of the subgrade is 2.5 m, the cumulative strain of subgrade soil increases less than one time.

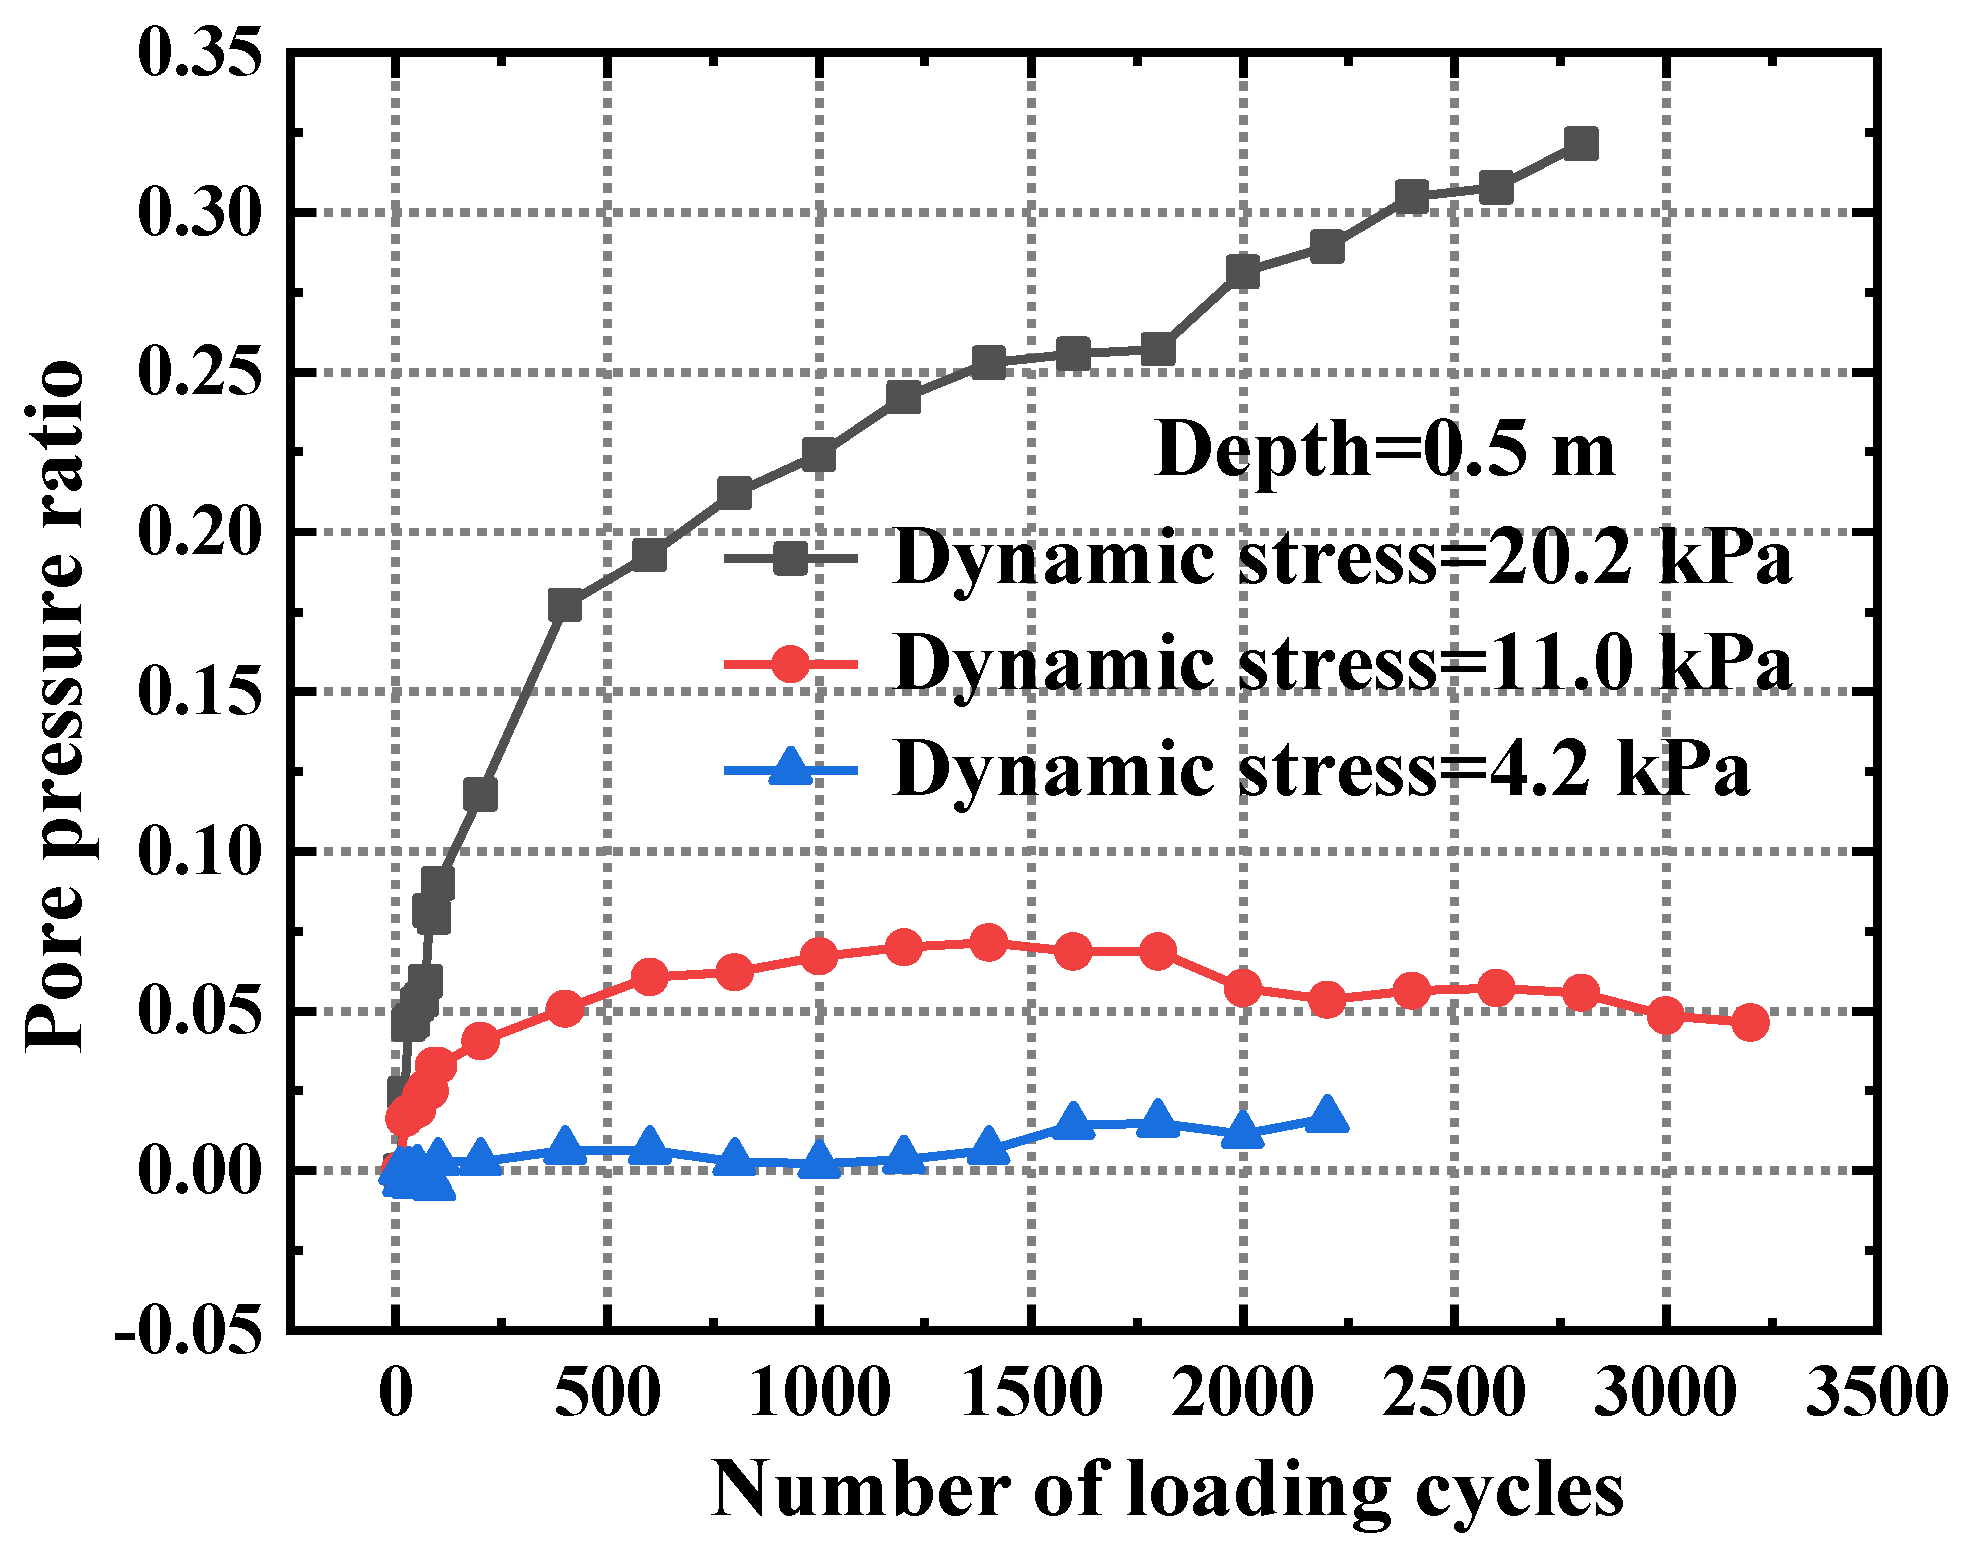
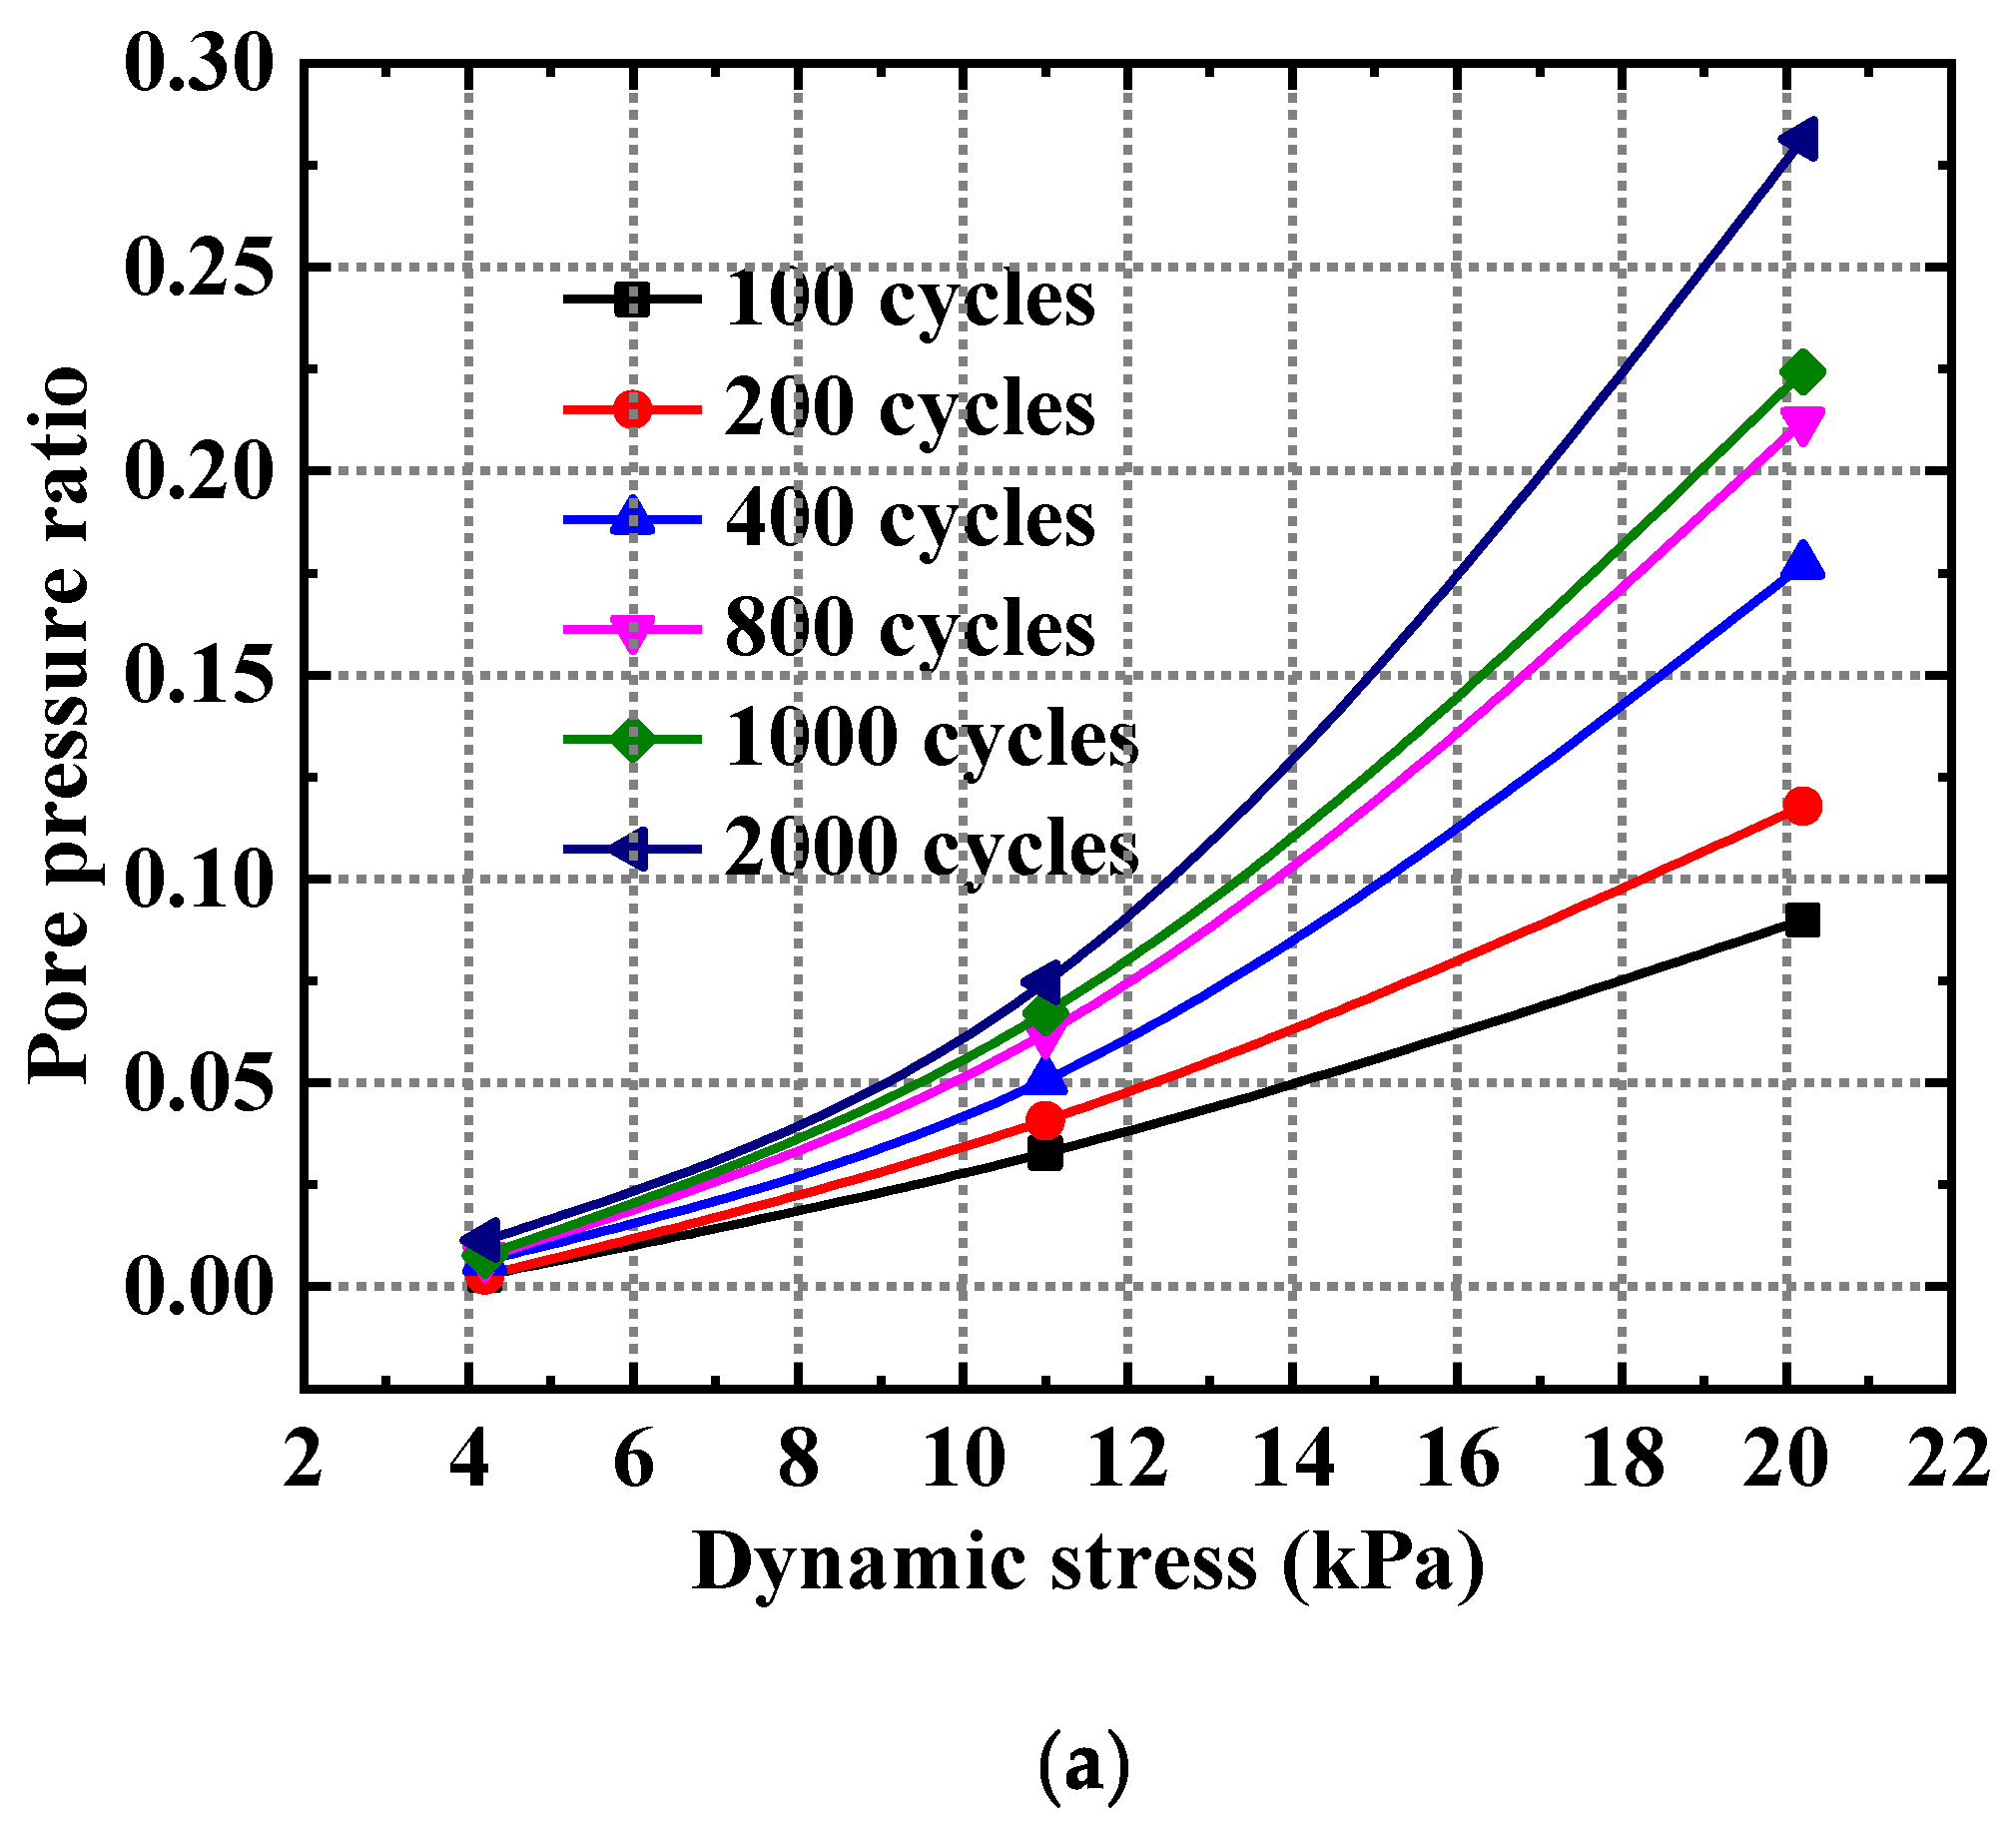
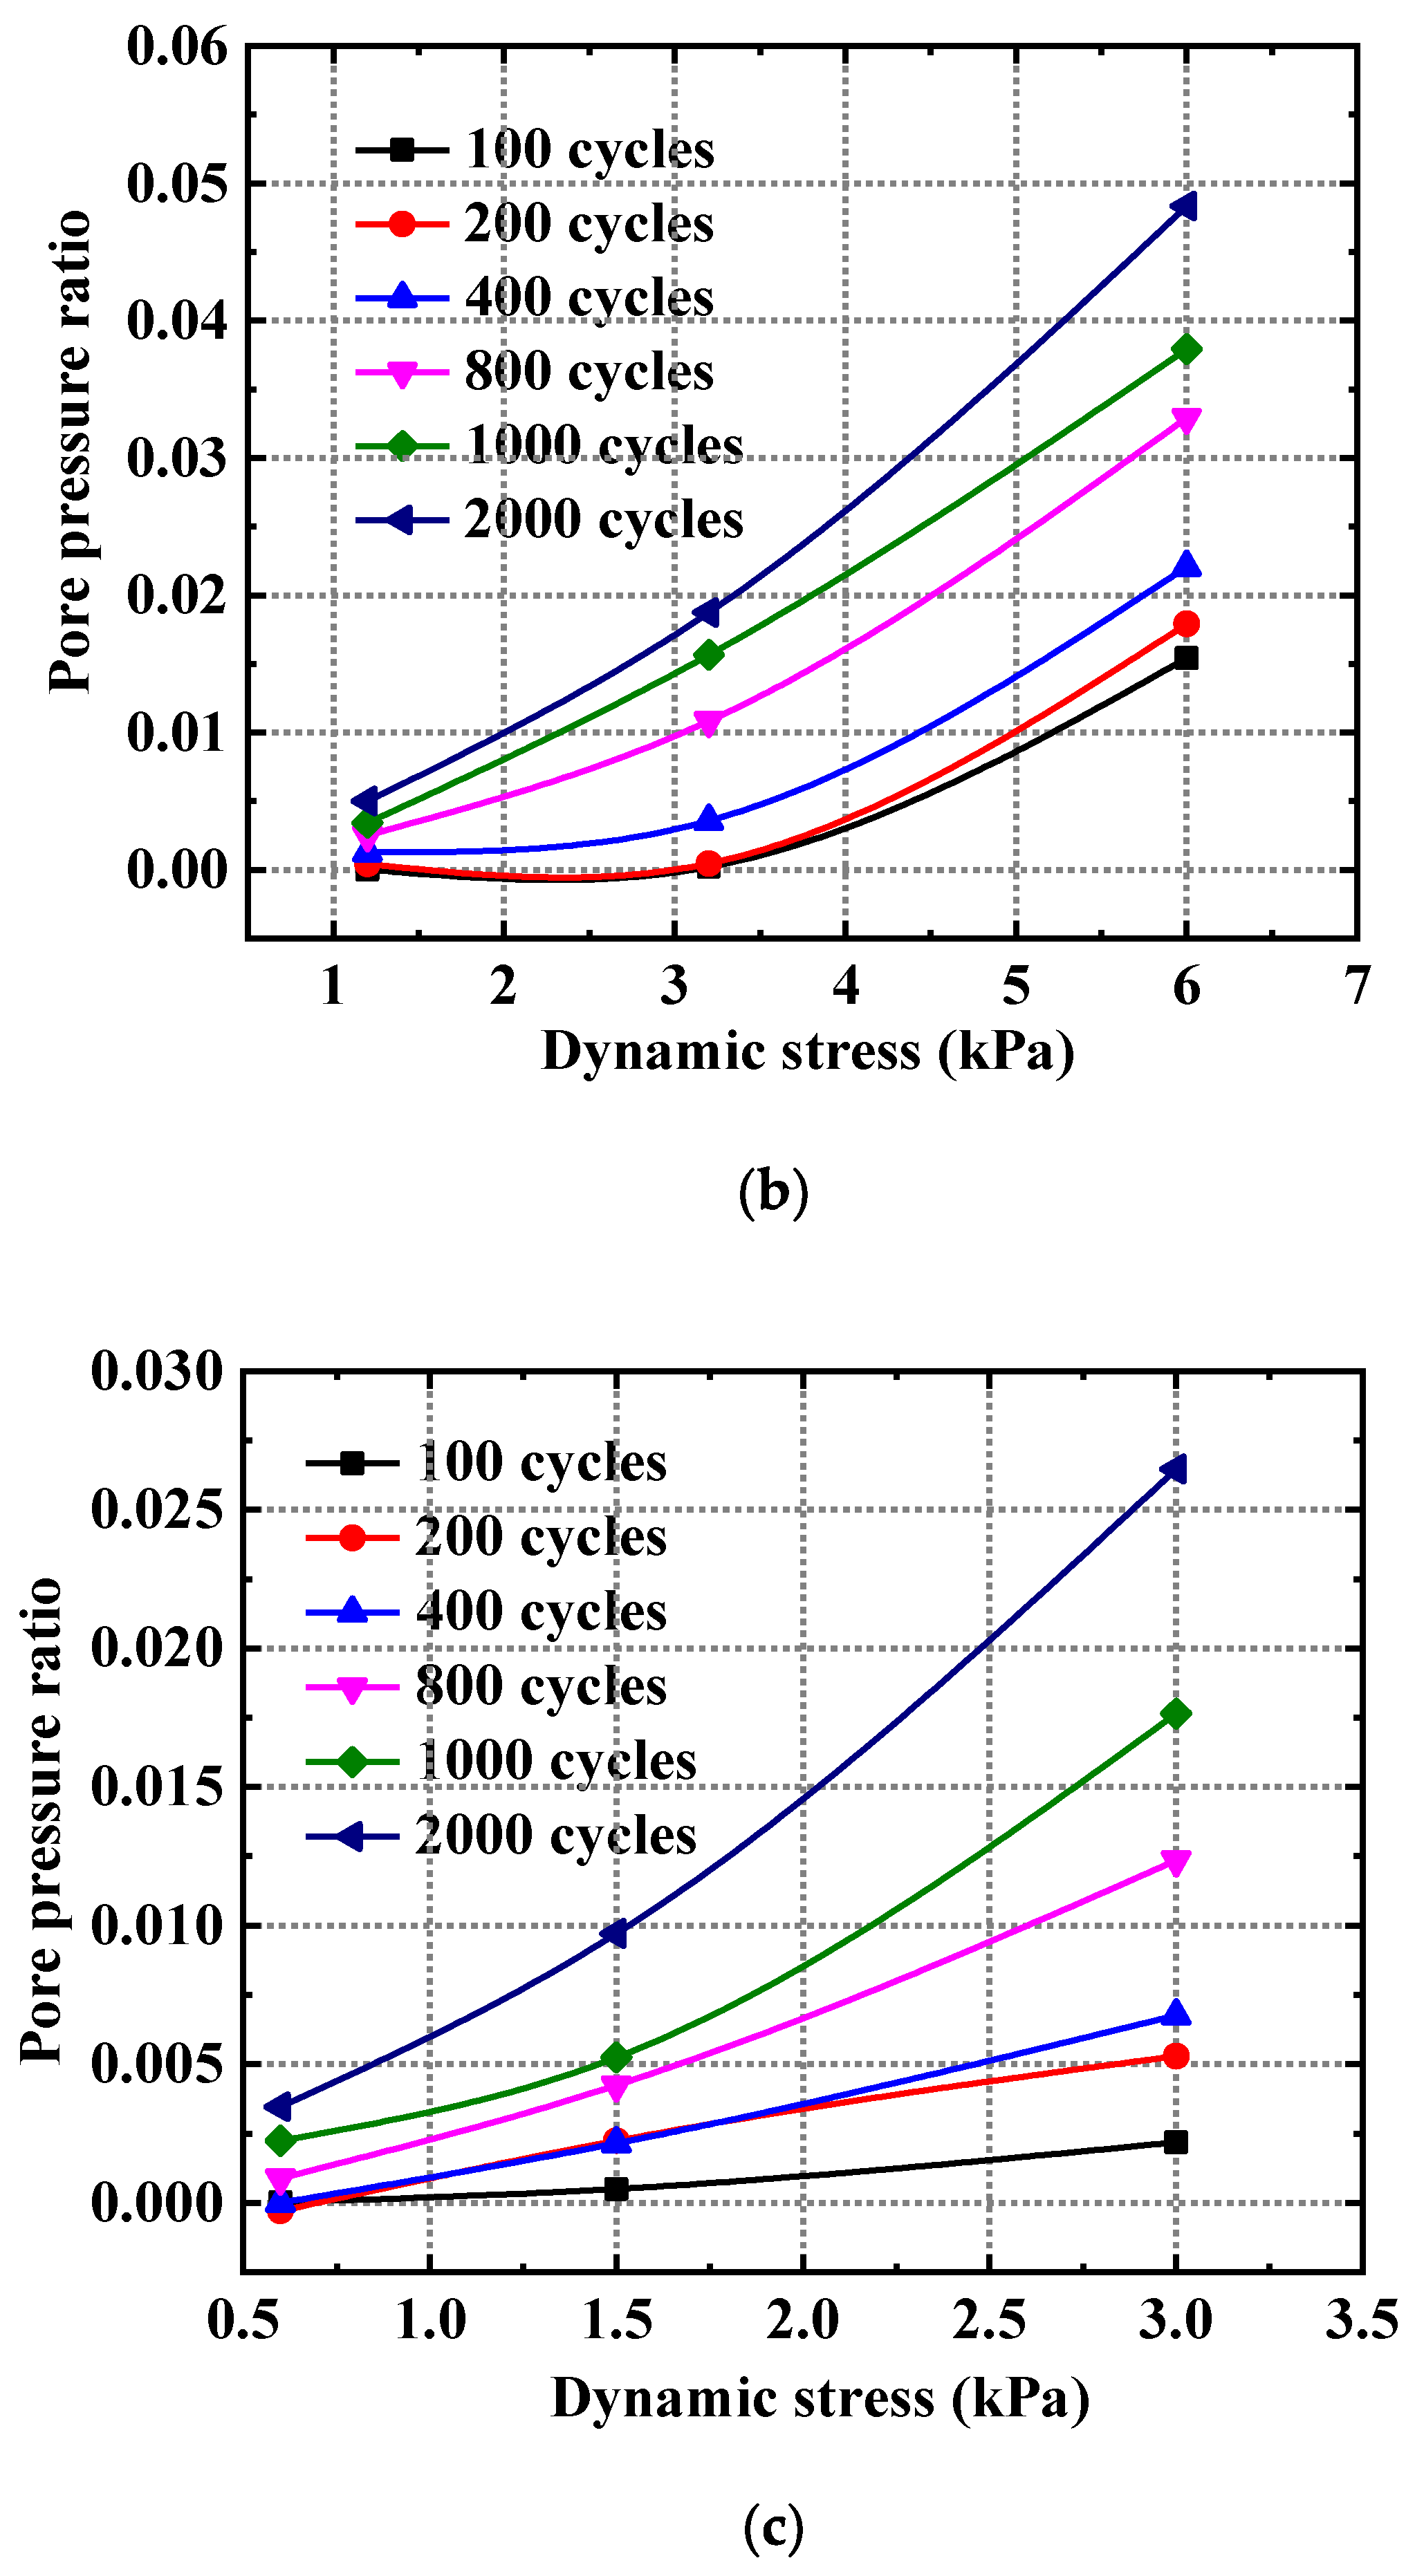
3.4.2. Influence Rule of Traffic-Load Amplitude on Pore-Water-Pressure Ratio

The variation rule of pore-water-pressure ratio under different traffic-load amplitudes at 0.5 m depth is shown in Figure 16. The pore-pressure ratio increases nonlinearly with the increase in dynamic stress. With the increase in dynamic load, the increased pore-water-pressure ratio presents an increasing trend. Therefore, the heavy load should be considered in constructing shallow pavement in the expressway-extension project.

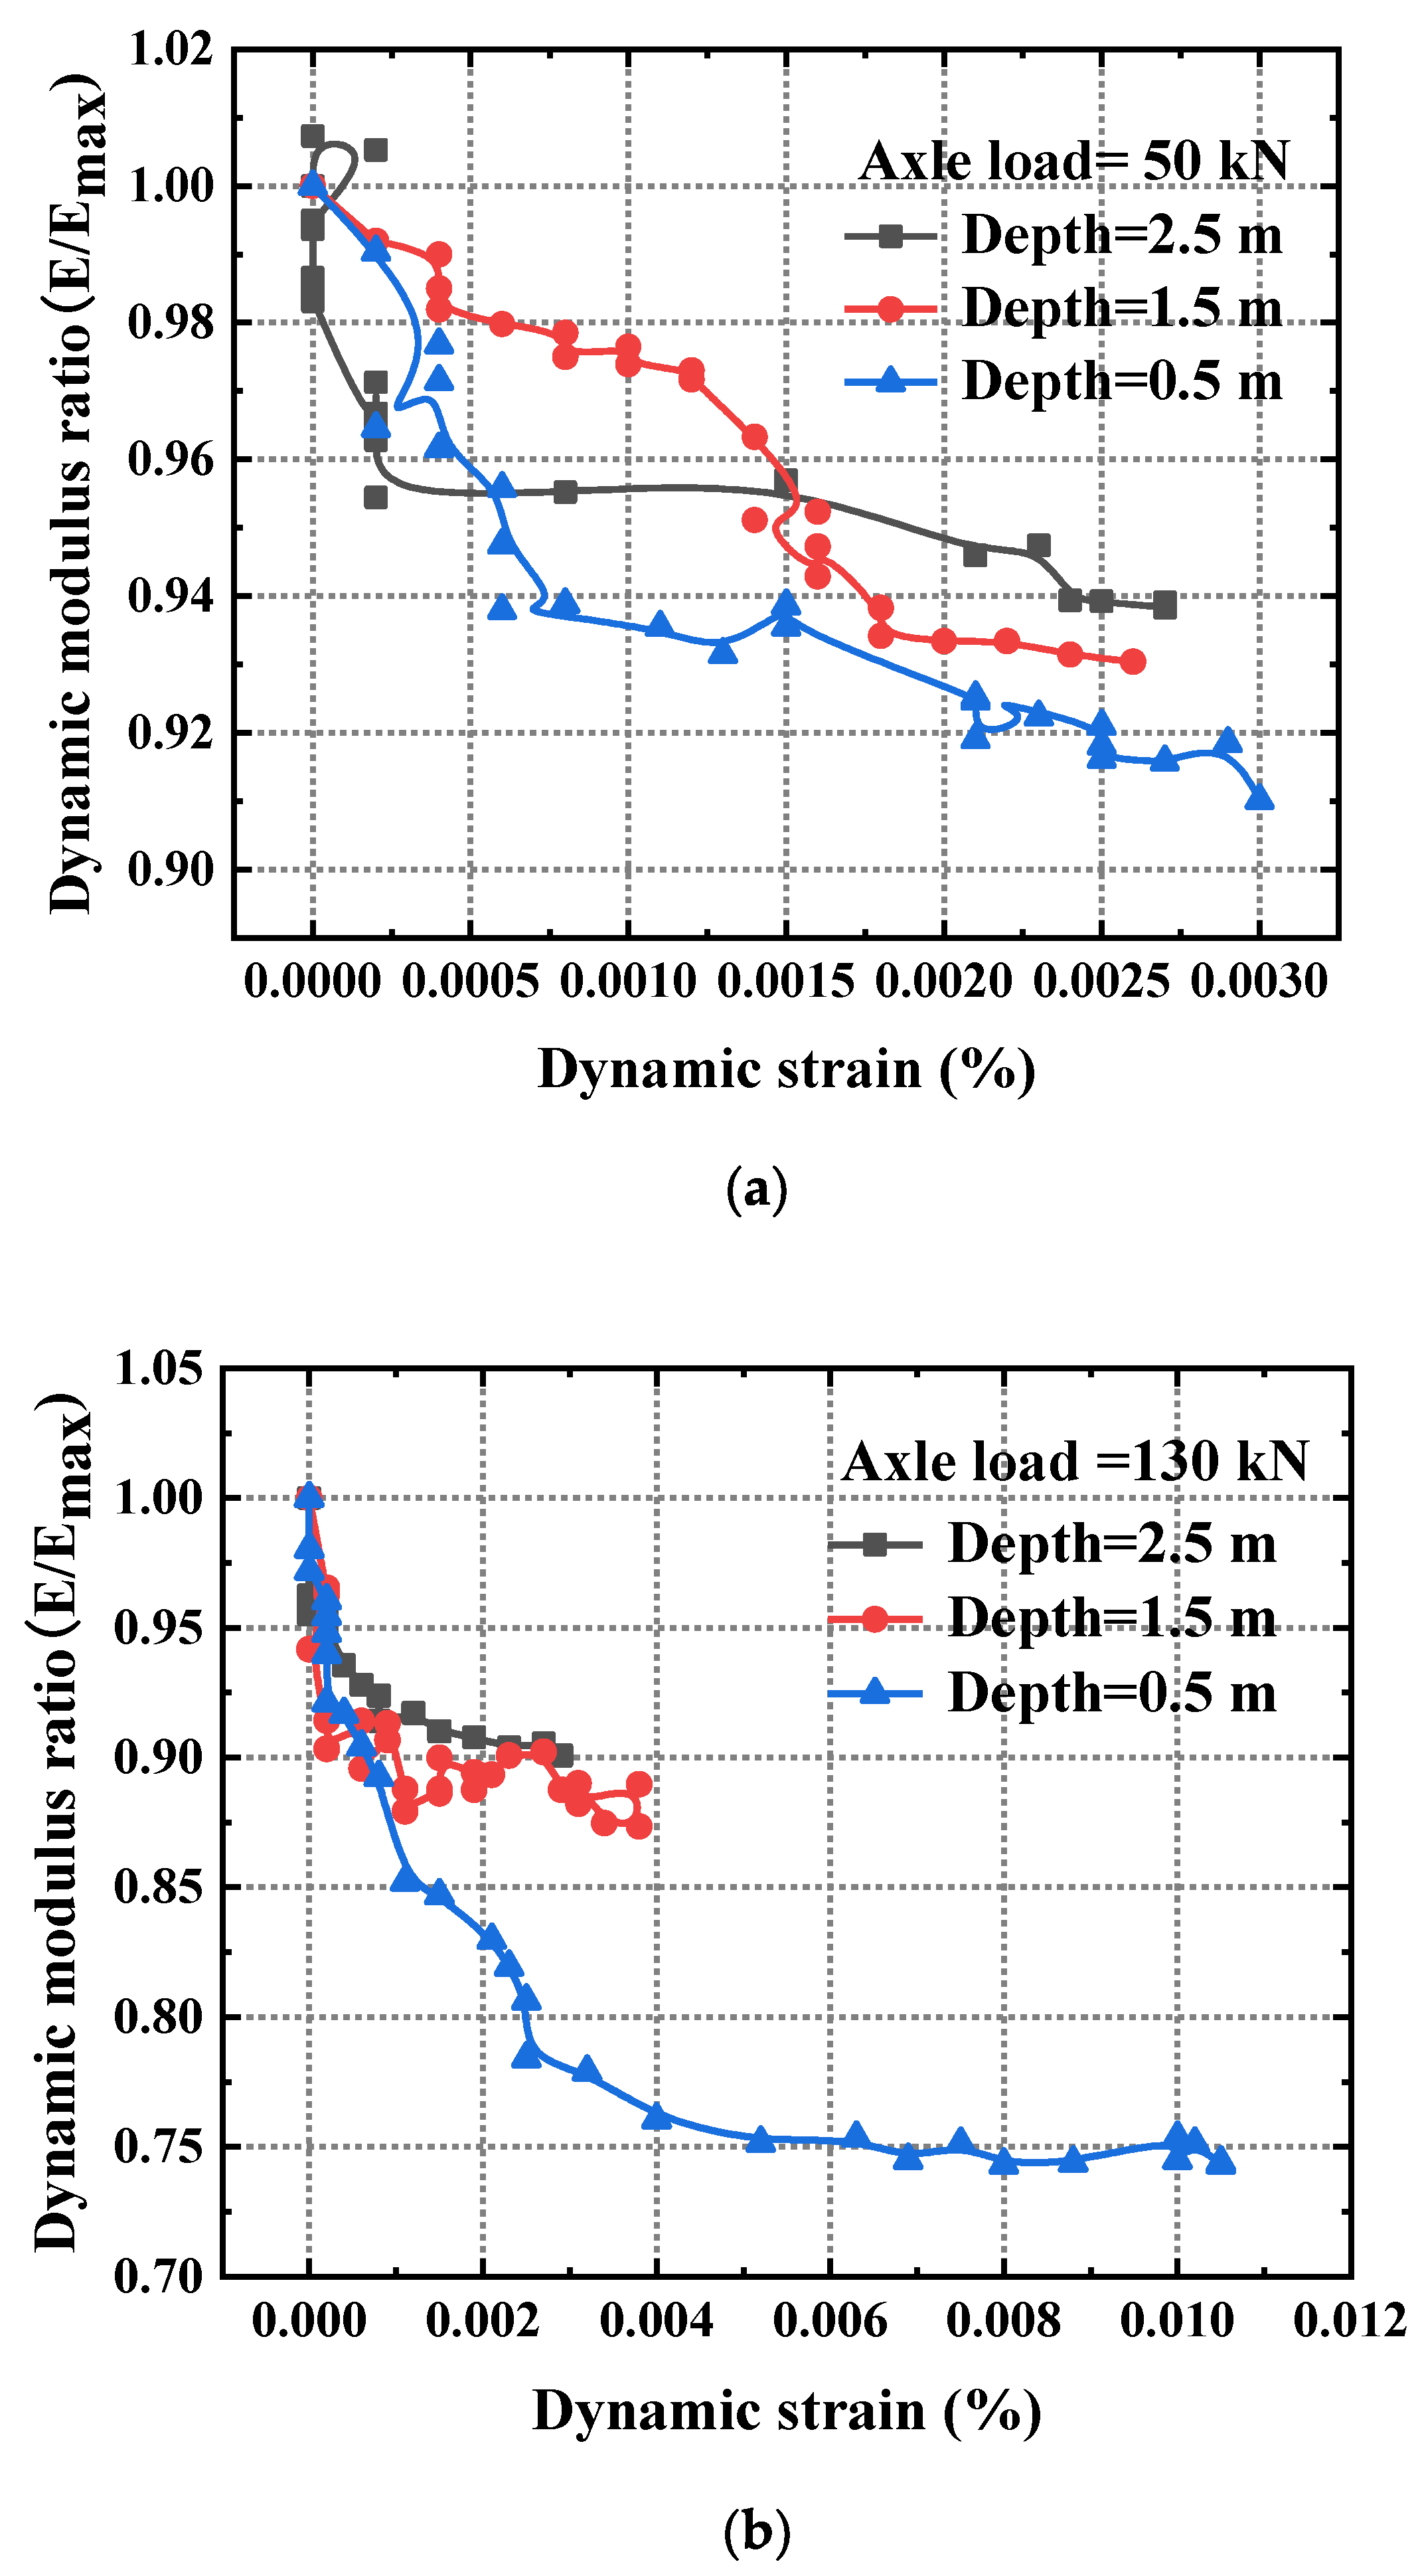
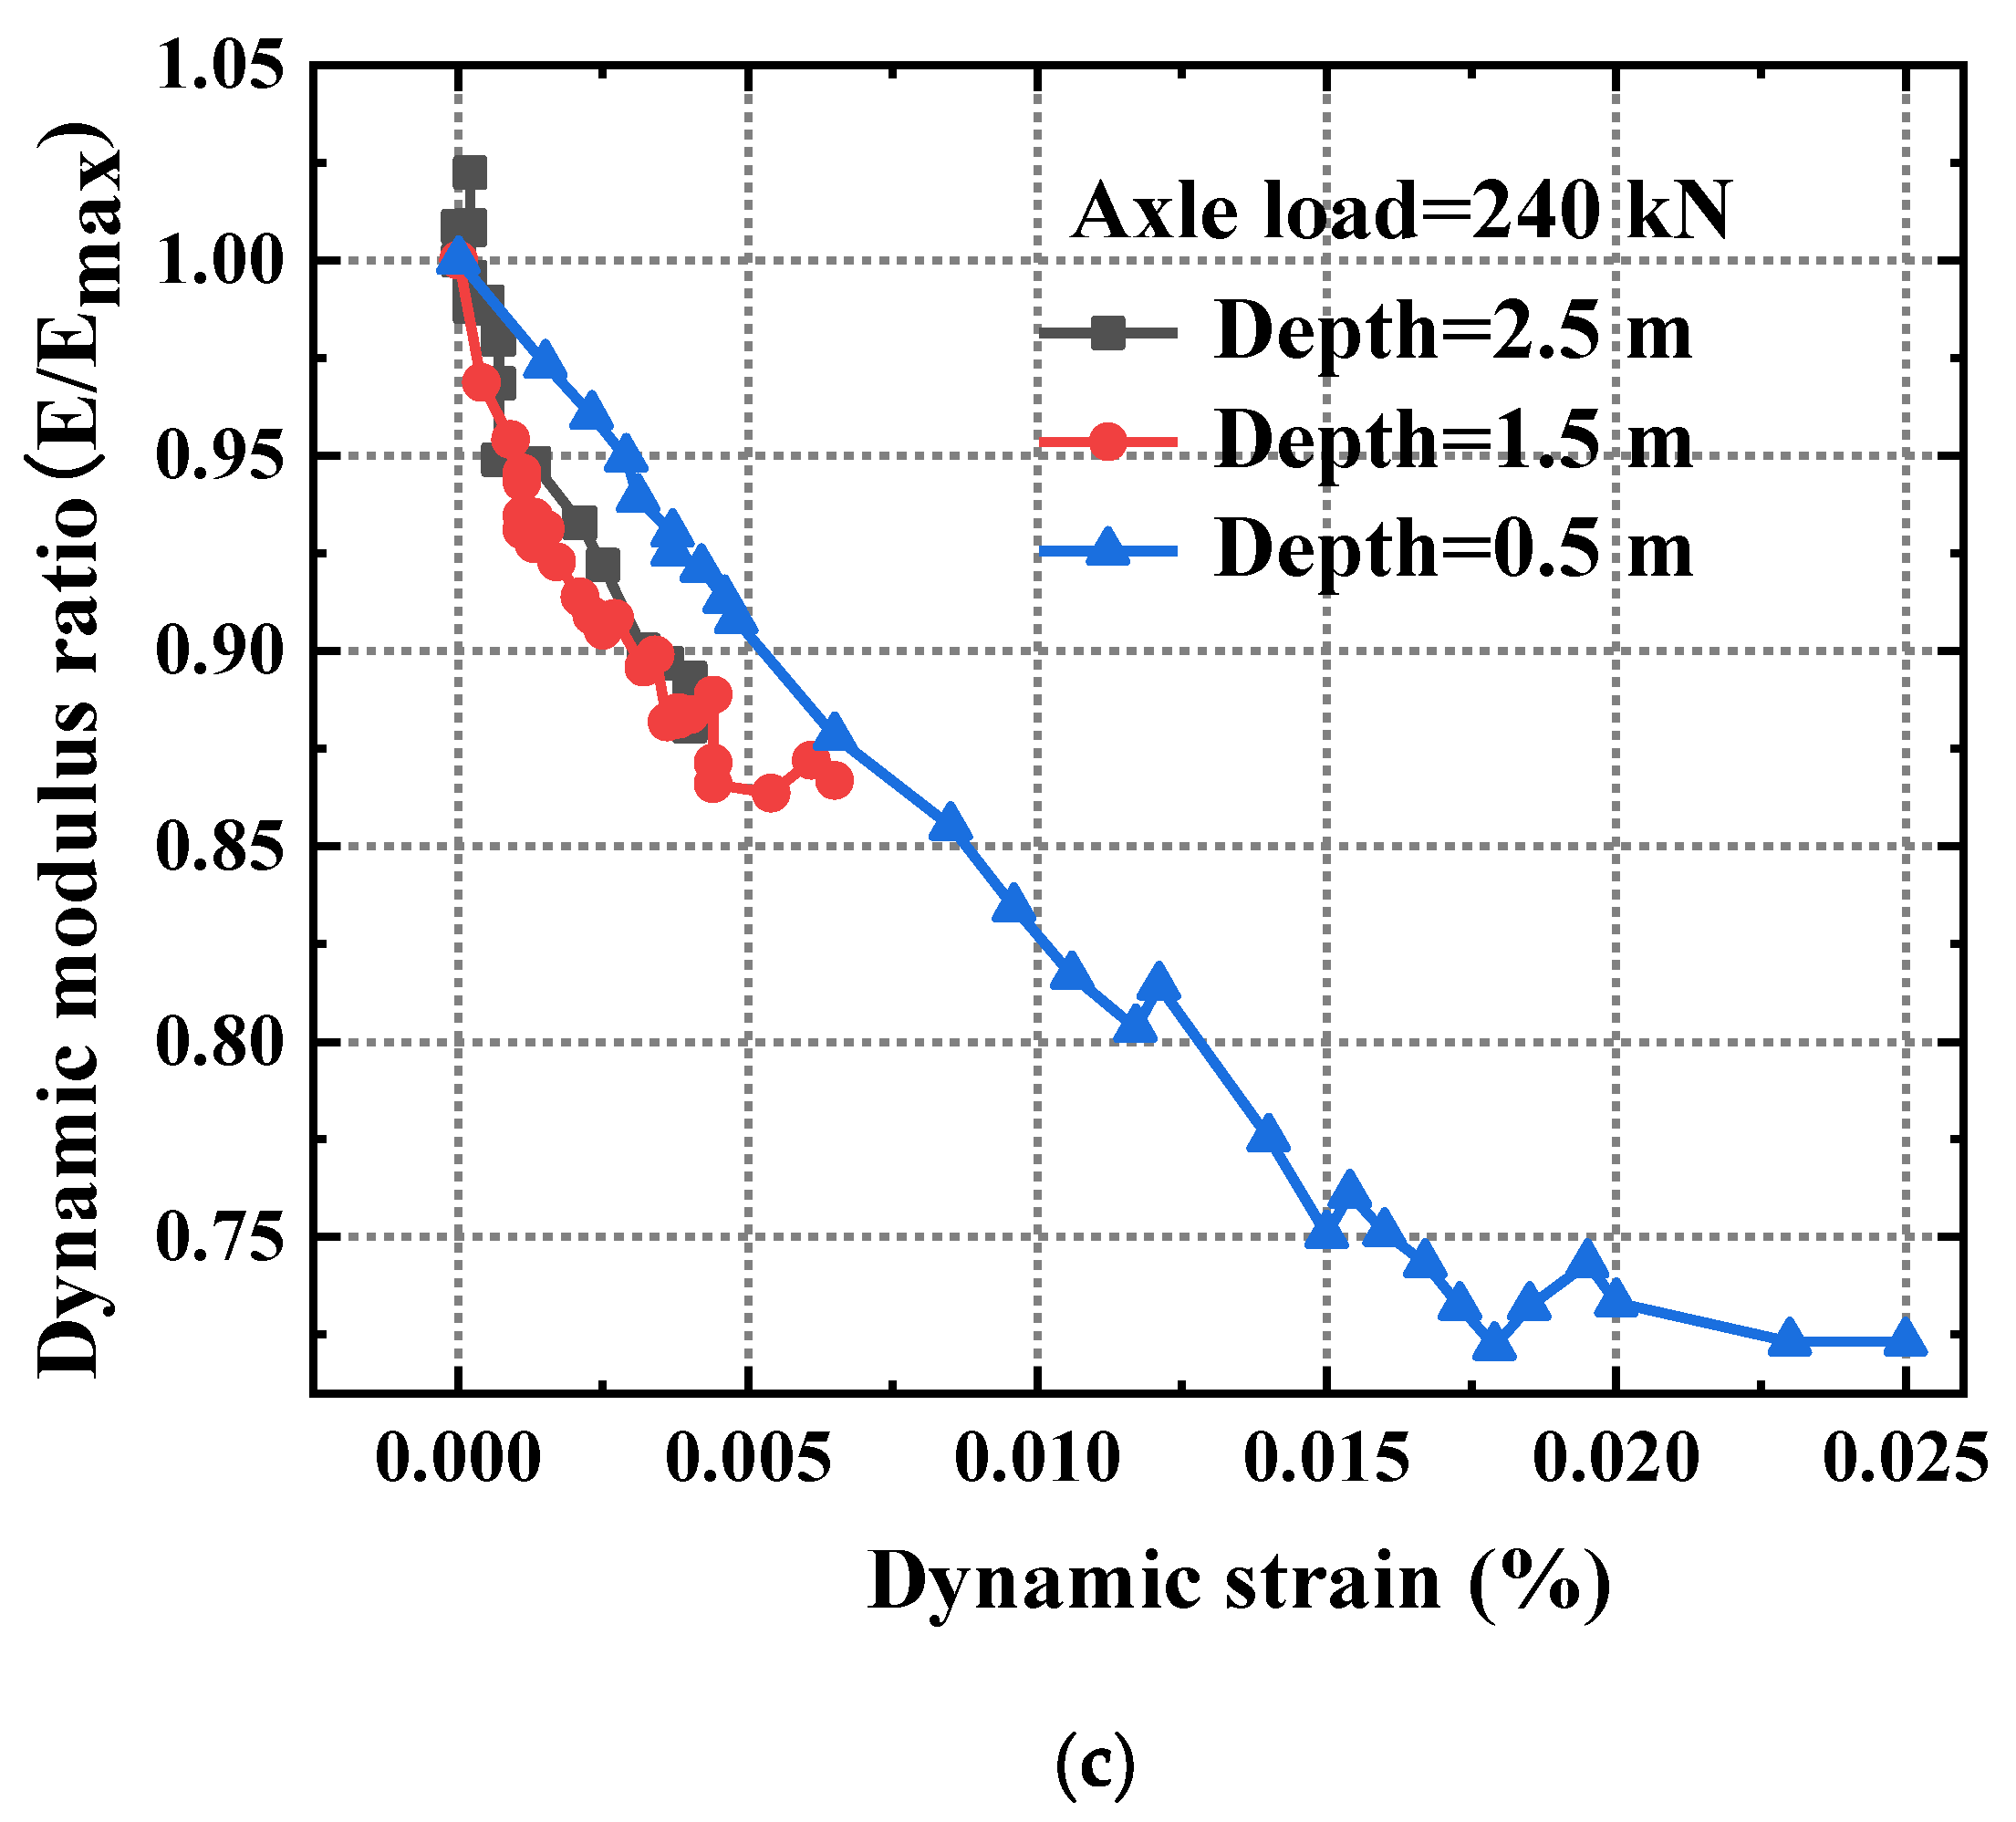
3.5. Attenuation Rule of Dynamic Modulus

Figure 17 shows the curve of dynamic modulus versus cumulative strain under different dynamic loads, and the normalized dynamic modulus ratio is E d / E max . It can be seen from the figure that the dynamic elastic modulus decreases with the increase in axial strain, and the curve shows a nonlinear change trend. The dynamic modulus decreases to about 80% of the total reduction at the initial loading stage when the soil sample produces a 20% strain variation. Then, the attenuation rate of the curve slows down until it reaches a stable state. The attenuation degree of the dynamic elastic modulus is inversely proportional to the buried depth of soil. The shallower the subgrade depth, the greater the attenuation amplitude of the dynamic modulus. Taking Figure 17a as an example: when the axle load = 50 kN, the dynamic-modulus ratios of 0.5 m, 1.5 m, and 2.5 m depth are 0.9102, 0.9304, and 0.9391, respectively, that is, the closer to the subgrade surface, the more pronounced the modulus reduction. The farther away from the pavement, the earlier the modulus reaches the stable stage, and the smaller the required strain.
There is a hyperbolic relationship between the dynamic-modulus ratio and the cumulative strain. The curve is fitted by Formula (2). The critical parameters of the hyperbolic model under test conditions can be obtained, as shown in Table 4.
σ d = ε d b + a ε d
where, σ d is the dynamic stress; ε d is the dynamic strain.

4. Numerical Calculation and Analysis of Subgrade Deformation

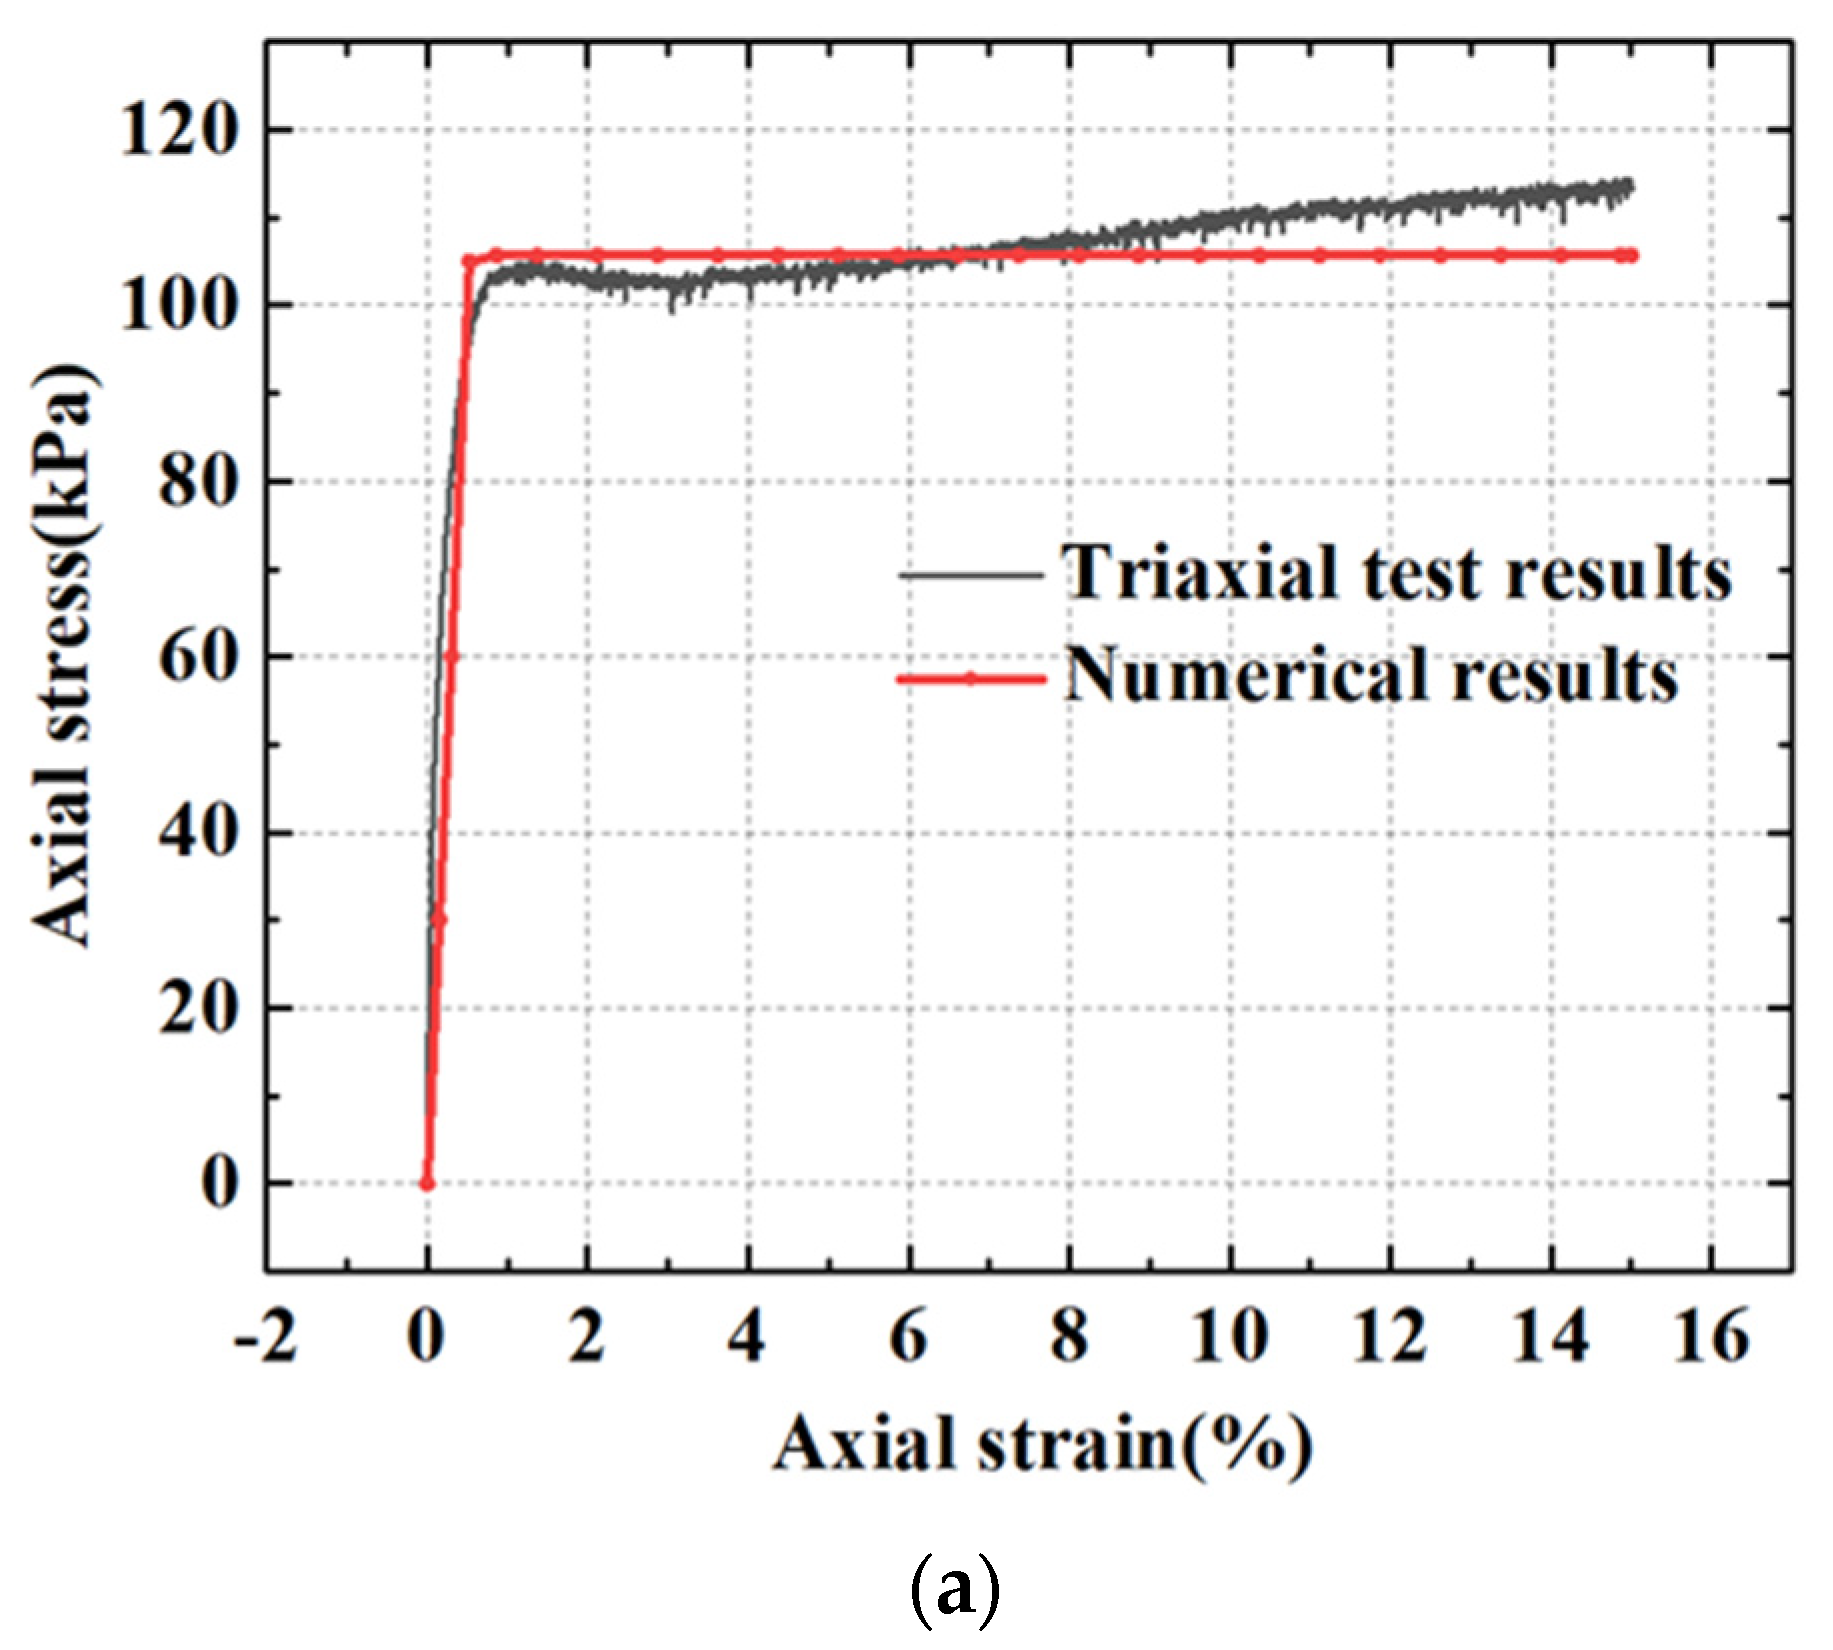
4.1. Validation of Numerical-Calculation Model

In order to ensure the accuracy of the numerical model, a numerical model based on the results of the triaxial test was established using ABAQUS in this section. The model size, modulus, load-application mode and other parameters are consistent with the triaxial test (see Figure 18).
The comparison between simulation calculation results and experimental results is shown in Figure 19. It can be seen from Figure 19a that an inflection point appears in both line segments around strain 1, and the corresponding ordinate-stress value at the inflection point is 105 kPa. It can be found that the fitting result of the two-line segments is better, as can be seen from Figure 19b. The variation of the stress–strain hysteresis loop is the same. The numerical error of strain variation between experimental and simulated results is only 4%. Therefore, ABAQUS can be used to analyze the differential settlement of the subgrade under the combined working conditions.

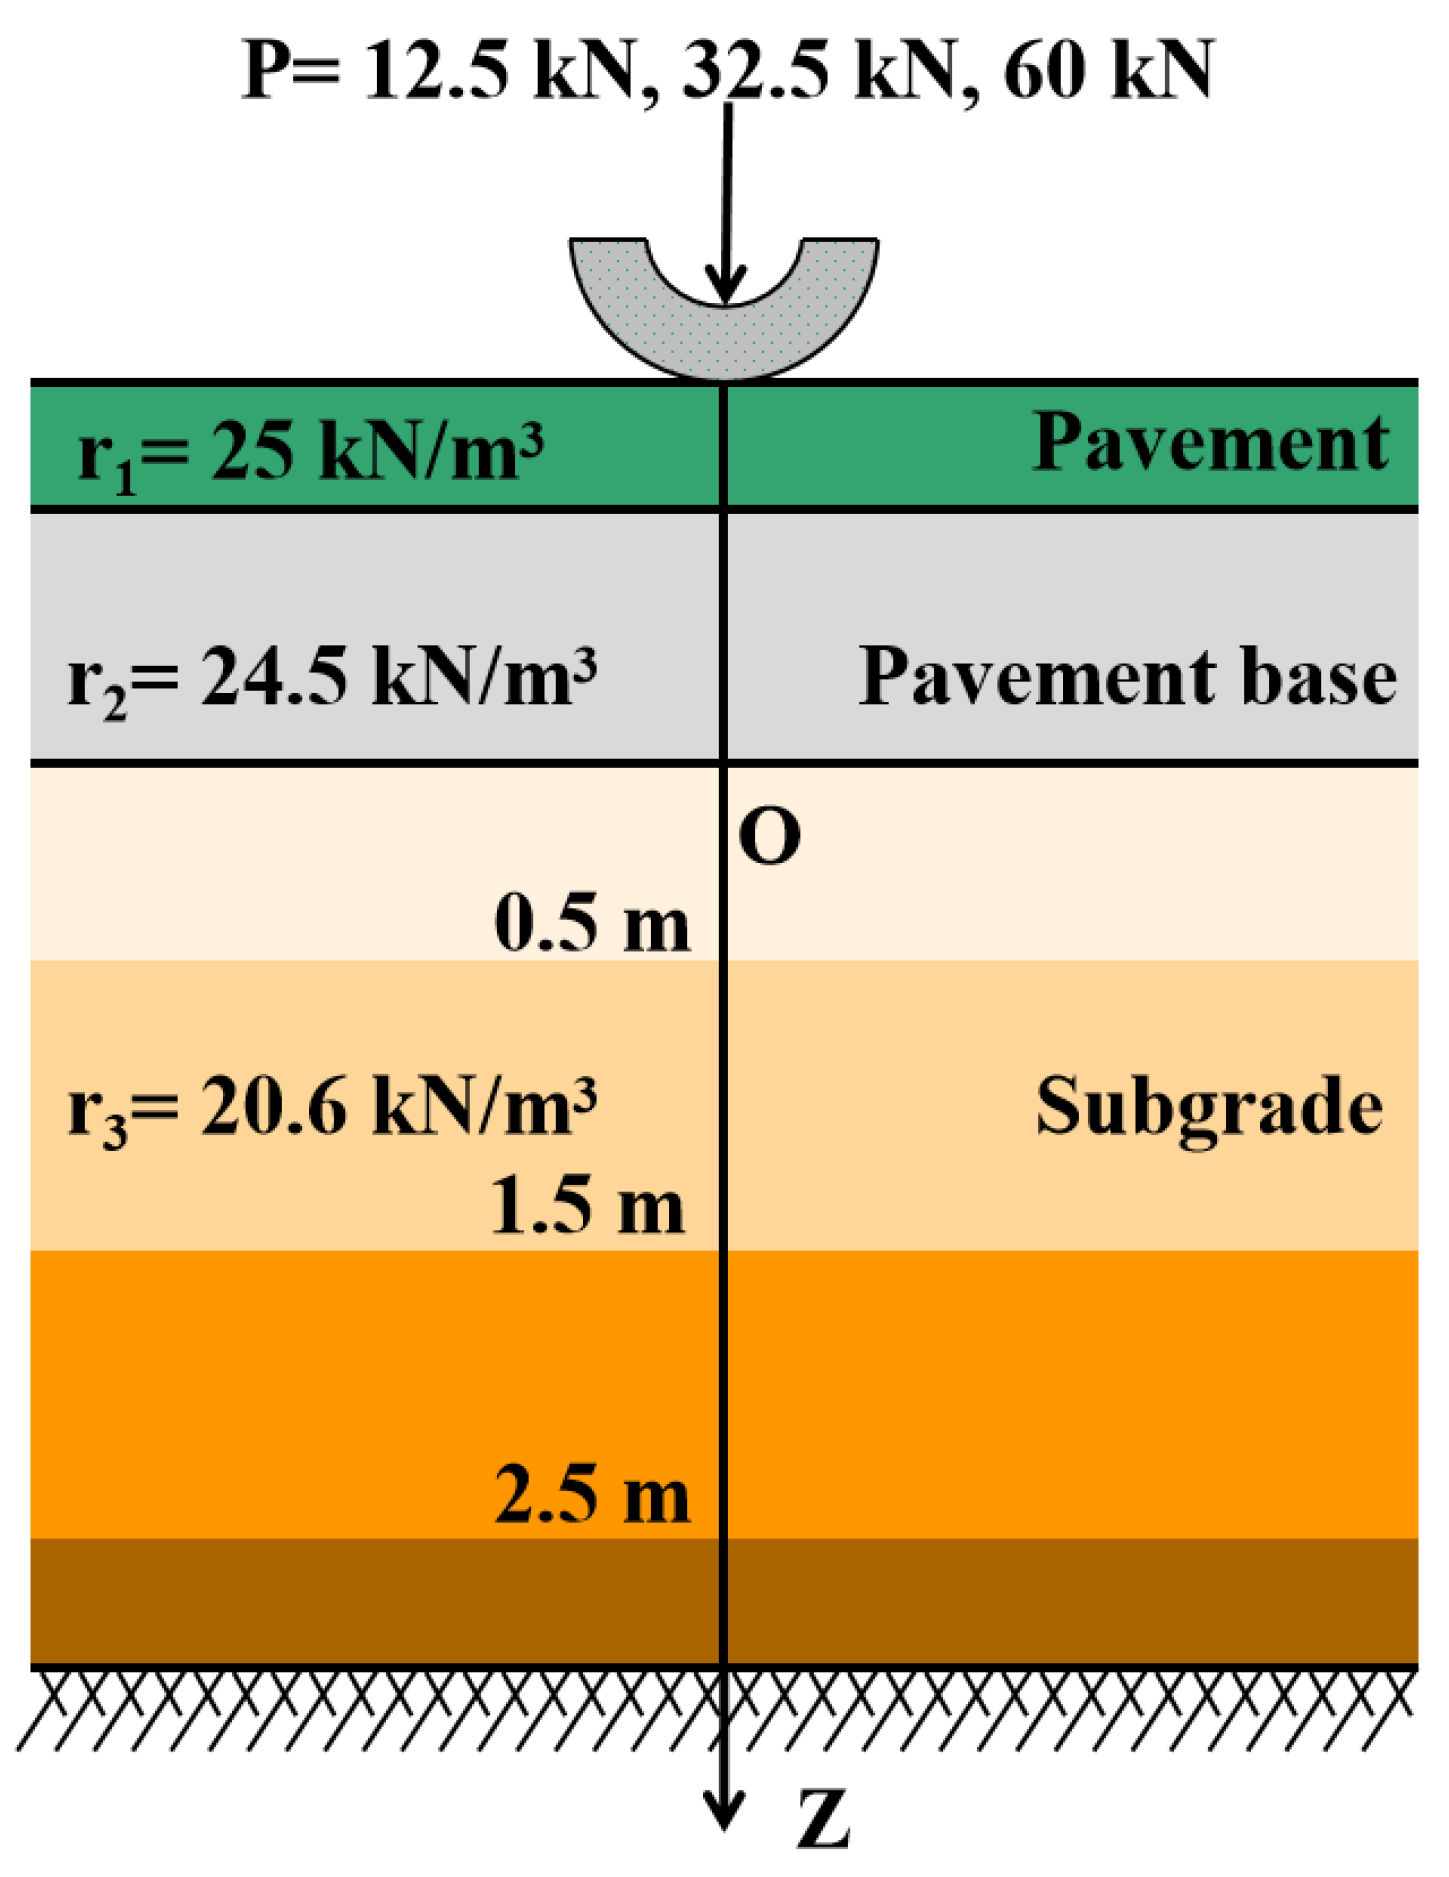
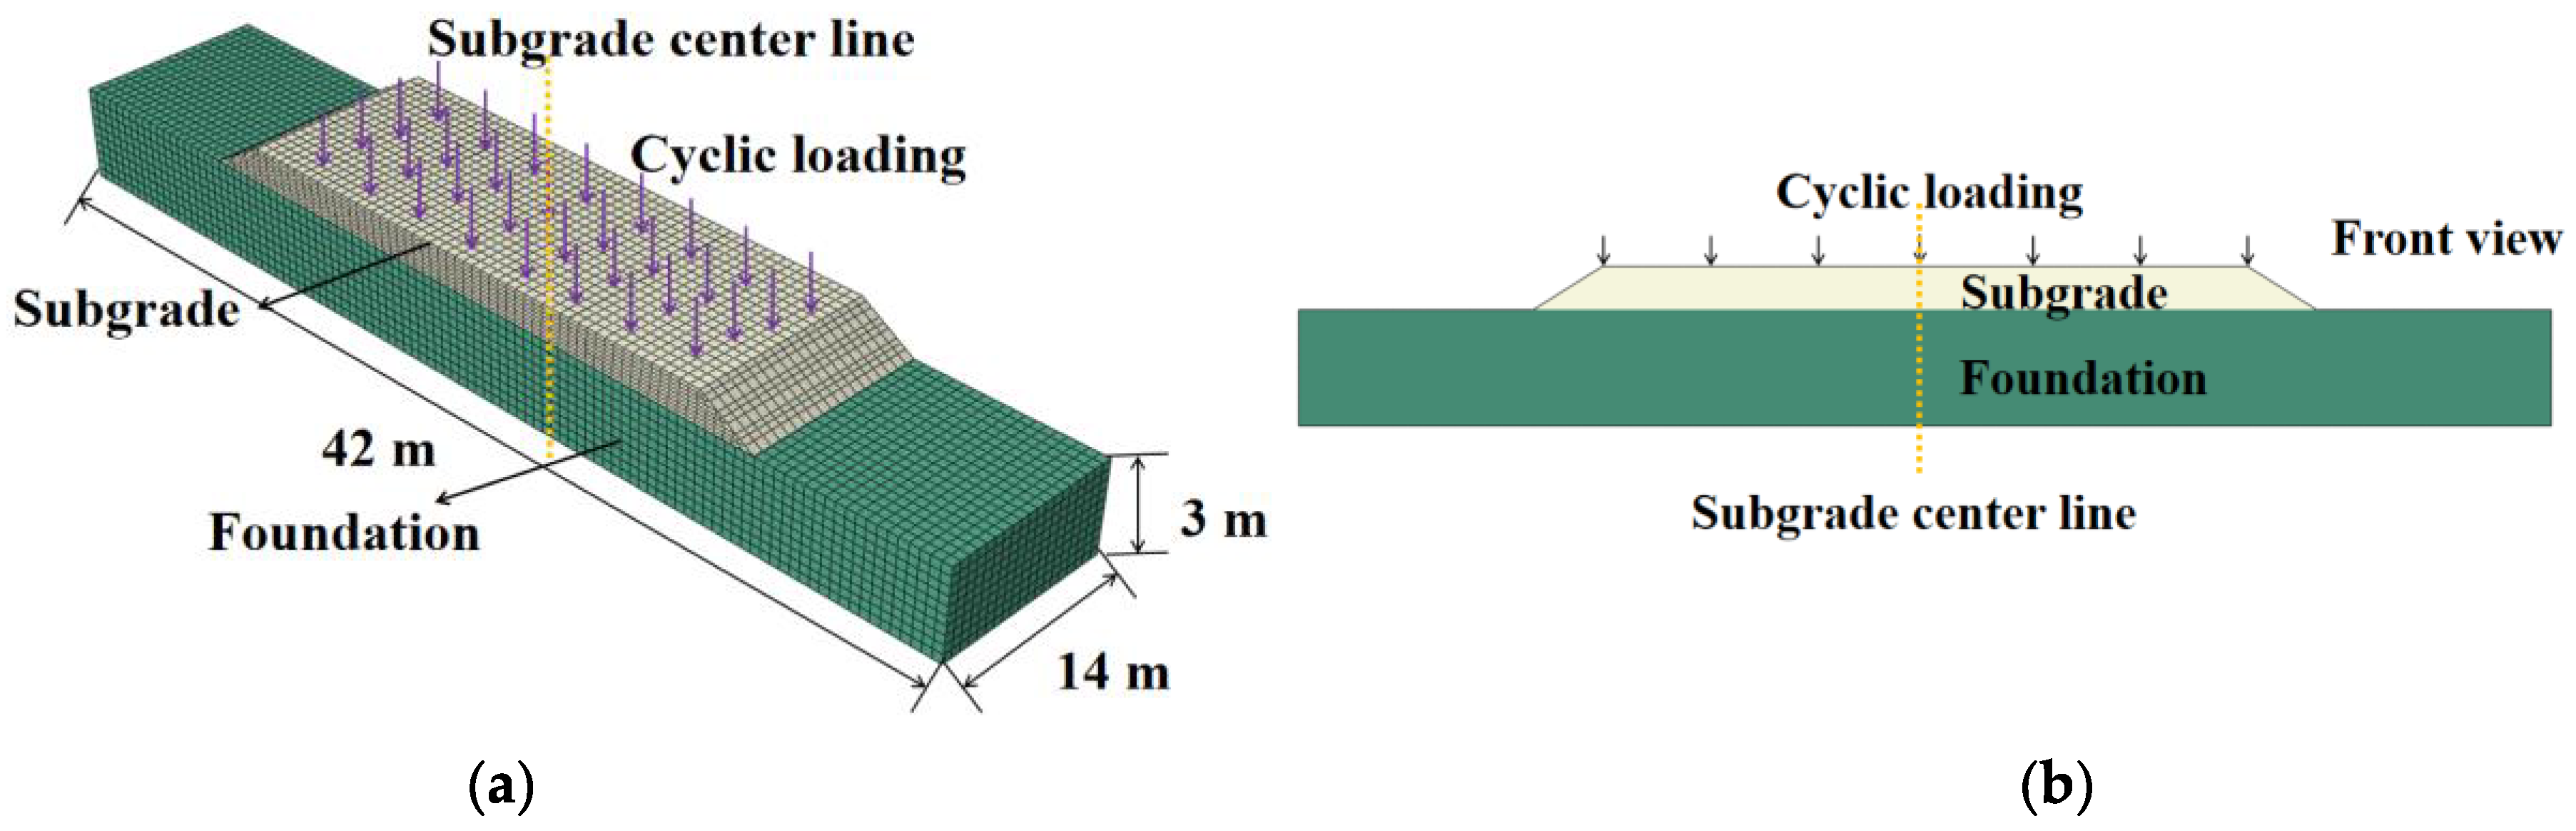
4.2. Numerical-Calculation Model

In this research, a 3D numerical-calculation model is established according to the design size of a two-way six-lane highway, as shown in Figure 20. The subgrade height is 3 m, the pavement width is 42 m, and the foundation thickness is 14 m. The finite-element mesh attributes are hexahedral and reduced linear elements (C3D8R), and the number of elements is 29,526. After mesh-convergence check, the model mesh convergence is good. The parameters of the numerical model are shown in Table 5. The load in the table is determined by axial-load spectrum, and the parameters of subgrade soil are measured by dynamic triaxial test in Section 2. The subgrade model’s bottom- and four-side-boundary conditions are set as displacement fixed-boundary conditions.
Moreover, the nonlinear relationship between the elastic modulus and strain level is reflected through modulus reduction. In the process of ABAQUS numerical simulation, material parameters can be set to change with the change in temperature or field variables, and the change in field variables can be controlled by modifying the model input file. According to the modulus-reduction curve drawn from the dynamic triaxial test results, the elastic modulus and shear modulus are defined as parameters that vary with the field variable, and the condition is added that the modulus decreases with the number of vibrations.

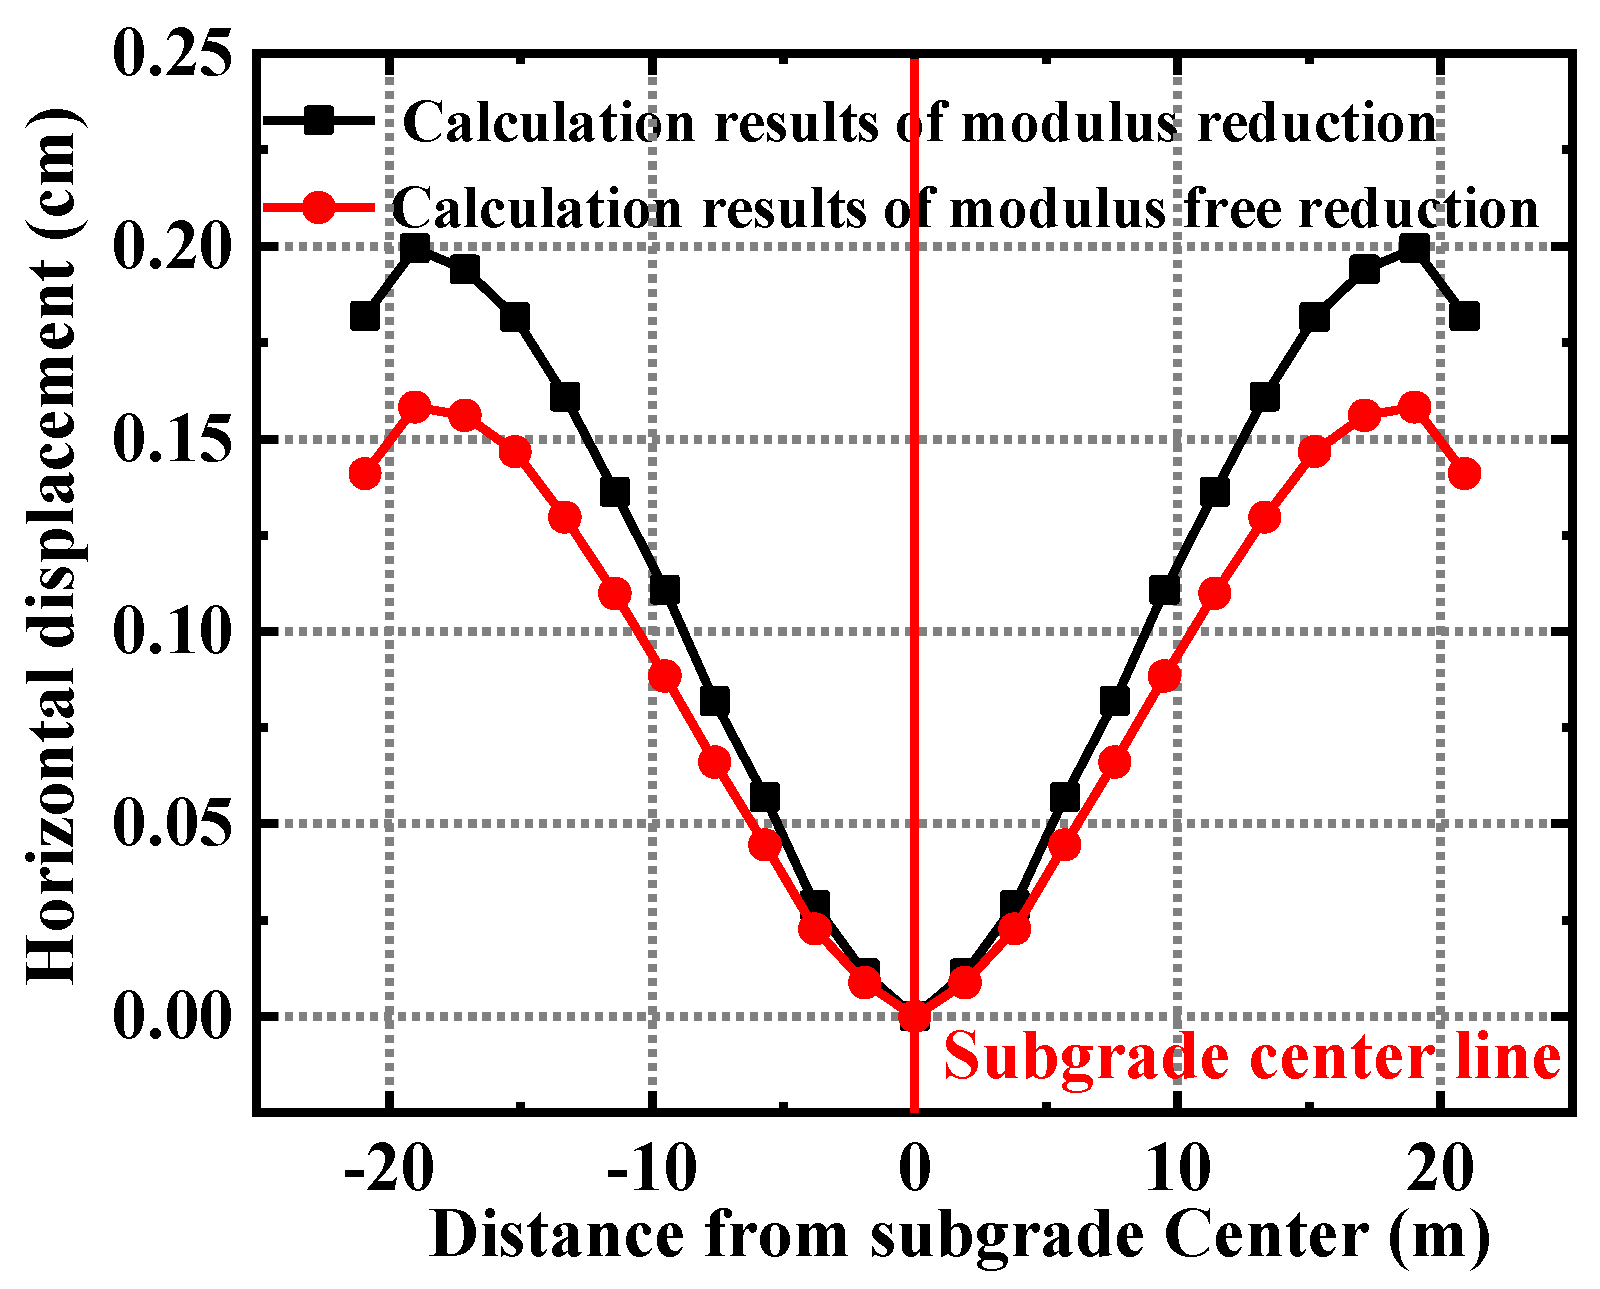
4.3. Subgrade Horizontal Displacement

The rule of horizontal displacement along the subgrade surface is shown in Figure 21. As the distance from the center of the roadbed increases, the horizontal deformation of the roadbed surface first increases and then decreases. The maximum value appears at the edge of the roadbed, about 0.2 cm. The increasing phase is approximately a linear increase.

4.4. Subgrade Vertical Displacement

The rule of vertical displacement along the subgrade surface is shown in Figure 22. As the distance from the center of the subgrade increases, the vertical deformation of the roadbed surface shows a nonlinear decreasing trend, and the maximum value appears at the center of the roadbed, about 1.45 cm. The vertical displacement of the subgrade surface at the edge will decrease sharply.

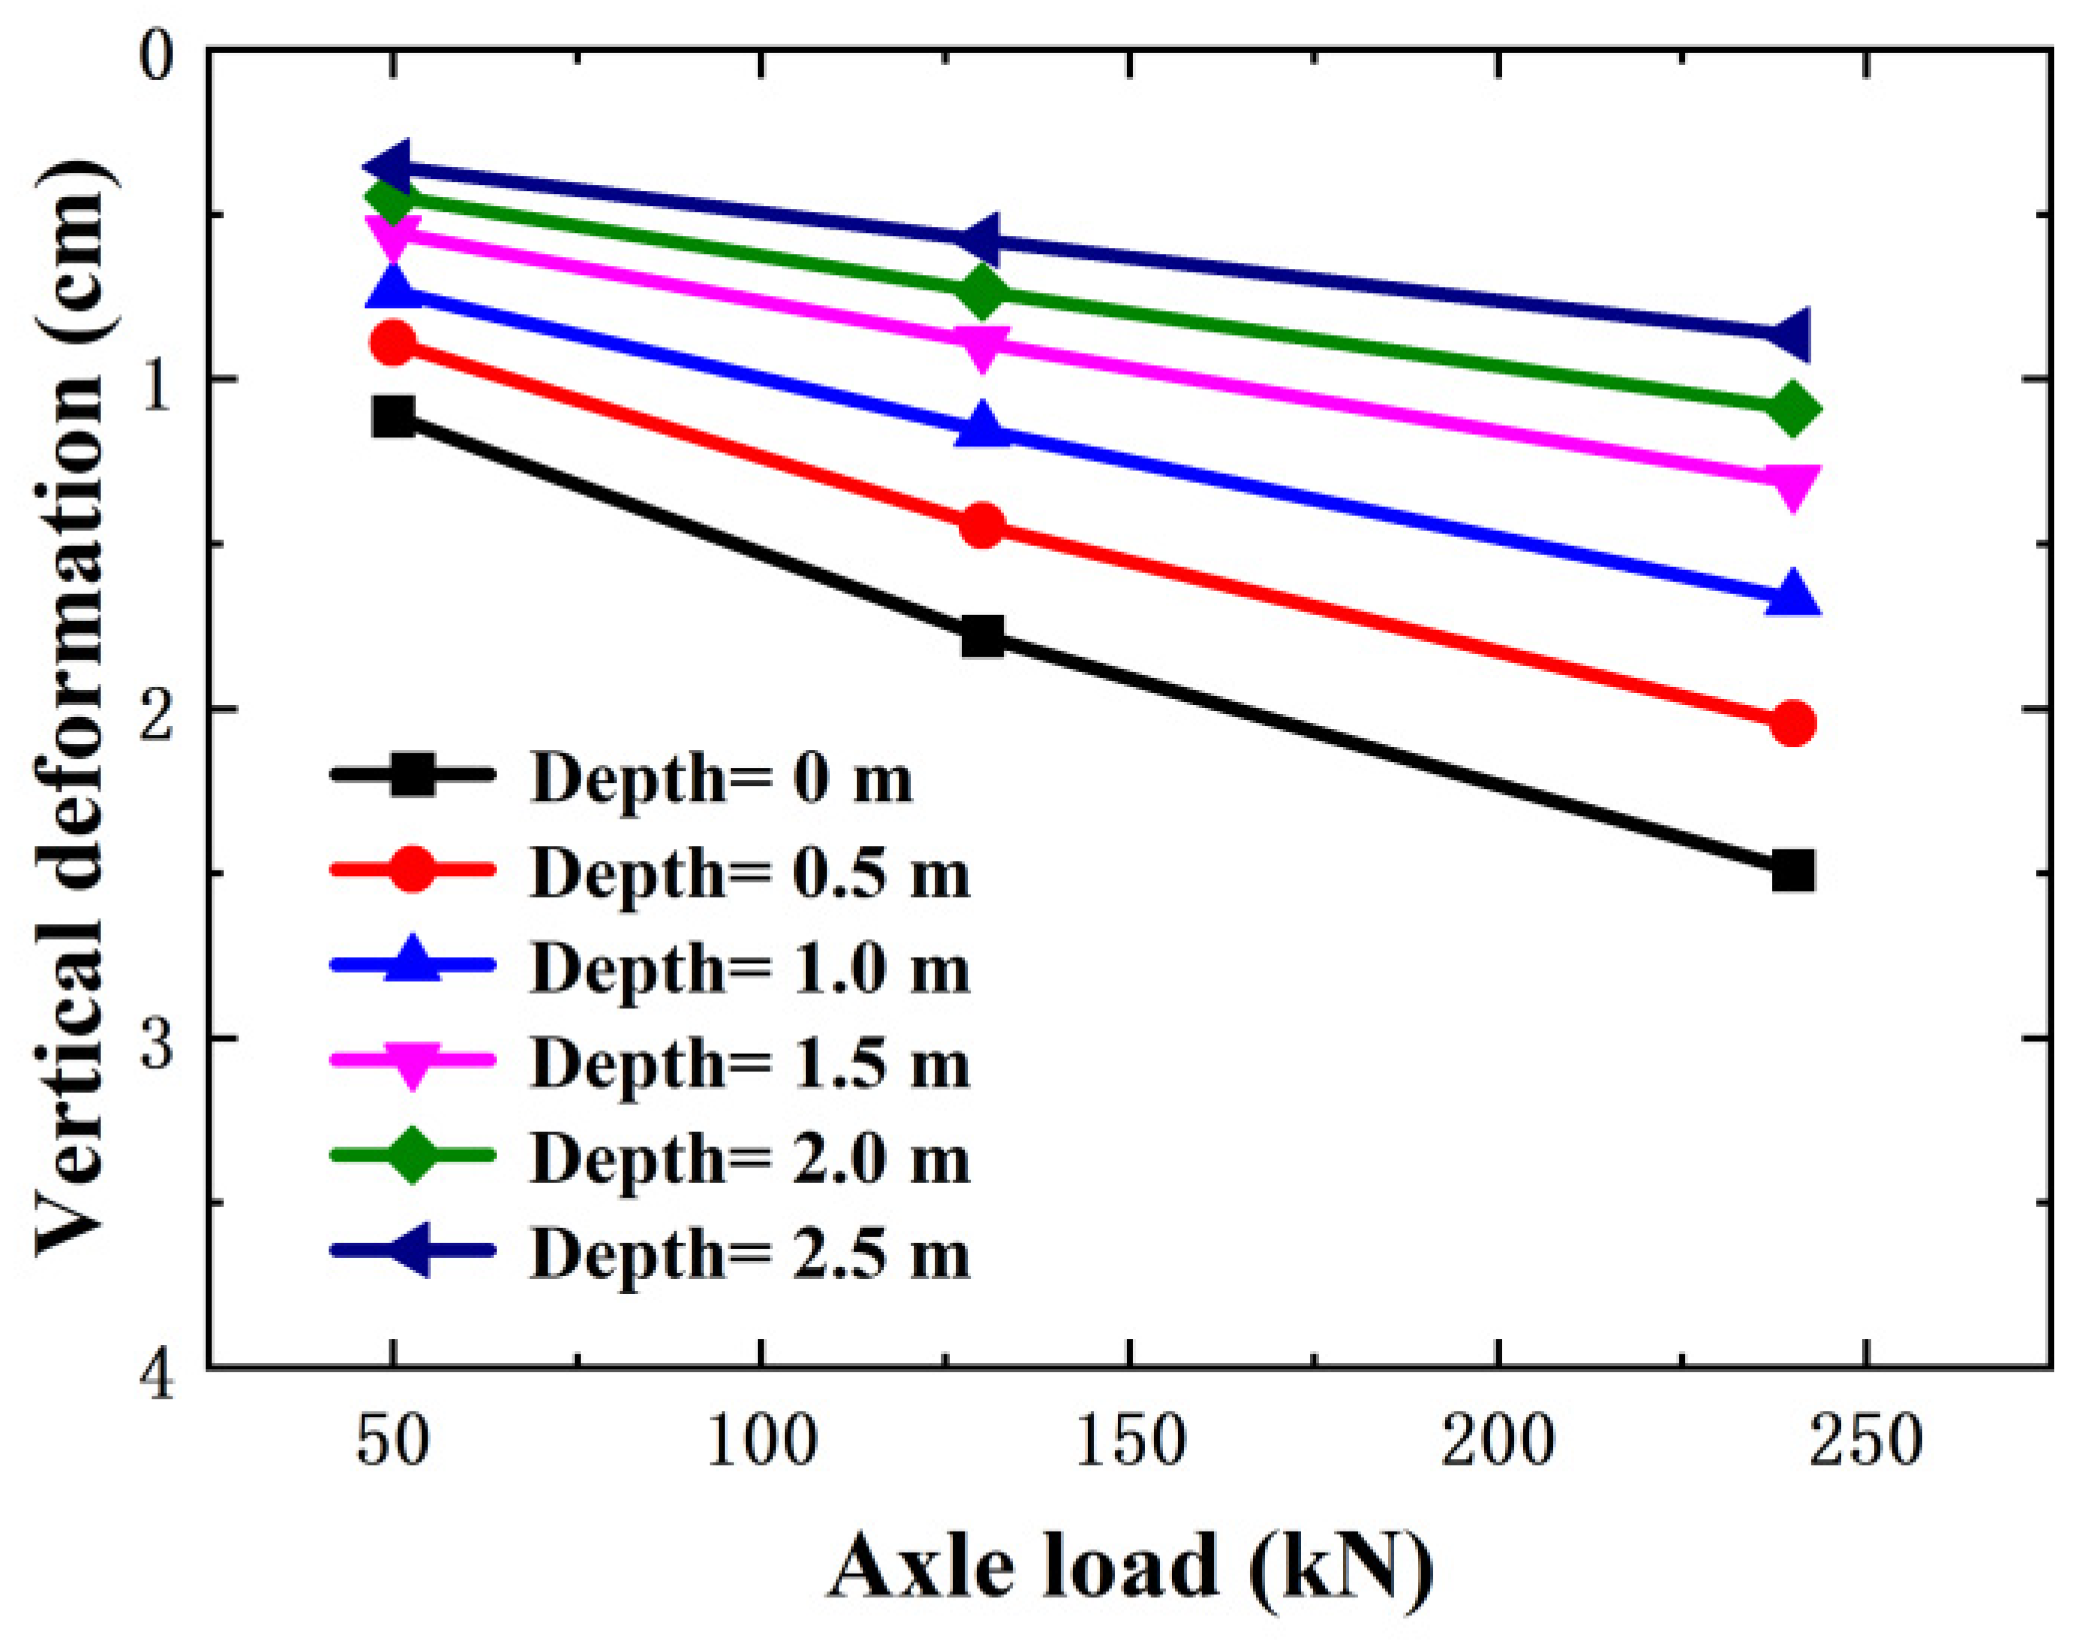
4.5. Impact of Traffic Load

Three traffic loads are applied in the numerical calculation according to test conditions. It can be seen from Figure 23 that in any depth range of new and old roadbed, the relationship between vertical displacement and traffic load is a roughly linear distribution. The settlement of roadbeds increases exponentially with the increase in traffic load. The closer the distance is to the new and old subgrade pavement, the higher the slope of the settlement curve is, the more strongly affected by the traffic load, which also verifies the test conclusion. This rule also verified by Cui’s model test [22].

5. Conclusions

As the main bearing layer of road engineering, highway subgrade bears millions of traffic loads over the years, and its strength, stiffness, and long-term stability gradually decline. In this paper, the dynamic triaxial test is carried out to study the time evolution and spatial distribution of strain and pore pressure of highway-subgrade soil under the action of traffic load. The influence of vehicle-axle load on subgrade deformation is analyzed. The numerical calculation model of the subgrade is established. The deformation characteristics of subgrade under traffic load are analyzed. The main conclusions can be drawn as follows:
(1)
The cumulative strain and pore-water pressure of subgrade soil show a nonlinear growth trend under the action of traffic load. With the increase in loading times, the cumulative strain and pore pressure can be roughly divided into three stages: rapid growth, slow growth, and equilibrium.
(2)
The influence of traffic load on the cumulative strain and pore-water pressure of subgrade soil decreases rapidly with the increase in depth. The cumulative strain and pore-water-pressure ratio at a depth of 2.5 m is only one-seventh that of 0.5 m subgrade soil.
(3)
The amplitude of traffic load significantly influences the strain and pore pressure of subgrade soil, especially for shallow subgrade. We should pay more attention to the shallow subgrade of the expressway with a large axle load.
(4)
As the distance from the subgrade surface increases, the maximum deformation appears at the edge of the subgrade.

Author Contributions

Conceptualization, H.Q. and X.Z.; methodology, H.Q. and J.L.; software, G.L.; validation, J.L.; formal analysis, Q.X.; investigation, X.Z.; resources, Q.X.; data curation, G.L.; writing—original draft preparation, L.C.; writing—review and editing, L.C. and T.Z.; visualization, X.Z. and G.L.; supervision, J.L. and T.Z.; project administration, Q.X.; funding acquisition, H.Q. All authors have read and agreed to the published version of the manuscript.

Funding

This work was supported by Science and Technology Plan of Shandong Transportation Department (No. 2019B48), the Youth Foundation of Shandong Natural Science Foundation of China (ZR2021QE279), the Shandong Key Research and Development Plan (2019JZZY010429) and the Shandong Key Research and Development Plan (2019GSF111040).

Institutional Review Board Statement

Not applicable.

Informed Consent Statement

Not applicable.

Data Availability Statement

The data used to support the findings of this study are included within the article. Any additional data related to the paper may be requested from the corresponding author.

Conflicts of Interest

The authors declare no conflict of interest.

References

  1. Lekarp, F.; Dawson, A. Modelling permanent deformation behaviour of unbound granular materials. Constr. Build. Mater. 1998, 12, 9–18. [Google Scholar] [CrossRef]
  2. Werkmeister, S.; Dawson, A.R.; Wellner, F. Permanent Deformation Behavior of Granular Materials and the Shakedown Concept. Transp. Res. Rec. 2001, 1757, 75–81. [Google Scholar] [CrossRef] [Green Version]
  3. Pérez, I.P.; Romana, M.; Romana, L.M. Permanent deformation models for a granular material used in road pavements. Constr. Build. Mater. 2006, 20, 790–800. [Google Scholar] [CrossRef] [Green Version]
  4. Nagula, S.S.; Robinson, R.G.; Krishnan, J.M. Mechanical Characterization of Pavement Granular Materials Using Hardening Soil Model. Int. J. Geomech. 2018, 18, 4018157. [Google Scholar] [CrossRef]
  5. Jing, P.; Nowamooz, H.; Chazallon, C. Permanent deformation behaviour of a granular material used in low-traffic pavements. Road Mater. Pavement Des. 2018, 19, 289–314. [Google Scholar] [CrossRef]
  6. Cai, Y.; Zhao, L.; Cao, Z.; Gu, C. Experimental study on dynamic characteristics of unbound granular materials under cyclic loading with different frequencies. Chin. J. Rock Mech. Eng. 2017, 36, 1238–1246. [Google Scholar]
  7. Inam, A.; Ishikawa, T.; Miura, S. Effect of principal stress axis rotation on cyclic plastic deformation characteristics of unsaturated base course material. Soils Found. 2012, 52, 465–480. [Google Scholar] [CrossRef] [Green Version]
  8. Azam, A.M.; Cameron, D.A.; Rahman, M.M. Permanent Strain of Unsaturated Unbound Granular Materials from Construction and Demolition Waste. J. Mater. Civ. Eng. 2015, 27, 4014125. [Google Scholar] [CrossRef]
  9. Rahman, M.S.; Erlingsson, S. Moisture influence on the resilient deformation behaviour of unbound granular materials. Int. J. Pavement Eng. 2016, 17, 763–775. [Google Scholar] [CrossRef]
  10. Lv, X.; Chi, S.; Jia, Y. Experimental study on dynamic deformation behavior of rockfill materials. Chin. J. Geotech. Eng. 2018, 40, 1729–1735. [Google Scholar]
  11. Wang, K.; Chang, Y.; Chen, N. Residual deformation characteristics of coarse grained soils under cyclic loading. China Civ. Eng. J. 2000, 33, 48–54. [Google Scholar]
  12. Ling, H.; Fu, H.; Cai, Z.; Mi, Z.; Zhu, F. Experimental study on dynamic deformation behaviors of dam materials. Chin. J. Geotech. Eng. 2009, 31, 1920–1924. [Google Scholar]
  13. Yang, G.; Liu, H.; Chen, Y.; Shen, Y. Research on size effect of rock-fill materials on dynamic deformation property. J. Hydroelectr. Power 2009, 5, 1003–1243. [Google Scholar]
  14. Zhu, S.; Zhou, J. Deformation behaviour of coarse grained materials under cyclic loading. Rock Soil Mech. 2010, 5, 1375–1380. [Google Scholar]
  15. Wang, Z.; Chen, S.; Fu, Z. Dilatancy behaviors and generalized plasticity constitutive model of rockfill materials. Rock Soil Mech. 2015, 7, 1931–1938. [Google Scholar]
  16. Bailly, P.; Delvare, F.; Via, J.; Hanus, J.L.; Biessy, M.; Picart, D. Dynamic behavior of an aggregate material at simultaneous high pressure and strain rate: SHPB triaxial tests. Int. J. Impact Eng. 2011, 2, 73–84. [Google Scholar] [CrossRef] [Green Version]
  17. Araei, A.A.; Tabatabaei, S.H.; Razeghi, H. Cyclic and post-cyclic monotonic behavior of crushed conglomerate rockfill material under dry and saturated conditions. Sci. Iran. 2012, 19, 64–76. [Google Scholar] [CrossRef] [Green Version]
  18. Flora, A.; Lirer, S.; Silvestri, F. Undrained cyclic resistance of undisturbed gravelly soils. Soil Dyn. Earthq. Eng. 2012, 43, 366–379. [Google Scholar] [CrossRef]
  19. Vos, E.; Couvreur, J.F.; Vermaut, M. Comparison of numerical analysis with field data of a road widening project on peatysoil. In Proc. International Workshop: Advances in Understanding and Modeling the Mechanical Behavior of Peat; Balkema: Rotterdam, The Netherlands, 1994; pp. 67–274. [Google Scholar]
  20. Xing, H.F.; Li, H.M. Controlling Criterion for Differential Settlement of Widened Expressway. Appl. Mech. Mater. 2012, 238, 818–822. [Google Scholar] [CrossRef]
  21. Wei, J.; Wang, Z.; Zheng, J.; Zhao, W. The Finite Element Analysis of Highway Unilateral Widened Deformation Characteristics on Soft Soil Ground. J. Comput. Theor. Nanosci. 2012, 6, 337–341. [Google Scholar] [CrossRef]
  22. Cui, X.Z. Traffic-induced settlement of subgrade of low liquid limit silt in Yellow River delta. China Civ. Eng. J. 2012, 45, 154–162. [Google Scholar]
Figure 1. Eldyn dynamic triaxial apparatus.
Applsci 12 03406 g001
Figure 2. Particle size distribution curves.
Applsci 12 03406 g002
Figure 3. Schematic diagram of wheel action.
Applsci 12 03406 g003
Figure 4. Axial strain of the first 20 cycles.
Applsci 12 03406 g004
Figure 5. Axial force of the first 20 cycles.
Applsci 12 03406 g005
Figure 6. Pore pressure cycle curve of the first 20 cycles.
Applsci 12 03406 g006
Figure 7. Cyclic curve in steady state.
Applsci 12 03406 g007
Figure 8. Cumulative strain at subgrade depth of 0.5 m.
Applsci 12 03406 g008
Figure 9. Cumulative strain under 50 kN axial load.
Applsci 12 03406 g009
Figure 10. Pore-pressure ratio under 50 kN axial load.
Applsci 12 03406 g010
Figure 11. Pore-pressure ratio at subgrade depth of 0.5 m.
Applsci 12 03406 g011
Figure 12. Hysteresis curve. (a) 2.5 m, 240 kPa (3.0 kPa); (b) 1.5 m, 240 kPa (6.0 kPa); (c) 0.5 m, 240 kPa (20.2 kPa).
Applsci 12 03406 g012
Figure 13. Cumulative strain under different loads. (a) Axle load = 50 kN; (b) Axle load = 130 kN; (c) Axle load = 240 kN.
Applsci 12 03406 g013aApplsci 12 03406 g013b
Figure 14. Variation of pore-pressure ratio under different loads. (a) Axle load = 240 kN; (b) Axle load = 130 kN; (c) Axle load = 50 kN.
Applsci 12 03406 g014aApplsci 12 03406 g014b
Figure 15. Cumulative-strain variation under different depths. (a) Depth = 0.5 m; (b) Depth = 1.5 m; (c) Depth = 2.5 m.
Applsci 12 03406 g015aApplsci 12 03406 g015b
Figure 16. Pore-pressure-ratio variation under different depths. (a) Depth = 0.5 m; (b) Depth = 1.5 m; (c) Depth = 2.5 m.
Applsci 12 03406 g016aApplsci 12 03406 g016b
Figure 17. Modulus-reduction curves at different depths. (a) Axle load = 50 kN; (b) Axle load = 130 kN; (c) Axle load = 240 kN.
Applsci 12 03406 g017aApplsci 12 03406 g017b
Figure 18. Numerical model of triaxial test.
Applsci 12 03406 g018
Figure 19. Comparison chart of numerical simulation results and test results. (a) Consolidated undrained triaxial-shear-test comparison chart; (b) Dynamic-cycle-test comparison chart.
Applsci 12 03406 g019aApplsci 12 03406 g019b
Figure 20. Numerical-calculation model. (a) Model mesh; (b) Boundary condition.
Applsci 12 03406 g020
Figure 21. Horizontal deformation distribution on the top surface of subgrade.
Applsci 12 03406 g021
Figure 22. Vertical deformation distribution on the top surface of subgrade.
Applsci 12 03406 g022
Figure 23. Change curve of roadbed settlement under different traffic loads.
Applsci 12 03406 g023
Table 1. Basic material parameters of subgrade soil.
Maximum Dry Density (g/cm3)Liquid Limit (%)Plastic Limit (%)Plasticity IndexOptimum Water Content (%)Cohesion (kPa)Internal Friction Angle (°)
1.7636.9618.208.7017.034.5930.78
Table 2. Testing scheme.
Test NumberBorrow Depth (m)Confining Pressure (kPa)Wheel-Axle Weight (kN)Dynamic Stress (kPa)Frequency (Hz)
I-1--504.21
I-20.51413011.0
I-3--24020.2
II-1--501.2
II-21.5241303.2
II-3--2406.0
III-1--500.6
III-22.5341301.5
III-3--2503.0
III-10.514--
III-21.524--
III-32.534--
Table 3. Vibration amplitude.
Subgrade Depth (m)Axle Load 50 kNAxle Load 130 kNAxle Load 240 kN
0.54.2 kPa11.0 kPa20.2 kPa
1.51.2 kPa3.2 kPa6.0 kPa
2.50.6 kPa1.5 kPa3.0 kPa
Table 4. Modulus-ratio variation.
Axle Load 50 kNAxle Load 130 kNAxle Load 240 kN
0.5 m–1.5 m0.02020.12180.1436
1.5 m–2.5 m0.00870.01390.0140
Table 5. Numerical-model parameters.
Subgrade StructureTraffic Load (kN)Density (kg/m3)Elastic Modulus (MPa)Shear Modulus (MPa)Poisson RatioCohesion (kPa)Internal Friction Angle (°)
Subgrade50, 100, 200176026.19.70.364.58530.78°
Foundation184035.013.50.305.035.0°
Publisher’s Note: MDPI stays neutral with regard to jurisdictional claims in published maps and institutional affiliations.

