1. Introduction
Sufficient oxygen supply in tissue is critical to maintaining its normal physiological functions [
1,
2]. Local oxygen levels in tissue provide valuable insights into its health states, such as metabolic levels [
3]. Oxygen is transported via binding to hemoglobin, the main protein of red blood cells, to different parts of the body, and is released to tissue through perfusion. Depending on the presence of binding oxygen molecules, hemoglobin can exist in two forms, oxygenated and deoxygenated hemoglobin, both of which exhibit distinct absorption properties in visible and near-infrared (NIR) ranges. Based on the differential absorption of hemoglobin, multispectral imaging was developed to quantify tissue perfusion properties, such as oxygen saturation [
4]. However, the quantification accuracy was limited due to its inability to decouple tissue absorption from tissue scattering. Spatial frequency domain imaging (SFDI), on the other hand, independently evaluates tissue absorption and scattering properties [
5,
6,
7]. SFDI uses 2D sinusoidal structured illumination to interrogate the samples. Tissue absorption and scattering modify the modulation of the illumination, and diffuse reflectance thus encodes the tissue’s optical properties. To quantify tissue optical properties, typically, a set of three 2D sinusoidal patterns with a phase shift of 0°, 120°, and 240° are projected onto the sample surfaces sequentially, and corresponding images are acquired. Using the 3-phase demodulation technique, two images, often referred as AC and DC images, are derived. AC and DC images are calibrated to obtain modulation and reflectance images, which serve as searching indices of the pre-generated look-up tables (LUTs) to determine optical properties of the sample. Multispectral SFDI has been developed to map perfusion and hemodynamic properties of the tissue with an improved accuracy [
8,
9]. Such quantification requires imaging at multiple wavelengths (two wavelengths at least), typically in the red and near-infrared (NIR) range [
10,
11]. At each wavelength, a set of three phase-shifted patterns are projected onto the tissue surface and the corresponding reflectance images are acquired to determine the tissue’s optical and perfusion properties [
6].
The overall process, however, is slow and limits the temporal resolution. In the past few years, significant efforts have been devoted to improving the imaging and quantification speed in SFDI imaging. Single snapshot SFDI reduced the number of required images from three to one [
12,
13,
14], and look-up table (LUT)-based quantification significantly improved the quantification speed of optical property of the tissue [
15]. For perfusion property quantification, the Beer–Lambert Law is the standard approach, which, however, can be slow for large images. To improve the speed for perfusion property quantification, artificial intelligence has been employed to train the predictive model based on a large set of training images [
16,
17].
Despite recent advancements towards real-time mapping of tissue perfusion and hemodynamics, current methods are still limited by relatively slow processing speed, low image resolution, and the need for powerful computational hardware (e.g., a multi-GPU setup). This study aimed to develop a highly efficient LUT-based computational framework towards high-resolution real-time mapping of tissue perfusion and hemodynamics that can be implemented on cost-effective hardware platforms.
2. Materials and Methods
LUT techniques have been widely used in SFDI to determine optical properties without performing time-consuming fitting procedures [
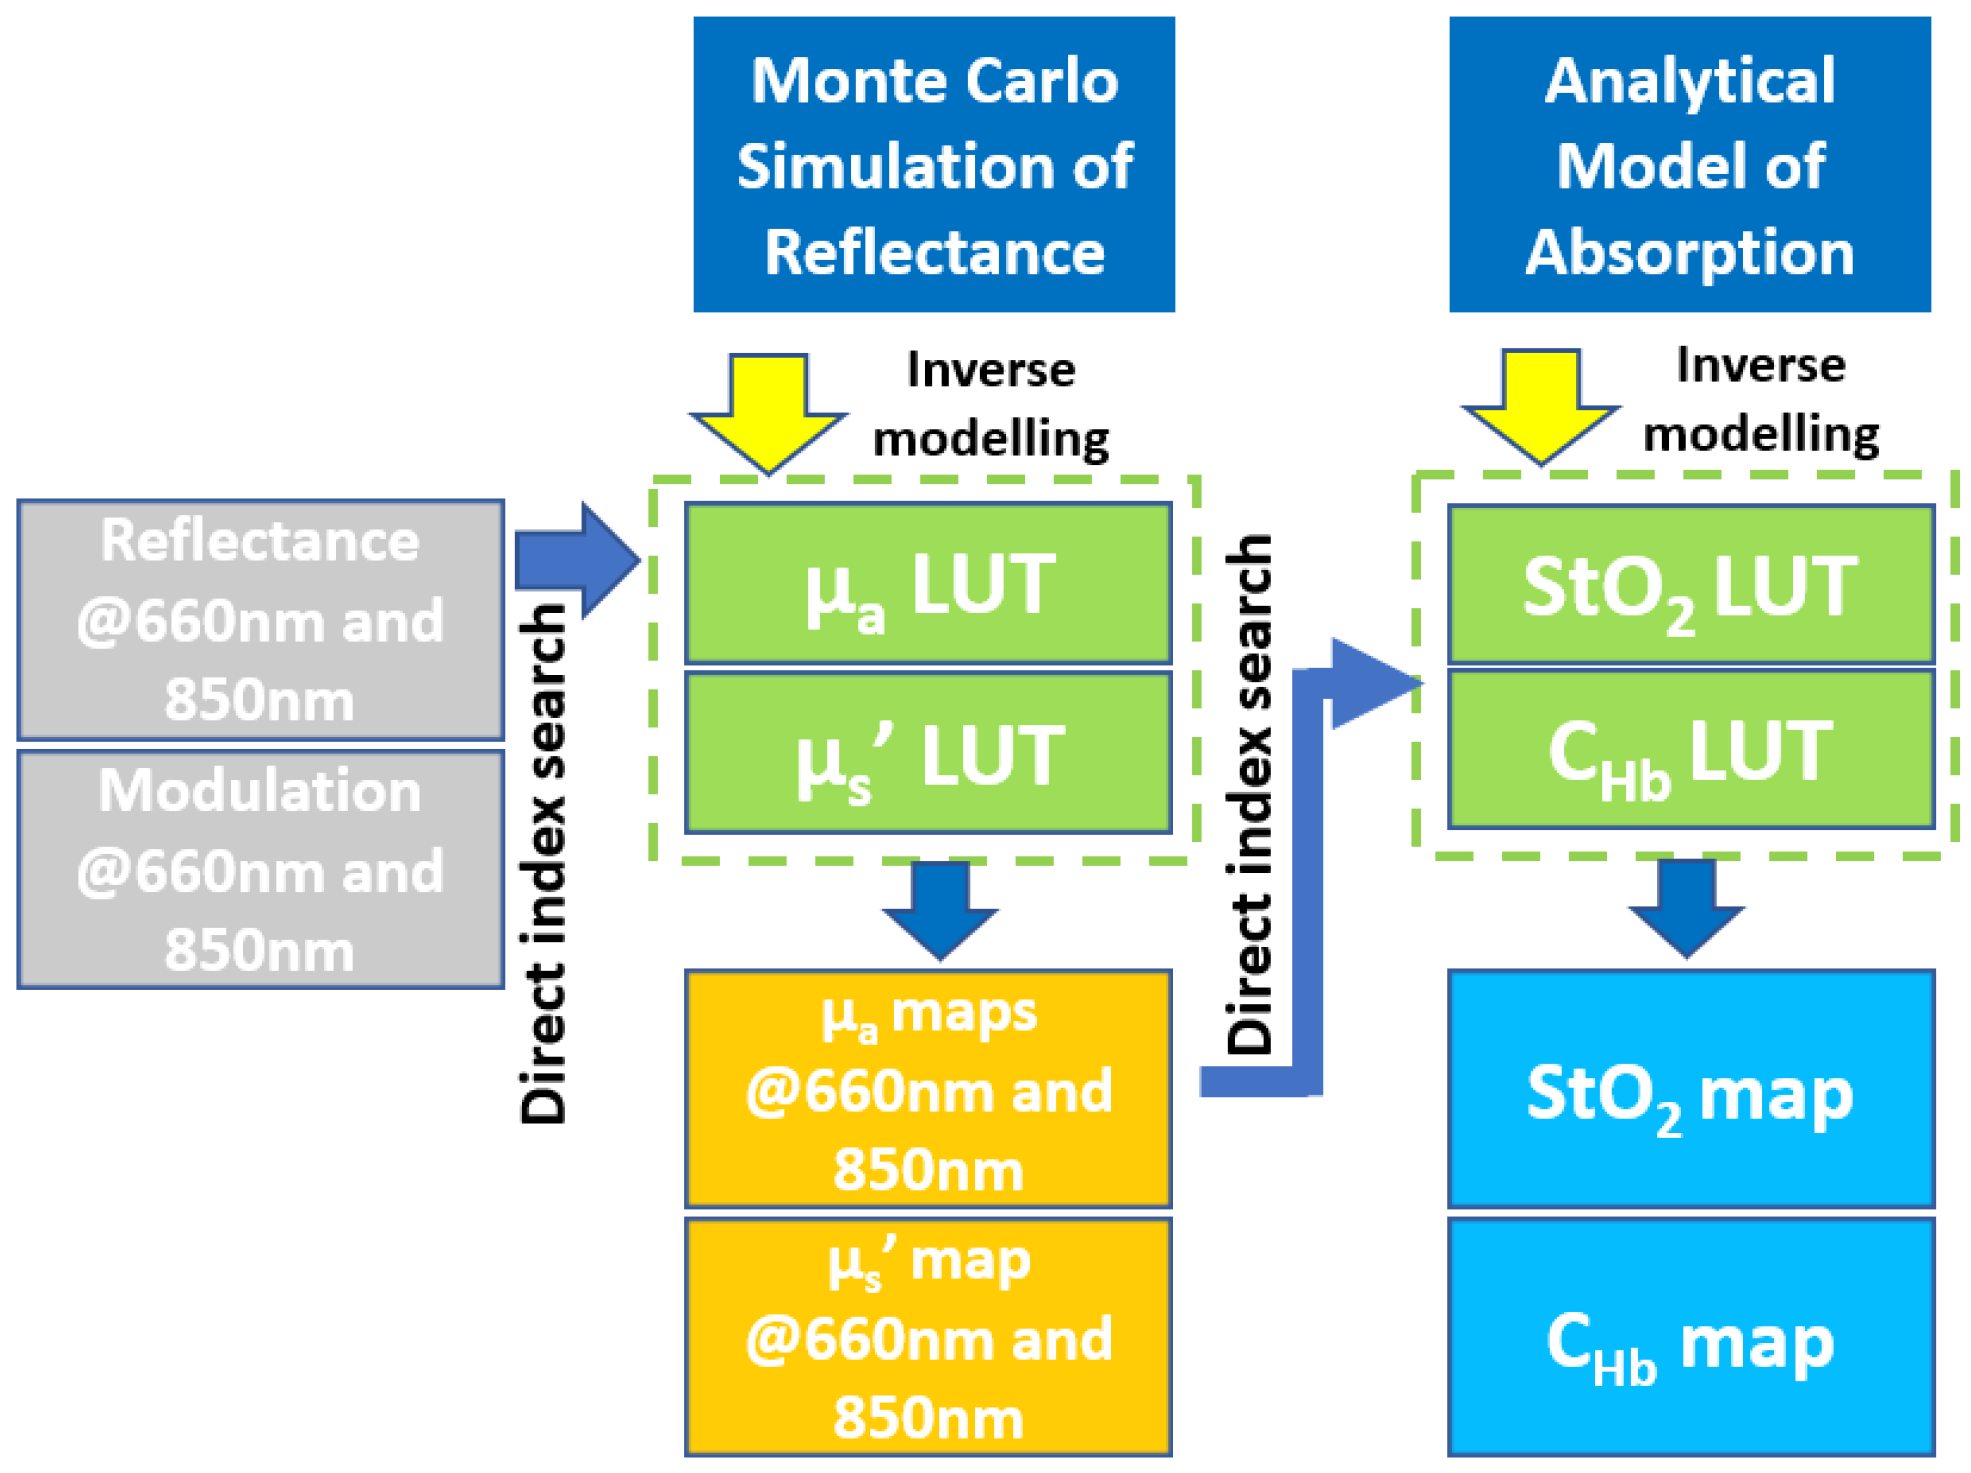
18]. However, LUT techniques are rarely used to quantify tissue perfusion properties in conjunction with SFDI imaging. In this study, we developed a highly efficient two-stage LUT technique consisting of two connected LUTs. The first and second stage LUTs rapidly quantify tissue optical and perfusion properties, respectively.
Figure 1 summarizes the overall workflow of the two-stage LUT technique.
The stage-1 LUT was generated by inverse modeling diffuse reflectance obtained by Monte Carlo simulation in the spatial frequency domain, and the stage-2 LUT was generated by inverse modeling of an analytical model of tissue absorption. Quantification of tissue perfusion properties was based on SFDI imaging at 660 and 850 nm. These two wavelengths located on the opposite side of the isosbestic wavelength, around 800 nm, have been previously demonstrated to effectively quantify blood perfusion properties [
16]. With the two-stage LUT, reflectance and modulation measurements at both 660 and 850 nm were first used as search indices to determine absorption and reduced scattering coefficients using the stage-1 LUT. The absorption coefficients at 660 and 850 nm were subsequently used as searching indices to efficiently determine oxygen saturation and blood concentration using the stage-2 LUT. In the rest of this section, detailed procedures for generating and evaluating the performance of two-stage LUT for quantifying perfusion properties are presented.
2.1. Stage-1 LUT for Quantifying Optical Properties
Monte Carlo (MC) simulation has been widely used for simulating light transport in turbid media. The simulation results are often used to generate LUTs for quantifying optical properties through inverse modeling [
19,
20]. Traditionally, MC simulation was implemented on a CPU [
21], and is considered computationally intensive and slow [
22]. Due to its highly parallel nature of execution, graphic computing unit (GPU)-based MC simulation programs have recently been developed, which significantly improve the simulation efficiency [
23]. This study adopted the Monte Carlo eXtreme (MCX) simulation package developed by Fang and Boas to simulate reflectance in the spatial frequency domain [
24].
We simulated reflectance images under structured illumination with a spatial frequency of 0.125 mm
−1 on large virtual phantoms (9.6 cm × 9.6 cm × 5 cm) with a grid size of 0.1 mm in the x, y, and z directions. The sample thickness of 5 cm was chosen to satisfy the requirement for infinite geometry in MC simulations [
18]. To reflect the general properties of biological tissue, the virtual phantom was assumed to have an anisotropy g = 0.9 and a refractive index
n = 1.37 [
25]. A total of 208 pairs of biologically relevant optical properties were simulated with 16 absorption coefficient (
μa) values from 0.001 to 1 mm
−1, and 13 reduced scattering coefficient values (
μs′) from 0.5 to 3 mm
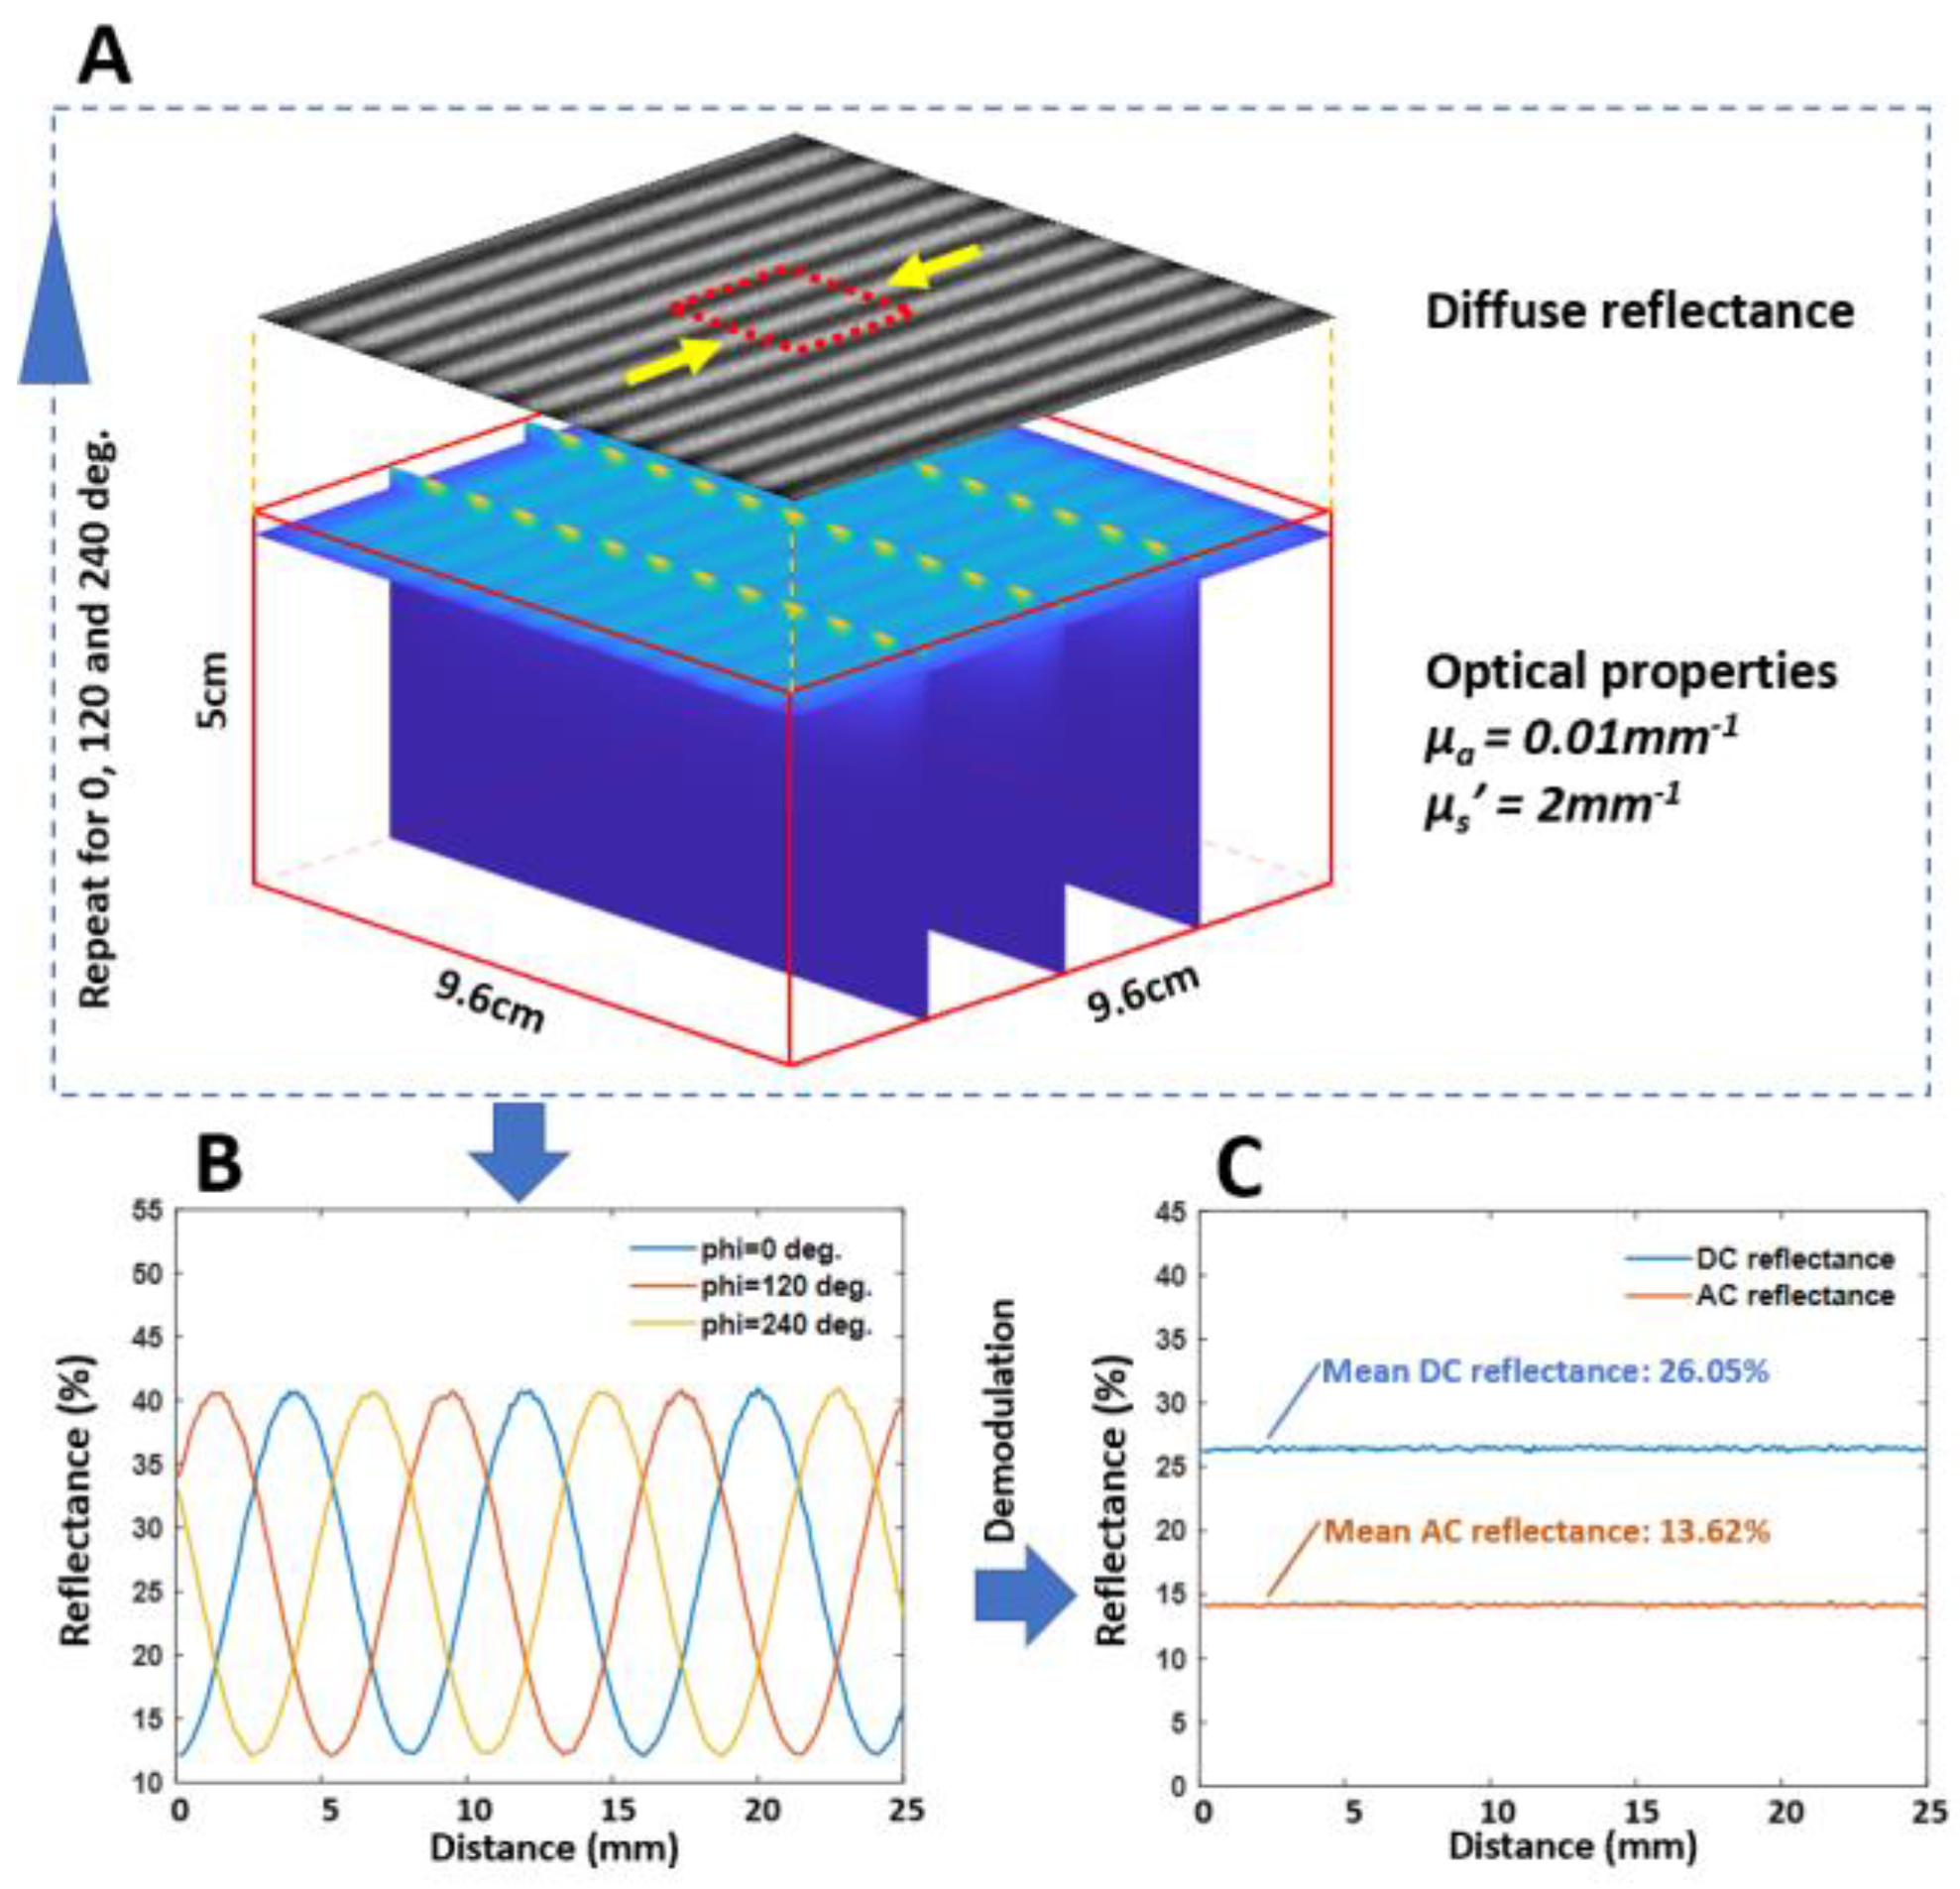
−1. For each sample, diffuse reflectance images were simulated under 3 phase-stepped (0°, 120°, and 240°) structured illuminations. Thus, a total of 624 MC simulations were performed, and the corresponding reflectance images were saved. The MCX program assumes that one unit of energy (for example, 1 J) is deposited/launched into the medium. The simulation returns the detected optical energy density at the surface. The reflectance image was then calculated by normalizing the detected optical energy density at the surface to the incident optical energy density. Based on our analysis (data not shown), a total of 200 million photons were used in each simulation, which resulted in flat AC and DC reflectance profiles with low levels of noise (example shown in
Figure 2C). It is worth noting that MCX simulation is not based on the white Monte Carlo approach; rather, each simulation is based on the actual optical properties of the medium.
Following the simulation, a sub-region of size 2.5 cm × 2.5 cm (red-dash square in
Figure 2A) of each reflectance image was isolated to reduce the signal fall-off toward the edge of the image. The resultant diffuse reflectance image was then averaged along the pattern direction (yellow arrows in
Figure 2A) to further improve the signal quality. Three intensity profiles,
I1,
I2, and
I3, were obtained for three phase-stepped illuminations (
Figure 2B). The demodulation process shown in Equations (1) and (2) was then performed to extract DC (
IDC) and AC (
IAC) signals (
Figure 2C).
IDC and
IAC signals were further converted to reflectance (
R) and modulation (
M) with Equations (3) and (4), respectively. The definitions of reflectance and modulation followed the convention that was initially introduced by Erickson et al. [
18]. It is worth noting that MC simulation generates normalized reflectance images; thus, no normalization to a spectralon image is needed.
Maps of
and
were converted to LUTs,
and
, using a coordinate mapping technique similar to the one described elsewhere [
15]. Interested readers may refer to
Figure 1 in the reference [
15] for the key steps involved in the LUT generation. Briefly, after obtaining
and
from the simulation, a 2D interpolation was performed to generate another set of
R and
M maps with a finer and uniform grid size of
μa and
μs′. Data points in the newly generated
and
maps were directly mapped to generate two new maps
and
. A scattered data interpolation was used to fill the gaps in
and
maps. To facilitate a rapid search for optical properties, during the LUT generation, reflectance and modulation were up-scaled by a factor of 1000, and rounded to the nearest integer. This operation allowed for direct index searching based on reflectance measurements.
2.2. Stage-2 LUT for Quantifying Perfusion Properties
We performed forward modeling of tissue absorption at two wavelengths, 660 and 850 nm. Hemoglobin concentration,
CHb, was varied from 0.075 to 22.5 g/L with an increment of 0.075 g/L, which corresponds to 0.05% and 15% of the total hemoglobin concentration of 150 g/L in the whole blood. This
CHb range reflects the majority types of organs except for the kidney, the liver, and the exposed vasculature [
25].
CHb in those tissues is well above 30% [
25]. The range of the optical and physiological properties may need to be expanded before the two-stage LUT method can be applied to characterize those tissues. Oxygen saturation,
StO2, was varied from 50% to 100% with an increment of 0.25%. A hemoglobin molecular weight of 64,500 g/mol was used in the simulation [
26]. The absorption coefficient at both wavelengths can be analytically described by Equations (5) and (6), respectively, where
and
are molar extinction coefficients of oxygenated and deoxygenated hemoglobin. The values of the molar extinction coefficients were obtained from the tabulated data compiled by Dr. Scott Prahl [
27]. With a similar technique described in the previous section, maps of
and
were converted to maps of
and
, and a scaling factor of 5000 was used.
2.3. Quantification Speed Test
The speed of quantifying optical and perfusion properties using the two-stage LUT was evaluated based on a set of simulated diffuse reflectance images (
Section 2.3.1 and
Section 2.3.2). The performance of the stage-2 LUT was compared to the Beer–Lambert Law-based quantification (
Section 2.3.3). All quantification methods were implemented on both a CPU and GPU to fully evaluate their efficiency. GPU acceleration was achieved by simply converting a regular MATLAB array into a GPU-compatible array with the MATLAB function gpuArray(). The testing platform consisted of an Intel CPU (i9 10900K), 32 GB of memory, and a Nvidia GPU (RTX 3080). A speed test script was written in MATLAB, and only the built-in MATLAB functions were used. We performed a speed test on three sets of simulated images with resolutions of 512 × 512 pixels, 1024 × 1024 pixels, and 2048 × 2048 pixels. Each set of images consisted of 50 images. The three image sizes are later referred to as small, medium, and large sizes, respectively.
2.3.1. Optical Property Mapping Using Stage-1 LUT
Reflectance and modulation values are in the range of 0 and 1, and search indices of the LUT are integers. To enable the use of reflectance and modulation as search indices in the LUT, these values were up-scaled by a factor of 1000, and rounded to the nearest integer. This scaling factor ensures rapid and accurate determination of optical properties without making very large LUTs. The MATLAB function sub2ind() was used to convert 2D maps of scaled reflectance and modulation into linear search indices for stage-1 LUT to quantify optical properties.
2.3.2. Perfusion Property Mapping Using Stage-2 LUT
Following optical property quantification, absorption coefficient maps at 660 and 850 nm were multiplied by a scaling factor of 5000 under a similar consideration described in
Section 2.3.1, and similarly, the integer portion of the result was retained. MATLAB function sub2ind() was used to convert 2D maps of scaled absorption coefficient maps into linear search indices for the stage-2 LUT to quantify perfusion properties.
2.3.3. Perfusion Property Mapping Using Beer-Lambert Law
Equations (5) and (6) were solved for concentration of oxygenated hemoglobin (=) and deoxygenated hemoglobin (=), based on which oxygen saturation and total hemoglobin concentration were determined. To improve the computation efficiency, 2D absorption maps were first converted to a 1D array to take advantage of the high efficiency of vectorized computation in MATLAB.
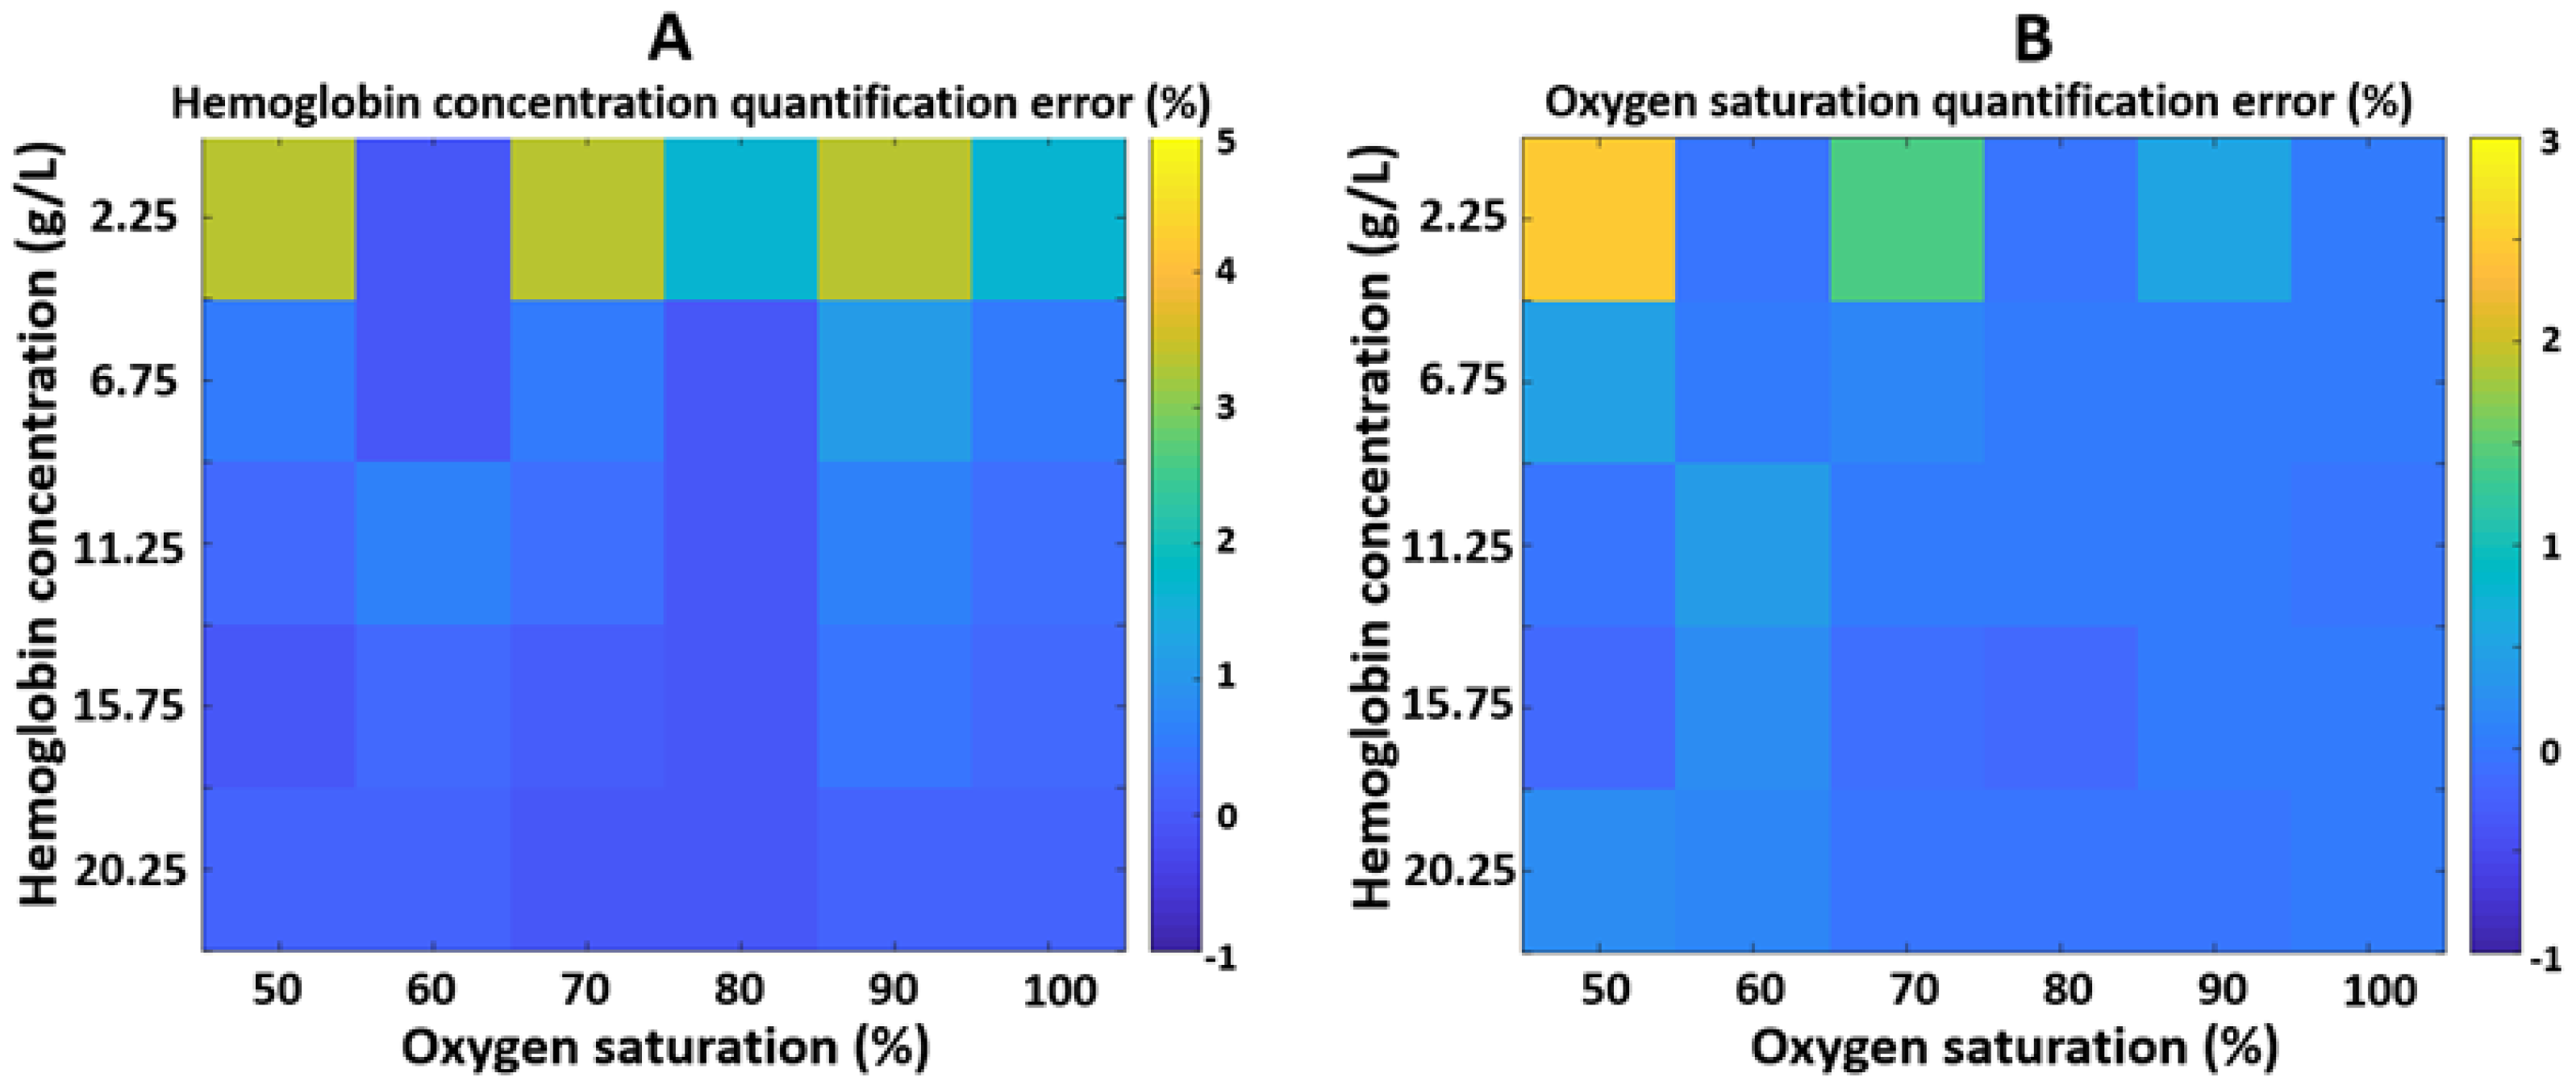
2.4. In Silico Validation
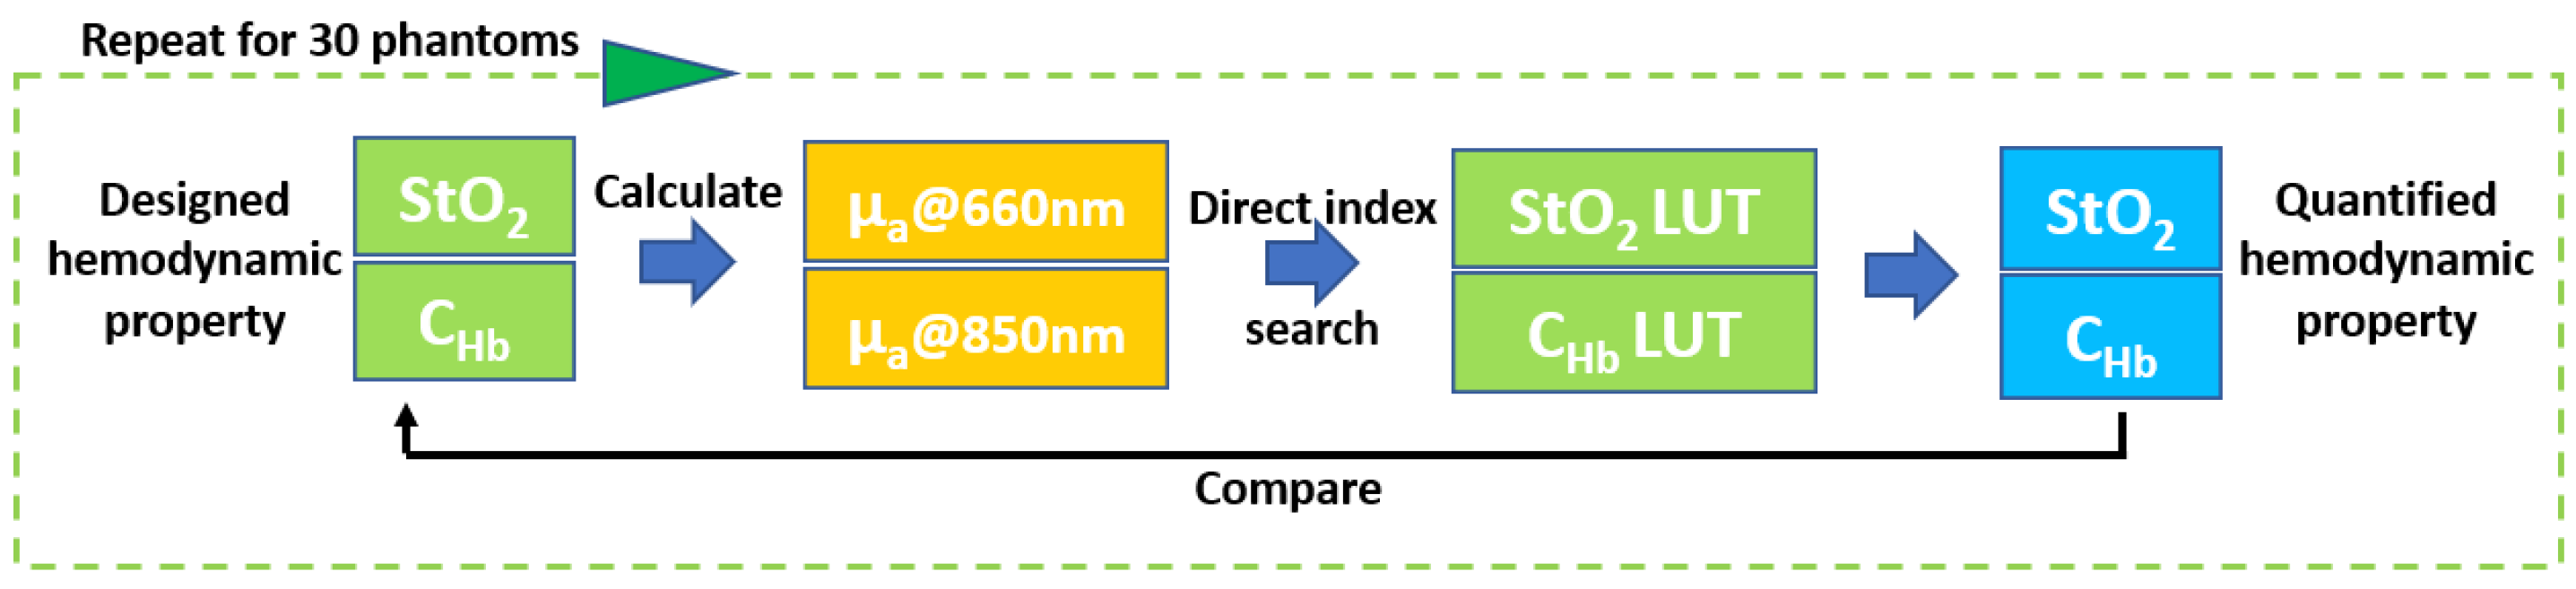
We examined the quantification accuracy of the perfusion parameters through an in silico validation procedure (
Figure 3). We generated a total of 30 digital phantoms, and each phantom was characterized by the total hemoglobin concentration and oxygen saturation. Thirty phantoms were divided into 5 sets, with 6 individual phantoms in each set. The hemoglobin concentration was increased from 2.25 to 20.15 g/L with an increment of 4.5 g/L from set 1 to set 5. In each set, the oxygen saturation levels were increased from 50% to 100% with an increment of 10% for 6 phantoms. Absorption coefficients at 660 and 850 nm were calculated based on the total hemoglobin concentration and oxygen saturation using Equations (5) and (6) for all phantoms. The absorption coefficients at both wavelengths were used to quantify hemoglobin concentration and oxygen saturation using the stage-2 LUT. The quantified hemodynamic properties were compared to the designed hemodynamic properties to assess the quantification accuracy.
4. Discussion
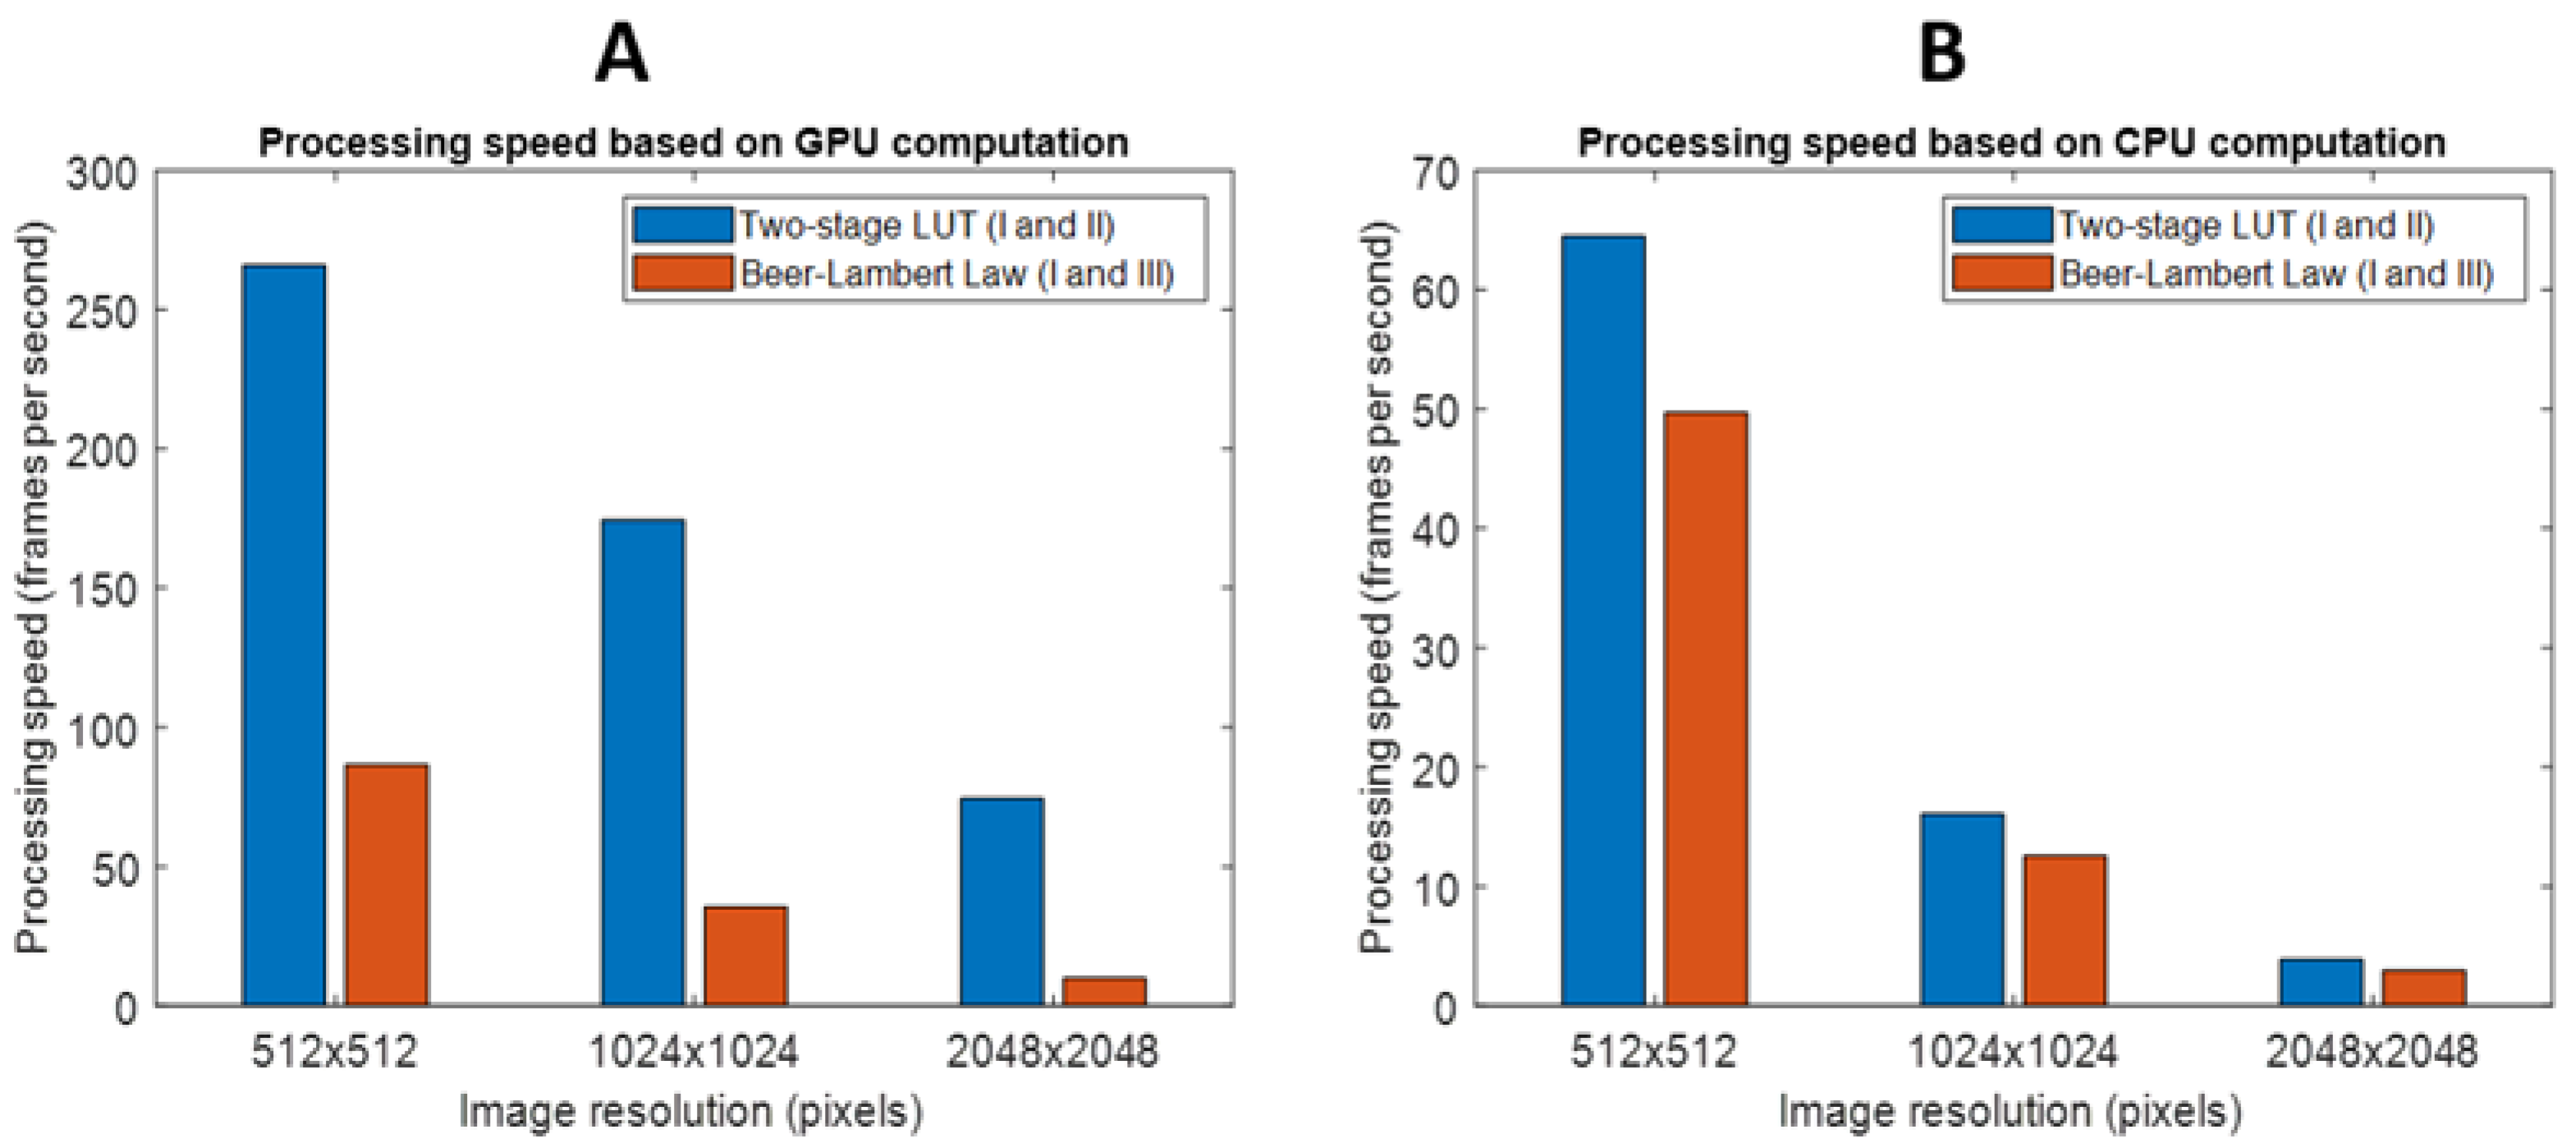
In this study, we developed and demonstrated a highly efficient and accurate two-stage LUT method that quantifies the tissue’s optical and perfusion properties with SFDI. High efficiency was achieved through direct index searching of two LUTs, which eliminated time-consuming fitting operations to determine optical and, subsequently, perfusion properties. GPU-based implementation significantly improved the searching speed through parallelization. At an image size of 2048 × 2048 pixels, we achieved a quantification speed of 74 FPS for both optical and perfusion properties.
In recent years, methods for direct quantification of optical and perfusion properties using artificial intelligence have been reported to improve the processing speed towards real-time applications. Zhao et al. reported a processing time of 94.4 ms (excluding time for image import and result display) for quantifying perfusion properties for images with a size of 540 × 720 pixels using a deep residual network [
17]. Using adversarial deep learning, Chen and Durr reported that approximately 40 ms was needed to determine optical and perfusion properties for images with a size of 512 × 512 pixels [
16]. It is worth noting that both studies utilized two wavelengths at around 660 and 850 nm, which are the same wavelengths as those used in this study.
A two-stage LUT method is highly suitable for real-time applications. With GPU acceleration, it achieved 266 and 74 FPS for small and large sized images. The short processing time can provide ample room to accommodate more sophisticated algorithms while still maintaining real-time performance. When the two-stage LUT is coupled with a dual-sensor SFDI imaging system, reflectance images at 660 and 850 nm can be acquired simultaneously and processed rapidly, which would enable time-sensitive imaging applications, such as real-time tissue viability monitoring.
Two-stage LUTs outperformed the Beer–Lambert Law-based quantification regardless of the computational platform. Even with GPU acceleration, the Beer–Lambert Law method only achieved 35.5 FPS for medium sized images. Any additional processing would slow it down to sub-30 FPS, which is not ideal for real-time applications.
Although CPU-based implementation of two-stage LUT is not as fast, it does not require a dedicated GPU and offers a few advantages. First, the two-stage LUT is still suitable for offline applications where processing time is not a critical factor, and it is about 30% more efficient than the Beer–Lambert Law approach. Second, the two-stage LUT offered a processing speed of approximately 65 FPS for small sized images, which still could enable real-time applications when the image resolution is not a concern. It is worth noting that, in real-life applications, acquiring and transferring images to memory, and displaying the processed results, take additional time. To preserve the high performance of the two-stage LUT, a multi-threaded architecture could be adopted. Each thread runs independently and is only responsible for its own task, such as image transfer, quantification, or result display.
The two-stage LUT quantification method presented in this study was intended to serve as a general framework to map the optical and perfusion properties of the tissue. Implementing this general framework requires additional considerations. Firstly, the optical property LUT was generated using MC simulation on homogenous phantoms. Homogenous phantom models have been widely used to generate LUTs for quantifying optical and physiological properties, and have yielded encouraging results. However, it is worth noting that building LUTs based on a more complex geometry, such as two-layer models, could further improve the accuracy and specificity of the quantification. Secondly, although MC simulation is highly accurate, the LUT is not imaging system-specific. When applying this LUT to quantify optical properties of the sample imaged with a specific SFDI system, additional calibration and scaling of the LUT are likely needed to match the characteristics of the imaging system and to achieve a high quantification accuracy. Thirdly, the sample’s 3D surface shape affects the diffuse reflectance, and thus the quantification, which was not accounted for in our method. Multiple techniques have been reported to correct for surface height, and these methods could be adopted to improve quantification accuracy [
13,
28]. Finally, the two-stage LUT was based on two wavelengths that are sensitive to oxygenated and deoxygenated hemoglobin. If the tissue to be measured presents additional major chromophores, such as melanin, this method may not yield a high quantification accuracy. Higher-dimensional (e.g., three-dimensional) LUTs could be generated to account for additional chromophores.


