
Understanding Safety Performance of Prefabricated Construction Based on Complex Network Theory


Abstract
:1. Introduction
2. Literature Review
2.1. Risks of Prefabricated Construction
2.2. Analysis Approach for Safety Risks of Prefabricated Construction
2.3. Complex Network Theory and Application
3. Methodology
3.1. Data Collection
3.1.1. Identification of Safety Risks of Prefabricated Construction
3.1.2. Obtain the Relationships between Safety Risks
3.1.3. Consensus Analysis
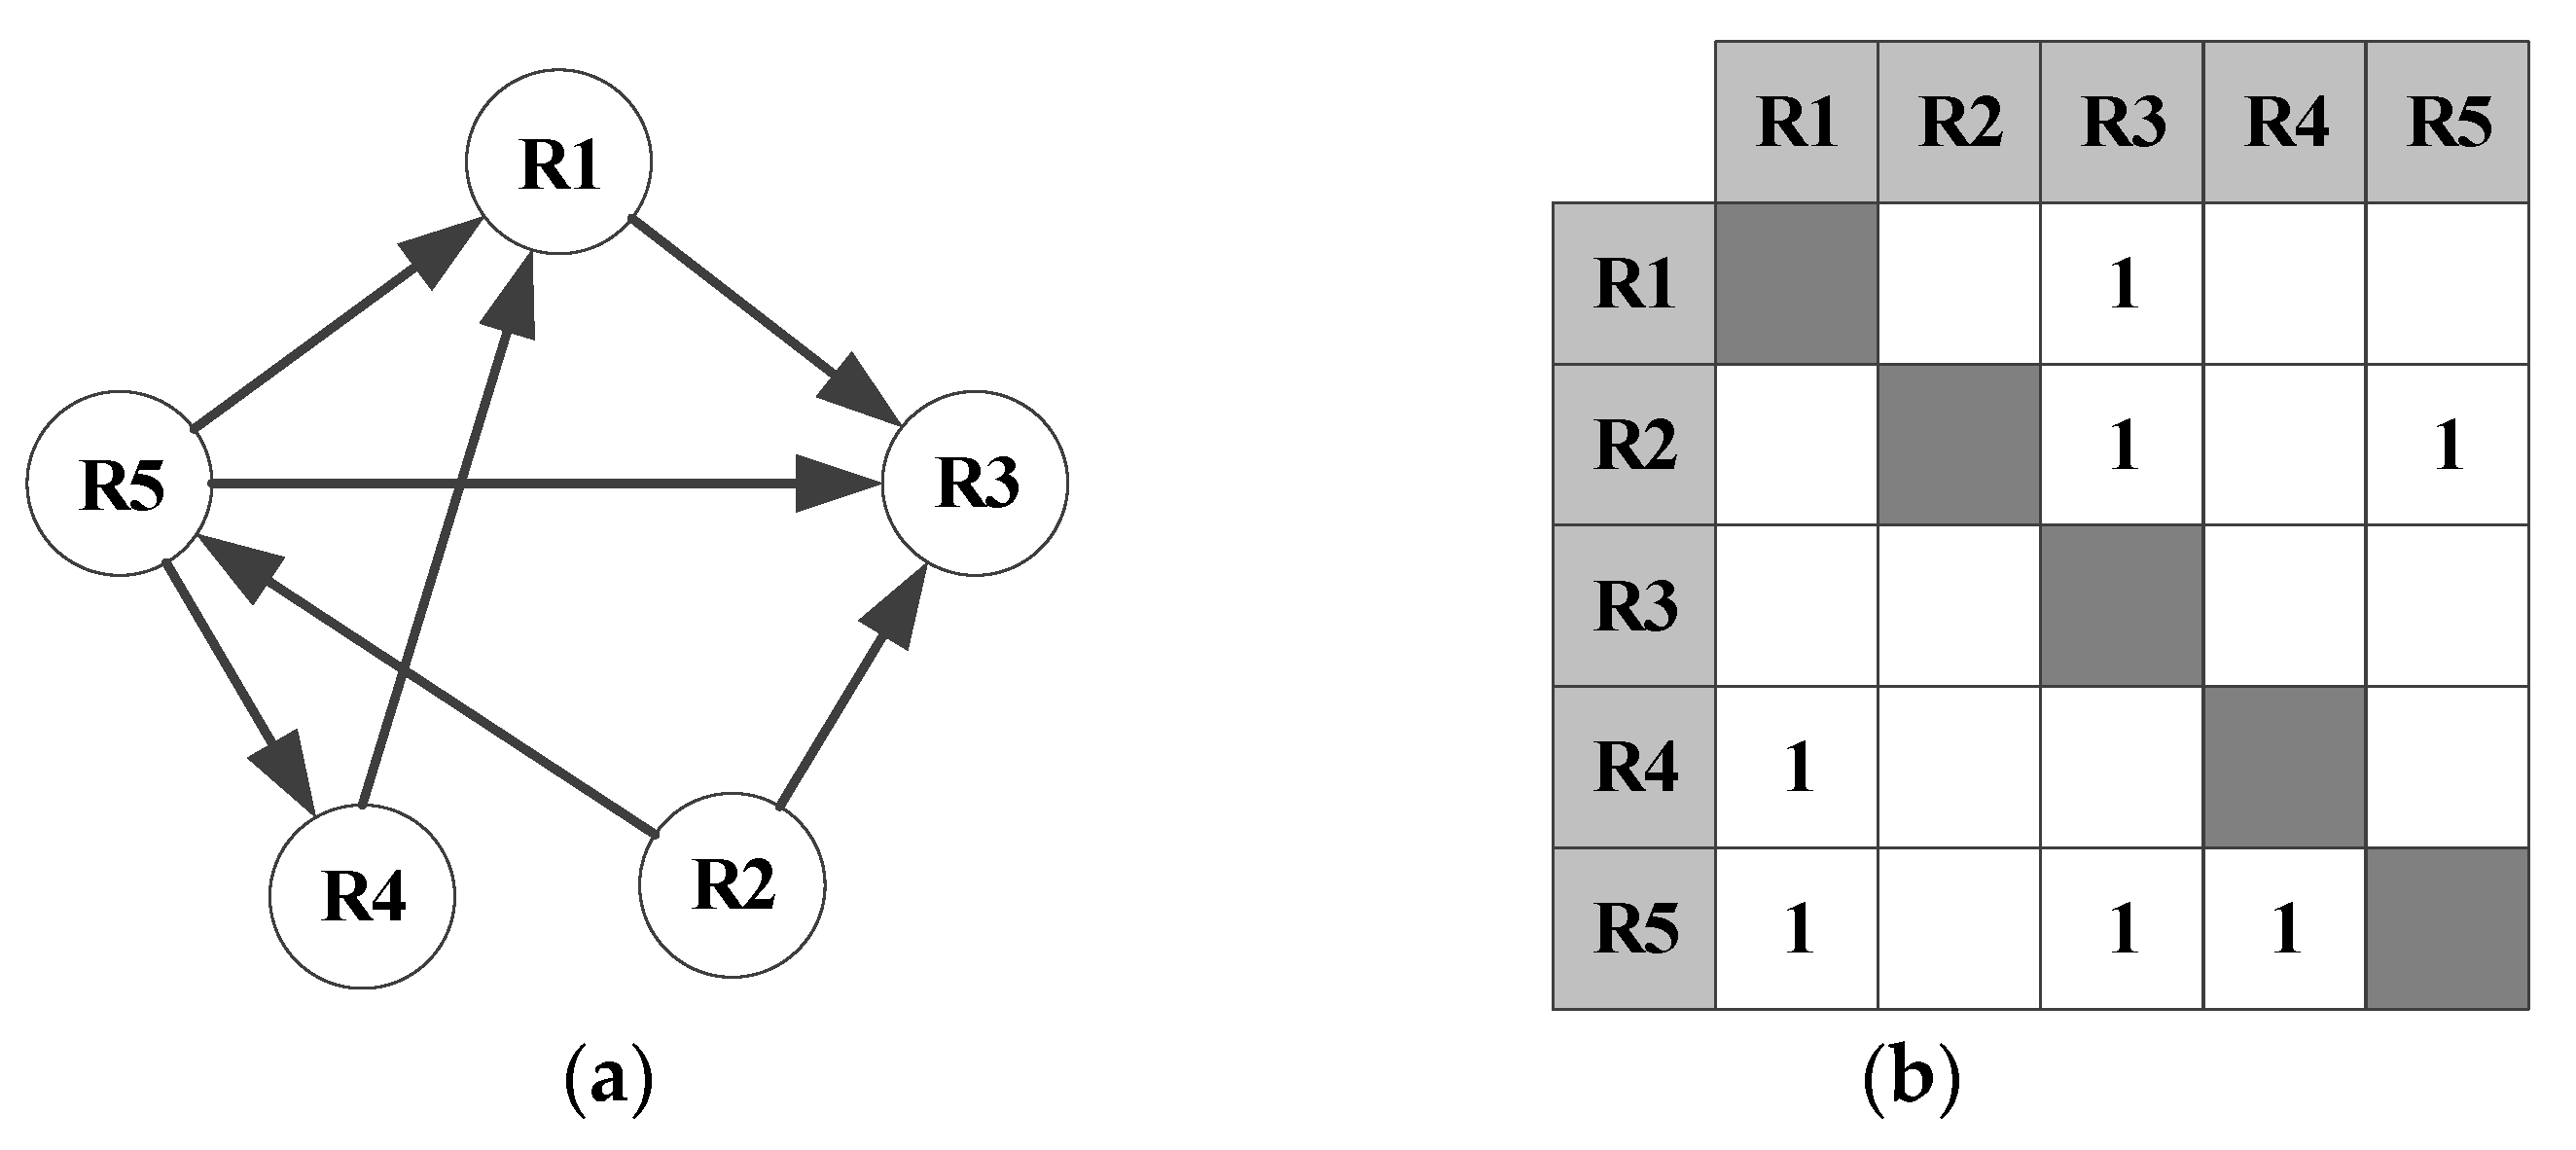
3.2. Network Construction
3.2.1. Build Prefabricated Construction Safety Risk Network
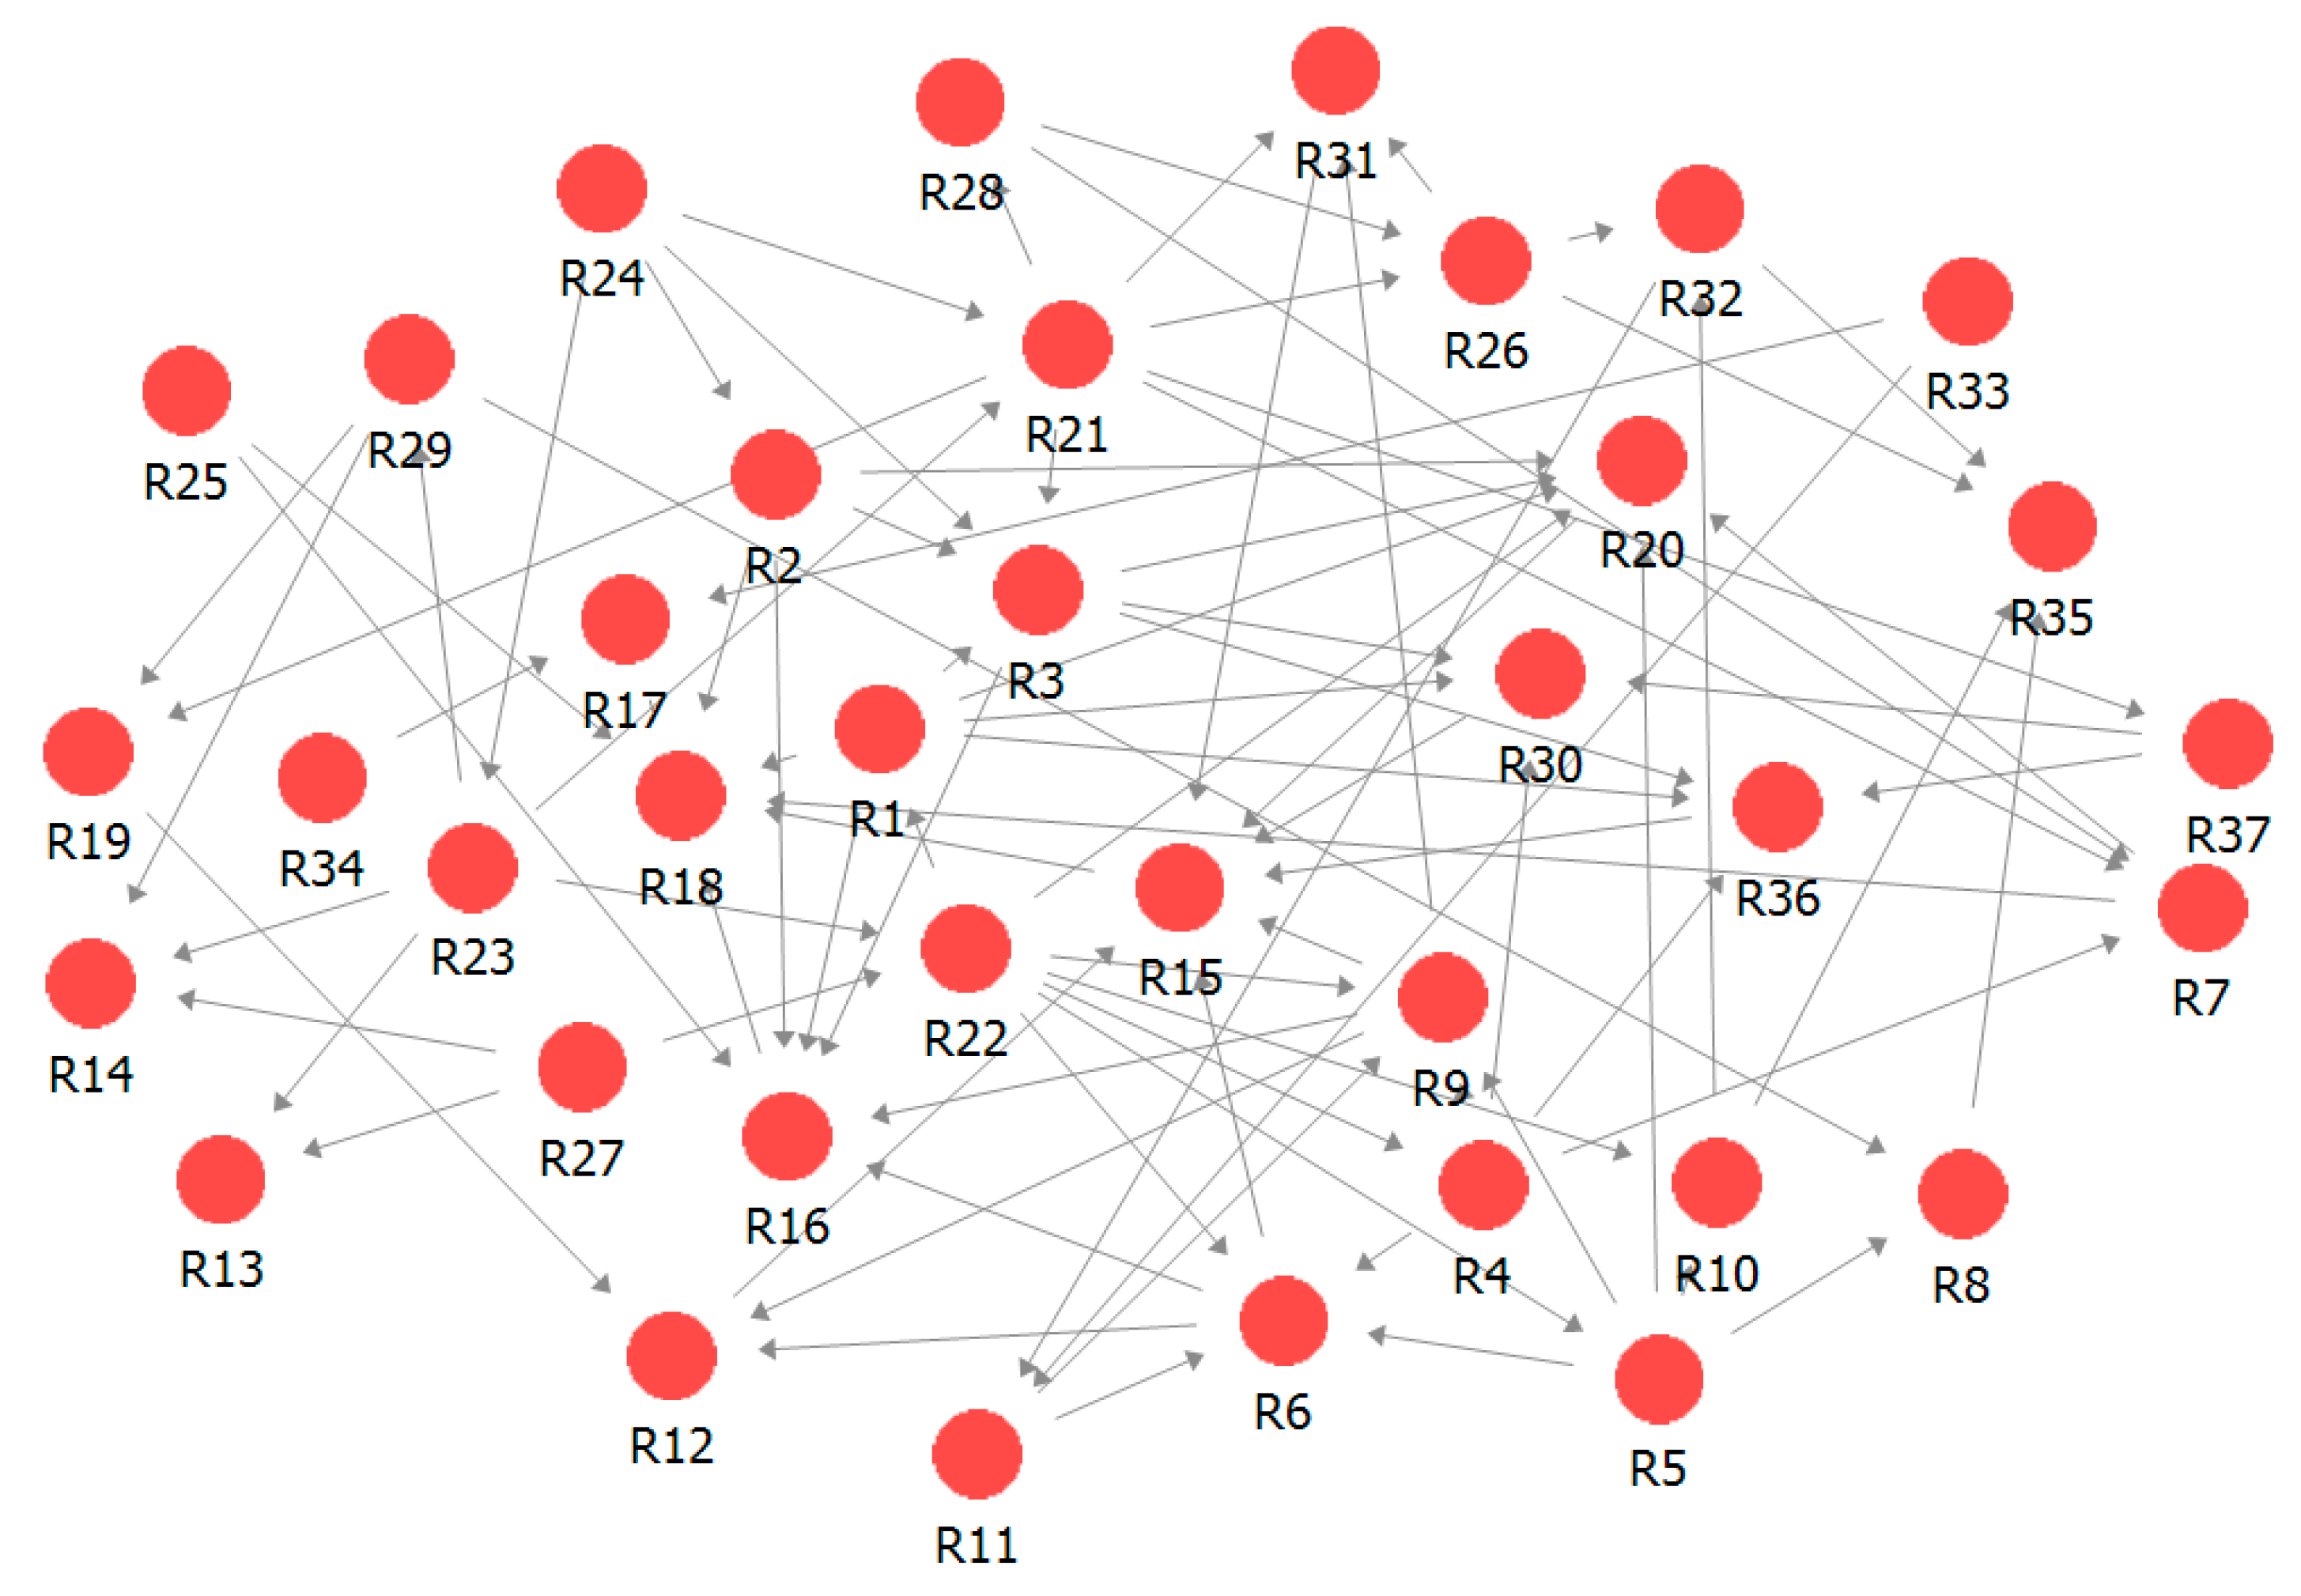
3.2.2. Visualize Prefabricated Construction Safety Risk Network
3.3. Network Analysis
3.3.1. Network Classification
- (1)
- Small-world network
- (2)
- Scale-free network
3.3.2. Nodes Ranking
- (1)
- Eigenvector Centrality
- (2)
- Degree difference
- (3)
- HITS
- (4)
- K-shell decomposition
4. Result
4.1. Topology Analysis of PCSRN
4.1.1. Scale-free Characteristic
4.1.2. Small-world Characteristic
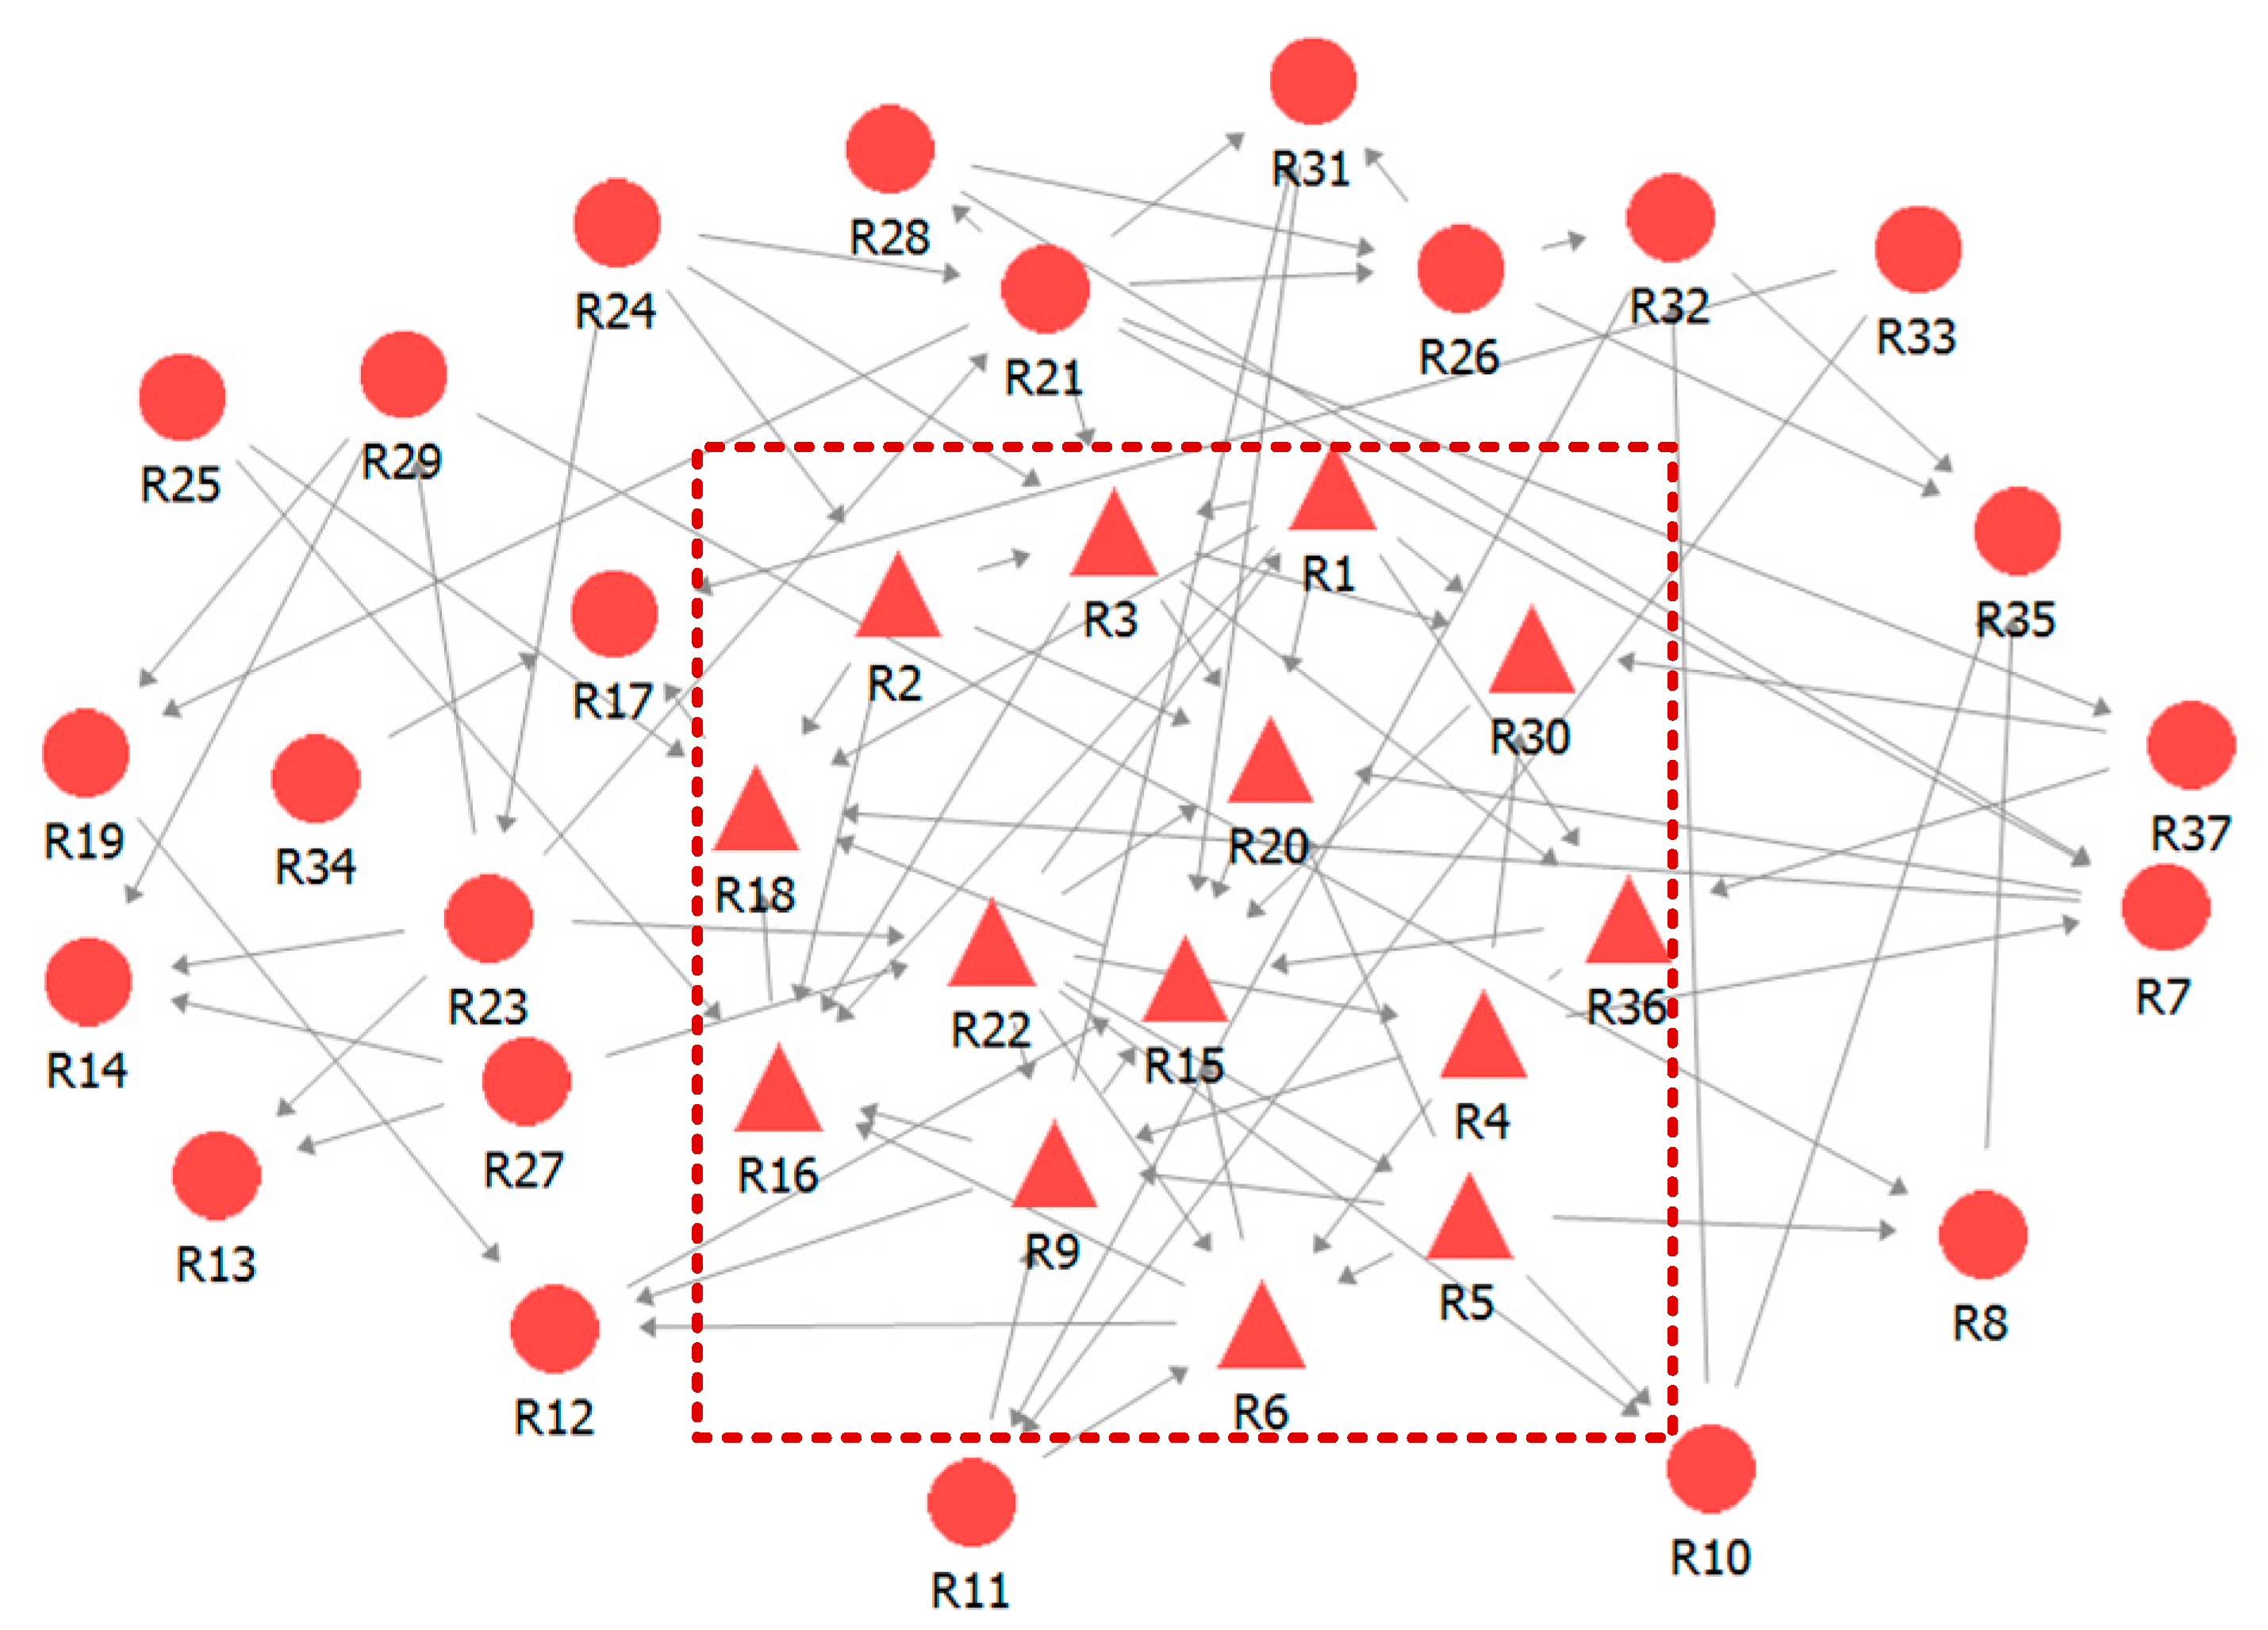
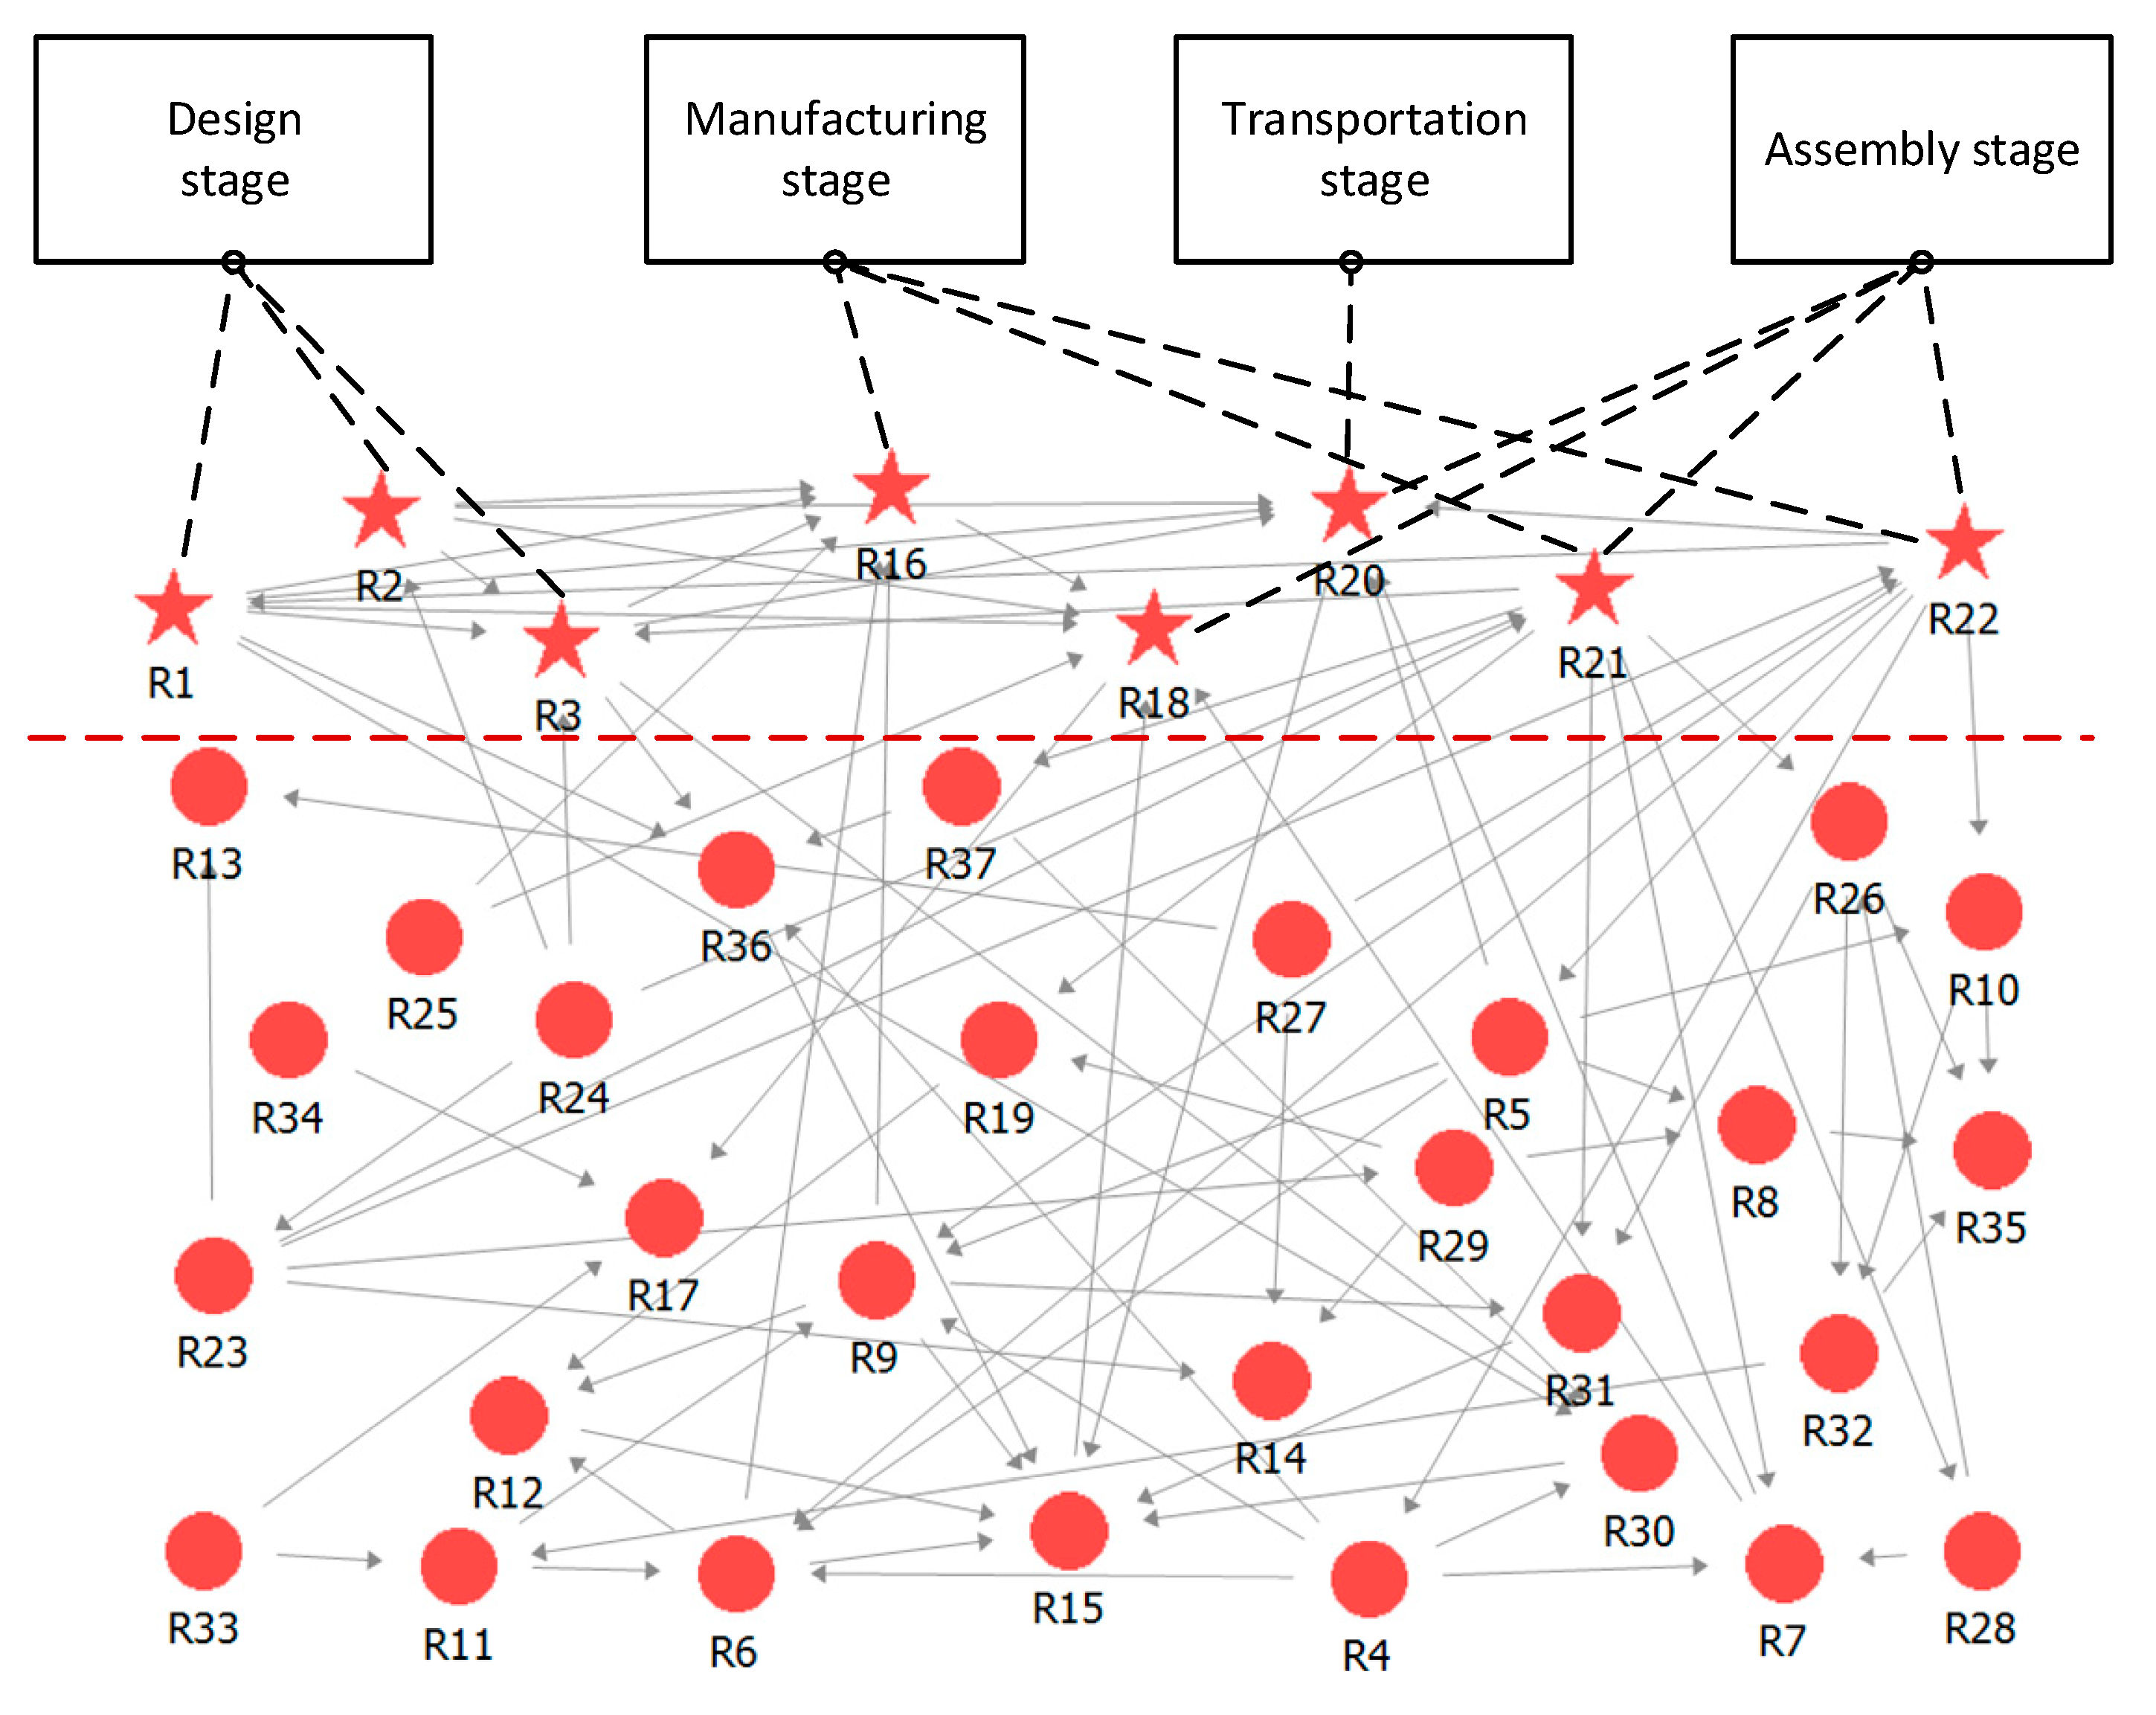
4.2. Vital Node Identification
5. Discussion
5.1. Comparison of Safety Risks
5.2. Implications for Practitioners
6. Conclusions
Author Contributions
Funding
Conflicts of Interest
References
- Luo, H.; Liu, J.; Li, C.; Chen, K.; Zhang, M. Ultra-rapid delivery of specialty field hospitals to combat COVID-19: Lessons learned from the Leishenshan Hospital project in Wuhan. Automat. Constr. 2020, 119, 103345. [Google Scholar] [CrossRef] [PubMed]
- Gbadamosi, A.Q.; Oyedele, L.; Olawale, O.; Abioye, S. Offsite Construction for Emergencies: A focus on Isolation Space Creation (ISC) measures for the COVID-19 pandemic. Prog. Disaster Sci. 2020, 8, 100130. [Google Scholar] [CrossRef] [PubMed]
- Luo, T.; Xue, X.; Wang, Y.; Xue, W.; Tan, Y. A systematic overview of prefabricated construction policies in China. J. Clean. Prod. 2021, 280, 124371. [Google Scholar] [CrossRef]
- Ibrahim, Y.W.; Geoffrey, Q.S. Fuzzy modelling of the critical failure factors for modular integrated construction projects. J. Clean. Prod. 2020, 264, 121595. [Google Scholar]
- Blismas, N.; Pasquire, C.; Gibb, A. Benefit evaluation for off-site production in construction. Constr. Manag. Econ. 2006, 24, 121–130. [Google Scholar] [CrossRef] [Green Version]
- Shahpari, M.; Saradj, F.M.; Pishvaee, M.S.; Piri, S. Assessing the productivity of prefabricated and in-situ construction systems using hybrid multi-criteria decision making method. J. Build. Eng. 2020, 27, 100979. [Google Scholar] [CrossRef]
- Jeong, J.; Hong, T.; Ji, C.; Kim, J.; Lee, M.; Jeong, K.; Lee, S. An integrated evaluation of productivity, cost and CO2 emission between prefabricated and conventional columns. J. Clean. Prod. 2017, 142, 2393–2406. [Google Scholar] [CrossRef]
- United States Department of Labor. Employer-Reported Workplace Injuries and Illnesses—2016; United States Department of Labor: Washington, DC, USA, 2017.
- Ibrahim, Y.W.; Geoffrey, Q.S.; Bon-Gang, H. Risks of modular integrated construction: A review and future research directions. Front. Eng. Manag. 2020, 7, 63–80. [Google Scholar]
- Xue, H.; Zhang, S.; Su, Y.; Wu, Z.; Yang, R.J. Effect of stakeholder collaborative management on off-site construction cost performance. J. Clean. Prod. 2018, 184, 490–502. [Google Scholar] [CrossRef]
- Luo, L.Z.; Li, Z.D.; Mao, C.; Shen, L.Y. Risk factors affecting practitioners’ attitudes toward the implementation of an industrialized building system: A case study from China. Eng. Constr. Archit. Manag. 2015, 22, 622–643. [Google Scholar] [CrossRef]
- Wuni, I.Y.; Shen, G.Q.P.; Mahmud, A.T. Critical risk factors in the application of modular integrated construction: A systematic review. Int. J. Constr. Manag. 2019, 22, 133–147. [Google Scholar] [CrossRef]
- Jiang, L.; Li, Z.; Li, L.; Gao, Y. Constraints on the Promotion of Prefabricated Construction in China. Sustainability 2018, 10, 2516. [Google Scholar] [CrossRef] [Green Version]
- Zhang, W.; Lee, M.W.; Jaillon, L.; Poon, C. The hindrance to using prefabrication in Hong Kong’s building industry. J. Clean. Prod. 2018, 204, 70–81. [Google Scholar] [CrossRef]
- Si, S.; You, X.; Liu, H.; Zhang, P. DEMATEL technique: A systematic review of the state-of-the-art literature on methodologies and applications. Math. Probl. Eng. 2018, 2018, 3696457. [Google Scholar] [CrossRef] [Green Version]
- Ji, Y.; Qi, L.; Liu, Y.; Liu, X.; Li, H.X.; Li, Y. Assessing and Prioritising Delay Factors of Prefabricated Concrete Building Projects in China. Appl. Sci. 2018, 8, 2324. [Google Scholar] [CrossRef] [Green Version]
- Li, C.Z.; Xu, X.; Shen, G.Q.; Fan, C.; Li, X.; Hong, J. A model for simulating schedule risks in prefabrication housing production: A case study of six-day cycle assembly activities in Hong Kong. J. Clean. Prod. 2018, 185, 366–381. [Google Scholar] [CrossRef]
- Li, C.Z.; Xue, F.; Li, X.; Hong, J.; Shen, G.Q. An Internet of Things-enabled BIM platform for on-site assembly services in prefabricated construction. Automat. Constr. 2018, 89, 146–161. [Google Scholar] [CrossRef]
- Aminbakhsh, S.; Gunduz, M.; Sonmez, R. Safety risk assessment using analytic hierarchy process (AHP) during planning and budgeting of construction projects. J. Saf. Res. 2013, 46, 99–105. [Google Scholar] [CrossRef]
- Salomon, V.A.; Zinoviev, A.; Zinovieva, O. Book review: Alessio Ishizaka and Philippe Nemery’s multi-criteria decision analysis. Int. J. Anal. Hierarchy Process 2013, 5, 284–287. [Google Scholar] [CrossRef]
- Lee, J.S.; Kim, Y.S. Analysis of cost-increasing risk factors in modular construction in Korea using FMEA. KSCE J. Civ. Eng. 2016, 21, 1999–2010. [Google Scholar] [CrossRef]
- Wang, Z.; Hu, H.; Gong, J. Simulation based multiple disturbances evaluation in the precast supply chain for improved disturbance prevention. J. Clean. Prod. 2018, 177, 232–244. [Google Scholar] [CrossRef]
- Freeman, L. The development of social network analysis. Study Sociol. Sci. 2004, 1, 159–167. [Google Scholar]
- Luo, L.; Shen, G.Q.; Xu, G.; Liu, Y.; Wang, Y. Stakeholder-Associated Supply Chain Risks and Their Interactions in a Prefabricated Building Project in Hong Kong. J. Manag. Eng. 2019, 35, 5018015. [Google Scholar] [CrossRef]
- Hsu, P.; Aurisicchio, M.; Angeloudis, P. Risk-averse supply chain for modular construction projects. Automat. Constr. 2019, 106, 102898. [Google Scholar] [CrossRef]
- Fard, M.M.; Terouhid, S.A.; Kibert, C.J.; Hakim, H. Safety concerns related to modular/prefabricated building construction. Int. J. Inj. Contr. Saf. Promot. 2017, 24, 10–23. [Google Scholar] [CrossRef] [PubMed]
- Jeong, G.; Kim, H.; Lee, H.; Park, M.; Hyun, H. Analysis of safety risk factors of modular construction to identify accident trends. J. Asian Archit. Build. 2022, 3, 1040–1052. [Google Scholar] [CrossRef]
- Liu, J.; Gong, E.; Wang, D.; Teng, Y. Cloud Model-Based Safety Performance Evaluation of Prefabricated Building Project in China. Wireless Pers. Commun. 2018, 4, 3021–3039. [Google Scholar] [CrossRef]
- Goh, J.; Hu, S.B.; Fang, Y.H. Human-in-the-Loop Simulation for Crane Lift Planning in Modular Construction On-Site Assembly. In Computing in Civil Engineering 2019: Visualization, Information Modeling, and Simulation; Cho, Y.K., Leite, F., Behzadan, A., Wang, C., Eds.; ASCE International Conference on Computing in Civil Engineering (i3CE): Reston, VA, USA, 2019; pp. 71–78. [Google Scholar]
- Ahn, S.; Crouch, L.; Kim, T.W.; Rameezdeen, R. Comparison of Worker Safety Risks between Onsite and Offsite Construction Methods: A Site Management Perspective. J. Constr. Eng. Manag. 2020, 146, 5020010. [Google Scholar] [CrossRef]
- Chang, C.; Wu, X.; Yan, X.; Contento, A. Multiobjective Optimization of Safety Risk of Prefabricated Building Construction considering Risk Correlation. Math. Probl. Eng. 2020, 2020, 3923486. [Google Scholar] [CrossRef]
- Li, Q.; Song, L.; List, G.F.; Deng, Y.; Zhou, Z.; Liu, P. A new approach to understand metro operation safety by exploring metro operation hazard network (MOHN). Saf. Sci. 2017, 93, 50–61. [Google Scholar] [CrossRef]
- Zhou, J.; Xu, W.; Guo, X.; Ding, J. A method for modeling and analysis of directed weighted accident causation network (DWACN). Phys. A Stat. Mech. Appl. 2015, 437, 263–277. [Google Scholar] [CrossRef]
- Eteifa, S.O.; El-Adaway, I.H. Using Social Network Analysis to Model the Interaction between Root Causes of Fatalities in the Construction Industry. J. Manag. Eng. 2018, 34, 04017045. [Google Scholar] [CrossRef]
- Xu, R.; Mi, C.; Mierzwiak, R.; Meng, R. Complex network construction of Internet finance risk. Phys. A Stat. Mech. Appl. 2020, 540, 122930. [Google Scholar] [CrossRef] [Green Version]
- Qiu, Z.; Liu, Q.; Li, X.; Zhang, J.; Zhang, Y. Construction and analysis of a coal mine accident causation network based on text mining. Process Saf. Environ. 2021, 153, 320–328. [Google Scholar] [CrossRef]
- Zhou, Z.; Irizarry, J.; Guo, W. A network-based approach to modeling safety accidents and causations within the context of subway construction project management. Saf. Sci. 2021, 139, 105261. [Google Scholar] [CrossRef]
- Ismail, Z.A. Optimising the safety of road transport workers on IBS building construction projects: A review. Soc. Responsib. J. 2019, 15, 837–851. [Google Scholar] [CrossRef]
- Bon Gang, H.; Ming, S.; Kit-Ying, L. Knowledge-based decision support system for prefabricated prefinished volumetric construction. Automat. Constr. 2018, 94, 168–178. [Google Scholar]
- Ikuma, L.H.; Nahmens, I.; James, J. Use of Safety and Lean Integrated Kaizen to Improve Performance in Modular Homebuilding. J. Constr. Eng. Manag. 2011, 137, 551–560. [Google Scholar] [CrossRef]
- Kim, S.; Seol, H.; Ikuma, L.H.; Nussbaum, M.A. Knowledge and opinions of designers of industrialized wall panels regarding incorporating ergonomics in design. Int. J. Ind. Ergon. 2008, 38, 150–157. [Google Scholar] [CrossRef]
- Razak, F.M.; Awang, H. The Contractors’ Perception of the Implementation of Industrialised Building System (IBS) in Malaysia. In Proceedings of the Building Surveying and Technology Undergraduate Conference, Langkawi, Malaysia, 31 May–2 June 2013; Volume 10. [Google Scholar]
- Kamar, K.M.; Alshawi, M.; Hamid, Z. Barriers to industrialized building system (IBS): The case of Malaysia. In Proceedings of the BuHu 9th International Postgraduate Research Conference (IPGRC), Salford, UK, 1 January 2009. [Google Scholar]
- Li, C.Z.; Hong, J.; Xue, F.; Shen, G.Q.; Xu, X.; Mok, M.K. Schedule risks in prefabrication housing production in Hong Kong: A social network analysis. J. Clean. Prod. 2016, 134, 482–494. [Google Scholar] [CrossRef] [Green Version]
- Correia, J.M.; Sutrisna, M.; Zaman, A.U. Factors influencing the implementation of off-site manufacturing in commercial projects in Western Australia. J. Eng. Des. Technol. 2020, 18, 1449–1468. [Google Scholar] [CrossRef]
- Han, Y.; Wang, L. Identifying barriers to off-site construction using grey dematel approach: Case of china. J. Civ. Eng. Manag. 2018, 24, 364–377. [Google Scholar] [CrossRef]
- Fard, M.M.; Terouhid, S.A.; Kibert, C.J. Construction of Manufactured Homes: Understanding the Hazards and Risks. Prof. Saf. 2017, 62, 34–40. [Google Scholar]
- Li, C.Z.; Hong, J.; Fan, C.; Xu, X.; Shen, G.Q. Schedule delay analysis of prefabricated housing production: A hybrid dynamic approach. J. Clean. Prod. 2017, 195, S1990395799. [Google Scholar] [CrossRef]
- Liu, Z.; Meng, X.; Xing, Z.; Jiang, A. Digital Twin-Based Safety Risk Coupling of Prefabricated Building Hoisting. Sensors 2021, 21, 3583. [Google Scholar] [CrossRef] [PubMed]
- Li, B.; Wang, Y.; Lu, Y. Research on Safety Evaluation of Prefabricated Building Construction Based on Analytic Hierarchy Process. In Proceedings of the ICCREM 2020: Intelligent Construction and Sustainable Buildings, Stockholm, Sweden, 24–25 August 2020; American Society of Civil Engineers: Reston, VA, USA, 2020; pp. 177–183. [Google Scholar]
- Lu, C.; Wang, J. Analysis on Safety-Affecting Factors of Prefabricated Construction Projects with Dematel-ISM. In Proceedings of the ICCREM 2020: Intelligent Construction and Sustainable Buildings, Stockholm, Sweden, 24–25 August 2020; American Society of Civil Engineers: Reston, VA, USA, 2020; pp. 808–814. [Google Scholar]
- Shaari, A.A.; Zaki, F.; Wan Muhamad, W.Z.A.; Ayob, A. Safety of precast concrete installation for industrialised building system construction. Int. J. Appl. Eng. Res. 2016, 11, 7929–7932. [Google Scholar]
- Fang, D.; Jiang, Z.; Zhang, M.; Han, W. An experimental method to study the effect of fatigue on construction workers’ safety performance. Saf. Sci. 2015, 73, 80–91. [Google Scholar] [CrossRef]
- Guo, S.; Zhou, X.; Tang, B.; Gong, P. Exploring the behavioral risk chains of accidents using complex network theory in the construction industry. Phys. A Stat. Mech. Appl. 2020, 560, 125012. [Google Scholar] [CrossRef]
- Blismas, N.; Wakefield, R. Drivers, constraints and the future of offsite manufacture in Australia. Constr. Innov. 2007, 9, 72–83. [Google Scholar] [CrossRef] [Green Version]
- Qi, B.; Li, C.; Management, S.O.; University, S.J. Research on the Establishment of Fabricated Construction Quality Assessment Index System and Evaluation Methods. Constr. Technol. 2014, 15, 20–24. [Google Scholar]
- Li, L.; Li, Z.; Wu, G.; Li, X. Critical Success Factors for Project Planning and Control in Prefabrication Housing Production: A China Study. Sustainability 2018, 10, 836. [Google Scholar] [CrossRef] [Green Version]
- Chang, C.; Wang, J.; Hongxue, L.I.; Management, S.O.; University, S.J. Identification and Control of Quality Elements for Prefabricated Concrete Constructions. J. Shenyang Jianzhu Univ. (Soc. Sci.) 2016, 1, 58–63. [Google Scholar]
- Hwang, B.G.; Shan, M.; Looi, K.Y. Key constraints and mitigation strategies for prefabricated prefinished volumetric construction. J. Clean. Prod. 2018, 183, 183–193. [Google Scholar] [CrossRef]
- Jaillon, L.; Poon, C.S. The evolution of prefabricated residential building systems in Hong Kong: A review of the public and the private sector. Automat. Constr. 2009, 18, 239–248. [Google Scholar] [CrossRef]
- Rashidi, A.; Ibrahim, R. Industrialized Construction Chronology: The Disputes and Success Factors for a Resilient Construction Industry in Malaysia. Open Constr. Build. Technol. J. 2017, 11, 286–300. [Google Scholar] [CrossRef]
- Liu, Q.; Ye, G.; Feng, Y. Workers’ safety behaviors in the off-site manufacturing plant. Eng. Constr. Arch. Manag. 2019, 27, 765–784. [Google Scholar] [CrossRef]
- Zhang, Y.; Lei, Z.; Han, S.; Bouferguene, A.; Al-Hussein, M. Process-Oriented Framework to Improve Modular and Offsite Construction Manufacturing Performance. J. Constr. Eng. Manag. 2020, 146, 4020116. [Google Scholar] [CrossRef]
- Soto, S.; Hubbard, B.; Hubbard, S. Exploring prefabrication facility safety in the US construction industry. In Proceedings of the CIB W099 International Conference on Achieving Sustainable Construction Health and Safety, Lund, Sweden, 2–3 June 2014; Ingvar Kamprad Design Centre (IKDC): Lund, Sweden, 2014. [Google Scholar]
- Mckay, L. Health and safety management of offsite construction-how close are we to production manufacturing? In Proceedings of the 4th Triennial International Conference Rethinking and Revitalizing Construction Safety, Health, Environment and Quality, Gqeberha, South Africa, 17–20 May 2005; Haupt, T.C., Smallwood, J., Eds.; Volume 99, pp. 432–441. [Google Scholar]
- Lee, Y.; Kim, J.; Khanzode, A.; Fischer, M. Empirical Study of Identifying Logistical Problems in Prefabricated Interior Wall Panel Construction. J. Manag. Eng. 2021, 37, 05021002. [Google Scholar] [CrossRef]
- Xia, N.; Zou, P.X.W.; Liu, X.; Wang, X.; Zhu, R. A hybrid BN-HFACS model for predicting safety performance in construction projects. Saf. Sci. 2018, 101, 332–343. [Google Scholar] [CrossRef]
- Gan, X.; Chang, R.; Zuo, J.; Wen, T.; Zillante, G. Barriers to the transition towards Off-site construction in China: An Interpretive Structural Modeling approach. J. Clean. Prod. 2018, 197, 8–18. [Google Scholar] [CrossRef]
- Tami, V.; Tam, C.; Ng, W. An Examination on the Practice of Adopting Prefabrication for Construction Projects. Int. J. Constr. Manag. 2007, 7, 53–64. [Google Scholar] [CrossRef]
- Zhang, W.; Huimin, L.I.; Zhao, D. Risk Assessment of Prefabricated Construction Process Based on the Credibility Measure. Ind. Safe. Environ. Prot. 2017, 8, 13–17. [Google Scholar]
- Han, S.H.; Bouferguene, A.; Al-Hussein, M.; Hermann, U. A 3D-based Crane Evaluation System for Mobile Crane Operation Selection on Modular-based Heavy Construction Sites. J. Constr. Eng. Manag. 2017, 143, 4017060–4017061. [Google Scholar] [CrossRef]
- James, J.; Ikuma, L.H.; Nahmens, I.; Aghazadeh, F. The impact of Kaizen on safety in modular home manufacturing. Int. J. Adv. Manuf. Technol. 2014, 70, 725–734. [Google Scholar] [CrossRef]
- Lu, Y.; Zhu, Y. Integrating Hoisting Efficiency into Construction Site Layout Plan Model for Prefabricated Construction. J. Constr. Eng. Manag. 2021, 147, 4021130. [Google Scholar] [CrossRef]
- Ma, H.; Zhang, H.; Chang, P. 4D-Based Workspace Conflict Detection in Prefabricated Building Constructions. J. Constr. Eng. Manag. 2020, 146, 04020112. [Google Scholar] [CrossRef]
- Hsu, P.Y.; Angeloudis, P.; Aurisicchio, M. Optimal logistics planning for modular construction using two-stage stochastic programming. Automat. Constr. 2018, 94, 47–61. [Google Scholar] [CrossRef]
- Li, X.; Han, S.H.; Gül, M.; Hussein, A. Automated post-3D visualization ergonomic analysis system for rapid workplace design in modular construction. Automat. Constr. 2019, 98, 160–174. [Google Scholar] [CrossRef]
- Heng, L.I.; Guo, H.L.; Skitmore, M.; Huang, T.; Chan, K.Y.N.; Chan, G. Rethinking prefabricated construction management using the VP-based IKEA model in Hong Kong. Constr. Manag. Econ. 2011, 29, 233–245. [Google Scholar]
- Duan, P.; Zhou, J. Cascading vulnerability analysis of unsafe behaviors of construction workers from the perspective of network modeling. Eng. Constr. Arch. Manag. 2021. [Google Scholar] [CrossRef]
- Nabi, M.A.; El-Adaway, I. Understanding the Key Risks Affecting Cost and Schedule Performance of Modular Construction Projects. J. Manag. Eng. 2021, 37, 04021023. [Google Scholar] [CrossRef]
- Blismas, N.; Pendlebury, M.; Gibb, A.; Pasquire, C. Constraints to the Use of Off-site Production on Construction Projects. Arch. Eng. Des. Manag. 2005, 1, 153–162. [Google Scholar] [CrossRef] [Green Version]
- Steward, D.V. The design structure system: A method for managing the design of complex systems. IEEE Trans. Eng. Manag. 1981, EM-28, 71–74. [Google Scholar] [CrossRef]
- Fang, C.; Marle, F.; Zio, E.; Bocquet, J. Network theory-based analysis of risk interactions in large engineering projects. Reliab. Eng. Syst. Saf. 2012, 106, 1–10. [Google Scholar] [CrossRef]
- Black, C.; Akintoye, A.; Fitzgerald, E. An analysis of success factors and benefits of partnering in construction. Int. J. Proj. Manag. 2000, 18, 423–434. [Google Scholar] [CrossRef]
- Borgatti, S.; Halgin, D. Consensus Analysis. In A Companion to Cognitive Anthropology; John Wiley & Sons: West Sussex, UK, 2011; pp. 171–190. [Google Scholar]
- Watts, D.J.; Strogatz, S.H. Collective dynamics of ‘small-world’ networks. Nature 1998, 393, 440–442. [Google Scholar] [CrossRef]
- Barabasi, A.L.; Albert, R. Emergence of scaling in random networks. Science 1999, 286, 509–512. [Google Scholar] [CrossRef] [PubMed] [Green Version]
- Barabasi, A.L.; Albert, R.; Jeong, A.H. Mean-field theory for scale-free random networks. Phys. A Stat. Mech. Appl. 1999, 272, 173–187. [Google Scholar] [CrossRef] [Green Version]
- Prountzos, D.; Pingali, K. Betweenness Centrality: Algorithms and Implementations. In Proceedings of the 18th ACM SIGPLAN Symposium on Principles and Practice of Parallel Programming, Shenzhen, China, 23–27 February 2013; pp. 35–46. [Google Scholar]
- Zhao, J.; Wang, Y.; Deng, Y. Identifying influential nodes in complex networks from global perspective. Chaos Solit. Fractals 2020, 133, 109637. [Google Scholar] [CrossRef]
- Pei, S.; Muchnik, L.; Andrade, J.S., Jr.; Zheng, Z.; Makse, H. Searching for superspreaders of information in real-world social media. Sci. Rep. 2014, 4, 5547. [Google Scholar] [CrossRef] [PubMed] [Green Version]
- Wang, M.; Li, W.; Guo, Y.; Peng, X.; Li, Y. Identifying influential spreaders in complex networks based on improved k-shell method. Phys. A Stat. Mech. Appl. 2020, 554, 124229. [Google Scholar] [CrossRef]
- Bonacich, P. Factoring and weighting approaches to status scores and clique identification. J. Math. Sociol. 1972, 2, 113–120. [Google Scholar] [CrossRef]
- Lu, Y.; Polgar, M.; Luo, X.; Cao, Y. Social network analysis of a criminal hacker community. J. Comput. Inform. Syst. 2010, 51, 31–41. [Google Scholar]
- Lu, L.; Chen, D.; Ren, X.; Zhang, Q.; Zhang, Y.; Zhou, T. Vital nodes identification in complex networks. Phys. Rep. 2016, 650, 1–63. [Google Scholar] [CrossRef] [Green Version]
- Kleinberg, J.M. Authoritative sources in a hyperlinked environment. J. ACM 1999, 46, 604–632. [Google Scholar] [CrossRef]
- Ahajjam, S.; Badir, H. Identification of influential spreaders in complex networks using HybridRank algorithm. Sci. Rep. 2018, 8, 11932. [Google Scholar] [CrossRef]
- Shin, I.J. Factors that affect safety of tower crane installation/dismantling in construction industry. Saf. Sci. 2015, 72, 379–390. [Google Scholar] [CrossRef]
- Shahtaheri, Y.; Rausch, C.; West, J.; Haas, C.; Nahangi, M. Managing risk in modular construction using dimensional and geometric tolerance strategies. Automat. Constr. 2017, 83, 303–315. [Google Scholar] [CrossRef]
- Azmi, W.; Misnan, M.S. A Case for the Introduction of Designers’ Safety Education (DSE) for Architects and Civil Engineers. Adv. Eng. Forum 2013, 10, 160–164. [Google Scholar] [CrossRef] [Green Version]
- Behm, M. Linking construction fatalities to the design for construction safety concept. Saf. Sci. 2005, 43, 589–611. [Google Scholar] [CrossRef]
- Malekitabar, H.; Ardeshir, A.; Sebt, M.H.; Stouffs, R. Construction safety risk drivers: A BIM approach. Saf. Sci. 2016, 82, 445–455. [Google Scholar] [CrossRef]
- Zou, Y.; Kiviniemi, A.; Jones, S.W. A review of risk management through BIM and BIM-related technologies. Saf. Sci. 2017, 97, 88–98. [Google Scholar] [CrossRef]
- Zhang, S.; Teizer, J.; Pradhananga, N.; Eastman, C.M. Workforce location tracking to model, visualize and analyze workspace requirements in building information models for construction safety planning. Automat. Constr. 2015, 60, 74–86. [Google Scholar] [CrossRef]
- Alizadehsalehi, S.; Yitmen, I.; Celik, T.; Arditi, D. The effectiveness of an integrated BIM/UAV model in managing safety on construction sites. Int. J. Occup. Saf. Ergon. 2020, 26, 829–844. [Google Scholar] [CrossRef] [PubMed]


| Risk ID | Risk Name | Subordinate Stage | Source | |||
|---|---|---|---|---|---|---|
| Design | Manufacturing | Transportation | Assembly | |||
| R1 | Lack of safety considerations in design | ● | [38,39,40,41] | |||
| R2 | Error in design | ● | [34,42,43,44] | |||
| R3 | Design variations | ● | [9,34,42,45] | |||
| R4 | Shortage of skilled on-site/off-site workers | ● | ● | [27,42,45,46] | ||
| R5 | Weak safety awareness of workers | ● | ● | [27,46,47] | ||
| R6 | Human mistake | ● | ● | ● | [26,47,48] | |
| R7 | Absence of safety instructions on site assembly | ● | [27,49,50] | |||
| R8 | Inappropriate use of personal protective equipment (PPE) | ● | ● | [28,51,52] | ||
| R9 | Illegal operation | ● | ● | [31,34] | ||
| R10 | Misjudgment of dangerous situations | ● | ● | ● | [34,53] | |
| R11 | Workers’ physical and mental state | ● | ● | ● | [34,54] | |
| R12 | Damaged/defective equipment | ● | ● | [26,27] | ||
| R13 | No personal protective equipment (PPE) | ● | ● | [27,34] | ||
| R14 | Unqualified safety protection system | ● | [27,28,34] | |||
| R15 | Damaged prefabricated components | ● | [9,27,55,56] | |||
| R16 | Quality defects of prefabricated components | ● | [28,56] | |||
| R17 | Unstable structure | ● | [27,34] | |||
| R18 | Insufficient connection strength of prefabricated components | ● | [44,48,57,58,59,60,61] | |||
| R19 | No/unscheduled equipment maintenance | ● | ● | [28,31,47] | ||
| R20 | Unsecured equipment/ tool/ object | ● | ● | [27,47,62] | ||
| R21 | Poor organizational communication | ● | ● | [11,44,59,60] | ||
| R22 | Inadequate safety education and training | ● | ● | [59,61,62] | ||
| R23 | Adoption of safety practices similar to traditional construction | ● | ● | [63,64,65] | ||
| R24 | Deficiency of integration among stakeholders | ● | ● | ● | ● | [11,45,61,66,67] |
| R25 | Incomplete safety codes and standards | ● | ● | [11,26,61,68] | ||
| R26 | Poor housekeeping | ● | ● | [27,40] | ||
| R27 | Insufficient safety investment | ● | [46,51,69] | |||
| R28 | Scarcity of coordination of site activities | ● | [31,34] | |||
| R29 | Inadequate supervision | ● | ● | [28,31,70] | ||
| R30 | Improper selection of lifting equipment | ● | [21,29,31,71] | |||
| R31 | Arbitrary storage/stacking of prefabricated components | ● | [66,72] | |||
| R32 | Working in an unfriendly environment | ● | [27,73] | |||
| R33 | Adverse weather condition | ● | ● | [26,47,74,75] | ||
| R34 | Utilization of heavier and large prefabricated components | ● | ● | [27,76,77] | ||
| R35 | High exposure to hazardous material | ● | ● | [31,78,79] | ||
| R36 | Poor performance of the motion planning | ● | [34,52,71] | |||
| R37 | Thoughtless site construction scheme | ● | [39,80] | |||
| Basic Information | Account | |
|---|---|---|
| Your workplace | Owner | 31.43% |
| Design unit | 11.43% | |
| Material and equipment supplier | 4.29% | |
| Prefabrication plant | 17.14% | |
| Construction unit | 30.00% | |
| Consulting unit | 1.43% | |
| Other | 4.29% | |
| Years have you worked in prefabricated construction | Less than 5 years. | 28.57% |
| 6–10 years. | 51.43% | |
| 11–15 years. | 14.29% | |
| More than 15 years | 5.71% | |
| The number of prefabricated building projects you have involved | 0 | 2.86% |
| 1 | 18.57% | |
| 2 | 32.86% | |
| 3 | 35.71% | |
| 4 or more | 10.00% | |
| R1 | R2 | R3 | R4 | R5 | R6 | R7 | R8 | R9 | R10 | R11 | R12 | R13 | R14 | R15 | R16 | R17 | R18 | R19 | R20 | R21 | R22 | R23 | R24 | R25 | R26 | R27 | R28 | R29 | R30 | R31 | R32 | R33 | R34 | R35 | R36 | R37 | |
| R1 | 0 | 0 | 18 | 0 | 0 | 0 | 0 | 0 | 0 | 0 | 0 | 0 | 0 | 0 | 0 | 13 | 0 | 16 | 0 | 17 | 0 | 0 | 0 | 0 | 0 | 0 | 0 | 0 | 0 | 27 | 0 | 0 | 0 | 0 | 0 | 13 | 0 |
| R2 | 0 | 0 | 14 | 0 | 0 | 0 | 0 | 0 | 0 | 0 | 0 | 0 | 0 | 0 | 0 | 9 | 0 | 11 | 0 | 12 | 0 | 0 | 0 | 0 | 0 | 0 | 0 | 0 | 0 | 0 | 0 | 0 | 0 | 0 | 0 | 0 | 0 |
| R3 | 0 | 0 | 0 | 0 | 0 | 0 | 0 | 0 | 0 | 0 | 0 | 0 | 0 | 0 | 0 | 9 | 0 | 0 | 0 | 12 | 0 | 0 | 0 | 0 | 0 | 0 | 0 | 0 | 0 | 18 | 0 | 0 | 0 | 0 | 0 | 13 | 0 |
| R4 | 0 | 0 | 0 | 0 | 0 | 10 | 16 | 0 | 17 | 0 | 0 | 0 | 0 | 0 | 0 | 0 | 0 | 0 | 0 | 0 | 0 | 0 | 0 | 0 | 0 | 0 | 0 | 0 | 0 | 11 | 0 | 0 | 0 | 0 | 0 | 11 | 0 |
| R5 | 0 | 0 | 0 | 0 | 0 | 8 | 0 | 18 | 10 | 17 | 0 | 0 | 0 | 0 | 0 | 0 | 0 | 0 | 0 | 11 | 0 | 0 | 0 | 0 | 0 | 0 | 0 | 0 | 0 | 0 | 0 | 0 | 0 | 0 | 0 | 0 | 0 |
| R6 | 0 | 0 | 0 | 0 | 0 | 0 | 0 | 0 | 0 | 0 | 0 | 9 | 0 | 0 | 11 | 24 | 0 | 0 | 0 | 0 | 0 | 0 | 0 | 0 | 0 | 0 | 0 | 0 | 0 | 0 | 0 | 0 | 0 | 0 | 0 | 0 | 0 |
| R7 | 0 | 0 | 0 | 0 | 0 | 0 | 0 | 0 | 0 | 0 | 0 | 0 | 0 | 0 | 0 | 0 | 0 | 19 | 0 | 5 | 0 | 0 | 0 | 0 | 0 | 0 | 0 | 0 | 0 | 0 | 0 | 0 | 0 | 0 | 0 | 0 | 0 |
| R8 | 0 | 0 | 0 | 0 | 0 | 0 | 0 | 0 | 0 | 0 | 0 | 0 | 0 | 0 | 0 | 0 | 0 | 0 | 0 | 0 | 0 | 0 | 0 | 0 | 0 | 0 | 0 | 0 | 0 | 0 | 0 | 0 | 0 | 0 | 10 | 0 | 0 |
| R9 | 0 | 0 | 0 | 0 | 0 | 0 | 0 | 0 | 0 | 0 | 0 | 14 | 0 | 0 | 10 | 8 | 0 | 0 | 0 | 0 | 0 | 0 | 0 | 0 | 0 | 0 | 0 | 0 | 0 | 0 | 12 | 0 | 0 | 0 | 0 | 0 | 0 |
| R10 | 0 | 0 | 0 | 0 | 0 | 0 | 0 | 0 | 0 | 0 | 0 | 0 | 0 | 0 | 0 | 0 | 0 | 0 | 0 | 0 | 0 | 0 | 0 | 0 | 0 | 0 | 0 | 0 | 0 | 0 | 0 | 7 | 0 | 0 | 18 | 0 | 0 |
| R11 | 0 | 0 | 0 | 0 | 0 | 17 | 0 | 0 | 13 | 0 | 0 | 0 | 0 | 0 | 0 | 0 | 0 | 0 | 0 | 0 | 0 | 0 | 0 | 0 | 0 | 0 | 0 | 0 | 0 | 0 | 0 | 0 | 0 | 0 | 0 | 0 | 0 |
| R12 | 0 | 0 | 0 | 0 | 0 | 0 | 0 | 0 | 0 | 0 | 0 | 0 | 0 | 0 | 10 | 0 | 0 | 0 | 0 | 0 | 0 | 0 | 0 | 0 | 0 | 0 | 0 | 0 | 0 | 0 | 0 | 0 | 0 | 0 | 0 | 0 | 0 |
| R13 | 0 | 0 | 0 | 0 | 0 | 0 | 0 | 0 | 0 | 0 | 0 | 0 | 0 | 0 | 0 | 0 | 0 | 0 | 0 | 0 | 0 | 0 | 0 | 0 | 0 | 0 | 0 | 0 | 0 | 0 | 0 | 0 | 0 | 0 | 0 | 0 | 0 |
| R14 | 0 | 0 | 0 | 0 | 0 | 0 | 0 | 0 | 0 | 0 | 0 | 0 | 0 | 0 | 0 | 0 | 0 | 0 | 0 | 0 | 0 | 0 | 0 | 0 | 0 | 0 | 0 | 0 | 0 | 0 | 0 | 0 | 0 | 0 | 0 | 0 | 0 |
| R15 | 0 | 0 | 0 | 0 | 0 | 0 | 0 | 0 | 0 | 0 | 0 | 0 | 0 | 0 | 0 | 0 | 0 | 13 | 0 | 0 | 0 | 0 | 0 | 0 | 0 | 0 | 0 | 0 | 0 | 0 | 0 | 0 | 0 | 0 | 0 | 0 | 0 |
| R16 | 0 | 0 | 0 | 0 | 0 | 0 | 0 | 0 | 0 | 0 | 0 | 0 | 0 | 0 | 0 | 0 | 0 | 9 | 0 | 0 | 0 | 0 | 0 | 0 | 0 | 0 | 0 | 0 | 0 | 0 | 0 | 0 | 0 | 0 | 0 | 0 | 0 |
| R17 | 0 | 0 | 0 | 0 | 0 | 0 | 0 | 0 | 0 | 0 | 0 | 0 | 0 | 0 | 0 | 0 | 0 | 0 | 0 | 0 | 0 | 0 | 0 | 0 | 0 | 0 | 0 | 0 | 0 | 0 | 0 | 0 | 0 | 0 | 0 | 0 | 0 |
| R18 | 0 | 0 | 0 | 0 | 0 | 0 | 0 | 0 | 0 | 0 | 0 | 0 | 0 | 0 | 0 | 0 | 25 | 0 | 0 | 0 | 0 | 0 | 0 | 0 | 0 | 0 | 0 | 0 | 0 | 0 | 0 | 0 | 0 | 0 | 0 | 0 | 0 |
| R19 | 0 | 0 | 0 | 0 | 0 | 0 | 0 | 0 | 0 | 0 | 0 | 12 | 0 | 0 | 0 | 0 | 0 | 0 | 0 | 0 | 0 | 0 | 0 | 0 | 0 | 0 | 0 | 0 | 0 | 0 | 0 | 0 | 0 | 0 | 0 | 0 | 0 |
| R20 | 0 | 0 | 0 | 0 | 0 | 0 | 0 | 0 | 0 | 0 | 0 | 0 | 0 | 0 | 15 | 0 | 0 | 0 | 0 | 0 | 0 | 0 | 0 | 0 | 0 | 0 | 0 | 0 | 0 | 0 | 0 | 0 | 0 | 0 | 0 | 0 | 0 |
| R21 | 0 | 0 | 30 | 0 | 0 | 0 | 18 | 0 | 0 | 0 | 0 | 0 | 0 | 0 | 0 | 0 | 0 | 0 | 11 | 0 | 0 | 0 | 0 | 0 | 0 | 23 | 0 | 11 | 0 | 0 | 9 | 0 | 0 | 0 | 0 | 0 | 20 |
| R22 | 9 | 0 | 0 | 12 | 10 | 26 | 0 | 0 | 13 | 9 | 0 | 0 | 0 | 0 | 0 | 0 | 0 | 0 | 0 | 14 | 0 | 0 | 0 | 0 | 0 | 0 | 0 | 0 | 0 | 0 | 0 | 0 | 0 | 0 | 0 | 0 | 0 |
| R23 | 0 | 0 | 0 | 0 | 0 | 0 | 0 | 0 | 0 | 0 | 0 | 0 | 8 | 13 | 0 | 0 | 0 | 0 | 0 | 0 | 26 | 10 | 0 | 0 | 0 | 0 | 0 | 0 | 9 | 0 | 0 | 0 | 0 | 0 | 0 | 0 | 0 |
| R24 | 0 | 13 | 24 | 0 | 0 | 0 | 0 | 0 | 0 | 0 | 0 | 0 | 0 | 0 | 0 | 0 | 0 | 0 | 0 | 0 | 8 | 0 | 16 | 0 | 0 | 0 | 0 | 0 | 0 | 0 | 0 | 0 | 0 | 0 | 0 | 0 | 0 |
| R25 | 0 | 0 | 0 | 0 | 0 | 0 | 0 | 0 | 0 | 0 | 0 | 0 | 0 | 0 | 0 | 21 | 0 | 10 | 0 | 0 | 0 | 0 | 0 | 0 | 0 | 0 | 0 | 0 | 0 | 0 | 0 | 0 | 0 | 0 | 0 | 0 | 0 |
| R26 | 0 | 0 | 0 | 0 | 0 | 0 | 0 | 0 | 0 | 0 | 0 | 0 | 0 | 0 | 0 | 0 | 0 | 0 | 0 | 0 | 0 | 0 | 0 | 0 | 0 | 0 | 0 | 0 | 0 | 0 | 6 | 9 | 0 | 0 | 15 | 0 | 0 |
| R27 | 0 | 0 | 0 | 0 | 0 | 0 | 0 | 0 | 0 | 0 | 0 | 0 | 23 | 14 | 0 | 0 | 0 | 0 | 0 | 0 | 0 | 19 | 0 | 0 | 0 | 0 | 0 | 0 | 0 | 0 | 0 | 0 | 0 | 0 | 0 | 0 | 0 |
| R28 | 0 | 0 | 0 | 0 | 0 | 0 | 12 | 0 | 0 | 0 | 0 | 0 | 0 | 0 | 0 | 0 | 0 | 0 | 0 | 0 | 0 | 0 | 0 | 0 | 0 | 10 | 0 | 0 | 0 | 0 | 0 | 0 | 0 | 0 | 0 | 0 | 0 |
| R29 | 0 | 0 | 0 | 0 | 0 | 0 | 0 | 11 | 0 | 0 | 0 | 0 | 0 | 9 | 0 | 0 | 0 | 0 | 17 | 0 | 0 | 0 | 0 | 0 | 0 | 0 | 0 | 0 | 0 | 0 | 0 | 0 | 0 | 0 | 0 | 0 | 0 |
| R30 | 0 | 0 | 0 | 0 | 0 | 0 | 0 | 0 | 0 | 0 | 0 | 0 | 0 | 0 | 12 | 0 | 0 | 0 | 0 | 0 | 0 | 0 | 0 | 0 | 0 | 0 | 0 | 0 | 0 | 0 | 0 | 0 | 0 | 0 | 0 | 0 | 0 |
| R31 | 0 | 0 | 0 | 0 | 0 | 0 | 0 | 0 | 0 | 0 | 0 | 0 | 0 | 0 | 22 | 0 | 0 | 0 | 0 | 0 | 0 | 0 | 0 | 0 | 0 | 0 | 0 | 0 | 0 | 0 | 0 | 0 | 0 | 0 | 0 | 0 | 0 |
| R32 | 0 | 0 | 0 | 0 | 0 | 0 | 0 | 0 | 0 | 0 | 11 | 0 | 0 | 0 | 0 | 0 | 0 | 0 | 0 | 0 | 0 | 0 | 0 | 0 | 0 | 0 | 0 | 0 | 0 | 0 | 0 | 0 | 0 | 0 | 21 | 0 | 0 |
| R33 | 0 | 0 | 0 | 0 | 0 | 0 | 0 | 0 | 0 | 0 | 12 | 0 | 0 | 0 | 0 | 0 | 26 | 0 | 0 | 0 | 0 | 0 | 0 | 0 | 0 | 0 | 0 | 0 | 0 | 0 | 0 | 0 | 0 | 0 | 0 | 0 | 0 |
| R34 | 0 | 0 | 0 | 0 | 0 | 0 | 0 | 0 | 0 | 0 | 0 | 0 | 0 | 0 | 0 | 0 | 18 | 0 | 0 | 0 | 0 | 0 | 0 | 0 | 0 | 0 | 0 | 0 | 0 | 0 | 0 | 0 | 0 | 0 | 0 | 0 | 0 |
| R35 | 0 | 0 | 0 | 0 | 0 | 0 | 0 | 0 | 0 | 0 | 0 | 0 | 0 | 0 | 0 | 0 | 0 | 0 | 0 | 0 | 0 | 0 | 0 | 0 | 0 | 0 | 0 | 0 | 0 | 0 | 0 | 0 | 0 | 0 | 0 | 0 | 0 |
| R36 | 0 | 0 | 0 | 0 | 0 | 0 | 0 | 0 | 0 | 0 | 0 | 0 | 0 | 0 | 14 | 0 | 0 | 0 | 0 | 0 | 0 | 0 | 0 | 0 | 0 | 0 | 0 | 0 | 0 | 0 | 0 | 0 | 0 | 0 | 0 | 0 | 0 |
| R37 | 0 | 0 | 0 | 0 | 0 | 0 | 0 | 0 | 0 | 0 | 0 | 0 | 0 | 0 | 0 | 0 | 0 | 0 | 0 | 0 | 0 | 0 | 0 | 0 | 0 | 0 | 0 | 0 | 0 | 23 | 0 | 0 | 0 | 0 | 0 | 17 | 0 |
| Largest eigenvalue: | 61.724 |
| 2nd largest eigenvalue: | 6.997 |
| Ratio of largest to next: | 8.821 |
| R1 | R2 | R3 | R4 | R5 | R6 | R7 | R8 | R9 | R10 | R11 | R12 | R13 | R14 | R15 | R16 | R17 | R18 | R19 | R20 | R21 | R22 | R23 | R24 | R25 | R26 | R27 | R28 | R29 | R30 | R31 | R32 | R33 | R34 | R35 | R36 | R37 | |
| R1 | 0 | 0 | 1 | 0 | 0 | 0 | 0 | 0 | 0 | 0 | 0 | 0 | 0 | 0 | 0 | 1 | 0 | 1 | 0 | 1 | 0 | 0 | 0 | 0 | 0 | 0 | 0 | 0 | 0 | 1 | 0 | 0 | 0 | 0 | 0 | 1 | 0 |
| R2 | 0 | 0 | 1 | 0 | 0 | 0 | 0 | 0 | 0 | 0 | 0 | 0 | 0 | 0 | 0 | 1 | 0 | 1 | 0 | 1 | 0 | 0 | 0 | 0 | 0 | 0 | 0 | 0 | 0 | 0 | 0 | 0 | 0 | 0 | 0 | 0 | 0 |
| R3 | 0 | 0 | 0 | 0 | 0 | 0 | 0 | 0 | 0 | 0 | 0 | 0 | 0 | 0 | 0 | 1 | 0 | 0 | 0 | 1 | 0 | 0 | 0 | 0 | 0 | 0 | 0 | 0 | 0 | 1 | 0 | 0 | 0 | 0 | 0 | 1 | 0 |
| R4 | 0 | 0 | 0 | 0 | 0 | 1 | 1 | 0 | 1 | 0 | 0 | 0 | 0 | 0 | 0 | 0 | 0 | 0 | 0 | 0 | 0 | 0 | 0 | 0 | 0 | 0 | 0 | 0 | 0 | 1 | 0 | 0 | 0 | 0 | 0 | 1 | 0 |
| R5 | 0 | 0 | 0 | 0 | 0 | 1 | 0 | 1 | 1 | 1 | 0 | 0 | 0 | 0 | 0 | 0 | 0 | 0 | 0 | 1 | 0 | 0 | 0 | 0 | 0 | 0 | 0 | 0 | 0 | 0 | 0 | 0 | 0 | 0 | 0 | 0 | 0 |
| R6 | 0 | 0 | 0 | 0 | 0 | 0 | 0 | 0 | 0 | 0 | 0 | 1 | 0 | 0 | 1 | 1 | 0 | 0 | 0 | 0 | 0 | 0 | 0 | 0 | 0 | 0 | 0 | 0 | 0 | 0 | 0 | 0 | 0 | 0 | 0 | 0 | 0 |
| R7 | 0 | 0 | 0 | 0 | 0 | 0 | 0 | 0 | 0 | 0 | 0 | 0 | 0 | 0 | 0 | 0 | 0 | 1 | 0 | 1 | 0 | 0 | 0 | 0 | 0 | 0 | 0 | 0 | 0 | 0 | 0 | 0 | 0 | 0 | 0 | 0 | 0 |
| R8 | 0 | 0 | 0 | 0 | 0 | 0 | 0 | 0 | 0 | 0 | 0 | 0 | 0 | 0 | 0 | 0 | 0 | 0 | 0 | 0 | 0 | 0 | 0 | 0 | 0 | 0 | 0 | 0 | 0 | 0 | 0 | 0 | 0 | 0 | 1 | 0 | 0 |
| R9 | 0 | 0 | 0 | 0 | 0 | 0 | 0 | 0 | 0 | 0 | 0 | 1 | 0 | 0 | 1 | 1 | 0 | 0 | 0 | 0 | 0 | 0 | 0 | 0 | 0 | 0 | 0 | 0 | 0 | 0 | 1 | 0 | 0 | 0 | 0 | 0 | 0 |
| R10 | 0 | 0 | 0 | 0 | 0 | 0 | 0 | 0 | 0 | 0 | 0 | 0 | 0 | 0 | 0 | 0 | 0 | 0 | 0 | 0 | 0 | 0 | 0 | 0 | 0 | 0 | 0 | 0 | 0 | 0 | 0 | 1 | 0 | 0 | 1 | 0 | 0 |
| R11 | 0 | 0 | 0 | 0 | 0 | 1 | 0 | 0 | 1 | 0 | 0 | 0 | 0 | 0 | 0 | 0 | 0 | 0 | 0 | 0 | 0 | 0 | 0 | 0 | 0 | 0 | 0 | 0 | 0 | 0 | 0 | 0 | 0 | 0 | 0 | 0 | 0 |
| R12 | 0 | 0 | 0 | 0 | 0 | 0 | 0 | 0 | 0 | 0 | 0 | 0 | 0 | 0 | 1 | 0 | 0 | 0 | 0 | 0 | 0 | 0 | 0 | 0 | 0 | 0 | 0 | 0 | 0 | 0 | 0 | 0 | 0 | 0 | 0 | 0 | 0 |
| R13 | 0 | 0 | 0 | 0 | 0 | 0 | 0 | 0 | 0 | 0 | 0 | 0 | 0 | 0 | 0 | 0 | 0 | 0 | 0 | 0 | 0 | 0 | 0 | 0 | 0 | 0 | 0 | 0 | 0 | 0 | 0 | 0 | 0 | 0 | 0 | 0 | 0 |
| R14 | 0 | 0 | 0 | 0 | 0 | 0 | 0 | 0 | 0 | 0 | 0 | 0 | 0 | 0 | 0 | 0 | 0 | 0 | 0 | 0 | 0 | 0 | 0 | 0 | 0 | 0 | 0 | 0 | 0 | 0 | 0 | 0 | 0 | 0 | 0 | 0 | 0 |
| R15 | 0 | 0 | 0 | 0 | 0 | 0 | 0 | 0 | 0 | 0 | 0 | 0 | 0 | 0 | 0 | 0 | 0 | 1 | 0 | 0 | 0 | 0 | 0 | 0 | 0 | 0 | 0 | 0 | 0 | 0 | 0 | 0 | 0 | 0 | 0 | 0 | 0 |
| R16 | 0 | 0 | 0 | 0 | 0 | 0 | 0 | 0 | 0 | 0 | 0 | 0 | 0 | 0 | 0 | 0 | 0 | 1 | 0 | 0 | 0 | 0 | 0 | 0 | 0 | 0 | 0 | 0 | 0 | 0 | 0 | 0 | 0 | 0 | 0 | 0 | 0 |
| R17 | 0 | 0 | 0 | 0 | 0 | 0 | 0 | 0 | 0 | 0 | 0 | 0 | 0 | 0 | 0 | 0 | 0 | 0 | 0 | 0 | 0 | 0 | 0 | 0 | 0 | 0 | 0 | 0 | 0 | 0 | 0 | 0 | 0 | 0 | 0 | 0 | 0 |
| R18 | 0 | 0 | 0 | 0 | 0 | 0 | 0 | 0 | 0 | 0 | 0 | 0 | 0 | 0 | 0 | 0 | 1 | 0 | 0 | 0 | 0 | 0 | 0 | 0 | 0 | 0 | 0 | 0 | 0 | 0 | 0 | 0 | 0 | 0 | 0 | 0 | 0 |
| R19 | 0 | 0 | 0 | 0 | 0 | 0 | 0 | 0 | 0 | 0 | 0 | 1 | 0 | 0 | 0 | 0 | 0 | 0 | 0 | 0 | 0 | 0 | 0 | 0 | 0 | 0 | 0 | 0 | 0 | 0 | 0 | 0 | 0 | 0 | 0 | 0 | 0 |
| R20 | 0 | 0 | 0 | 0 | 0 | 0 | 0 | 0 | 0 | 0 | 0 | 0 | 0 | 0 | 1 | 0 | 0 | 0 | 0 | 0 | 0 | 0 | 0 | 0 | 0 | 0 | 0 | 0 | 0 | 0 | 0 | 0 | 0 | 0 | 0 | 0 | 0 |
| R21 | 0 | 0 | 1 | 0 | 0 | 0 | 1 | 0 | 0 | 0 | 0 | 0 | 0 | 0 | 0 | 0 | 0 | 0 | 1 | 0 | 0 | 0 | 0 | 0 | 0 | 1 | 0 | 1 | 0 | 0 | 1 | 0 | 0 | 0 | 0 | 0 | 1 |
| R22 | 1 | 0 | 0 | 1 | 1 | 1 | 0 | 0 | 1 | 1 | 0 | 0 | 0 | 0 | 0 | 0 | 0 | 0 | 0 | 1 | 0 | 0 | 0 | 0 | 0 | 0 | 0 | 0 | 0 | 0 | 0 | 0 | 0 | 0 | 0 | 0 | 0 |
| R23 | 0 | 0 | 0 | 0 | 0 | 0 | 0 | 0 | 0 | 0 | 0 | 0 | 1 | 1 | 0 | 0 | 0 | 0 | 0 | 0 | 1 | 1 | 0 | 0 | 0 | 0 | 0 | 0 | 1 | 0 | 0 | 0 | 0 | 0 | 0 | 0 | 0 |
| R24 | 0 | 1 | 1 | 0 | 0 | 0 | 0 | 0 | 0 | 0 | 0 | 0 | 0 | 0 | 0 | 0 | 0 | 0 | 0 | 0 | 1 | 0 | 1 | 0 | 0 | 0 | 0 | 0 | 0 | 0 | 0 | 0 | 0 | 0 | 0 | 0 | 0 |
| R25 | 0 | 0 | 0 | 0 | 0 | 0 | 0 | 0 | 0 | 0 | 0 | 0 | 0 | 0 | 0 | 1 | 0 | 1 | 0 | 0 | 0 | 0 | 0 | 0 | 0 | 0 | 0 | 0 | 0 | 0 | 0 | 0 | 0 | 0 | 0 | 0 | 0 |
| R26 | 0 | 0 | 0 | 0 | 0 | 0 | 0 | 0 | 0 | 0 | 0 | 0 | 0 | 0 | 0 | 0 | 0 | 0 | 0 | 0 | 0 | 0 | 0 | 0 | 0 | 0 | 0 | 0 | 0 | 0 | 1 | 1 | 0 | 0 | 1 | 0 | 0 |
| R27 | 0 | 0 | 0 | 0 | 0 | 0 | 0 | 0 | 0 | 0 | 0 | 0 | 1 | 1 | 0 | 0 | 0 | 0 | 0 | 0 | 0 | 1 | 0 | 0 | 0 | 0 | 0 | 0 | 0 | 0 | 0 | 0 | 0 | 0 | 0 | 0 | 0 |
| R28 | 0 | 0 | 0 | 0 | 0 | 0 | 1 | 0 | 0 | 0 | 0 | 0 | 0 | 0 | 0 | 0 | 0 | 0 | 0 | 0 | 0 | 0 | 0 | 0 | 0 | 1 | 0 | 0 | 0 | 0 | 0 | 0 | 0 | 0 | 0 | 0 | 0 |
| R29 | 0 | 0 | 0 | 0 | 0 | 0 | 0 | 1 | 0 | 0 | 0 | 0 | 0 | 1 | 0 | 0 | 0 | 0 | 1 | 0 | 0 | 0 | 0 | 0 | 0 | 0 | 0 | 0 | 0 | 0 | 0 | 0 | 0 | 0 | 0 | 0 | 0 |
| R30 | 0 | 0 | 0 | 0 | 0 | 0 | 0 | 0 | 0 | 0 | 0 | 0 | 0 | 0 | 1 | 0 | 0 | 0 | 0 | 0 | 0 | 0 | 0 | 0 | 0 | 0 | 0 | 0 | 0 | 0 | 0 | 0 | 0 | 0 | 0 | 0 | 0 |
| R31 | 0 | 0 | 0 | 0 | 0 | 0 | 0 | 0 | 0 | 0 | 0 | 0 | 0 | 0 | 1 | 0 | 0 | 0 | 0 | 0 | 0 | 0 | 0 | 0 | 0 | 0 | 0 | 0 | 0 | 0 | 0 | 0 | 0 | 0 | 0 | 0 | 0 |
| R32 | 0 | 0 | 0 | 0 | 0 | 0 | 0 | 0 | 0 | 0 | 1 | 0 | 0 | 0 | 0 | 0 | 0 | 0 | 0 | 0 | 0 | 0 | 0 | 0 | 0 | 0 | 0 | 0 | 0 | 0 | 0 | 0 | 0 | 0 | 1 | 0 | 0 |
| R33 | 0 | 0 | 0 | 0 | 0 | 0 | 0 | 0 | 0 | 0 | 1 | 0 | 0 | 0 | 0 | 0 | 1 | 0 | 0 | 0 | 0 | 0 | 0 | 0 | 0 | 0 | 0 | 0 | 0 | 0 | 0 | 0 | 0 | 0 | 0 | 0 | 0 |
| R34 | 0 | 0 | 0 | 0 | 0 | 0 | 0 | 0 | 0 | 0 | 0 | 0 | 0 | 0 | 0 | 0 | 1 | 0 | 0 | 0 | 0 | 0 | 0 | 0 | 0 | 0 | 0 | 0 | 0 | 0 | 0 | 0 | 0 | 0 | 0 | 0 | 0 |
| R35 | 0 | 0 | 0 | 0 | 0 | 0 | 0 | 0 | 0 | 0 | 0 | 0 | 0 | 0 | 0 | 0 | 0 | 0 | 0 | 0 | 0 | 0 | 0 | 0 | 0 | 0 | 0 | 0 | 0 | 0 | 0 | 0 | 0 | 0 | 0 | 0 | 0 |
| R36 | 0 | 0 | 0 | 0 | 0 | 0 | 0 | 0 | 0 | 0 | 0 | 0 | 0 | 0 | 1 | 0 | 0 | 0 | 0 | 0 | 0 | 0 | 0 | 0 | 0 | 0 | 0 | 0 | 0 | 0 | 0 | 0 | 0 | 0 | 0 | 0 | 0 |
| R37 | 0 | 0 | 0 | 0 | 0 | 0 | 0 | 0 | 0 | 0 | 0 | 0 | 0 | 0 | 0 | 0 | 0 | 0 | 0 | 0 | 0 | 0 | 0 | 0 | 0 | 0 | 0 | 0 | 0 | 1 | 0 | 0 | 0 | 0 | 0 | 1 | 0 |
| Basic Metrics | Equation | Definitions of Basic Metrics |
|---|---|---|
| Average path length | Average path length is defined as the average number of steps along the shortest paths for all possible pairs of network nodes. | |
| Clustering coefficient | The clustering coefficient of a node is the ratio of the number of actual edges there are among neighbors to the number of potential edges there are among neighbors. | |
| Degree distribution | The property of degree distribution p(k) is the proportion of nodes with degree k in the network |
| The Random Network | No. | |||||||||
|---|---|---|---|---|---|---|---|---|---|---|
| 1 | 2 | 3 | 4 | 5 | 6 | 7 | 8 | 9 | 10 | |
| Clustering coefficient | 2.033 | 2.127 | 2.266 | 2.349 | 2.233 | 2.212 | 2.195 | 2.321 | 2.349 | 2.478 |
| Average path length | 0.065 | 0.041 | 0.071 | 0.053 | 0.07 | 0.069 | 0.076 | 0.072 | 0.053 | 0.046 |
| Rank | Risk ID | Eigenvector Centrality | Risk ID | Degree Difference | Risk ID | HITS (Authority) | Risk ID | HITS (Hub) | Risk ID | k-Shell Decomposition |
|---|---|---|---|---|---|---|---|---|---|---|
| 1 | R22 | 0.288456 | R21 | 5 | R20 | 0.489881 | R1 | 0.509800 | R1 | 4 |
| 2 | R3 | 0.276495 | R22 | 5 | R16 | 0.409649 | R3 | 0.367013 | R2 | 4 |
| 3 | R1 | 0.276237 | R1 | 5 | R18 | 0.336063 | R2 | 0.358002 | R3 | 4 |
| 4 | R20 | 0.273462 | R4 | 4 | R30 | 0.317234 | R22 | 0.326439 | R4 | 4 |
| 5 | R15 | 0.269162 | R5 | 4 | R36 | 0.317234 | R4 | 0.297322 | R5 | 4 |
| 6 | R9 | 0.263363 | R23 | 4 | R3 | 0.260739 | R5 | 0.288680 | R6 | 4 |
| 7 | R16 | 0.252491 | R24 | 4 | R6 | 0.246528 | R7 | 0.197609 | R9 | 4 |
| 8 | R6 | 0.241608 | R2 | 3 | R9 | 0.246528 | R25 | 0.178414 | R15 | 4 |
| 9 | R4 | 0.218869 | R27 | 3 | R10 | 0.147169 | R9 | 0.158832 | R16 | 4 |
| 10 | R18 | 0.207733 | R29 | 2 | R7 | 0.115187 | R37 | 0.151798 | R18 | 4 |
| 11 | R5 | 0.200196 | R25 | 2 | R15 | 0.100211 | R21 | 0.146025 | R20 | 4 |
| 12 | R2 | 0.187688 | R33 | 2 | R31 | 0.078133 | R6 | 0.140138 | R22 | 4 |
| 13 | R30 | 0.187094 | R26 | 1 | R1 | 0.078102 | R11 | 0.117965 | R30 | 4 |
| 14 | R36 | 0.187094 | R28 | 1 | R4 | 0.078102 | R16 | 0.080404 | R36 | 4 |
| 15 | R21 | 0.183673 | R37 | 1 | R5 | 0.078102 | R15 | 0.080404 | R21 | 3 |
Publisher’s Note: MDPI stays neutral with regard to jurisdictional claims in published maps and institutional affiliations. |
© 2022 by the authors. Licensee MDPI, Basel, Switzerland. This article is an open access article distributed under the terms and conditions of the Creative Commons Attribution (CC BY) license (https://creativecommons.org/licenses/by/4.0/).
Share and Cite
Song, L.; Li, H.; Deng, Y.; Li, C. Understanding Safety Performance of Prefabricated Construction Based on Complex Network Theory. Appl. Sci. 2022, 12, 4308. https://doi.org/10.3390/app12094308
Song L, Li H, Deng Y, Li C. Understanding Safety Performance of Prefabricated Construction Based on Complex Network Theory. Applied Sciences. 2022; 12(9):4308. https://doi.org/10.3390/app12094308
Chicago/Turabian StyleSong, Liangliang, Haiyan Li, Yongliang Deng, and Chaozhi Li. 2022. "Understanding Safety Performance of Prefabricated Construction Based on Complex Network Theory" Applied Sciences 12, no. 9: 4308. https://doi.org/10.3390/app12094308