Abstract
Using a soil improvement biotechnology based on microbial-induced carbonate precipitation (MICP) to form a horizontal water barrier in foundation pit dewatering can not only achieve a good dewatering control effect, but also control the cost and obtain good economic and environmental benefits. In this study, taking the Shanghai layer ⑨ sand as the research object, the solution injected into the layer ⑨ sand by MICP grouting technology includes bacterial solution (Sporosarcina pasteurii) and cementation solution (urea and CaCl2 solution). The migration mechanism of the bacterial solution and cementation solution in groundwater was analyzed through batch experiment and column test, and the mathematical model of migration was established. The dynamic adsorption characteristics of the S. pasteurii, Ca2+, and urea were obtained by dynamic adsorption test. Through isothermal adsorption test, the Freundlich isotherm was used to describe the isothermal adsorption of S. pasteurii onto fine sand, and the partition coefficient of the S. pasteurii was found to be 1.5 × 10⁻⁷ L/mg. The Langmuir isotherm can be used truly reflect the isothermal adsorption of Ca2+ onto fine sand. The distribution coefficient of the Ca2+ was 7 × 10⁻⁸ L/mg. The maximum adsorption capacity of the solute was 2404.8 mg/kg. The adsorption capacity of the urea was very small. According to the sand column test, the vertical dispersion was 11.5 cm. Due to the obvious size effect of dispersion, the sensitivity of dispersion in actual working conditions should be analyzed in a subsequent numerical simulation. The determined solute transport parameters provide support for the further study of the numerical simulation of the solute transport process of the HSRB formed by MICP grouting technology and provide a basis for further field application.
1. Introduction
Deepening the excavation depth of a foundation pit leads to the deepening of the water level drawdown of the foundation pit dewatering project. When the vertical water proof curtain cannot meet the dewatering requirements, the horizontal curtain should be set. However, traditional horizontal curtain formation methods mostly use mixing pile, diaphragm wall, and high-pressure jet grouting technology. The maximum construction depth is approximately 50 m [1,2], which is not conducive to the formation of a horizontal curtain in a deep aquifer. Meanwhile, the construction process destroys the original structure of the confined aquifer soil [3]. On one hand, traditional grouting materials, such as cement and lime cement, change the pH value of the soil and cause irreversible pollution. On the other hand, most chemical grouting materials are toxic [4]. Therefore, the formation of a traditional horizontal waterproof curtain poses a threat to the ecological environment and hinders the building of a resource-saving and environmentally friendly society.
Microbial-induced carbonate precipitation (MICP) technology has become a popular research topic because of its unique environmental friendliness [5,6,7,8,9]. MICP technology can improve the soil properties, mainly including the soil strength, durability, permeability, pollutant treatment, and crack plugging [10,11,12,13,14]. Most microorganisms are directly extracted from the natural soil environment, and the use of their own reactions to improve soil properties has little impact on the environment. These advantages are incomparable to those of traditional chemical materials. Therefore, using MICP technology to form an environmentally friendly horizontal seepage-reducing body (HSRB) without damaging the soil structure of the deep aquifer, and analyzing the migration mechanism of microorganisms in groundwater, has great scientific research and practical application value.
Three types of microorganisms are used in MICP technology: photosynthetic microorganisms, sulfate-reducing bacteria, and microorganisms related to the nitrogen cycle [15,16,17]. The MICP technology based on urea hydrolysis is the most commonly used method for producing calcium carbonate crystals [18,19,20]. Sporosarcina pasteurii is a typical urease-producing bacterium [16,21,22]. The solution injected into the confined aquifer by MICP grouting technology includes a bacterial solution (S. pasteurii) and cementation solution (urea and CaCl2 solution). For two completely different solutions, the cementation solution was considered as a common solute without biological activity in this study. The migration process of bacteria in groundwater is similar to that of general solutes. In addition to the basic convective diffusion process, bacteria are also affected by filtration, adsorption, desorption, growth, decay, precipitation, and chemotaxis [23]. The establishment of a bacterial migration model requires a certain degree of simplification, and it mainly includes three processes of convection, arrest, and biology [23,24,25].
When there is solute migration in groundwater, the solute will undergo physical, chemical, and biological interactions and continue to change. The migration process is complicated. The soil will adsorb the solute, thus blocking solute migration. The migration model can be divided into an equilibrium model and non-equilibrium model (dynamic adsorption model) according to different assumptions [23]. In the past, most studies have adopted the equilibrium adsorption hypothesis—that is, the adsorption of the solute by soil particles is assumed to be instantaneous [23,26]. However, in many cases, the adsorption of a solute by soil particles is a slow process, and the adsorption often shows nonlinear characteristics [27]. The bacterial migration model considers filtration, adsorption, desorption, death, and other processes, and can fully and accurately describe the migration process of microorganisms in porous media [28,29]. However, many parameters have been introduced into the bacterial migration model, which has increased the difficulty of calculation and reduced the practicability of the model. Therefore, bacterial adsorption can be regarded as equilibrium adsorption or isothermal adsorption. At present, the batch experiment method is used to measure the isothermal adsorption curve to characterize the solute adsorption capacity of soil. Batch experiments are simple in design, offer good control over experimental conditions, and allow for tests to be conducted in multiple replicates. They are therefore very popular to assess the characteristics of bacteria, and are recommended by some guidance documents [30]. Compared with column tests, simple batch experiments are expected to be more reproducible than column studies, although without considering the complex conditions in accurately predicting processes in the field environments [31,32,33,34,35]. Results from batch studies can be appropriately employed in the implementation of MICP technology.
On the basis of comprehensive previous studies, it is necessary to analyze the migration mechanisms of bacteria and cementation in groundwater before using recharge wells to form seepage fields in confined aquifers to drive bacteria and cementation to form a HSRB using MICP technology. In this work, batch experiments were used to carry out dynamic adsorption tests and isothermal adsorption tests to analyze the adsorption characteristics of a bacterial solution and cementation solution in an aquifer. Diffusion tests were used to analyze the dispersion process of the bacterial solution and cementation solution in the aquifer. The migration mathematical model was determined and the migration parameters of each solute were obtained, which provides theoretical support for the formation of a HSRB by MICP technology. It provides a basis for further field application.
2. Materials and Methods
2.1. Materials
2.1.1. Preparation of Bacterial Solution
The bacterium used in the tests was Sporosarcina pasteurii (ATCC 11859), which was purchased from the Shanghai Bioresource Collection Center (SHBCC) which is a biological resource in east China, as shown in Figure 1a.
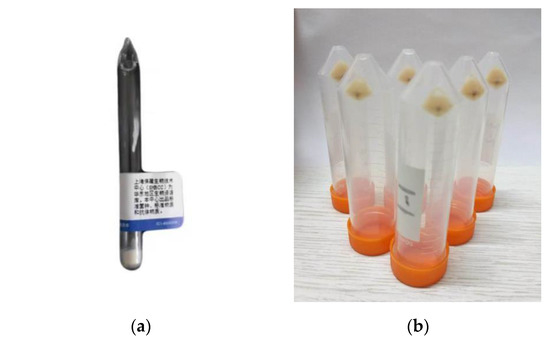
Figure 1.
S. pasteurii: (a) S. pasteurii freeze-dried powder. The Chinese label shows that the Shanghai Bioresource Collection Center (SHBCC) is a biological resource in east China. The Center produces standard strains, standard substances and antibody substances; (b) S. pasteurii after centrifugation.
As the purchased strains of S. pasteurii were stored in freeze-dried powder (Figure 1a), bacterial activation was required. Firstly, a liquid medium containing casein peptone, soybean peptone, sodium chloride, and urea was prepared and sterilized in a high-pressure steam sterilization pot at 121 °C and 101 kPa for 20 min, and then cooled in a sterile environment for use. The S. pasteurii freeze-dried powder was dissolved into a bacterial solution with distilled water, and then poured into the medium test tube and shaken to ensure that it was evenly mixed. Inoculating rings were used to inoculate the solution onto a petri dish, and it was incubated in an incubator at 30 °C for 48 h. White bacterial colonies were formed, indicating that S. pasteurii had been successfully activated.
Then, the activated colonies were added to a culture tube containing 10 mL liquid medium and shaken well. The colonies were oscillated in an oscillator for 48 h at a temperature of 30 °C and a frequency of 200 rpm. Then, 2 mL bacterial mother liquor was added into a 100 mL conical flask and placed in a constant-temperature oscillating chamber, and it was incubated for 48 h at the same temperature and frequency. The concentration of bacterial liquor (OD600 value) was measured by a visible light spectrophotometer every 2 h to obtain the bacterial growth curve (Figure 2).
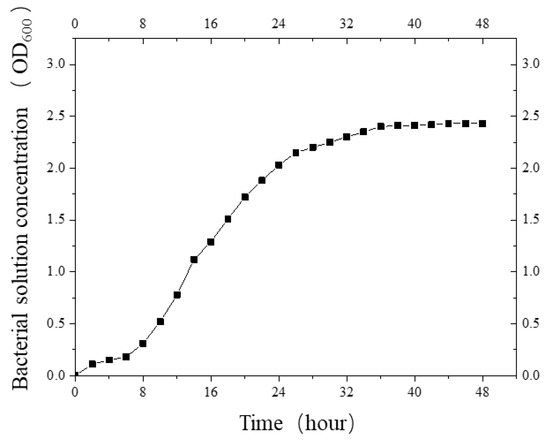
Figure 2.
The growth curve of S. pasteurii.
The bacterial liquid in the conical bottle was poured into a centrifuge tube and centrifuged in a centrifuge. The supernatant was discarded and the remaining S. pasteurii was obtained (Figure 1b). The centrifuged S. pasteurii was placed back into the liquid medium, shaken well, and used as the mother liquid. The previous step was repeated to continuously cultivate the bacterial solution with different concentrations.
Before the experiment, different concentrations (OD600) of bacterial solution were stored in the fridge at 4 °C.
2.1.2. Cementation Solution
A cementation solution is a mixture of calcium ion solution and urea solution [18]. Calcium chloride can significantly increase urease activity and generate more carbonate precipitations, so calcium chloride is the calcium ion source required for optimal MICP technology [36,37]. Therefore, in this experiment, CaCl2 solution was selected to provide a Ca2+ source for MICP technology. The CaCl2 solution was composed of anhydrous calcium chloride and distilled water. Different concentrations of CaCl2 were used in the dynamic adsorption and isothermal adsorption experiments. The urea solution was composed of urea powder and distilled water with a concentration of 1.5 mol/L.
2.1.3. Sand Samples
The sand used in the test was the sand of layer ⑨ in Shanghai, which was collected from the field of the No. 4 well of the “Hard X-ray Free Electron Laser Facility Project”. The particle size of the sand was 0.25~0.50 mm, and its particle distribution is shown in Figure 3.
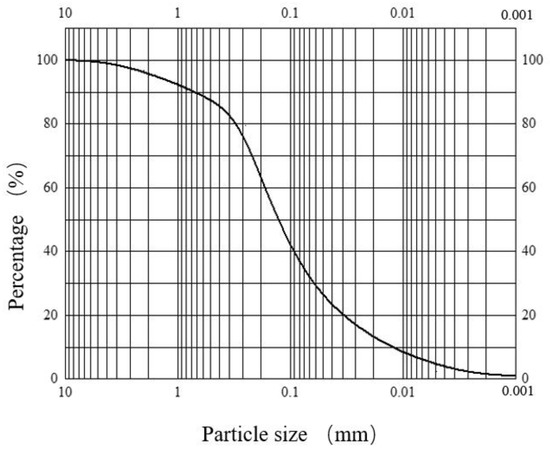
Figure 3.
Particle distribution.
The sand was soaked in 0.2 mol/L HCl for 24 h to completely dissolve the original calcium in the sand sample. Then, the sand samples were rinsed with deionized water and dried in a drying box for 24 h before use.
2.2. Experimental Study on Dynamic Adsorption Characteristics of Solute
The bacterial and cementation solutions used in MICP technology are the solutes migrated in the second confined aquifer sand layer in Shanghai. At present, the process of solute adsorption is mostly described by the isothermal adsorption curve and equation, but isothermal adsorption can only describe the solute in the adsorption equilibrium and not the adsorption speed or the adsorption equilibrium process [23]. Meanwhile, when the MICP technology is used to form the HSRB, water flow is involved, and the solute is in a state of motion [38]. Therefore, the kinetics of the solute adsorption process must be studied by using the silty fine sand from layer ⑨ of Shanghai collected from the No. 4 well to determine the solute adsorption process and the time required to reach the adsorption equilibrium.
- (1)
- Adsorption kinetics of S. pasteurii
In a 20 mL centrifuge tube, 5 g of Shanghai layer ⑨ fine sand and 10 mL of S. pasteurii with OD600 = 0.8 were added. In addition to the actual working conditions of the site, the test environment temperature was set at 20 °C and the sample was oscillated at 200 rpm. To determine the adsorption characteristics of S. pasteurii with time, the oscillation time gradient was set to 0, 20, 40, 60, 80, 100, and 120 min. After shaking, the tube was taken out and left to stand for 2 h to determine the concentration of the bacteria in the supernatant. To reduce the test error, triplicate samples were taken at each point and the average value was represented as the final one. Meanwhile, to eliminate the influence of the wall of the centrifuge tube on the adsorption of the bacterial solution, a centrifuge tube with only 10 mL of bacterial solution was set as the blank control group.
The S. pasteurii adsorption ratio () of Shanghai layer ⑨ fine sand was defined and calculated using the following formula:
where is the adsorption rate of S. pasteurii, %; is the initial concentration of S. pasteurii, cfu/mL; and is the equilibrium concentration of S. pasteurii adsorbed by layer ⑨ fine sand from Shanghai after different times, cfu/mL.
The below Formula (2) was utilized to convert the OD value (UV spectrophotometer) of the microbes into the cell concentration (cells/mL) [39].
where Z is the OD600 value, and Y is the cell concentration (cells ML−1). When using this formula for conversion, OD600 must be in the range of 0.2–0.8. When the OD600 value exceeds this range, it needs to be diluted before conversion.
The mass concentration of S. pasteurii is an important parameter for the analysis of bacterial migration in aquifers, so it was necessary to design a test to determine the mass concentration of the S. pasteurii solution.
Forty-five mL of the bacterial solution with OD600 values of 0.4, 0.6, 0.8, 1.0, and 1.2 were, respectively, added into 50 mL centrifuge tubes and centrifuged in the centrifuge at a speed of 13,000 r/min for 30 min. After centrifugation, the supernatant was removed to obtain S. pasteurii. To reduce the error, triplicate samples were taken for each OD600 value, and the average value was considered as the final one. The mass ms corresponding to each OD600 value of S. pasteurii was calculated by ms = m2 − m1, where m1 was the mass of the centrifuge tube dried before centrifugation, and m2 was the mass of the centrifuge tube containing bacteria with the supernatant removed after centrifugation and dried in the oven at 105 °C. The mass concentration of S. pasteurii was obtained by dividing the mass of S. pasteurii by the corresponding volume.
With the measured mass concentration as the horizontal coordinate and the OD600 value as the vertical coordinate, the relationship curve between the mass concentration and the OD600 value was obtained as shown in Figure 4. The relationship between the mass concentration of S. pasteurii and the OD600 value was established, so that the mass concentration of bacteria could be estimated directly by the OD600 value in the later test.
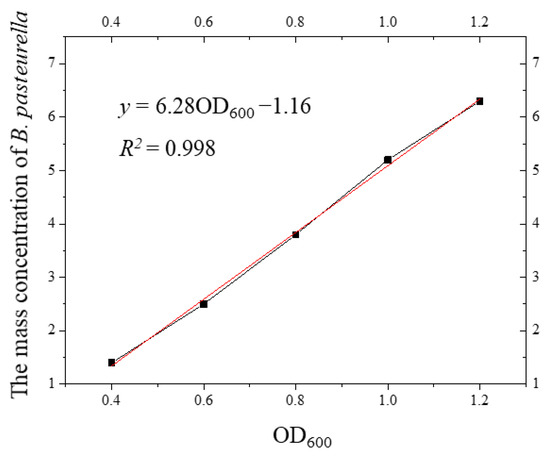
Figure 4.
Curve of the relationship between the mass concentration of S. pasteurii and the OD600 value.
It can be seen from Figure 4 that there was a linear relationship between the mass concentration of S. pasteurii and the OD600 value. The curve of the relationship between the mass concentration of S. pasteurii and the OD600 value was fitted, and the fitting equation was as follows:
where y is the mass concentration of S. pasteurii, mg/mL.
Through the relationship curve and the fitted Formula (3), the corresponding mass concentration of the bacterial solution with different OD600 values could be calculated, and the corresponding mass concentration of S. pasteurii could be accurately and quickly obtained by measuring the OD600 value during the test. Compared with other methods, this method is convenient and feasible, reduces the test time, and improves the test accuracy.
- (2)
- Adsorption kinetics of CaCl2 solution
The experimental method was the same as that of the adsorption kinetics of S. pasteurii. We changed the bacterial solution of S. pasteurii to 111 g/L of CaCl2 solution (1.0 mol/L of CaCl2 solution).
The test was intended to measure the change in Ca2+ concentration. EDTA complexometric titration has the advantages of sensitivity, rapidity, and simplicity and is currently the most widely used method for measuring calcium content. The EDTA method was used to measure the concentration of Ca2+.
An indicator is needed to determine the end point of titration. The calcium red indicator is a common end point indicator for the EDTA determination of calcium. The structural formula is shown in Figure 5.
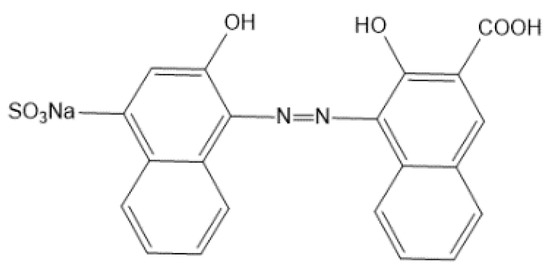
Figure 5.
The structural formula of the calcium red indicator.
The relationship between the color of the calcium indicator and the pH is shown in Figure 6.
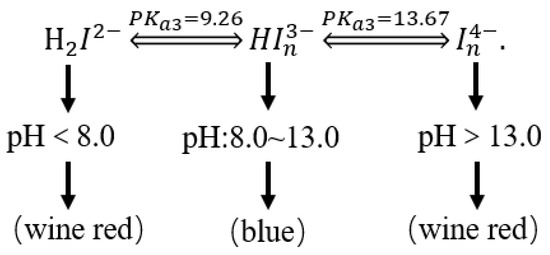
Figure 6.
The relationship between the color of the calcium indicator and the pH.
The calcium red indicator itself is blue. When the pH exceeds 13, it will form a wine-red complex with Ca2+, but the stability of the complex formed by the calcium red indicator and Ca2+ is slightly worse than that of the colorless complex formed by EDTA and Ca2+. Therefore, when the solution is wine red, EDTA is used for determination. After the complexation of free calcium ions, the Ca2+ in the calcium red indicator complex is captured to release Ca2+ in the complex formed by the calcium red indicator and Ca2+, and the solution changes from wine red to blue. This is the end point of the EDTA titration of Ca2+, as shown in Figure 7.
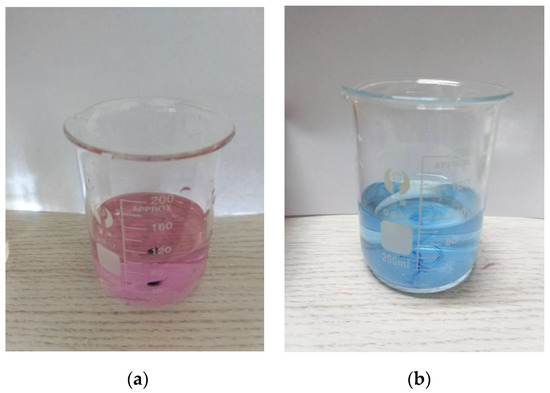
Figure 7.
The solution before and after the end point of titration: (a) wine-red solution before titration end; (b) blue solution at titration end point.
The EDTA complexometric titration steps were as follows. Firstly, an appropriate amount of water sample containing Ca2+ was added to a 250 mL conical flask and diluted to 100 mL with distilled water. Then, an appropriate amount of 2 mol/L sodium hydroxide solution was added to the whole solution, which caused the pH value of the whole solution to exceed 13. Then, the solution was titrated immediately to prevent the solution from settling for too long and causing turbidity. A small amount (approximately 0.05 g) of calcium red indicator was dropped into the solution and then the conical flask was shaken to homogenize the solution. The solution was titrated with the EDTA standard solution until the color of the solution was changed from wine red to blue, which indicated the end of titration. The amount of EDTA standard solution was recorded.
The calcium (Ca2+) content in the water sample (mg/L) was calculated as follows:
where is the molar concentration of EDTA standard solution, mol/L; is the volume of EDTA standard solution consumed in titration, mL; is the volume of the water sample, mL; 40.08 is the atomic weight of calcium.
- (3)
- Adsorption kinetics of urea solution
The test method was the same as that of the adsorption kinetics test of S. pasteurii. We changed the S. pasteurii bacterial solution to a urea solution with a concentration of 1.5 mol/L. The urea concentration could be measured by the RHA502ATC urea concentration meter. The basic principle is to measure the refractive index of the solution by using the total reflection critical angle method and then determine the concentration of the solution. Given its reliable principle, sufficient accuracy to meet actual needs, small volume, easy operation, and other advantages, the total reflection critical angle method was used to measure the urea concentration in the experiment.
2.3. Experimental Study on Isothermal Adsorption Characteristics of Solute
On the basis of the study of the solute dynamic adsorption characteristics in the previous section, the time for dynamic adsorption to reach equilibrium was determined. In this section, the isothermal adsorption characteristics of S. pasteurii and Ca2+ are presented, and the corresponding parameters are obtained, laying the foundation for the further study of the microbial migration behavior in soil, migration theory, and model establishment.
Isothermal adsorption refers to the relationship between the concentration of the solute adsorbed in the solid and liquid phases when the solute adsorption reaches equilibrium under isothermal conditions. When the sand can absorb a certain solute, is the adsorption concentration of the solute for the sand. The solute concentration in the solution is assumed in equilibrium with the solute concentration adsorbed by the porous medium. Sand contains a given substance with a solute concentration of C1 and the corresponding adsorption concentration of will appear in the solid phase. If the concentration of water changes to C2, then the system will reach a new equilibrium, and the adsorption concentration will reach a new concentration (). Multiple tests were repeated; a higher concentration was used than the previous one, and sufficient time was reserved for each replacement to achieve a new equilibrium between the adsorbed and dissolved phases. According to the results of this type of experiment, the curve obtained by plotting dissolved concentration C and adsorption concentration is called the isotherm diagram.
For most solutes in groundwater, the isotherm can be expressed as follows [34]:
The slope of the isotherm is expressed as follows:
The constant (Kf) and index (𝛼) of each compound in each porous medium should be determined one by one. Equation (6) describes the Freundlich isotherm [23]. When the solute concentration is low, the adsorption curve is consistent with the Freundlich isotherm.
When 𝛼 = 1, a linear relationship exists between and , as shown in Equation (7):
where the slope (Kd) of the linear isotherm is called the partition coefficient. is in mg/kg; is in mg/L; and is in L/kg.
The Freundlich isotherm assumes that the amount of solute that can be adsorbed by the solid substrate is infinite, so the adsorption concentration can increase indefinitely with the increase in the solute concentration. The Langmuir isotherm considers the maximum adsorption capacity and is defined as follows [34]:
The slope of the isotherm is equal to
where is the Langmuir constant, and is the maximum adsorption concentration, which indicates the maximum mass of solute adsorbed per unit mass of porous medium. In the case of a low solute concentration, the Langmuir isotherm is approximately linear, .
- (1)
- Isothermal adsorption test of S. pasteurii
In a 20 mL centrifuge tube, 5 g of Shanghai layer ⑨ fine sand and 10 mL of S. pasteurii a solution with OD600 = 0.35, OD600 = 0.63, OD600 = 0.76, OD600 = 0.95, OD600 = 1.16, and OD600 = 1.35 were added. Combined with the actual working conditions of the site, the test environment temperature was set to 20 ℃, and the oscillation was carried out at 200 rpm. According to the results of the dynamic adsorption test, the oscillation time was set to 100 min. After shaking, the tube was taken out, and we left it to stand for two hours to determine the concentration of bacteria in the supernatant. To reduce the error, triplicate samples were taken for each OD600 value, and the average value was considered as the final one. Meanwhile, to eliminate the influence of the wall of the centrifuge tube on the adsorption of the bacterial solution, a centrifuge tube with only 10 mL of bacterial solution was set as the blank control group.
- (2)
- Isothermal adsorption test of CaCl2
In a 20 mL centrifuge tube, 5 g of Shanghai layer ⑨ fine sand and 10 mL CaCl2 solution with a Ca2+ concentration of 24 g/L, 26.45 g/L, 32 g/L, 41.7 g/L, 45.7 g/L, and 58.5 g/L were added. In addition to the actual working conditions of the site, the test environment temperature was set to 20 °C, and the oscillation was carried out at 200 rpm. According to the results of the dynamic adsorption test, the oscillation time was set to 120 min. After shaking, the tube was taken out, and we left it to stand for two hours to determine the concentration of Ca2+ in the supernatant. To reduce the error, triplicate samples were taken for each OD value, and the average value was considered as the final one. Meanwhile, to eliminate the influence of the wall of the centrifuge tube on the adsorption of Ca2+, a centrifuge tube with 10 mL of CaCl2 solution of different concentrations was set as the blank control group.
2.4. Dispersity Sand Column Test
A φ 50 mm × 200 mm plexiglass column was filled with the Shanghai layer of fine sand. Before sand filling, a layer of silicone water-blocking material was coated on the inner wall of the plexiglass cylinder to eliminate the sidewall effect. When the Shanghai layer ⑨ fine sand was loaded, the sand density in the column was uniform by layer compaction, and a layer of 200-mesh nylon as a filter screen was laid at the bottom and top to prevent sand leakage during the test. Urea, which does not react with sand and has a small adsorption capacity, was selected as the tracer to obtain the solute hydraulic dispersion coefficient under the steady flow condition. In addition to the actual working conditions, the test environment temperature was set to 20 °C.
During the test, at least three times pore volumes of the deionized water were injected into the saturated sand column from bottom to top by a peristaltic pump at a flow rate of 0.16 cm/min to remove the air in the sand column. The excess water flowed out from the overflow hole at the top, and the test condition of steady flow was maintained throughout the test. The experiment focused on the seepage in sand under the condition of one-dimensional flow, with the flow direction as the x-axis, ux≠ 0, uy = 0, uz = 0.
A peristaltic pump was used to inject deionized water at least three times pore volume from bottom to top at a flow rate of 0.16 cm/min to remove air from the sand column. When water is injected at a flow rate of 0.16 cm/min, the water head will flow out from the piezometer tube if the flow rate is extremely high. Thus, a hose sealed with rubber mud was inserted into the piezometer hole to prevent the tracer, which was added later, from directly flowing out of the piezometer tube. The peristaltic pump was used to fill water for a period of time. After the seepage reached stability, the test was started, and 10 g of urea was added instantaneously. During the test, a water sample was taken from the pressure tap on the side wall, and the urea concentration was measured at three different time points. The device used to test the dispersity of the sand column is shown in Figure 8.
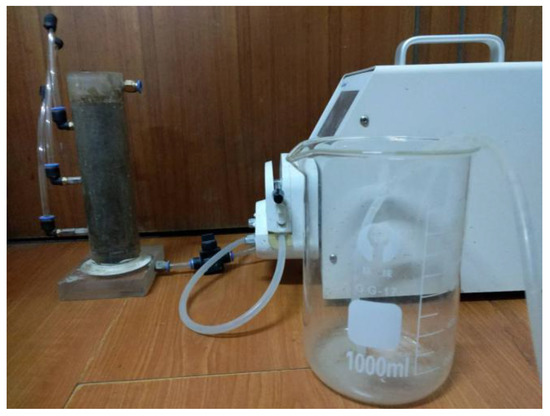
Figure 8.
Sand column test of dispersity.
Three pressure taps from bottom to top were used as observation points A, B, and C to measure the urea concentration. The locations of the three measuring points were 1, 6, and 11 cm.
3. Results and Discussion
3.1. Experimental Study on Dynamic Adsorption Characteristics of Solute
3.1.1. Results of Adsorption Kinetics Test of S. pasteurii
Figure 9 shows the adsorption kinetics curve of S. pasteurii for fine sand of Shanghai layer ⑨. It can be seen that the adsorption of the fine sand on S. pasteurii can be divided into three stages: a rapid adsorption stage, a slow adsorption stage, and an equilibrium adsorption stage. In the rapid adsorption stage (0~20 min), the adsorption rate of S. pasteurii on the fine sand rapidly increased to 4.8%. The adsorption rate of S. pasteurii on the fine sand reached 5.6% from 20 min to 60 min and 6.3% in 60 min. After 60 min, the adsorption reached the equilibrium stage gradually, and the S. pasteurii adsorption rate of layer ⑨ fine sand increased slowly and was basically stable at 6.4%. The results indicate that the S. pasteurii adsorption equilibrium of Shanghai layer ⑨ fine sand can be reached within 60 min. Therefore, the isothermal adsorption test time of layer ⑨ fine sand to S. pasteurii was set to 100 min, which could achieve the full adsorption of S. pasteurii on the layer ⑨ fine sand.
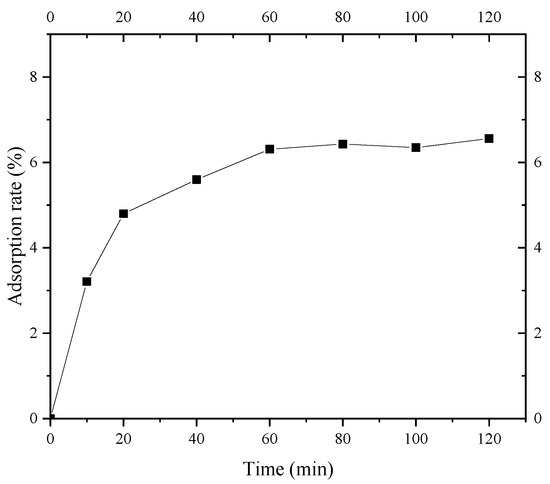
Figure 9.
Adsorption kinetics curve of S. pasteurii.
3.1.2. Results of Adsorption Kinetics of CaCl2 Solution
Figure 10 shows the adsorption kinetics of Ca2+ in a 1 mol/L CaCl2 solution in Shanghai layer ⑨ fine sand. The figure shows that the adsorption of Ca2+ in the CaCl2 solution by Shanghai layer ⑨ fine sand can be divided into three stages. The adsorption reaction starts at 0–10 min, and the adsorption rate is fast. The adsorption rate of Ca2+ by Shanghai layer ⑨ fine sand increases rapidly. From 10 min to 80 min, and the Ca2+ adsorption rate of layer ⑨ silty fine sand in Shanghai is decelerated. After 80 min, the adsorption gradually reaches the equilibrium stage. The above analysis results indicate that the adsorption equilibrium of Ca2+ on layer ⑨ fine sand in Shanghai can be reached within 80 min. Therefore, the isothermal adsorption of Ca2+ on the fine sand of Shanghai layer ⑨ can be fully realized when the test time is set to 120 min.
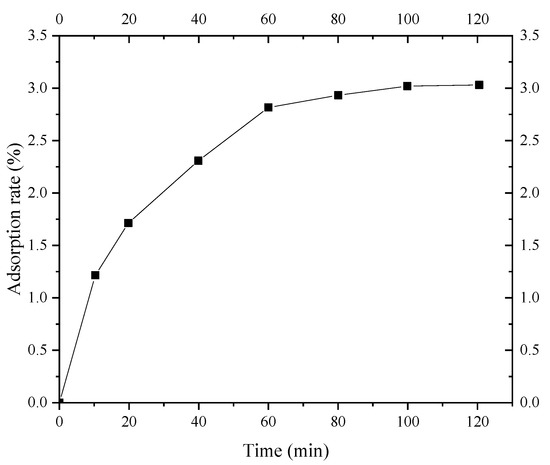
Figure 10.
Adsorption kinetics curve of Ca2+ on layer ⑨ fine sand in Shanghai.
3.1.3. Results of Adsorption Kinetics of Urea Solution
The accuracy of urea concentration measurement with RHA502ATC is 0.1%, and the visual observation error is approximately 0.5%. According to the experimental observation results, when 9% urea solution was used in the experiment, no change in urea concentration could be observed, indicating that the adsorption of urea by the layer ⑨ fine sand from Shanghai was extremely small. When urea was injected into the aquifer together with the CaCl2 solution as the cementing fluid, the adsorption of Ca2+ by Shanghai layer ⑨ fine sand was greater than that of urea. Therefore, the adsorption characteristics of the urea and CaCl2 solutions are considered the same in this study, and the isothermal adsorption test of the urea solution will not be carried out in the future.
3.2. Experimental Study on Isothermal Adsorption Characteristics of Solute
3.2.1. Isothermal Adsorption Test of S. pasteurii
According to the isothermal adsorption test of S. pasteurii at 20 °C, the OD600 value concentration was converted into the mass concentration of bacteria by Formula (3), and the isothermal adsorption line of S. pasteurii in the layer ⑨ fine sand in Shanghai was obtained, as shown in Figure 11. It can be seen that when the concentration of S. pasteurii is OD600 = 1.35 (mass concentration 7.32 g/L), the capacity of the fine sand to adsorb S. pasteurii increases with the bacterial solution concentration, which conforms to the Freundlich isotherm equation. The adsorption capacity increased from 59.3 mg/L with OD600 = 0.35 (mass concentration 1.04 g/L) to 975.7 mg/L with OD600 = 1.35 (mass concentration 7.32 g/L).
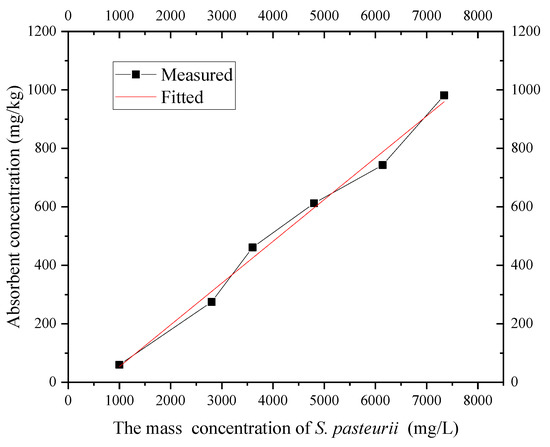
Figure 11.
Adsorption isotherm of S. pasteurii.
In the process of using MICP grouting technology to form a HSRB, the concentration range of S. pasteurii to be used is less than 1.35. Figure 11 shows that the isothermal adsorption of S. pasteurii by Shanghai layer ⑨ fine sand is basically linear within this range. Therefore, the Freundlich isotherm can be used to describe the isothermal adsorption of S. pasteurii onto the fine sand. The parameters after fitting are as shown in Table 1.

Table 1.
Parameters of S. pasteurii adsorption model.
The kinetics of bacterial retention by the porous media was largely influenced by the electrostatic interactions. The greater hydrophobicity of cells and substrata results in greater attractive forces and higher levels of adhesion [40]. The classical Derjaguin–Landau–Verwey–Overbeek (DLVO) theory [41] is used to describe microbial adhesion to solid surfaces; later, Van Oss developed the extended DLVO theory (XDLVO) [42]. S. pasteurii was proven to show moderate hydrophobic attachment with a non-polar solvent [43]. As the hydrophobicity of the cell increases, it also enhances the adhesion property to the sand. This is consistent with the extended XDLVO theory [42], which points out the importance of “hydrophobic attraction” between hydrophobic and hydrophilic surfaces in aqueous media. The results showed the good attachment ability of S. pasteurii to this type of sand.
3.2.2. Isothermal Adsorption Test of CaCl2
According to the isothermal adsorption test of CaCl2 at 20 °C, the isothermal adsorption line of Ca2+ in the layer ⑨ fine sand from Shanghai was obtained, as shown in Figure 12. The figure shows that when the concentration of Ca2+ is below 32 g/L, the S. pasteurii adsorption capacity of Shanghai layer ⑨ fine sand increases with the bacterial solution concentration. When the concentration of Ca2+ exceeded 32 g/L, the maximum S. pasteurii adsorption capacity of Shanghai layer ⑨ fine sand was 2.4 g/kg, and the adsorption capacity did not increase.
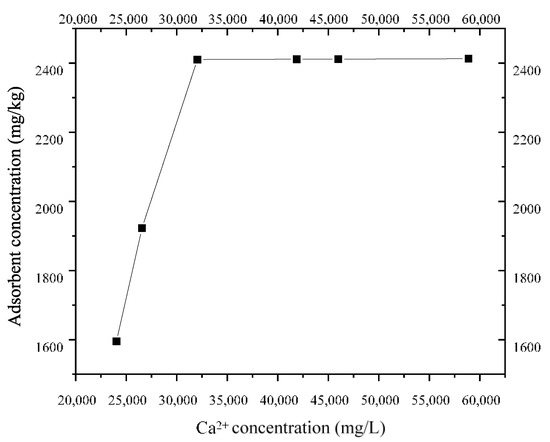
Figure 12.
Adsorption isotherm of Ca2+.
The isothermal adsorption capacity of Ca2+ is described by linear isothermal adsorption (Equation (6)) and Langmuir isothermal adsorption (Equation (7)), as shown in Table 2. The range of Ca2+ concentration may be 20–60 g/L in the process of using MICP technology to form a HSRB. Figure 12 shows that, within this concentration range, the maximum adsorption capacity of Ca2+ by Shanghai layer ⑨ fine sand is 2404.8 mg/kg, and Ca2+ will not be adsorbed indefinitely. Therefore, the Langmuir isotherm can truly reflect the adsorption of Ca2+ by the layer ⑨ fine sand from Shanghai during the migration process.
Table 2.
Parameters of Ca2+ isothermal adsorption model.
3.3. Dispersity Sand Column Test
This dispersion test belongs to the horizontal one-dimensional flow plane two-dimensional dispersion test, and the longitudinal dispersion coefficient can be obtained through the point-by-point method. The calculation formula of the point-by-point method is simple, and the meaning is clear. It avoids complicated mathematical derivation using other methods.
The sand is assumed to be isotropic, homogeneous, and with a one-dimensional stable flow field in the saturated sand, because the sand column is placed vertically. Therefore, the vertical flow direction is taken as the X axis; the horizontal flow direction is the Y and Z axes. When t = 0, 10 g of urea was added as the tracer at the origin, and the initial concentration was zero. If the Z term in the convection dispersion equation is set to zero, then the two-dimensional dispersion equation for the one-dimensional flow is obtained as follows [35]:
The definite solution condition is as follows:
By transformation , Formula (11) is converted to
Finally, the solution of the equation is as follows:
The inner diameter of the PMMA column is small. Thus, if the tracer concentration measured by the observation hole is the concentration on the X axis of the main axis—that is, y = 0—then the concentration calculation (Formula (13)) is transformed into
According to Formula (14), times t1, t2, and t3 correspond to concentrations C1, C2, and C3, respectively. When y = 0, the following two formulas can be obtained on the x-axis:
By applying the logarithm on both sides of Formula (16), we obtain the following:
Then, the expression of longitudinal dispersion coefficient DL is
where x is the coordinate of the observation hole, and the water velocity is u = 0.16 cm/min, being a known quantity. As long as concentrations and at and are measured and brought into Formulas (17) and (18), dispersion coefficient D and retardation coefficient can be obtained by solving the equations simultaneously.
The urea concentration values measured at A, B, and C at different time periods in the layer ⑨ fine sand from Shanghai are shown in Figure 13.
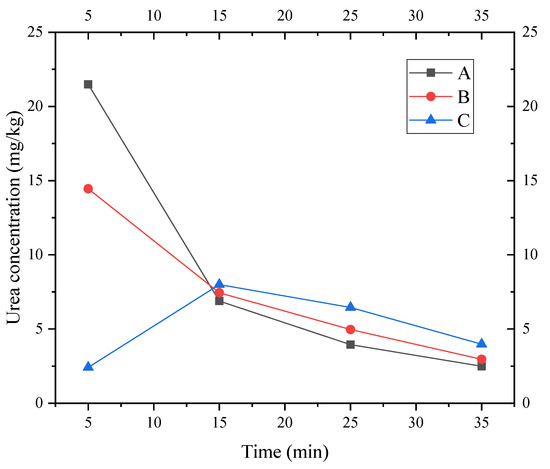
Figure 13.
Urea concentration values of three observation points at different time periods.
The longitudinal dispersion and retardation coefficient of Shanghai layer ⑨ silty fine sand were calculated using Formulas (17) and (18), respectively, as shown in Table 3. Dispersion has an obvious size effect. Thus, the sensitivity of dispersion must be analyzed in actual conditions in a subsequent numerical simulation.
Table 3.
Longitudinal dispersion and block coefficient of fine sand in layer ⑨ of Shanghai.
It is well known that a size effect exists during dispersion. The dispersion observed in the laboratory was closely related to the scale of field observation for the actual dispersion in the field. The result of the current experiments shows that the dispersity observed in the sand column test was lower than that in the field test. The reason may be that the density of the soil column in the laboratory sand column test was larger than that used for the site sand, and the laboratory sand was more uniform than that on the site. The field dispersity test was performed in situ under primarily intact conditions; the structure and composition of the aquifer were not disturbed or damaged, and the obtained dispersion parameters were close to the actual values.
Neuman et al. have conducted numerous statistical analyses on the data of flow paths exceeding 100 m and obtained the empirical formula of field longitudinal dispersion and flow distance as follows [44]:
The flow path cannot be expressed by this formula when it exceeds 100 m, and other formulas are needed to determine the longitudinal dispersion [44]. To overcome this problem, Xu and Eckstein classified the field data reliability of flow paths of different scale into three categories: high, medium, and low [45]. The empirical formula of longitudinal dispersion was obtained through the regression analysis of field data, which was not limited by the size of the flow path.
In the range of the No. 4 well foundation pit, the solute flow path was less than 20 m, and the longitudinal dispersion was calculated as 1.56 m and 1.38 m by using empirical Equations (19) and (20) considering the scale effect. In the context of laboratory-scale tests, the results of vertical dispersion of the sand column obtained by some scholars were approximately 0.2–1.0 cm. In accordance with the results of the sand column test conducted in the current study, the dispersion of fine sand from Shanghai was 11.5 cm. Therefore, the longitudinal dispersion of MICP bacteria and cementation fluid in layer ⑨ silty fine sand ranged from 0.2 cm to 1000 cm.
The solute migrates with the water flow, and its migration rate was mainly determined by the flow velocity. Recharge wells were used to form the seepage field to drive the bacterial liquid. Due to the large quantity of water injected into the recharge well, the flow velocity in the aquifer was large, and the influence of convection was far greater than that of other effects. At this time, it can be considered that only convection occurred in the sand, and the proportion of dispersion was very small. Therefore, it is necessary to determine the influence of longitudinal dispersion ranging from 0.2 cm to 1000 cm on solute migration under field working conditions, where the further sensitivity analysis of longitudinal dispersion is necessary in a future study.
4. Conclusions
In this study, the solute migration mechanism of the bacteria and cementation solutions in a confined aquifer was analyzed, and the mathematical model of the solute migration of each solution was determined. The dynamic adsorption characteristics of S. pasteurii, Ca2+, and urea were obtained by dynamic adsorption testing. Through isothermal adsorption testing, the Freundlich isotherm was used to describe the isothermal adsorption of S. pasteurii onto fine sand. The partition coefficient of S. pasteurii was 1.5 × 10⁻⁷ L/mg. The Langmuir isotherm can be used truly reflect the isothermal adsorption of Ca2+ onto fine sand. The Langmuir isotherm constant was 2.98 × 10⁻⁵ L/mg, and the maximum adsorption capacity of the solute was 2404.8 mg/kg. The adsorption capacity of urea was very small and can be ignored. According to the sand column test, the vertical dispersion was 11.5 cm. Due to the obvious size effect of dispersion, the sensitivity of dispersion in actual working conditions should be analyzed in a subsequent numerical simulation. The determined solute transport parameters provide support for the further study of the numerical simulation of the solute transport process of the HSRB formed by MICP grouting technology.
Author Contributions
J.W., Y.L., Y.Z. and X.L. carried out the main research task and wrote the manuscript. J.W. proposed the original idea and contributed to the revision of the obtained results and of the whole manuscript. N.X. and X.H. helped perform the laboratory experiments. W.P., J.Q. and T.Y. helped design the experiment plans. All authors have read and agreed to the published version of the manuscript.
Funding
This research was funded by the Shanghai Municipal Science and Technology Project (18DZ1201300; 19DZ1200900); the Xiamen Road and Bridge Group (XM2017-TZ0151; XM2017-TZ0117); the project of the Key Laboratory of Impact and Safety Engineering (Ningbo University), Ministry of Education (CJ202101); the Shanghai Municipal Science and Technology Major Project (2021SHZDZX0100) and the Fundamental Research Funds for the Central Universities; the Key Laboratory of Land Subsidence Monitoring and Prevention, Ministry of Natural Resources of China (No. KLLSMP202101; KLLSMP202201); Suzhou Rail Transit Line 1 Co., Ltd., and China Railway 15 Bureau Group Co., Ltd.
Institutional Review Board Statement
Not applicable.
Conflicts of Interest
The authors declare no conflict of interest.
References
- Cao, C.Y.; Shi, C.H.; Peng, L.M.; Jiang, S.G.; Liu, S.L.; Liu, J.W. Design method and application of horizontal bottom sealing curtains for deep foundation pits excavated in deep aquifers with high permeability. J. Cent. South Univ. Sci. Technol. 2020, 51, 1012–1021. [Google Scholar] [CrossRef]
- Cao, S.H.; Che, C.H.; Ji, Y.A. Application of Deep Horizontal Bottom Sealing to Groundwater Control of Foundation Pit with Super-thick Sand and Pebble Layer. Tunn. Constr. 2019, 39, 1657–1665. [Google Scholar] [CrossRef]
- Zhang, Z.X.; Li, J.Y. Summary and application of MJS foundation treatment technology. Civil Archit. Environ. Eng. 2017, 6, 1. [Google Scholar]
- Qian, C.X.; Wang, A.H.; Wang, X. Advances of soil improvement with bio-grouting. Rock Soil Mech. 2015, 36, 1537–1548. [Google Scholar] [CrossRef]
- Chang, I.; Im, J.; Cho, G.C. Introduction of microbial biopolymers in soil treatment for future environmentally-friendly and sustainable geotechnical engineering. Sustainability 2016, 8, 251. [Google Scholar] [CrossRef]
- Márcia, A.S.; Katia, K.K.; Vanderley, M.J.; Henrique, K.; Marcos, M.F. Sand bioconsolidation through the precipitation of calcium carbonate by two ureolytic bacteria. Mater. Lett. 2011, 65, 1730–1733. [Google Scholar] [CrossRef]
- Martinez, B.C.; DeJong, J.T.; Ginn, T.R.; Montoya, B.M.; Barkouki, T.H.; Hunt, C.; Tanyu, B.; Major, D. Experimental Optimization of Microbial-Induced Carbonate Precipitation for Soil Improvement. J. Geotech. Geoenviron. Eng. 2013, 139, 587–598. [Google Scholar] [CrossRef]
- Aamir, M.; Abdelmalek, B.; Will, P.G. Unconfined compressive strength and visualization of the microstructure of coarse sand subjected to different Biocementation levels. J. Geotech. Geoenviron. Eng. 2019, 145, 04019033. [Google Scholar] [CrossRef]
- Azadi, M.; Ghayoomi, M.; Shamskia, N.; Kalantari, H. Physical and mechanical properties of reconstructed bio-cemented sand. Soils Found. 2017, 57, 698–706. [Google Scholar] [CrossRef]
- Ashraf, M.S.; Azahar, S.B.; Yusof, N.Z. Soil improvement using MICP and biopolymers: A review. IOP Conf. Ser. Mater. Sci. Eng. 2017, 226, 22612058. [Google Scholar] [CrossRef]
- Pitcha, J.; Janprasit, K.; Nuaklong, P.; Pungrasmi, W.; Likitlersuang, S. Investigation of the crack healing performance in mortar using microbially induced calcium carbonate precipitation (MICP) method. Constr. Build. Mater. 2019, 212, 737–744. [Google Scholar] [CrossRef]
- Zhu, X.J.; Li, W.L.; Zhan, L.; Huang, M.S.; Zhang, Q.Z.; Achal, V. The large-scale process of microbial carbonate precipitation for nickel remediation from an industrial soil. Environ. Pollut. 2016, 219, 149–155. [Google Scholar] [CrossRef] [PubMed]
- Liu, B.; Zhu, C.; Tang, C.S.; Xie, Y.H.; Yin, L.Y.; Cheng, Q.; Shi, B. Bio-remediation of desiccation cracking in clayey soils through microbially induced calcite precipitation (MICP). Eng. Geol. 2020, 264, 264105389. [Google Scholar] [CrossRef]
- Van Tittelboom, K.; De Belie, N.; De Muynck, W.; Verstraete, W. Use of bacteria to repair cracks in concrete. Cem. Concr. Res. 2010, 40, 157–166. [Google Scholar] [CrossRef]
- Castanier, S.; Metayer-Levrel, G.L.; Perthuisot, J.P. Ca-carbonates precipitation and limestone genesis-the microbiogeologist point of view. Sediment. Geol. 1999, 126, 9–23. [Google Scholar] [CrossRef]
- Zhao, Q.; Li, L.; ASCE, M.; Li, C.; Li, M.; Amini, F.; ASCE, F.; Zhang, H.Z. Factors Affecting Improvement of Engineering Properties of MICP-Treated Soil Catalyzed by Bacteria and Urease. J. Mater. Civ. Eng. 2014, 26, 04014094. [Google Scholar] [CrossRef]
- Baskar, S.; Baskar, R.; Mauclaire, L.; McKenzie, J.A. Microbially induced calcite precipitation in culture experiments: Possible origin for stalactites in Sahastradhara caves, Dehradun. India. Curr. Sci. 2006, 90, 58–64. [Google Scholar]
- Bachmeier, K.L.; Williams, A.E.; Warmington, J.R.; Bang, S.S. Urease activity in microbiologically-induced calcite precipitation. J. Biotechnol. 2002, 93, 171–181. [Google Scholar] [CrossRef]
- Mondal, S.; Ghosh, A. Review on microbial induced calcite precipitation mechanisms leading to bacterial selection for microbial concrete. Constr. Build. Mater. 2019, 225, 67–75. [Google Scholar] [CrossRef]
- Kim, G.; Kim, J.; Youn, H. Effect of Temperature, pH, and Reaction Duration on Microbially Induced Calcite Precipitation. Appl. Sci. 2018, 8, 1277. [Google Scholar] [CrossRef]
- Stabnikov, V.; Jian, C.; Ivanov, V.; Li, Y.S. Halotolerant, alkaliphilic urease-producing bacteria from different climate zones and their application for biocementation of sand. World J. Microbiol. Biotechnol. 2013, 29, 1453–1460. [Google Scholar] [CrossRef] [PubMed]
- Jiang, N.J.; Tang, C.S.; Yin, L.Y.; Xie, Y.H.; Shi, B. Applicability of microbial calcification method for sandy-slope surface erosion control. J. Mater. Civ. Eng. 2019, 31, 04019250. [Google Scholar] [CrossRef]
- Yates, M.V.; Yates, S.R.; Wagner, J.; Gerba, C.P. Modeling virus survival and transport in the subsurface. J. Contam. Hydrol. 1987, 1, 329–345. [Google Scholar] [CrossRef]
- Dai, C.M.; Zhou, H.; Liu, S.G.; Tan, B.; Wan, Y.Q. Review on research on co-transport of contaminants and colloids in the porous media of groundwater. J. Water Resour. Water Eng. 2017, 28, 15–23. [Google Scholar] [CrossRef]
- Sen, T.K.; Khilar, K.C. Review on subsurface colloids and colloid-associated contaminant transport in saturated porous media. Adv. Colloid Interface Sci. 2006, 119, 71–96. [Google Scholar] [CrossRef]
- Schijven, J.F.; Hassanizadeh, S.M.; Dowd, S.E.; Pillai, S.D. Modeling virus adsorption in batch and column experiments. Quant. Microbiol 2000, 2, 5–20. [Google Scholar] [CrossRef]
- Sadeghi, G.; Schijven, J.F.; Behrends, T.; Hassanizadeh, S.M.; Genuchten, M.T. Bacteriophage PRD1 batch experiments to study attachment, detachment and inactivation processes. J. Contam. Hydrol. 2013, 152, 12–17. [Google Scholar] [CrossRef]
- Bhattacharjee, S.; Ryan, J.N.; Elimelech, M. Virus transport in physically and geochemically heterogeneous subsurface porous media. J. Contam. Hydrol. 2002, 57, 161–187. [Google Scholar] [CrossRef]
- Bradford, S.A.; Bettahar, M. Straining, attachment, and detachment of Cryptocysts in saturated porous media. J. Environ. Qual. 2005, 34, 469–478. [Google Scholar] [CrossRef]
- Bart, F.; Dimitri, V. A systematic approach to in situ bioremediation in groundwater. Remediation 2003, 13, 27–52. [Google Scholar] [CrossRef]
- Foppen, J.W.A.; Schijven, J.F. Evaluation of data from the literature on the transport and survival of Escherichia coli and thermotolerant coliforms in aquifers under saturated conditions. Water Res. 2006, 40, 401–426. [Google Scholar] [CrossRef] [PubMed]
- McClellan, K. A New Approach to Groundwater Remediation Treatability Studies-Moving Flow-through Column Experiments from Laboratory to In Situ Operation. Ph.D. Thesis, Arizona State University, Tempe, AZ, USA, 2013. [Google Scholar]
- Zhao, B.; Zhang, H.; Zhang, J.; Jin, Y. Virus adsorption and inactivation in soil as influenced by autochthonous microorganisms and water content. Soil Biol. Biochem. 2008, 40, 649–659. [Google Scholar] [CrossRef]
- Jiang, G.M.; Noonan, M.J.; Buchan, G.D.; Smith, N. Transport of Escherichia coli through variably saturated sand columns and modeling approaches. J. Contam. Hydrol. 2007, 93, 2–20. [Google Scholar] [CrossRef] [PubMed]
- Treumann, S.; Torkzaban, S.; Bradford, S.A.; Visalakshan, R.M.; Page, D. An explanation for differences in the process of colloid adsorption in batch and column studies. J. Contam. Hydrol. 2014, 164, 219–229. [Google Scholar] [CrossRef]
- Abo-El-Enein, S.A.; Ali, A.H.; Talkhan, F.N.; Abdel-Gawwad, H.A. Utilization of microbial induced calcite precipitation for sand consolidation and mortar crack remediation. Hbrc J. 2012, 8, 185–192. [Google Scholar] [CrossRef]
- Achal, V.; Pan, X. Influence of calcium sources on microbially induced calcium carbonate precipitation by Bacillus sp. CR2. Appl. Biochem. Biotechnol. 2014, 173, 307–317. [Google Scholar] [CrossRef] [PubMed]
- Tang, C.S.; Yin, L.Y.; Jiang, N.J.; Zhu, C.; Zeng, H.; Li, H.; Shi, B. Factors affecting the performance of microbial-induced carbonate precipitation (MICP) treated soil: A review. Environ. Earth Sci. 2020, 79, 1–23. [Google Scholar] [CrossRef]
- Ramachandran, S.K.; Ramakrishnan, V.; Bang, S.S. Remediation of concrete using microorganisms. ACI Mater. J 2001, 98, 3–9. [Google Scholar]
- Jacobs, A.; Lafolie, F.; Herry, J.M.; Debroux, M. Kinetic adhesion of bacterial cells to sand: Cell surface properties and adhesion rate. Colloids Surf. B-Biointerfaces 2007, 59, 35–45. [Google Scholar] [CrossRef] [PubMed]
- Marshall, K.C.; Ruby, S.; Ralph, M. Selective sorption of bacteria from seawater. Can. J. Microbiol. 1971, 17, 1413–1416. [Google Scholar] [CrossRef]
- Vanoss, C.J. Energetics of cell-cell and cell bio-polymer interactions. Cell Biophys. 1989, 14, 1–16. [Google Scholar] [CrossRef] [PubMed]
- Arpita, M.; Shrey, M.; Suchismita, R.; Arpita, P.; Shrabani, P.; Koushik, D.; Tanmay, P.; Keshab, C.M.; Dilip Kumar, N. Assessment of efficacy of a potential probiotic strain and its antiuremic and antioxidative activities. e-SPEN J. 2013, 8, 155–163. [Google Scholar] [CrossRef]
- Neuman, S.P.; Zhang, Y.K. A quasi-liner theory of non-Fickian and Fickian subsurface dispersion, 1. Theoretical analysis with application to isotropic media. Water Resour. Res. 2010, 26, 887–902. [Google Scholar] [CrossRef]
- Xu, M.; Eckstein, Y. Use of weighted leastsquares method in evaluation of the relationship between dispersivity and field scale. Ground Water. 1995, 33, 905–908. [Google Scholar] [CrossRef]


Disclaimer/Publisher’s Note: The statements, opinions and data contained in all publications are solely those of the individual author(s) and contributor(s) and not of MDPI and/or the editor(s). MDPI and/or the editor(s) disclaim responsibility for any injury to people or property resulting from any ideas, methods, instructions or products referred to in the content. |
© 2022 by the authors. Licensee MDPI, Basel, Switzerland. This article is an open access article distributed under the terms and conditions of the Creative Commons Attribution (CC BY) license (https://creativecommons.org/licenses/by/4.0/).