Abstract
Poor durability of reinforced concrete structures can lead to serious structural failures. An accurate model to observe the effects of aggressive agents like carbonation, sulfate ingress, and seawater solutions on the solid phase assemblage will help designers and specifiers better understand how cement behaves in these environments. This paper presents the first steps in developing such a model using the PHREEQC geochemical software by accounting for alkali binding and dissolution. It also presents the use of discrete solid phases (DSPs) to account for the solid-solution behaviour of siliceous hydrogarnet and magnesium silicate hydrate (M-S-H). A new thermodynamic description of the vaterite phase has also been developed for this work using the cemdata18 thermodynamic database. The predicted phase assemblages of cements in these environments here agree with previously published findings using a different thermodynamic model supported with experimental data.
1. Introduction
The chemical environment of cement maintains a high pH pore solution (>12.5) which, in turn, keeps the protective oxide film on steel reinforcement in the passive state and protects it from corrosion. Once the passive layer is broken down, aggressive ions in the concrete including air, water, salt, etc., are free to attack the reinforcement which can, over time, lead to structural instability and failure unless preventative measures are taken. Atmospheric carbon dioxide (CO2) readily dissolves in cement and the carbonic acid this produces partially neutralises the alkalis, reducing the overall pH, with carbonate and bicarbonate ions remaining in solution [1].
In terms of solid hydrates, the dissolution of CO2 during hydration causes the destabilisation of portlandite and ettringite while calcite, gypsum, and aluminum hydroxide precipitates [1]. These changes in the solid hydrates are also accompanied by changes in the pore solutions which affect the sorptivity of reducing alkalis by the C-S-H as calcium is diminished in the system due to ongoing carbonation [2,3,4,5,6]. The changes in the hydrated cement due to carbonation as reported by [7] includes the preference of monosulfate and Friedel salt to monocarbonate which, in turn, forms stratlingite, high Ca;Si C-S-H gels to low Ca:Si C-S-H gels, calcite and water as ettringite dissolves and gibbsite precipitates, leaving sulphate ions in solution.
Sulfate ingress into concrete and mortar can lead to expansion, softening, cracking, and spalling which allow further aggressive agents to enter and cause severe durability issues [8,9,10,11,12]. Sulfates such as Na2SO4 and MgSO4 can be found in groundwater and wastewater that, unless properly accounted for in the design, will lead to costly shutdowns while the concrete is being repaired or replaced. The influence of external sulfates like Na2SO4 lead to additional or ‘secondary’ internal sulfate phases like ettringite and gypsum precipitation along with thaumasite formation that leads to the creation of cracks. Previous work in this area has led to mixed opinions on the influence of cement solid phases on the true cause of crack formation and expansion in cementitious materials subject to sulfate attack [13,14].
The ingress of seawater into cement leads to the conversion or replacement of monocarbonate with Friedel’s salt, along with the removal of typical solid hydrate phases, such as C-S-H, portlandite, ettringite, etc., with a corresponding decrease in solid volume [15,16,17,18,19]. These phases are replaced with Friedel salt, Magnesium Silicate Hydrate (M-S-H), and the re-precipitation of brucite. These changes come with an initial increase in the total volume of ettringite primarily due to the presence of sulfate, carbonate, and magnesium in the seawater.
Thermodynamic modelling of cement hydration offers a reliable means of simulating changes in an anhydrous clinker during its hydration and providing predictions of phase assemblages and pore solution chemistries over time for many cement systems. Accurate predictions are possible once suitable input parameters (clinker oxide proportions, water/cement (w/c) ratio, curing temperature, relative humidity, and the Blaine fineness), an appropriately formatted thermodynamic database, and suitable geochemical software are used with a degree of expertise and a level of understanding to include other practical factors such as oxide components dissolved in the OPC clinker phases, oversaturation of specific phases during the first 12 h of hydration, and the release and uptake of alkali elements (K and Na) by the C-S-H. Most hydration simulations use these factors over time using empirical rate equations to describe the dissolution of OPC clinker phases. The authors have successfully used [20,21] the freely available geochemical software PHREEQC [22] to predict the hydration behaviour of Portland cement over time. PHREEQC employs the law of mass action equations to perform complex geochemical simulations allowing the inclusion of kinetics and rates, and competing reactions between solids, liquids, and gases at equilibrium, details of which can be found in [22]. However, at the time of writing, no models of CO2-induced carbonation or changes in phase assemblage due to seawater, NaCl solution, or sulfate ingress into cement have been developed using the PHREEQC geochemical software.
Previous work on thermodynamic modelling of carbonation has been undertaken by De Weerdt and co-authors [1] who used the Gibbs free energy minimization software GEMS 3.5 [23] with a general thermodynamic database [24] further expanded with the cemdata18 database [25] containing solubility products of solids relevant for cementitious systems. They modelled mortars with two different types of cement (CEM I and CEM II/B-V according to EN 197-1 [26]) exposed to accelerated carbonation conditions. Thermodynamic predictions of the changing phase assemblages and pore solution chemistries were predicted with increasing levels of CO2. Thermodynamic modelling of cement-based mortars subject to increasing sulfate levels by [27] demonstrated how the solid hydrates in partially hydrated systems were converted to higher volumes of ettringite, gypsum precipitates, and thaumasite formation as the amount of Na2SO4 solution increased.
In the current paper, the phase assemblages have been predicted for a CEM I commercial cement undergoing separate carbonation, sulfate, NaCl, and seawater-induced reactions using the geochemical code PHREEQC. The cemdata18 thermodynamic database was used with several Discrete Solid Phases (DSPs) used to represent the solid solution CSHQ and M-S-H models. Due to the amorphous and poorly crystalline nature of C-S-H in cement with a corresponding range of Ca/Si ratios (0.6–1.7), it displays a strongly incongruent dissolution behaviour [28] where the release of calcium into solution is several orders of magnitude greater than that of silicon. A suitable C-S-H gel solubility model is therefore required to accurately describe its variable composition and solubility behaviour and predict stable phase assemblages, pH, and pore chemistries. While solid solution analysis is possible in PHREEQC, it has a long computational time. The use of DSPs to model stable phase assemblages etc. has been shown by the authors [21,29] to be a suitable replacement with no loss in accuracy with less computational effort.
2. Materials and Methods
2.1. Materials
A CEM I (Strength Class 42.5 N) cement complying with EN 197-1 [26] was used as the cementitious material.
2.2. Chemical and Minerological Analysis
The oxide proportions in Table 1 were determined by XRF using a PANalytical Axios Advanced XRF spectrometer. The analysis also included measurements for the loss on ignition (LOI) values. The fineness of the cement was determined using an ELE Blaine air permeability apparatus in accordance with EN 196-6 [30].

Table 1.
Cement oxide proportions and clinker composition (g/100 g cement).
3. Thermodynamic Modelling of Cement Hydration
Thermodynamic modelling was done using the PHREEQC geochemistry software using the cemdata18 database. Calculating the normative cement content, clinker dissolution rate, accounting for the accessory phases, oversaturation, and alkalis binding to the C-S-H have been described in detail in previous works [21,29]. The CSHQ solid solution model described in [25] has been used for all calculations. Holmes et al. [21] showed how C-S-H gel solubility can be modelled as a series of discrete solid phases (DSPs) derived from the CSHQ end-members in the cemdata18 database and have been used in the PHREEQC input files throughout this work.
3.1. Thermodynamic Descriptions of Vaterite
While calcite is the most stable calcium carbonate phase under ambient conditions, vaterite has been reported in cements undergoing carbonation in the literature [31,32,33,34]. As this mineral is not present in cemdata18, it was derived here using thermodynamic data in Table 2 and copied into the PHASES data block in the PHREEQC input file. The log K predictions were compared against the van Hoff method which assumes the heat capacity of the reaction is equal to zero. As may be seen in Figure 1, the derivation gives an excellent comparison. Over time, the system will re-crystallise to form the lowest energy assemblage, by the dissolution of vaterite and re-precipitation of calcite, but these calculations show the earliest stable phase assemblage.
Table 2.
Thermodynamic data to derive vaterite phases taken from [25].
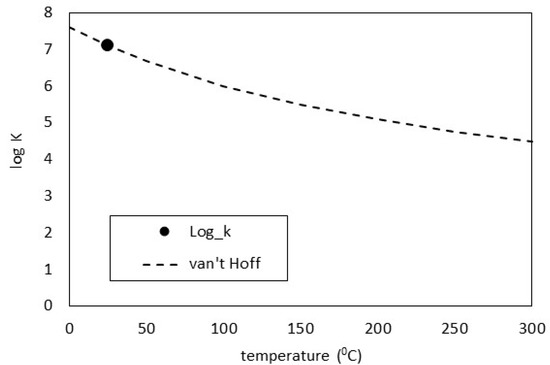
Figure 1.
Vaterite log K comparisons.
3.2. Discrete Solid Phases (DSP) Derivation for M-S-H and Si-Hydrogarnet
The M-S-H series of DSP was defined using the pure end-members and their thermodynamic properties in terms of Gibbs free energy (G, J/mol), enthalpy (H, J/mol), entropy (S, J/K/mol), heat capacity (Cp, J/K/mol), and molar volume (V, cm3/mol) (see Table 3) [21] and used to calculate the solubility constant, log K, and its variation with temperature for dissolution reactions of each end-member (Table 4) using Equation (1). The a, c, and d co-efficients are calculated as functions of enthalpy (∆rH, J/mol), entropy (∆rS, J/K/mol), and heat capacity (∆rCp, J/K/mol) of the reaction [13]. The b, e, and f co-efficients are equal to zero.
log K = a + b·T + c/T + d·log10(T) + e·T−2 + f·T2
Table 3.
Thermodynamic properties of M-S-H as taken from [25].
Table 4.
MSH end-member properties [25].
Mole fraction (in terms of Xi and Xj) increments of 0.2 have been used here to discretize the solid solutions and create the DSP series. The sum of the mole fractions in each solid solution must equal 1. Using these mole fractions, the solid phase composition, aqueous reaction components mass, and volume are determined for each DSP based on the original end-members. The solubility constant is determined for each DSP in the MSH models using Equation (2) with the resulting phases presented in Table 5.
KMSH = (Ki·Xi)Xi·(Kj·Xj)Xj
Table 5.
End-members and DSP for the M-S-H model.
A similar methodology was applied to derive the DSP for the siliceous hydrogarnet, as described in [25] using the thermodynamic data in Table 6 and Table 7 resulting in the phases shown in Table 8.
Table 6.
Thermodynamic properties of Si-hydrogarnet as taken from the cemdata18 database [25]. Letters assigned to each end-member are shown in parentheses.
Table 7.
Si-hydrogarnet end-member properties [25].
Table 8.
End-members and DSP for the Si-hydrogarnet model.
3.3. Description of Input for Models
For the carbonation analysis, the cement described in Table 1 was allowed to hydrate as normal for 28 days, at which point CO2 was introduced into the system increasing in concentration from 0 to 100 g in steps of 5 g. To account for the lowering of the Ca:Si ratio in the C-S-H as Na and K alkalis are absorbed, their concentration in the pore solution was reduced using a distribution co-efficient (kd) [35]. De Weerdt and co-authors [1] allowed the kd value for both Na and K to increase from 0.45 mL/g (Ca:Si = 1.62) to 6.7 mL/g (Ca:Si = 0.67). A similar approach was adopted here. The effect of increasing sodium sulfate (Na2SO4) and magnesium sulfate (MgSO4) ingress on the phase assemblages for the partially hydrated cement at 28 days (assumed to be 80% hydrated) was modelled from 0 to 10,000 mL logarithmically in eleven steps and input into PHREEQC using its molar concentration. Here, the alkali distribution coefficient was taken as 2.46 mL/g which is the average kd for the 1.5–0.85 Ca/Si ratios for both K and Na, as found in [35]. Seawater impact on the hydrating cement was modelled on a fully hydrated cement where the change in the solid phase assemblage was observed with increasing seawater from 0–100,000 g/L logarithmically. The seawater concentration was based on previous research [36] where a sample of Atlantic Ocean water from the north-west of Ireland was tested for its chemical element concentrations, as shown in Table 9.
Table 9.
Atlantic Ocean seawater analysis used to represent the seawater (taken from [36]).
Figure 2 shows the predicted phase assemblage for the OPC described in Table 1. The paste was allowed to hydrate for approximately 28 days before exposure. The hydrates predicted to precipitate include C-S-H, portlandite, monocarbonate, brucite, hydrotalcite, and calcite.
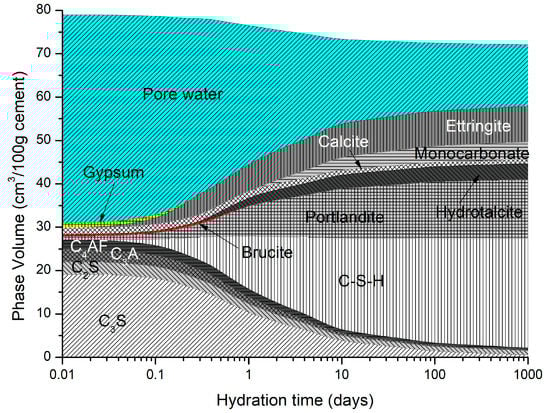
Figure 2.
OPC cement predicted hydrate phases (curing temperature = 20 °C).
The distribution coefficient was allowed to vary from 0.92 mL/g to 1.944 mg/l from Ca:Si ratios of 1.636 to 1.154, respectively. Modelling was undertaken on the cement described in Table 9 using a w/c ratio of 0.5 and a temperature of 20 °C.
4. Analysis Output
4.1. Carbonation
Figure 3 shows the changing phase assemblage as the amount of CO2 increases in 5 g increments. Thermodynamic predictions show the formation of C-S-H, portlandite, ettringite, strätlingite, hydrotalcite, and a small amount of calcite in the non-carbonated paste, as seen in previous work by de Weerdt et al. [1] and observed by experimental SEM-EDS and TGA analysis data. The change in solid hydrate volume (separated into major and minor phases for ease of reading) with pH as carbonation continues is shown in Figure 4. As shown, as the pH drops below 13, there is a rapid decrease in C-S-H as portlandite is fully depleted with a corresponding increase in calcite (Figure 4a). There is also a more gradual lowering of ettringite abundance, which continues with increasing CO2 concentration and is fully removed at a pH of approximately 10.5. As the decalcification of C-S-H and ettringite continues, the pH drops further and minor amounts of Quartz, M-S-H, gibbsite, and Ferrihydrite are formed at a pH below 12 (Figure 4b) as the calcium in the system is being converted to calcite. The change in C-S-H Ca:Si ratios is presented in Figure 5. The DSPs used here have accounted for the lowering of the Ca:Si ratio. Previous work by the authors [21] has found that a single C-S-H phase would be suitable to model OPC hydration where decalcification did not occur and both portlandite and C-S-H were stable. This further confirms the accuracy of the DSP phase models for C-S-H, and other phases used here, such as M-S-H and siliceous hydrogarnet.
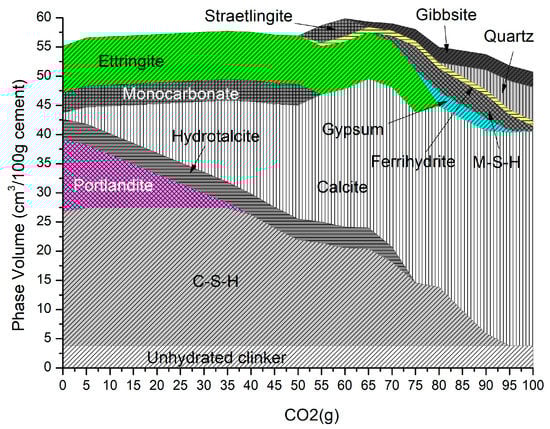
Figure 3.
Phase assemblage with increasing CO2 (g).
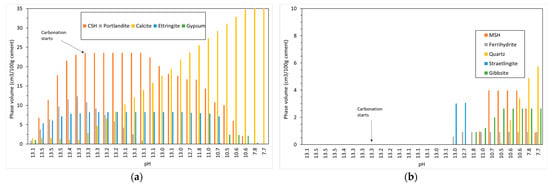
Figure 4.
Change in solid phase volume with pH with increasing CO2 ingress for (a) CSH, portlandite, calcite, ettringite and gypsum and (b) MSH, ferrihydrite, quartz, straetlingite and gibbsite.
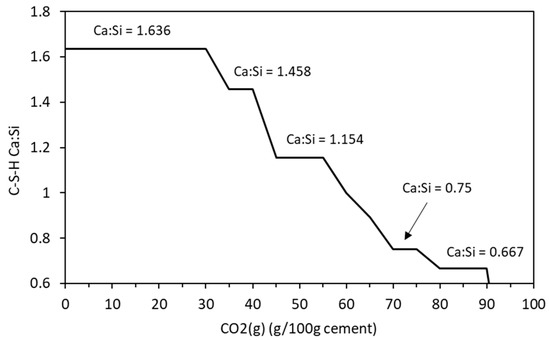
Figure 5.
Change in C-S-H Ca:Si ratio with increasing CO2 content.
Previous experimental data [31,32,33,34] from XRD over time during the carbonation of cement pastes have shown the existence of vaterite, which was included in the thermodynamic model using the phase derived above. It does not appear to equilibrate and form a solid phase in the assemblages shown below as calcite is more thermodynamically stable at ambient conditions. We recognize, however, that vaterite is the early, metastable calcium carbonate phase.
4.2. Sulfate Ingress
4.2.1. Sodium Sulfate
The phase assemblage in Figure 6 shows the expected increase in ettringite volume up to 100 g/L of sulfate where it decreases sharply at a pH of approximately 11 as C-S-H and portlandite are depleted. Like the work of Lothenbach et al. [27,37], thaumasite was predicted to form as monocarbonate was lost into solution. Previous work has shown that the formation of thaumasite is strongly dependent on temperature [13]. Work by the authors [38] where several concrete samples were immersed in a 25 g/L concentration of Na2SO4 solution (represented here) over six months, showed only a minor expansion over time. Additionally, the samples showed signs of gypsum formation on the surface following brushing with water, which re-precipitates at approximately 100 g/L < 11 pH. Schmidt et al. [27] postulated that the damage associated due to ettringite expansion preceded thaumasite formation and required some opening up of the microstructure. Figure 7 shows the change in hydrate volume with decreasing pH. The solid hydrate structure appears to remain stable until the pH falls below 11 where there is a rapid loss in volume. This, coupled with the lowering pH and breakdown of the passive layer surrounding embedded reinforcement, will lead to significant strength reduction and mass loss. As with the effect of carbonation, the derived CSHQ DSPs can account for the decalcifying effect of the sulfate ingress and the lowering of the Ca:Si ratio, as shown in Figure 8.
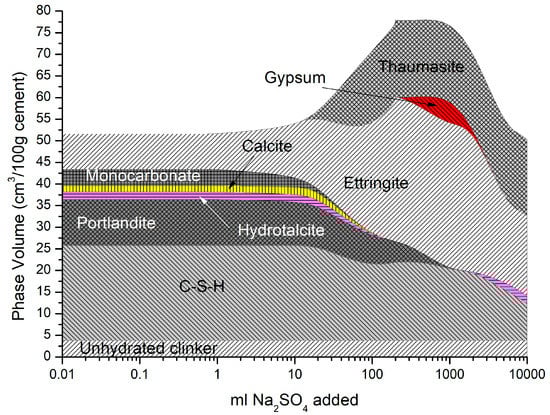
Figure 6.
Phase assemblage with increasing sodium sulfate concentration.
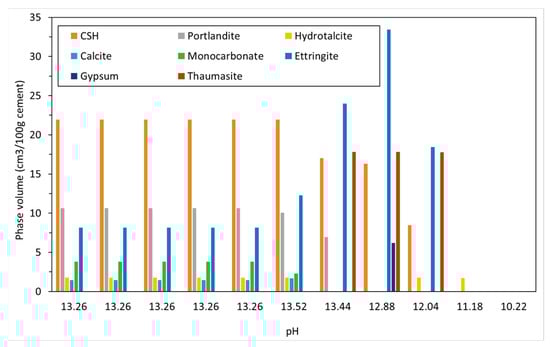
Figure 7.
Change in solid phase volume with pH with increasing sodium sulfate ingress.
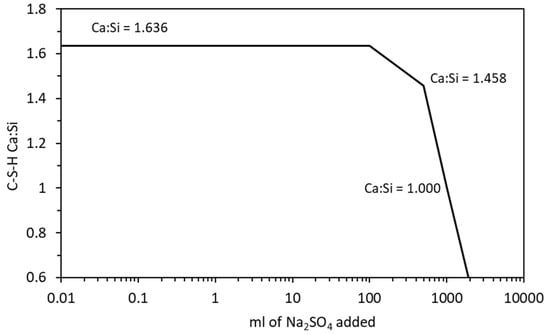
Figure 8.
Change in C-S-H Ca:Si ratio with increasing sodium sulfate exposure.
4.2.2. Magnesium Sulfate
It is generally accepted in the literature that magnesium sulfate is the most harmful of all the sulfates on cementitious materials [39,40,41], the formation of brucite, and the conversion of both C-S-H and portlandite to expansive gypsum and M-S-H [42]. As a result, the detrimental impact of magnesium sulfate in cement mortar and concrete by modifying the microstructure and chemical composition of the cement/concrete matrix has a more severe effect than from the Na2SO4 attack [43]. It has been postulated by [27,30] that the double-layer brucite and gypsum formation on the surface may protect the hardened cement matrix from magnesium sulfate attack. However, over time, this layer is removed, and deterioration accelerates with the sulfate diffusing easier into the material as C-S-H decomposition precipitates to M-S-H [39].
Figure 9 shows the cement used here was immersed in a 25 g/L concentration of MgSO4 solution. As described above, the precipitation of thaumasite, brucite, M-S-H, and gypsum over time as C-S-H and portlandite, is depleted. Additionally, hydrotalcite increases at later ages as it scavenges Al from other phases until the system runs out of Mg. Brucite precipitation here is not predicted in a sodium sulfate attack where the magnesium reacts with portlandite. XRD measurements of cement mortars from the literature [43,44,45,46,47,48,49,50,51,52] support the change in phase behaviour predicted in Figure 9. As shown, there is substantial expansion with the ingress of magnesium sulfate, much more (~30%) than sodium sulfate (Figure 7). The effect of ettringite and gypsum on expansion is an area of ongoing discussion by others working in this area [53,54,55,56,57,58].
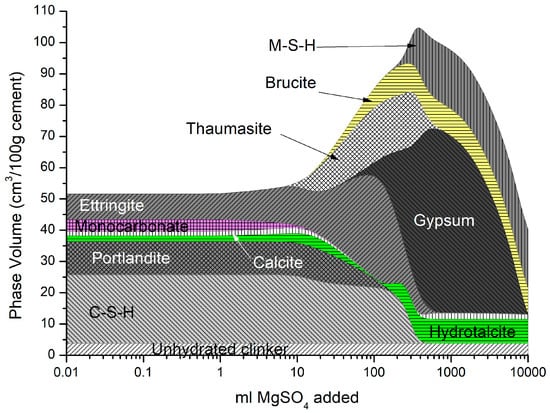
Figure 9.
Phase assemblage with increasing magnesium sulfate concentration.
The change in Ca:Si ratio in the C-S-H is shown in Figure 10 which shows similar behaviour to sodium sulfate. The Mg:Si ratio of the M-S-H was fixed at 1.50, which is precipitated by the M15SH end-member phase in Table 4. In this case, the DSP derived for the M-S-H is not required as the Mg:Si ratio remains constant and is not affected by the addition of siliceous SCM or by chemical degradation [21].
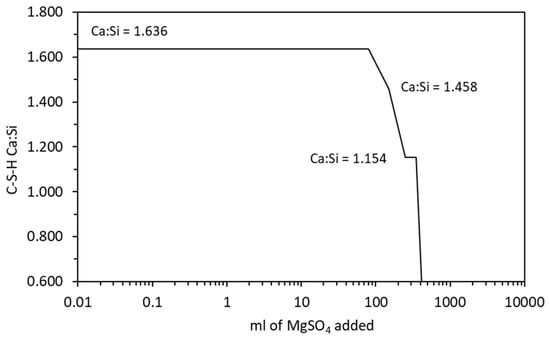
Figure 10.
Change in the C-S-H Ca:Si ratio with increasing magnesium sulfate exposure.
4.3. Sea Water Ingress
The predicted solid hydrates in Figure 11 include C-S-H, portlandite, ettringite, monocarbonate calcite, hydrotalcite, and siliceous hydrogarnet. As monocarbonate is depleted, Friedel’s salt is precipitated with an increase in ettringite, and the total volume as the amount of seawater added increases, while portlandite and C-S-H are removed. At higher seawater additions, ettringite is depleted along with portlandite and C-S-H, leading to a decrease in total volume, in which brucite re-precipitates and some M-S-H is formed.
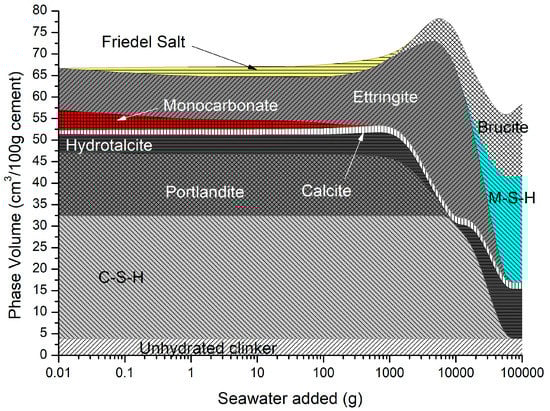
Figure 11.
Phase assemblage during seawater ingress.
The change in hydrate phase volume with decreasing pH is shown in Figure 12. The solid hydrates appear to remain stable, especially C-S-H until the pH falls below 12.5. There is a sharp increase in ettringite when the pH is between 12.64 and 12.50, but a sharp decrease below a pH of approximately 12. Below a pH of approximately 12.5, there is a rapid decrease in volume with only hydrotalcite, brucite, M-S-H, and some calcite remaining. As with the effect of carbonation, the ingress of seawater lowers the Ca:Si ratio of the C-S-H which is simulated by the CSHQ DSP gel phase model (see Figure 13).
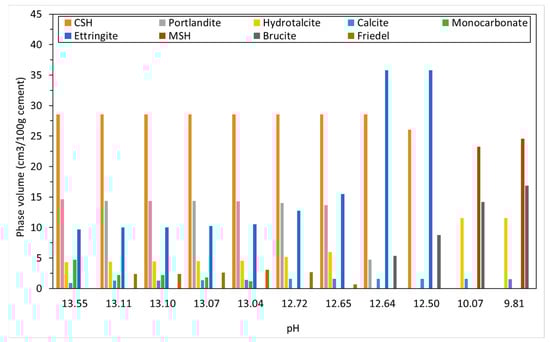
Figure 12.
Change in solid phase volume with pH with increasing seawater ingress.
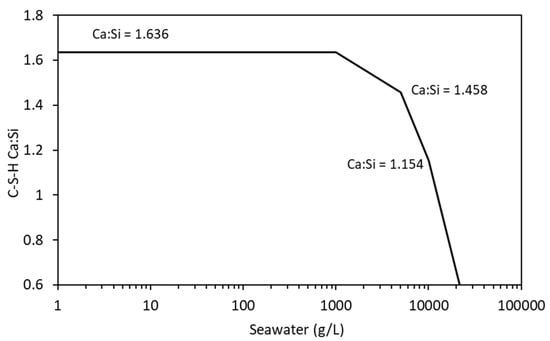
Figure 13.
Change in C-S-H Ca:Si ratio with increasing seawater exposure.
5. Discussion
Carbonation in concrete is caused by the diffusion of CO2 which reacts with portlandite and the calcium-bearing structural units in CSH to lower the pH by the creation of Ca(HCO3)2 in the pores. Below a pH of approximately 9, the microscopic passive layer surrounding the embedded steel is destabilised and is exposed to the oxygen and water in the pore structure leading to its rusting and expansion that causes the concrete to spall [59]. In the cement under analysis here, a pH of 9 exists when over 90 g of CO2 exists in the system (Figure 14), and all of the portlandite, hydrotalcite, monocarbonate, ettringite, and siliceous hydrogarnet is depleted with minor amounts of C-S-H, re-precipitated gypsum and M-S-H, Ferrihydrite, Quartz, and gibbsite remaining. The ingress of CO2 has also led to a significant increase in calcite. This provides a useful tool for concrete suppliers and those who maintain structures as a guide to when carbonation may be occurring so appropriate repair works be planned and carried out. Both the individual calcium-bearing hydrates and the calcium structural units of the CSH gel are susceptible to carbonation in the presence of carbon dioxide and water (or water vapour). The order in which these reactions occur can be predicted by thermodynamic modelling, or as demonstrated here, the maximum extent of carbonation may be predicted for a specific quantity of carbon reacting with the cement. Thermodynamics does not, of course, predict chemical kinetics, although kinetic constraints may be imposed on a reaction scheme that is known to be rapid. This has been applied in other works to model (for example) cement hydration.
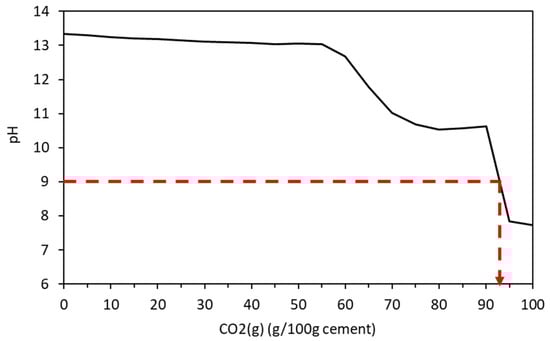
Figure 14.
Change in pH due to ongoing carbonation.
Carbonation of cement and concrete is often a self-limiting process, as the molar volume of the reaction products is greater than that of the reactants. The consequence of carbonation is to close the surface porosity and to limit further gas transfer to the interior of structural concrete, restricting further carbonation to a vanishingly slow rate. This metastable state may persist for many decades (often longer) in well-made structural concrete. Carbonation becomes a serious degradation mechanism when a transport route is established, which allows atmospheric gasses (CO2 and O2) to react with the cement and the steel reinforcement in structural concrete. The carbonation results in a local fall of pore solution pH to the point where corrosion may be initiated. The expansive corrosion products push the concrete apart, increasing the rate of gas transport and hence corrosion. The critical factor in carbonation-induced corrosion is the ease with which carbon dioxide can reach steel reinforcement. This may be along a crack, joint, or poorly compacted region of locally high porosity, or through a section where the depth of cover over the reinforcement was too low to provide adequate protection from carbonation.
Temperature influences the behaviour of mortars undergoing sulfate attack both in terms of the change in solid hydrate and the time at which expansion occurs. Delayed ettringite formation (DEF) occurs when concrete is cured at higher temperatures (>70 °C) during precast concrete production or steam curing, and re-equilibrates at lower temperatures. Lothenbach et al. [37] discussed how DEF can lead to greater ettringite expansion and gypsum re-formation at later stages as sulfates continue to react with hydrates [59]. In addition, monosulfate, now the dominant AFm phase replacing monocarbonate at the higher temperature, converts to ettringite adding to its increased volume. This is shown in Figure 15 where the cement here is modelled at a curing temperature of 80 °C. As may be seen, ettringite is not stable above approximately 35 °C where it dissolves and monosulfate re-precipitates [60]. The reaction is reversed on cooling and DEF may cause problems many years later.
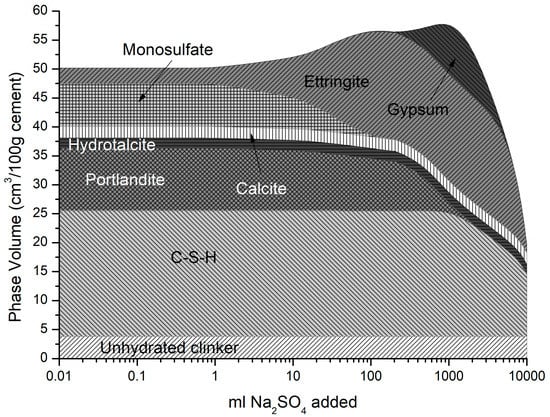
Figure 15.
Phase assemblage with increasing sulfate concentration at 80 °C.
The effect of seawater on the phase assemblage of a hydrating cement used a breakdown of the chemical elements from a sample of Atlantic Ocean water [36]. The Atlantic has the highest levels of aggressive chemicals in its waters on average than all the Earth’s oceans and seas. Table 10 shows the composition of seawater taken from the East coast of Scotland which lies along the North Sea. As may be seen, compared to the Atlantic (Table 9), the levels of aggressive ions are much lower. For instance, in terms of chlorides, which are responsible for most mild steel reinforcement corrosion [59], the Atlantic has almost twice the chloride content (15,704 ppm). Using the concentrations in Table 10, Figure 16 shows the change in phase assemblage with increasing North Sea water. There is little difference in behaviour between both except for slightly less Friedel salt and expansive ettringite in the reaction of the North Sea water. There is also additional M-S-H and brucite as well as less C-S-H and portlandite in the Atlantic Ocean analysis, which may be due to the slightly more acidic conditions at higher water contents, as shown in Figure 17. As with the above environments, this analysis will provide concrete designers and suppliers with valuable insights as to the likelihood of possible durability issues in saline environments and ensure that monitoring in extreme environments [61] can maintain performance-based standards (EN 206, [62]).
Table 10.
North Sea seawater analysis (taken from [36]).
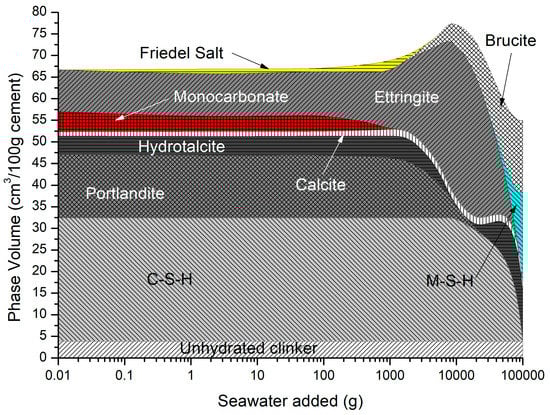
Figure 16.
Phase assemblage using North Sea water concentrations reacting with CEM I.
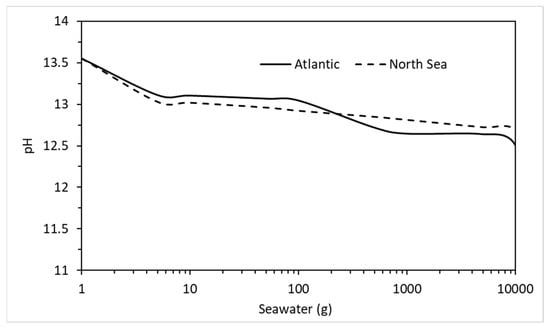
Figure 17.
Comparison between pore water pH after reaction between CEM I and the Atlantic Ocean and North Sea water.
6. Conclusions
Gaining an understanding of how cementitious-based materials behave in harsh environments is vital for continued performance in service. This work has shown how thermodynamic modelling of cements undergoing carbonation, sulfate attack, and exposure to seawater agrees with previous experimental and modelling work by pioneers in this area, which has been brought up to date using the most recent version of the cemdata database and the PHREEQC geochemical model. By using several Discrete Solid Phase (DSP) models to account for the solid solution nature of the C-S-H gel model used here (CSHQ), along with other thermodynamically derived phases, the modelling predictions show the depletion of the solid hydrates that contribute mostly to the volume (C-S-H, portlandite, and monocarbonate) and the initial increase then sudden decrease in ettringite as the concentration of aggressive agent increases over time. The ingress of CO2, Na2SO4, and seawater has been shown to decrease the volume of the main solid hydrates and the growth of minor phases is also presented. Furthermore, the influence of temperature on sulfate attack has also been presented that conforms to the later precipitation of ettringite along with the conversion of monocarbonate to monosulfate. It should be noted, however, that a simplified model of increasing the concentration of aggressive agents has been employed. A better understanding of the evolution of engineering components could be gained from coupling the chemistry simulated here, with reactive transport modelling. PHREEQC offers this facility, allowing users to simulate the spatial and temporal evolution of materials chemistry where geometrical and transport properties are known, and this will be the subject of a future study supported with experimental data.
Author Contributions
Conceptualization, N.H. and M.T.; methodology, N.H. and M.T.; software, N.H. and D.K.; validation, M.T.; formal analysis, N.H. and M.T.; investigation, N.H.; data curation, N.H.; writing—original draft preparation, N.H.; writing—review and editing, M.T. and D.K. All authors have read and agreed to the published version of the manuscript.
Funding
Funding to publish this work was from a US-Ireland grant tri-funded by the National Science Foundation (NSF, 1805818), Science Foundation Ireland (SFI, 17/US/3424), and the Department for the Economy of Northern Ireland (DfE, USI 127).
Institutional Review Board Statement
Not applicable.
Informed Consent Statement
Not applicable.
Data Availability Statement
Not applicable.
Acknowledgments
The authors would like to acknowledge the valuable advice provided by Colin Walker during the production of this paper.
Conflicts of Interest
The authors declare no conflict of interest.
References
- De Weerdt, K.; Plusquellec, G.; Revert, A.B.; Geiker, M.R.; Lothenbach, B. Effect of carbonation on the pore solution of mortar. Cem. Concr. Res. 2019, 118, 38–56. [Google Scholar] [CrossRef]
- Jeong, J.; Alemu, A.S.; Park, S.; Lee, H.K.; Liyew, G.; Ramézani, H.; Papadakis, V.G.; Kim, H.-K. Phase profiling of carbonated cement paste: Quantitative X-ray diffraction analysis and numerical modeling. Case Stud. Constr. Mater. 2022, 16, e00890. [Google Scholar] [CrossRef]
- Iwama, K.; Maekawa, K. Modeling of carbonation, de-carbonation and re-carbonation processes of structural concrete subjected to high temperature heating. Cem. Concr. Compos. 2022, 129, 104493. [Google Scholar] [CrossRef]
- Bertola, F.; Gastaldi, D.; Irico, S.; Paul, G.; Canonico, F. Influence of the amount of calcium sulfate on physical/mineralogical properties and carbonation resistance of CSA-based cements. Cem. Concr. Res. 2022, 151, 106634. [Google Scholar] [CrossRef]
- Liu, J.; Jing, Y.; Li, L. Modeling carbonation and chloride ingress in well cements. J. Pet. Sci. Eng. 2022, 212, 110308. [Google Scholar] [CrossRef]
- Hu, L.; Jia, Y.; Chen, Z.; Yao, Y.; Sun, J.; Xie, Q.; Yang, H. An insight of carbonation-hydration kinetics and microstructure characterization of cement paste under accelerated carbonation at early age. Cem. Concr. Compos. 2022, 134, 104763. [Google Scholar] [CrossRef]
- Shi, Z.; Lothenbach, B.; Geiker, M.R.; Kaufmann, J.; Leemann, A.; Ferreiro, S.; Skibsted, J. Experimental studies and thermodynamic modeling of the carbonation of Portland cement, metakaolin and limestone mortars. Cem. Concr. Res. 2016, 88, 60–72. [Google Scholar] [CrossRef]
- Qoku, E.; Bier, T.A.; Schmidt, G.; Skibsted, J. Impact of sulphate source on the hydration of ternary pastes of Portland cement, calcium aluminate cement and calcium sulphate. Cem. Concr. Compos. 2022, 131, 104502. [Google Scholar] [CrossRef]
- Zou, D.; Zhang, M.; Qin, S.; Liu, T.; Tong, W.; Zhou, A.; Jivkov, A. Calcium leaching from cement hydrates exposed to sodium sulfate solutions. Constr. Build. Mater. 2022, 351, 128975. [Google Scholar] [CrossRef]
- Lv, X.; Yang, L.; Wang, F.; Hu, S.; Li, J. Hydration, microstructure characteristics, and mechanical properties of high-ferrite Portland cement in the presence of fly ash and phosphorus slag. Cem. Concr. Compos. 2023, 136, 104862. [Google Scholar] [CrossRef]
- Xu, B.; Winnefeld, F.; Ma, B.; Rentsch, D.; Lothenbach, B. Influence of aluminum sulfate on properties and hydration of magnesium potassium phosphate cements. Cem. Concr. Res. 2022, 156, 106788. [Google Scholar] [CrossRef]
- Georget, F.; Lothenbach, B.; Wilson, W.; Zunino, F.; Scrivener, K.L. Stability of hemicarbonate under cement paste-like conditions. Cem. Concr. Res. 2022, 153, 106692. [Google Scholar] [CrossRef]
- Gollop, R.S.; Taylor, H.F.W. Microstructural and microanalytical studies of sulfate attack. I. Ordinary portland cement paste. Cem. Concr. Res. 1992, 22, 1027–1038. [Google Scholar] [CrossRef]
- Santhanam, M.; Cohen, M.D.; Olek, J. Effects of gypsum formation on the performance of cement mortars during external sulfate attack. Cem. Concr. Res. 2003, 33, 325–332. [Google Scholar] [CrossRef]
- De Weerdt, K.; Lothenbach, B.; Geiker, M.R. Comparing chloride ingress from seawater and NaCl solution in Portland cement mortar. Cem. Concr. Res. 2019, 115, 80–89. [Google Scholar] [CrossRef]
- Qu, F.; Li, W.; Guo, Y.; Zhang, S.; Zhou, J.L.; Wang, K. Chloride-binding capacity of cement-GGBFS-nanosilica composites under seawater chloride-rich environment. Constr. Build. Mater. 2022, 342, 127890. [Google Scholar] [CrossRef]
- Lin, C.; Wang, S.; Ma, W.; Yan, Y.; Lu, Y. Effects of sodium aluminate on the performance of seawater sea-sand engineered cementitious composites. Constr. Build. Mater. 2022, 345, 128422. [Google Scholar] [CrossRef]
- Xu, B.; Lothenbach, B.; Li, Z. Properties and hydrates of seawater-mixed magnesium potassium phosphate cements with high magnesium-to-phosphate ratio. Cem. Concr. Compos. 2022, 134, 104807. [Google Scholar] [CrossRef]
- Yang, Z.; Zhu, H.; Zhang, B.; Dong, Z.; Wu, P. Short-term creep behaviors of seawater sea-sand coral aggregate concrete: An experimental study with Rheological model and neural network. Constr. Build. Mater. 2023, 363, 129786. [Google Scholar] [CrossRef]
- Holmes, N.; Tyrer, M.; West, R.P.; Lowe, A.; Kelliher, D. Using PHREEQC to model cement hydration. Constr. Build. Mater. 2022, 319, 126–129. [Google Scholar] [CrossRef]
- Holmes, N.; Walker, C.; Tyrer, M.; Kelliher, D. Deriving discrete solid phases from CSH-3T and CSHQ end-members to model cement hydration in PHREEQC. In Proceedings of the Civil Engineering Research in Ireland (CERI) Conference, Dublin, Ireland, 25–26 August 2022; pp. 28–33. [Google Scholar]
- Parkhurst, D.J.; Appelo, C.A.J. Description of Input and Examples for PHREEQC Version 3–A Computer Program for Speciation, Batch-reaction, One-Dimensional Transport and Inverse Geochemical Calculations; U.S. Geological Survey: Denver, CO, USA, 2013.
- Kulik, D.A.; Wagner, T.; Dmytrieva, S.V.; Kosakowski, G.; Hingerl, F.F.; Chudnenko, K.V.; Berner, U.R. GEM-Selektor geochemical modeling package: Revised algorithm and GEMS3K numerical kernel for coupled simulation codes. Comput. Geosci. 2013, 17, 24. [Google Scholar] [CrossRef]
- Thoenen, T.; Hummel, W.; Berner, U.; Curti, E. The PSI/Nagra Chemical Thermodynamic Database 12/07; Villigen PSI: Würenlingen, Switzerland, 2014. [Google Scholar]
- Lothenbach, B.; Kulik, D.A.; Matschei, T.; Balonis, M.; Baquerizo, L.; Dilnesa, B.; Miron, G.D.; Myers, R.J. Cemdata18: A chemical thermodynamic database for hydrated Portland cements and alkali-activated materials. Cem. Concr. Res. 2019, 115, 472–506. [Google Scholar] [CrossRef]
- European Committee for Standardization (CEN). BS EN 197-1 Cement: Composition, Specification and Conformity Criteria for Common Cements; European Committee for Standardization (CEN): Brussels, Belgium, 2011; Volume 2000. [Google Scholar]
- Schmidt, T.; Lothenbach, B.; Romer, M.; Neuenschwander, J.; Scrivener, K. Physical and microstructural aspects of sulfate attack on ordinary and limestone blended Portland cements. Cem. Concr. Res. 2009, 39, 1111–1121. [Google Scholar] [CrossRef]
- Walker, C.; Sutou, S.; Oda, C.; Mihara, M.; Honda, A. Calcium silicate hydrate (C-S-H) gel solubility data and a discrete solid phase model at 25 °C based on two binary non-ideal solid solutions. Cem. Concr. Res. 2016, 79, 1–30. [Google Scholar] [CrossRef]
- Holmes, N.; Tyrer, M. Employing Discrete Solid Phases to represent C-S-H solid solutions in the cemdata07 thermodynamic database to model cement hydration using PHREEQC. J. Adv. Concr. Technol. Rev. 2022, 12, 10039. [Google Scholar] [CrossRef]
- CEN. EN 196-6 Methods of Testing Cement—Part 6: Determination of Fineness; European Committee for Standardization (CEN): Brussels, Belgium, 2018. [Google Scholar]
- Borges, P.H.R.; Costa, J.O.; Milestone, N.B.; Lynsdale, C.J.; Streatfield, R.E. Carbonation of CH and C–S–H in composite cement pastes containing high amounts of BFS. Cem. Concr. Res. 2010, 40, 284–292. [Google Scholar] [CrossRef]
- Slegers, P.A.; Rouxhet, P.G. Carbonation of the hydration products of tricalcium silicate. Cem. Concr. Res. 1976, 6, 381–388. [Google Scholar] [CrossRef]
- Šavija, B.; Luković, M. Carbonation of cement paste: Understanding, challenges, and opportunities. Constr. Build. Mater. 2016, 117, 285–301. [Google Scholar] [CrossRef]
- Groves, G.W.; Rodway, D.I.; Richardson, I.G. The carbonation of hardened cement pastes. Adv. Cem. Res. 1990, 3, 117–125. [Google Scholar] [CrossRef]
- Hong, S.Y.; Glasser, F.P. Alkali binding in cement pastes: Part I. The C-S-H phase. Cem. Concr. Res. 1999, 29, 1893–1903. [Google Scholar] [CrossRef]
- Holmes, N.; Basheer, L.; Nanukuttan, S.; Srinivasan, S.; Basheer, P.A.M. Development of a new marine exposure site on the Atlantic North-West coast of Ireland. In Proceedings of the Bridge and Concrete Research in Ireland (BCRI), Cork, Ireland, 2–3 September 2010; pp. 627–636. [Google Scholar]
- Lothenbach, B.; Bary, B.; Le Bescop, P.; Schmidt, T.; Leterrier, N. Sulfate ingress in Portland cement. Cem. Concr. Res. 2010, 40, 1211–1225. [Google Scholar] [CrossRef]
- Thompson, D.; Holmes, N.; Reddy, J. Evaluating a new CEM III/A cement for concretes exposed to harsh acid rich environments. In Proceedings of the Civil Engineering Research in Ireland (CERI) Conference, Galway, Ireland, 29–30 August 2016; pp. 371–375. [Google Scholar]
- Cohen, M.D.; Mather, B. Sulfate attack on concrete: Research needs. Mater. J. 1991, 88, 62–69. [Google Scholar]
- Bonen, D.; Cohen, M.D. Magnesium sulfate attack on portland cement paste-I. Microstructural analysis. Cem. Concr. Res. 1992, 22, 169–180. [Google Scholar] [CrossRef]
- Bonen, D. A microstructural study of the effect produced by magnesium sulfate on plain and silica fume-bearing Portland cement mortars. Cem. Concr. Res. 1993, 23, 541–553. [Google Scholar] [CrossRef]
- Zelić, J.; Rušić, D.; Krstulović, R. A mathematical model for prediction of compressive strength in cement–silica fume blends. Cem. Concr. Res. 2004, 34, 2319–2328. [Google Scholar] [CrossRef]
- Liu, Z.; Deng, D.; De Schutter, G.; Yu, Z. The effect of MgSO4 on thaumasite formation. Cem. Concr. Compos. 2013, 35, 102–108. [Google Scholar] [CrossRef]
- Türker, F.; Aköz, F.; Koral, S.; Yüzer, N. Effects of magnesium sulfate concentration on the sulfate resistance of mortars with and without silica fume. Cem. Concr. Res. 1997, 27, 205–214. [Google Scholar] [CrossRef]
- Yang, Z.; Jiang, J.; Jiang, X.; Mu, S.; Wu, M.; Sui, S.; Wang, L.; Wang, F. The influence of sodium sulfate and magnesium sulfate on the stability of bound chlorides in cement paste. Constr. Build. Mater. 2019, 228, 116775. [Google Scholar] [CrossRef]
- Lee, S.T.; Moon, H.Y.; Hooton, R.D.; Kim, J.P. Effect of solution concentrations and replacement levels of metakaolin on the resistance of mortars exposed to magnesium sulfate solutions. Cem. Concr. Res. 2005, 35, 1314–1323. [Google Scholar] [CrossRef]
- Vuk, T.; Gabrovšek, R.; Kaučič, V. The influence of mineral admixtures on sulfate resistance of limestone cement pastes aged in cold MgSO4 solution. Cem. Concr. Res. 2002, 32, 943–948. [Google Scholar] [CrossRef]
- Li, X.; Qiu, R.; Xue, F.; Fang, L.; Cheng, F. Effects of unreactive MgO and impurities in light burned MgO on the hydration process and performance of base magnesium sulfate cement. Constr. Build. Mater. 2020, 240, 117854. [Google Scholar] [CrossRef]
- Pinto, S.R.; da Luz, C.A.; Munhoz, G.S.; Medeiros-Junior, R.A. Durability of phosphogypsum-based supersulfated cement mortar against external attack by sodium and magnesium sulfate. Cem. Concr. Res. 2020, 136, 106172. [Google Scholar] [CrossRef]
- Torres, S.M.; Sharp, J.H.; Swamy, R.N.; Lynsdale, C.J.; Huntley, S.A. Long term durability of Portland-limestone cement mortars exposed to magnesium sulfate attack. Cem. Concr. Compos. 2003, 25, 947–954. [Google Scholar] [CrossRef]
- Tang, S.; Yuan, J.; Cai, R.; Wei, C.; Chen, J.; Chen, E. In situ monitoring of hydration of magnesium oxysulfate cement paste: Effect of MgO/MgSO4 ratio. Constr. Build. Mater. 2020, 251, 119003. [Google Scholar] [CrossRef]
- Hartshorn, S.A.; Sharp, J.H.; Swamy, R.N. The thaumasite form of sulfate attack in Portland-limestone cement mortars stored in magnesium sulfate solution. Cem. Concr. Compos. 2002, 24, 351–359. [Google Scholar] [CrossRef]
- Tian, B.; Cohen, M.D. Expansion of alite paste caused by gypsum formation during sulfate attack. J. Mater. Civ. Eng. 2000, 12, 24–25. [Google Scholar] [CrossRef]
- Hansen, W.C. Attack on portland cement concrete by alkali soils and waters-A critical review. Highw. Res. Rec. 1966, 113, 1–32. [Google Scholar]
- Mather, B. Discussion of ‘The Process of Sulfate Attack on Cement Mortars’ by Shen Yang, Xu Zhongzi, and Tang Mingshu. Adv. Cem. Based Mater. 1997, 5, 109–110. [Google Scholar] [CrossRef]
- Al-Amoudi, O.S.B.; Maslehuddin, M.; Saadi, M.M. Effect of magnesium sulfate and sodium sulfate on the durability performance of plain and blended cements. ACI Mater. J. 1995, 92, 15–24. [Google Scholar]
- Bonen, D.; Sarkar, S.L. Replacement of portlandite by gypsum in the interfacial zone and cracking related to crystallisation pressure. Ceram. Trans. 1993, 37, 49–59. [Google Scholar]
- Yang, S.; Zhongzi, X.; Mingshu, T. The process of sulfate attack on cement mortars. Adv. Cem. Based Mater. 1996, 4, 1–5. [Google Scholar] [CrossRef]
- Neville, A. Properties of Concrete; Longman London: London, UK, 1995; Volume 4. [Google Scholar]
- Taylor, H.F.W. Cement Chemistry; Thomas Telford Publishing: London, UK, 1997. [Google Scholar]
- McCarter, W.; Chrisp, T.; Starrs, G.; Holmes, N.; Basheer, L.; Basheer, M.; Nanukuttan, S.V. Developments in monitoring techniques for durability assessment of cover-zone concrete. Comput. Aided Des. 2010, 17, 294–303. [Google Scholar]
- EN 206, B.S.; Concrete-Specification, Performance, Production and Conformity. British Standards Institution, Her Majesty Stationery Office: London, UK, 2013.


Disclaimer/Publisher’s Note: The statements, opinions and data contained in all publications are solely those of the individual author(s) and contributor(s) and not of MDPI and/or the editor(s). MDPI and/or the editor(s) disclaim responsibility for any injury to people or property resulting from any ideas, methods, instructions or products referred to in the content. |
© 2022 by the authors. Licensee MDPI, Basel, Switzerland. This article is an open access article distributed under the terms and conditions of the Creative Commons Attribution (CC BY) license (https://creativecommons.org/licenses/by/4.0/).