1. Introduction
The longest phase of a building lifecycle is the operation phase, which is a process involving a set of technical, economic, and social activities that should be properly organized. From the incurred costs point of view, in the operation process of a building, activities related to the building use as well as maintenance can be distinguished.
The use of a building is understood as its use relating to the operation of the facility (especially rational use that brings the greatest benefit) [
1]. The main purpose of maintaining a building is to preserve it, if feasible, in its original condition to effectively fulfill its purpose.
The duties related to the proper use and maintenance of the building, and at the same time its proper management, in Poland are assigned by the Polish Building Law [
2] to the owner or manager of the building. One of the basic obligations entrusted by the Polish Building Law to the owner or manager of a building is to conduct construction inspections, the effect of which is, among others, indication of building elements that require action, such as maintenance, repair, or replacement, generally referred to as renovations. Each of these activities is associated with the corresponding costs.
In the case of public utility buildings in Poland, such as buildings owned by public universities, the basic source of renovation financing are funds designated by the state budget, mainly in the form of subsidies granted to universities according to appropriate algorithms. For a university to receive funds for the maintenance of buildings under the ministerial subsidy, in accordance with the Law on Higher Education and Science [
3], it must prepare a financial plan. This plan, in
Section 4, Item 13 of the Law, includes the expected costs of buildings’ renovation. To calculate the expected costs of refurbishing university buildings, refurbishment plans are developed.
The aim of this article was to create a model, based on regression analysis, that will calculate the predicted annual renovation costs in educational buildings. The second goal was to show the importance of the topic. To analyze the annual renovation costs, a database of renovation costs of several educational buildings has been prepared. Although the literature on the subject offers models for estimating the costs of building renovation, they usually do not include a strategy for maintaining the building throughout its lifecycle. A novelty in the proposed model is the consideration of the entire lifecycle perspective. Relying on the data from other similar renovations increases the credibility of the obtained results.
The next section covers the literature review, carried out to introduce the justification for the topic selection. In
Section 3, the planned costs during the lifecycle are analyzed. Two phases of creating the final database are shown. Then, the regression analysis has been performed and the model created, and the results and discussion are presented in
Section 4. In the last section of the article, the authors’ conclusions have been presented.
2. Literature Review
To provide high-quality school facilities for healthy and supportive teaching and learning environments, building maintenance strategies must be properly chosen. According to [
4], a poor quality of facilities’ maintenance management practices exists in large public educational buildings. The authors prepared a survey questionnaire, which was sent to 320 school facilities’ managers from 4 major metropolitan areas in Texas. According to the results of the study, only 64% of the schools have a well-conceived maintenance plan that guides facility improvement, 90% of the schools have a long-term plan, and 72% of the schools periodically update that plan. The functions of facilities according to facility management activities in the educational environment are presented in [
5]. Research shows that facility management added value is the customers’ perceived trade-off between the effects of the use of facility services on the outcome of their processes, the costs, and the risks. On this basis, a typology of facility services was constructed around their level of fixity and their influence on the learning outcome.
An optimization analysis of the maintenance and operational costs based on the example of a public building has been shown in [
6]. The developed optimization model minimizes building operational costs by integrating various sustainability measures, including energy-efficient measures, such as LED and fluorescent lighting, HVAC systems, ground-source heat pumps, hand dryers, vending machines, refrigerators, and water heaters, renewable energy systems such as solar panels, and water-saving plumbing fixtures such as efficient faucets, urinals, and toilets.
Within the European building stock, 90% were constructed before 1990 [
7]. Developing a cost-effective multi-year maintenance program is a difficult task for facility managers because it must assess not only maintenance requirements and maintenance costs [
8] but also costs based on prior experience and historical data [
9,
10,
11]. There also exist more model types to calculate the maintenance costs of a public building [
12]. Moreover, the facility management affects not only the operation, maintenance, and monitoring of buildings, but it also affects the occupants. Buildings of educational purpose significantly affect students and researchers [
13,
14]. Another argument to properly prepare the maintenance plans is that according to [
15], the degradation of the building incurred by aging leads not only to excessive repair costs, but it also affects its usability. The aesthetic and historic value is also not insignificant [
16]. Due to all these facts, properly chosen maintenance strategies are vital to keep these buildings in a good condition and optimize the maintenance costs as well as extend the lifecycle of the buildings. The very first effort for managing a building should entail careful estimation of the maintenance cost of its components, because it is possible to establish proactive measures for maintenance by allocating the predicted cost to the budget for the building’s maintenance [
17].
The ISO standard 15686-5:2017 “Buildings and constructed assets—Service life planning Part 5: lifecycle costs” [
18], and the European standard EN 13306:2017 “Maintenance—Maintenance terminology” [
19], characterize the two most common maintenance types, preventive and corrective maintenance. Other maintenance types can be found proposed by different authors in the literature. These include, e.g., planned and unplanned maintenance [
20], or predictive and emergency maintenance [
21]. The maintenance division into levels concerning the period when certain repairs need to be performed is listed in [
22].
Many studies indicate that the wrong approach to the maintenance of buildings results in incurring additional, unnecessary costs [
23,
24,
25,
26]. In [
27,
28,
29], the use of lean mentality in building maintenance has been proposed. Lean management is a management philosophy that has a main objective of the elimination or reduction of procedures that do not create value for the customer. The proposed model, called LBM (Lean Building Maintenance), is intended as a support model to implement a lean culture in building maintenance management, giving managers an organized and scalable set of tools and concepts that attract the attention of the organization to the advantages of implementing lean management. A case study illustrated the applicability of the proposed model as well as the associated advantages. The article [
30] shows a checklist for the evaluation of lean maintenance principles in buildings.
In [
31], an association rule technique approach based on a survey questionnaire to analyze the causes or determinants of hospital building maintenance was proposed. This approach provides rules for the maintenance organization to reduce maintenance backlog and costs and increase user satisfaction and productivity.
Scientists have created many models that enable building renovation optimization, including not only technology choices, sustainable solutions, or occupants’ comfort, but also costs. Models are developed to study the interaction between conflicting objectives to assess their trade-offs. In [
32], a condition-based maintenance model, using Petri nets, was developed. In [
33,
34], lifecycle costs of buildings have been related to the risk consideration. Moreover, many authors use multicriteria decision making (MCDM) [
35] or multi-objective optimization [
36]. More and more researchers are taking advantage of various types of artificial neural networks (ANN) to develop building maintenance models. Moreover, article [
37] shows that 61% of authors (up to 2020) also adopted hybrid models in which ANN is integrated with other methods. In [
15], to predict the cost of living, case-based reasoning and a genetic algorithm were used.
Building Information Modeling (BIM) is becoming more popular nowadays, and in [
38], BIM has been used to improve and simplify the performance of quantity trade-offs for estimating building maintenance costs. The use of augmented reality or virtual reality technology in the building maintenance field is a novel method, and it has been outlined in [
39,
40].
3. Materials and Methods
3.1. Planned Costs during the Lifecycle
To find the correlation between different variables and the renovation costs, two phases of analysis were distinguished. The two-phase model was developed because the first phase was more general, however it showed that the topic is useful and can be extended in the second phase. The aim of the first phase was to find the correlations with different variables and the renovation costs on a selected, small package of data. The correlations between the dependent variable and independent variables have been found. This was carried out using the initial database. The second phase was more detailed, the final database was wider, and the variables’ correlations based on the findings achieved in the first phase were used. The second-phase database also connects data received from two different organizations, and it was an additional challenge to find data covering information gathered from both organizations. The multiple linear regression model has been used to build the regression model.
The research analysis scheme and brief information regarding the first and second phases is shown in
Figure 1.
All obtained renovation costs have been recalculated from Polish Złoty (PLN) into Euros (EUR, €) according to the average exchange rate taken from the polish central bank (NBP) as of 15 September 2022. The exchange rate was equal to 1 EUR = 47,164 PLN.
3.2. Research Analysis—Phase 1
In the first phase, 17 buildings (B1–B17) erected in the years 1830–2017 and owned by a university in Cracow (Poland) were compared using linear regression. The data were collected from the renovation plans for the years 2017–2020, and the correlation analysis was performed, matching three chosen attributes: building age, number of stories in the building, and the usable area of each building, with the renovation costs. These attributes were chosen by the authors because they applied to all 17 buildings. The results are presented in
Table 1. The strongest relationship existed between the variables renovation cost and number of stories, where the
r coefficient indicated a very strong correlation (
r equals 0.81),
R2 indicated a satisfactory determination, and the
p-value indicated a significant relationship, where the value was the lowest from the whole database at 0.001. Slightly weaker relations were obtained for the renovation cost and the usable area, where
r was 0.72 and the
p-value was 0.008. The correlation for the renovation cost and the age of the building was not satisfactory as the
p-value was 0.909, greater than 0.05, which means that this correlation was not statistically significant; therefore, in further analysis, the correlation between the building age and renovation cost was abandoned.
Figure 2 shows the percentage share of renovation costs in each year of the first phase of analysis. The renovations performed in the building’s interiors had higher percentage shares every year. The second most popular renovation type was installations. The least popular renovation type was renovations performed on the exterior of the buildings, whereby no renovations were performed in the years 2017–2020 (0%). The second least popular type were renovations of the whole buildings, with this type only being performed in the year 2017, accounting for 1% of the renovations performed in this year.
Moreover, the first phase of analysis clearly shows the imperfections of renovation plans created by the university management. The renovations performed and the costs incurred add up to approximately 50% of the planned renovations. This is related to the numerous renovations that have not been carried out and not to the potentially overpriced bills of the planned renovations. Based on the information provided by the university worker who created the renovation plans, the incomplete works will be completed but since the renovation plans are verified at the beginning of each year and compared with the received funding, unfortunately, the funding received by the universities is not sufficient to cover the costs of all the renovation needs. Due to this fact, in further analysis (second phase) the correlation between planned costs with different variables instead of incurred costs has been examined. It has a logical basis because the model will yield an answer of how high the costs are to properly renovate the building instead of the real cost that is incurred regarding each building, which does not cover all its renovation needs. The dependencies between incurred and planned costs are presented in
Figure 3, while
Table 2 shows the percentage of the planned funds that were actually incurred.
The average of the sum of incurred costs in the years 2017–2020 in coordination with planed renovation costs was 43%, and the median was 47%. At the same time, the average of the correlation between incurred and planned costs was 48%, while the median was exactly 50%.
3.3. Research Analysis—Phase 2
In the second phase, the database from the first phase was broadened, wherein 55 buildings located in Cracow (Poland) and Lodz (Poland) have been analyzed and the costs of renovations were compared. The buildings were erected in the years 1830–2014. To standardize the planned maintenance costs, the period from the last modernization (in years) has been taken into consideration instead of the age of the building. Moreover, based on the results from the first phase, the correlation of the age of the building with the renovation cost was satisfying.
Based on the obtained renovation and investment plans, data for the years 2017–2021 were compiled on the expected costs of planned renovation and modernization works. The data were divided into renovations, aimed at maintaining the buildings in a proper technical condition, and investment renovations, which included, i.e., changing the purpose of the building or part of it, comprehensive modernization of objects, or their reconstruction. Only renovations were considered for the summary, which illustrates the costs of maintaining buildings at an appropriate usability and technical level. The works related to the investments were not considered when compiling the building maintenance cost database.
To predict future cost expenditure, a cumulative year-on-year bivariate linear regression was calculated. The general principle of regression is to quantify the relationship between multiple independent variables and the dependent variable. The regression method makes it possible to explore the relationship between different data and to predict unknown values of one quantity based on known values of other quantities [
41].
Regression analysis produces a regression equation, where the relationship between each independent variable and the dependent variable is represented by the coefficients [
42]. The simplest regression model is the model of linear regression; in this research, the multiple linear regression model has been implemented. In multiple linear regression, the dependent variable is a linear function of the independent variables and the random component. Linear regression is commonly used among other machine learning methods in mathematical research methods, where it is possible to measure the predicted effects and the possibility occurs to model them against multiple input variables [
43]. Linear regression serves information systems researchers and practitioners in different ways: experimentally verifying a priori models and theories, constructing data-based models and theories, and enabling data-based and model-based decision making [
44].
The multiple linear regression general equation, which was used by the authors, is as follows:
where
y is the dependent variable,
is a random component,
X1,
X2 are the independent and predictor variables, and
are the regression coefficients.
The coefficient of determination (
R2) needs to be calculated to assess the ability of the model to predict the outcome in the linear regression model. The coefficient indicates the proportion between the dependent variable (
y) and the independent variables for the given set of
n data points, for
i = 1, 2, 3, …,
n. Generally, the higher the
R2 variable is, the better. The coefficient of determination has been calculated according to the formula:
where
R2 is the coefficient of determination,
is the value of the variable
y,
is the fitted value for observation
i,
is the arithmetic average of the y values from the sample, and
n is the number of observations.
To predict future cost expenditure, a cumulative year-on-year bivariate linear regression was calculated, and the Statistica [
45] software has been used. Firstly, four variables have been chosen (year of construction, last renovation, usable area, and planned renovation costs), the correlation has been checked, and the regression analysis has been carried out. After the regression analysis, the statistical significance of the year of construction attribute was much bigger than 5%, and that is why it has been erased from the database. Other attributes have been used in further calculations.
Table 3 shows the statistical calculations for the dependent and the independent variables taken from the database containing 55 buildings for the years 2017–2021. The average renovation cost per 1 m
2 according to this database was 53.52 EUR, and the median was 33.50 EUR. The average usable area was 3864.45 m
2 and the median was 2468.81 m
2. The last modernization period was in the range 1966–2020, while the average was 2008 and the median was 2012.
The chart shown in
Figure 4 shows the renovation costs per 1 m
2 for the analyzed database in the analyzed period (years 2017–2021). The renovation cost range varied between 0.77 and 277.63 EUR/m
2.
4. Results and Discussion
Finally, the prepared database consists of two independent variables (last modernization—X1, usable area—X2) which are statistically significant. The dependent variable in this database is the attribute related to planned renovation costs, Y.
The coefficient of determination (R2) was calculated for the database and its value was: R2 = 0.844.
The random component and the regression coefficient values were calculated and were, respectively: = 27,608,375.9, = −13,681.63, and 118.024891.
The trend line equation, which allows to predict the future cost expenditures in the accurate short term, was determined as follows:
Table 4 shows the results of Statistica software calculations. The coefficient of determination value shows that the data points were properly selected. The accurate planned costs for educational buildings can be predicted in the following years knowing the usable area (m
2) and the period since the last major renovation until today, in years. The regression coefficients b* and b are given in the table below, moreover the statistical linearity of the regression function was smaller than 5%, which shows that the function model was statistically relevant.
The comparison of predicted values and planned renovation costs is shown by the graph in
Figure 5.
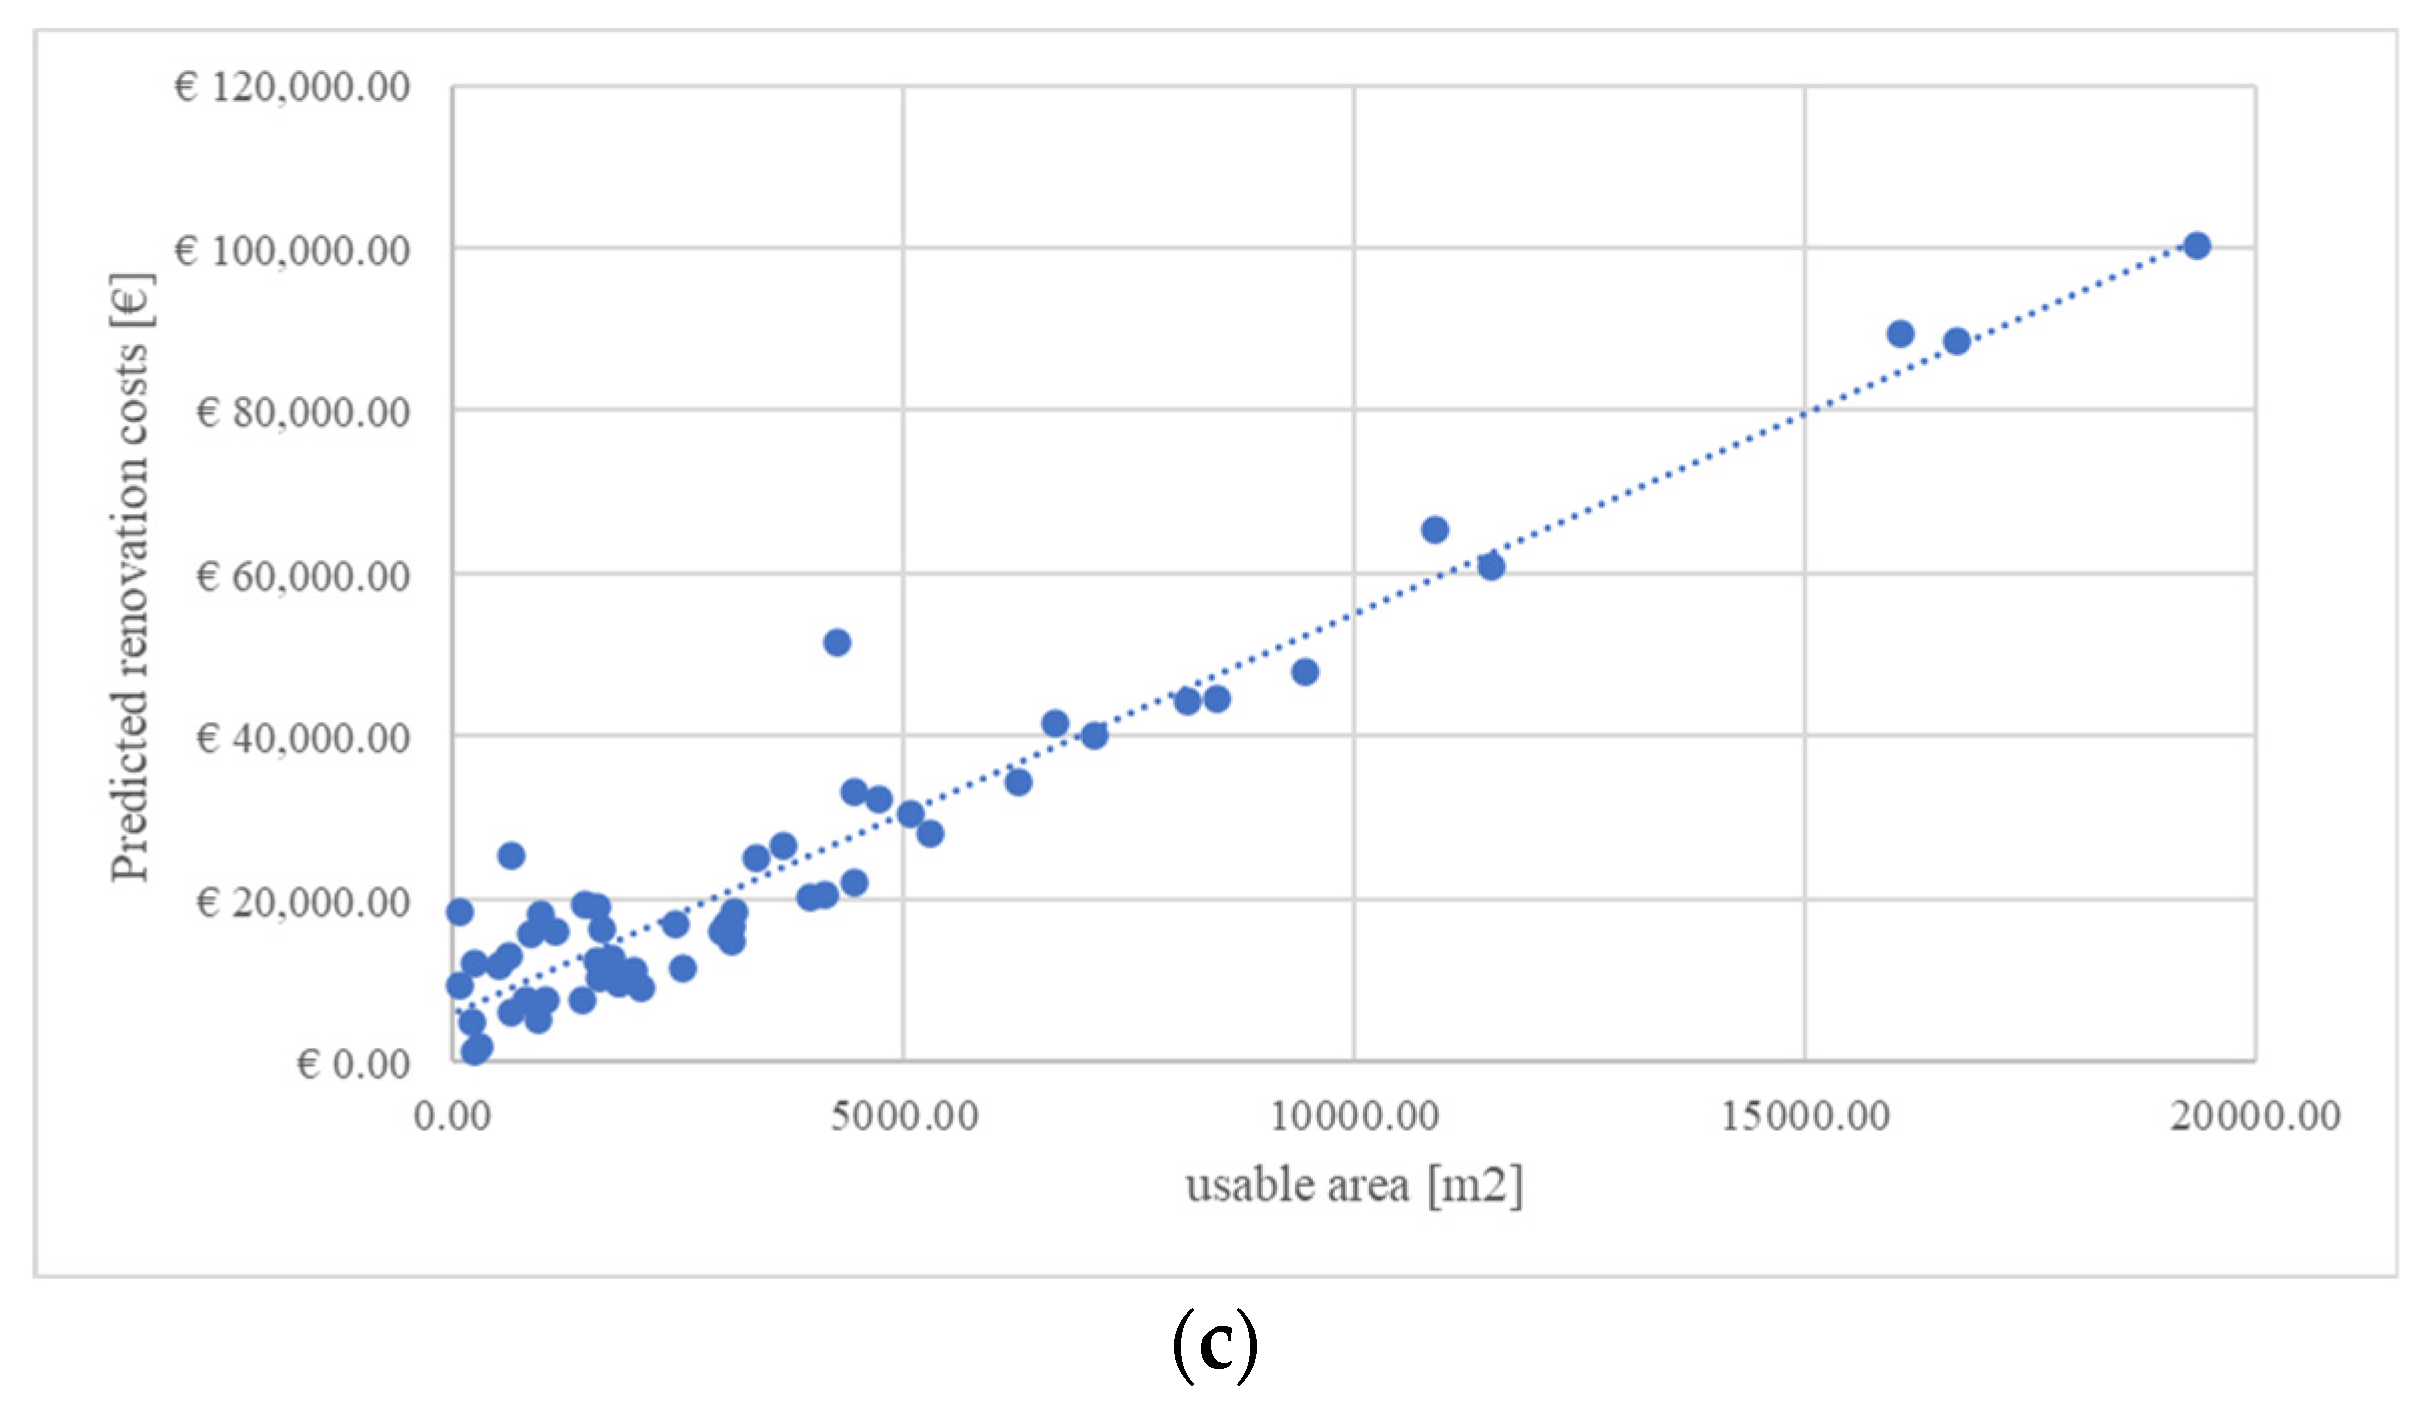
Figure 6 shows the results from the multiple regression analysis performed for the 55 analyzed buildings. The graph (
Figure 6a) shows the predicted renovation costs in relation to the independent variable
X1—the last modernization period, in years. The next graph (
Figure 6b) shows the predicted renovation costs in relation to the independent variable
X2—usable area, in m
2. The trend line of predicted renovation costs’ growth from the graph in
Figure 6a is not as significantly related to the last modernization period (in years) as the trend line presented on the graph in
Figure 6b, where the predicted renovation costs’ growth was greater in relation to the usable area growth. The predicted renovation costs, which were calculated according to chosen independent variables, are presented in the last graph (
Figure 6c). The linearity of this graph proves the correctness of the multiple regression model calculations.
Figure 7 shows the correlation between the planned renovation costs and the predicted renovation costs obtained from the regression analysis together with the residual values obtained during the analysis. The residual value is the difference between planned renovation costs and the predicted renovation costs.
The analysis based on the database gives the opportunity to predict planned renovation costs for similar buildings, in this case other buildings managed by the educational sector. The Statistica software calculated the predicted renovation costs based on the regression model created for the 55 buildings. It is possible to predict the annual renovation costs by entering the information regarding the usable area and the period since the last modernization of a building (in years). It is clear that the obtained result is imperfect, firstly because of the rather small database, and secondly because every building is different. However, the database may grow, and with the entering of more information, it will be more accurate.
In
Figure 8, the procedure of input data specification in the Statistica software based on the second-phase analysis database is presented. To know the predicted value of renovation costs in the upcoming year, some information about a building needs to be provided; firstly, the time when the last modernization was performed (in years), and secondly, the usable area of a building (in m
2).
Figure 8 presents exemplary results of the prediction of renovation costs for a sample building for which the last modernization was performed 15 years ago, and its usable area equals 1150 m
2. The result is presented in the frame and was equal to 12,088.55 EUR of the renovation costs for the next year for the exemplary building.
The research was carried out on a sample of 55 buildings managed by 2 universities. The costs related to the renovation of buildings are largely affected by the adopted maintenance strategy. It can be assumed that the managers of the analyzed buildings adopt a similar coherent strategy. Confirmation of the obtained results requires extending the database to buildings of other universities managed by other managers. The authors assume that the data obtained from at least five additional universities will allow to determine how the planned costs are related to the adopted maintenance strategy. University buildings, due to their specificity, including a large number of users, are characterized by a high degree of exploitation, especially of internal elements (floors, internal doors, etc.). For this reason, the developed model may not yield good results in the case of other public facilities. The authors plan to analyze the maintenance costs of other building types, such as office buildings. This will afford the opportunity to assess the usefulness of the developed model for determining the maintenance costs of buildings of a different type than university buildings.
5. Conclusions
One of the most important tasks of building owners and building managers is to keep the buildings in a proper technical condition. This, in turn, requires defining a building maintenance strategy, including necessary repairs, refurbishments, and upgrades. All these activities are associated with incurring costs. Rational renovation management is particularly important in the case of public buildings, where legal regulations regulate the proper spending of funds.
In this article, a model based on regression analysis, that will calculate the predicted annual renovation costs in educational buildings, was created. The model was built based on the results of research carried out in two stages. In the first stage, 17 buildings of 1 of the universities in Cracow were analyzed. The second phase was more detailed, and the final database was wider and covered 55 buildings, located in Cracow and Lodz. To predict future cost expenditure, a cumulative year-on-year bivariate linear regression model was calculated, and the Statistica software was used. The trend line equations, which allow to predict the future cost expenditures in the accurate short term, have been determined. The developed model can be used by owners and managers of public buildings in the proper planning of expenses related to the maintenance of facilities. The limitation of the model is that it can only be applied to educational buildings.
The authors plan to further expand the database, which will allow for confirmation and possible modification of the regression model. Further testing of the model will make it possible to determine the necessary modifications needed to adapt the model to other types of public buildings and not just educational ones.


