Article

Study on Damage Behavior and Its Energy Distribution of Deep Granite at High-Temperature Conditions

1
Department of Civil Engineering, University of Science and Technology Beijing, Beijing 100083, China
2
China National Gold Group Co., Ltd., Beijing 100083, China
*
Author to whom correspondence should be addressed.
Appl. Sci. 2023, 13(11), 6498; https://doi.org/10.3390/app13116498
Submission received: 7 May 2023 / Revised: 23 May 2023 / Accepted: 23 May 2023 / Published: 26 May 2023

Abstract

:
The phenomenon of surrounding rock damage and rupture caused by high temperatures is widespread, and has become a potential threat to the safety of nuclear waste disposal repositories. In order to reveal the energy distribution pattern of fractured granite during the failure process under different confining pressures, triaxial compression tests were carried out on rocks with different initial thermal damage. Firstly, the rock was treated at a high temperature to analyze the change rule of the porosity of the rock after high-temperature treatment, define the equivalent damage coefficient, and analyze the influence of confining pressure and equivalent damage coefficient on the peak stress and peak strain of the rock. The results show that, after high-temperature treatment, the porosity increases with the increase in temperature. The peak stress and corresponding strain of rock samples with similar equivalent damage factors increase with the increase in confining pressure. By comparing the rock samples with the same confining pressure and different initial thermal damage, the larger the confining pressure, the smaller the difference of peak stress of different initial thermal damage specimens. Then, the energy density of rock in a triaxial compression test is quantitatively analyzed by energy theory. The results show that, as long as the confining pressure is the same, the proportion of the dissipated energy of the specimen has a similar evolution trend with the strain. When the confining pressure is the same, the proportion of dissipated energy decreases rapidly with the change of strain due to the increase in equivalent damage factor, but the rate of decline will gradually slow down; however, when the confining pressure increases, the difference caused by the equivalent damage factor will gradually decrease, because the fracture is bound by the confining pressure. Finally, we analyze the maximum dissipated energy during rock deformation and failure. According to the inflection point of maximum dissipated energy, the optimum time for critical support of the key rock mass is determined.

1. Introduction

Rock mass is the product of long-term geological movement. There are a large number of randomly distributed fractures in the rock mass, which are closed for a long time under the action of high in situ stress. However, under the influence of external disturbance, cracks in rock mass are often activated to open or expand, which makes rock mass show obvious anisotropy. During the excavation of deep rock mass, the equilibrium state of original rock stress field is broken and stress transfer occurs, which changes the fracture development and stress state of micro-rock mass in different positions away from the opening surface to different degrees. Therefore, it is more practical to consider the influence of fracture and stress on the accumulation and release mechanism of strain energy in loaded rock.
A large number of scholars have carried out research work on the deformation energy evolution of rocks under loads [1,2,3,4,5,6,7] and achieved fruitful results. In 1966, Cook [8] first proposed that energy was stored in rocks, and the excavation of underground rock mass would lead to the inevitable release of energy. He also proposed the Energy Release Rate (ERR) to show the variation characteristics of energy release rate under different mining sequences. Walsh [9] proposed a general analysis method to evaluate the various energy components generated by underground excavation, and proposed that the total energy of the rock system remains constant. Salamon [10] studied the law of energy distribution changes during excavation Based on elastic theory, the basic principle of energy release rate is explained by analyzing the energy dissipation and transformation mechanism of rock mass in two states, before and after excavation. Dai et al. [11] carried out experimental studies on unloading granite under both axial and confining pressures, and found that the axial absorbed strain energy under different unloading paths was mainly transformed into circumferential dilatation consumed strain energy. Dong et al. [12] believed that, under the condition of online elasticity, the strain energy of rock mass in the excavation area does not exist after underground rock mass excavation, and the energy produced by gravity in the excavation process of the whole system (the physical model of underground rock mass excavation) is mainly converted into the accumulated energy in the surrounding rock, and the remaining energy is released. Luo et al. [13] established the ascending constitutive model considering the intermediate principal stress through cyclic loading and unloading tests and numerical simulation, and revealed the changing law of energy evolution in the process of cyclic loading and unloading. These theoretical studies [14,15,16,17,18] introduce the evolution of deformation energy into the rock failure process. Starting from the analytical derivation of stress and strain, according to the analytical solution of stress and strain and the principle of energy calculation, the energy of surrounding rock is solved and the energy evolution process is analyzed, which provides a scientific basis for this paper to analyze the energy distribution law of surrounding rock and the energy change law when the surrounding rock is broken.
In terms of the study of fractured rock, Wong [19] and Bobet [20] conducted biaxial experiments on rock samples with multiple fractures to study and analyze the generation, development, CoAlation, and the failure evolution process of the fracture field. Huang et al. [21] explained the influence of fracture spatial geometric parameters on rock failure mode by numerical analysis method. Sagong et al. [22] and Park et al. [23] used gypsum material to prepare gypsum specimens with multiple cracks, and analyzed the influence of the interaction between cracks in the loading process on microcrack initiation, aggregation, and failure evolution. Ferro et al. [24] carried out uniaxial compression tests on rock samples with different fracture parameters, and obtained the influence rule of fracture size on dissipated energy. The experimental results showed that the scale effect of dissipated energy density was greater than that of compressive strength. Zhong et al. [25] used acoustic emission system and energy principle to analyze in detail the influence of loading rate on energy conversion during rock deformation and failure. Wang et al. [26] conducted a series of triaxial compression tests on fractured coal rock, and analyzed the influence law of different prefabricated cracks on peak strain and peak stress of coal rock. Liu et al. [27] simulated the unloading process of a single fracture tunnel. Duan et al. [28] analyzed the unloading test of prefabricated fractured rock and discussed the variation rule of the characteristic stress of crack during unloading. These studies have deeply discussed the mechanical failure process of fractured rock.
To sum up, in terms of energy evolution, studies on energy accumulation and release mechanism of loaded rock during deformation are relatively complete [29,30,31,32,33]. Scholars have fully considered the influence of loading path, mode, and loading rate on rock deformation [34,35,36,37], but ignored the influence of fracture field on deformation energy evolution. However, in the study of rocks containing cracks, scholars prefer to simplify cracks into single, double, or multiple visible artificial cracks [38,39,40], but this simplification process of cracks completely ignores the influence of interactions among disordered cracks on the evolution of rock mass deformation energy. Therefore, it is of great significance to study the influence of fracture and stress coupling on the evolution mechanism of rock deformation energy. It is worth mentioning that, considering the engineering geology of fissure induced mainly by tectonic movement and geothermal formation, in which the fracture induced by load stress fracture distribution has strong directivity, and the thermal stress induced by cracks is more randomness, relative to the laboratory test preparation with different fracture degree of sample selection which is more advantageous to the scientific nature of the results. Based on the rock triaxial testing machine, PCI-II acoustic emission system, tubular high-temperature furnace, and the portable self-sealing rock triaxial test high-pressure chamber independently developed by the research group, we carried out triaxial compression tests on rocks with different initial thermal damages under different confining pressures. The energy evolution process of fractured granite under triaxial loading is studied, and the influence of stress and fracture coupling on energy evolution mechanism is discussed, it provides a scientific basis for the selection of roadway stability support timing in engineering.

2. Acoustic Emission Test of Fractured Rock under Triaxial Loading

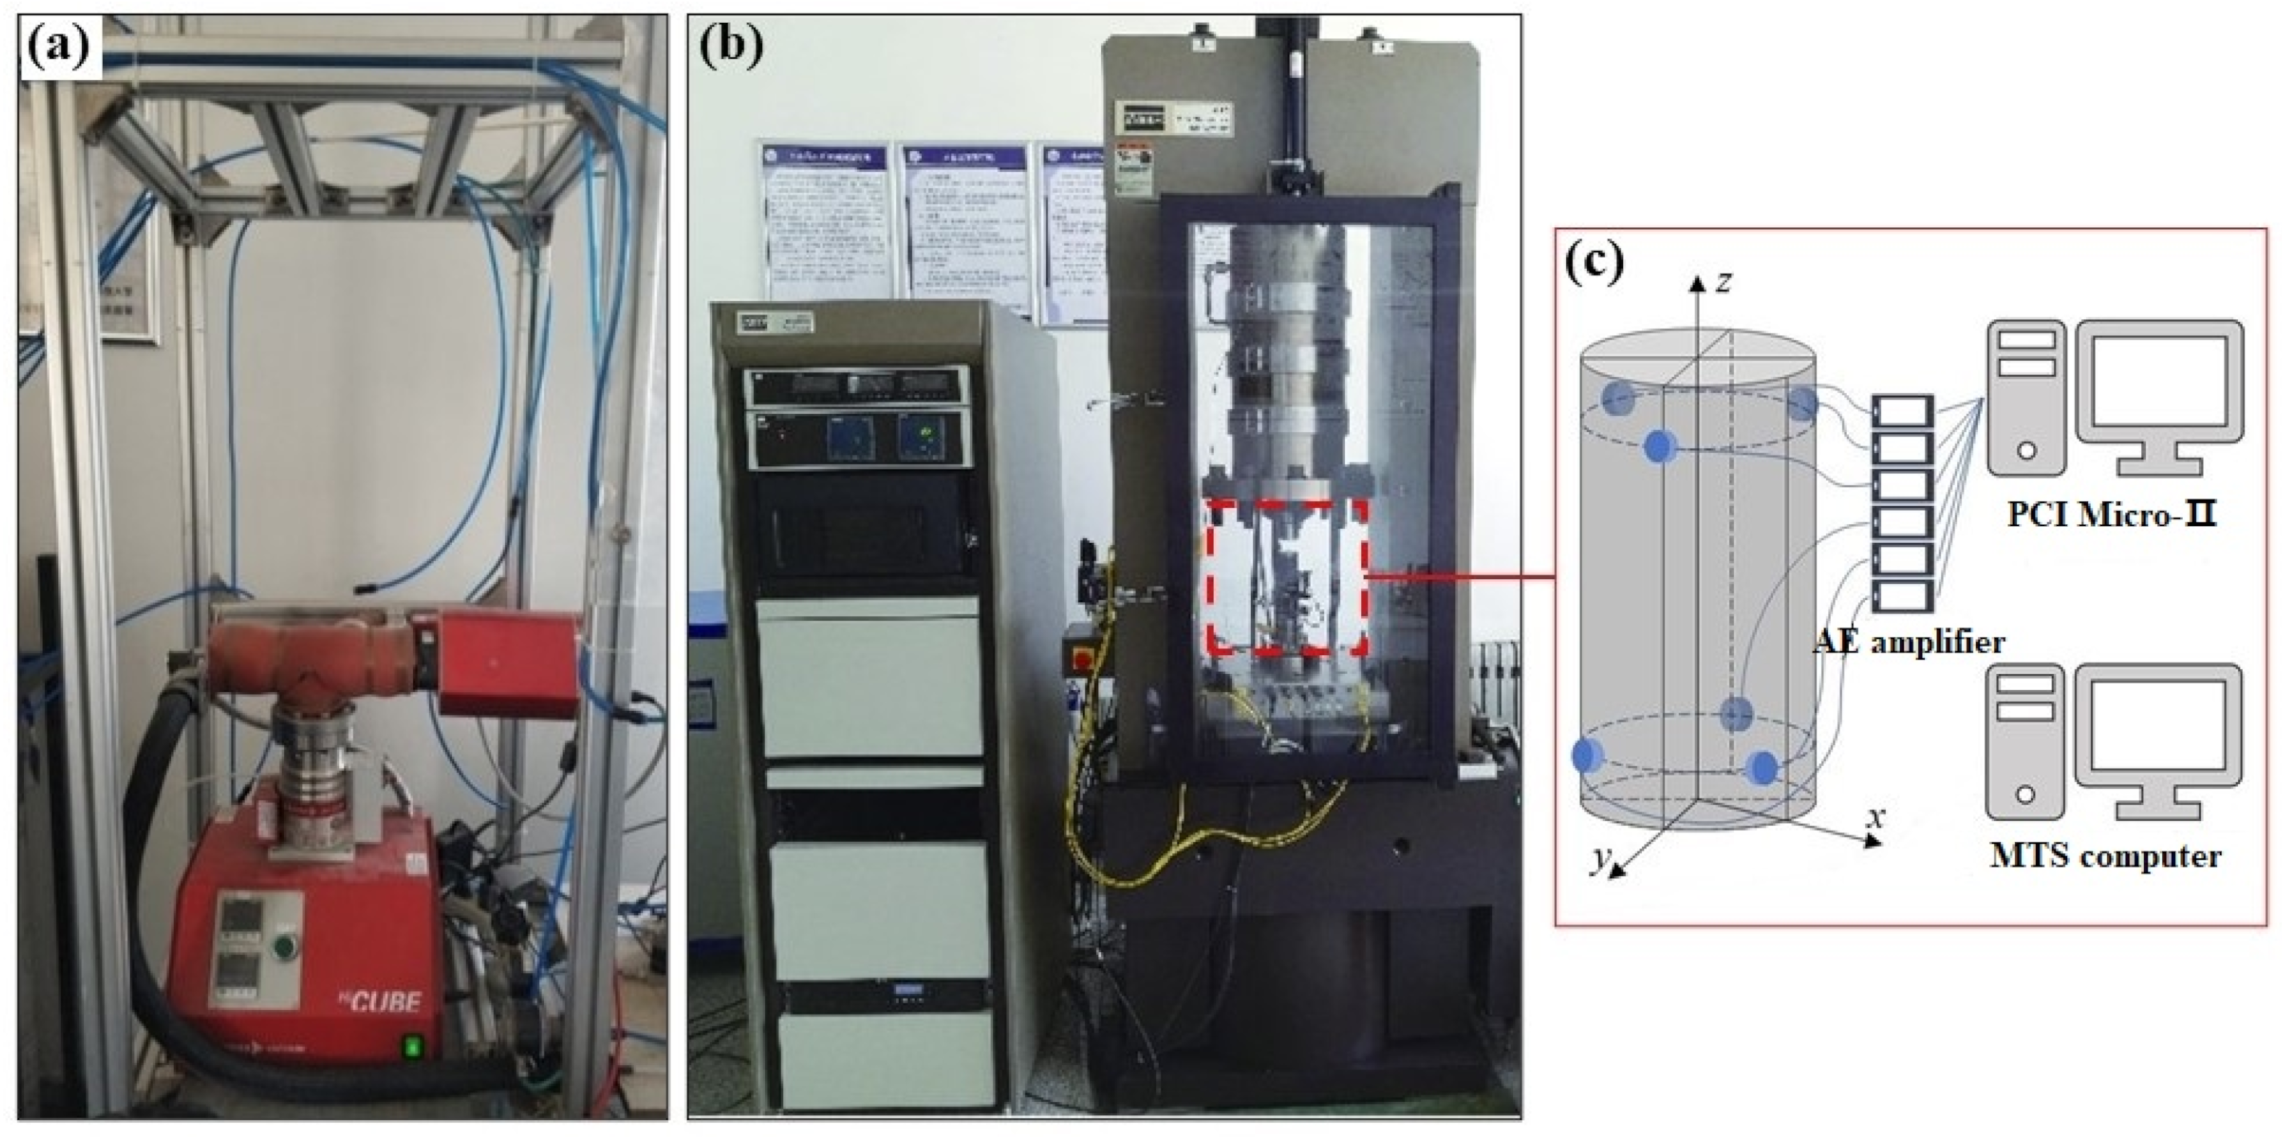
2.1. Instrument and Control Method

The main test instruments used in the test are TAW-2000 micro-computer-controlled electro-hydraulic servo rock triaxial test machine, PCI-II acoustic emission system, tubular high-temperature furnace, and portable self-sealing rock triaxial test high-pressure chamber independently developed by the research group, these devices are shown in Figure 1.
(1)
PCI-II acoustic emission test system: In order to reduce the interference of environmental noise during the test, the preamplifier gain and trigger threshold value were set to 40 dB, and the sampling frequency was 0.5 MHz. For the uniaxial compression test, an acoustic emission sensor (Micro 30) was placed in the middle of the rock sample, and vaseline was coated between the rock sample and the sensor to provide good acoustic coupling.
(2)
For the tubular high-temperature furnace, we used the programmable high-temperature furnace from the Metallurgical Laboratory of University of Science and Technology Beijing, as shown in Figure 1. The highest heating temperature of the high-temperature furnace is 1000 °C. Temperature control precision is less than 2 °C. The display precision is 1 °C, and the heating rate is controllable at 1 °C/min.
(3)
The pressure chamber can apply a radial force of 200 MPa, and can monitor the compression deformation of samples in real time. The maximum pressure of the high-precision oil pressure control system is 200 MPa, precision is 0.01 MPa, directly connected with the high-pressure chamber; the three-way valve system is mainly for loading and unloading of oil inlet valve and oil return valve control, control precision is 0.05 MPa; the ultra-high pressure hand pump can apply the maximum pressure is 200 MPa. Three kinds of confining pressures (0 MPa, 10 MPa, and 20 MPa) are designed. The loading was similar to the conventional triaxial test, and the axial pressure and confining pressure were loaded alternately with a gradient of 5 MPa each time. When it reached the design value, the axial loading rate was 0.02 mm/min to failure.

2.2. High-Temperature Damage Test and Analysis of Rock

The cracks induced by stress propagate mainly between a single (intragranular crack) or even several (transgranular crack) minerals. Therefore, the resulting cracks tend to be parallel to the maximum principal stress, that is, there is significant anisotropy. Thermal cracks mostly occur between adjacent grains (intergranular cracks). Since the distribution of minerals in granite is statistically isotropic, thermal stress-induced cracks are basically isotropic. In order to analyze the influence of fracture density on the energy distribution of rock mass during deformation and failure. Therefore, the spatial distribution of cracks is mainly considered in this experiment, and the crack type is the second. Therefore, granite samples with different cracks were prepared by thermal damage.
The rock samples in this paper are made of uniformly textured granite without obvious cracks and are made of complete continuous rock blocks. The size of the specimen was φ30 mm × 60 mm cylinder, meeting the requirements of the specification height to diameter ratio 2.0~2.5. The average density of the specimen at room temperature was 2.68 g/cm3.
The granite specimens with the size of φ30 mm × 60 mm were heated in a programmable tube furnace to prepare the granite specimens with cracks. In order to obtain granite samples with different degrees of fracture, four target temperatures were set during the test, namely 300 °C, 400 °C, 500 °C, and 600 °C, and three samples were heated at each target temperature. The heating path is as follows, the sample is heated from room temperature to the target temperature at a heating rate of 55 °C/min, then keep the temperature for 1 h, and, finally, the sample is cooled to room temperature at a cooling rate of 5 °C/min. In order to quantitatively describe the damage degree of rock after heating, the parameters that can characterize the physical and mechanical damage of material were selected, namely, porosity and change rate of p-wave velocity before and after heating. In order to measure the change of sample porosity after high-temperature treatment, the sample was cooled to room temperature and weighed (Ms) after high-temperature heating treatment. According to the preparation method of saturated sample suggested by ISRM, the sample was saturated and weighed (Msat). The effective porosity of the sample (hereinafter referred to as porosity) n can be calculated,
n = M s a t M s ρ w V
where, V and ρ w are the volume and density of water, respectively.
The non-metallic ultrasonic instrument RS-ST01C was used to measure the p-wave velocity of rock samples before and after high-temperature treatment. The variation tendency of porosity and p-wave velocity of samples treated at different temperatures are shown in Figure 2.
From Figure 2a, it can be seen that the higher the target temperature, the greater the porosity of the sample, which were 0.377, 0.916, 1.122, 1.669, and 3.226, respectively. In the range of 500~600 °C, the growth rate of porosity is 8.5 times that of normal temperature. In another picture, the p-wave velocity of saturated sample is higher than that of dry sample under the same test conditions. The higher the target temperature, the wave velocity of the dried sample decreases monotonically with the increase in the target temperature. The velocity deceleration is the slowest in the range from 0 °C to 300 °C, and the velocity at 300 °C is 0.836 times that of the initial sample. At 300 °C, 400 °C, and 500 °C, the rock wave velocity decreases step by step, and the crack development scale is relatively stable. At 600 °C, the rock wave velocity decreases significantly, indicating that the thermal stress at 600 °C causes a large number of rock joints and fissures to develop and more fine cracks to propagate. The higher the temperature, the lower the wave velocity of the saturated sample, but the decrease range is smaller than that of dry sample, and there is no significant temperature decreasing range.
Referring to Lematire’s definition of damage variable, the damage variable was established according to the change of p-wave velocity after high temperature,
D = 1 V i V 0
where D is the equivalent damage factor; V 0 is the p-wave velocity of the sample at room temperature; and V i is the p-wave velocity of the sample after high temperature.
According to Formula (2), the equivalent damage factors of specimens under various temperature gradients from 23 °C to 600 °C are 0, 0.16, 0.36, 0.51, and 0.89, respectively.

3. Acoustic Emission Test Results and Analysis of Fractured Rock under Triaxial Loading

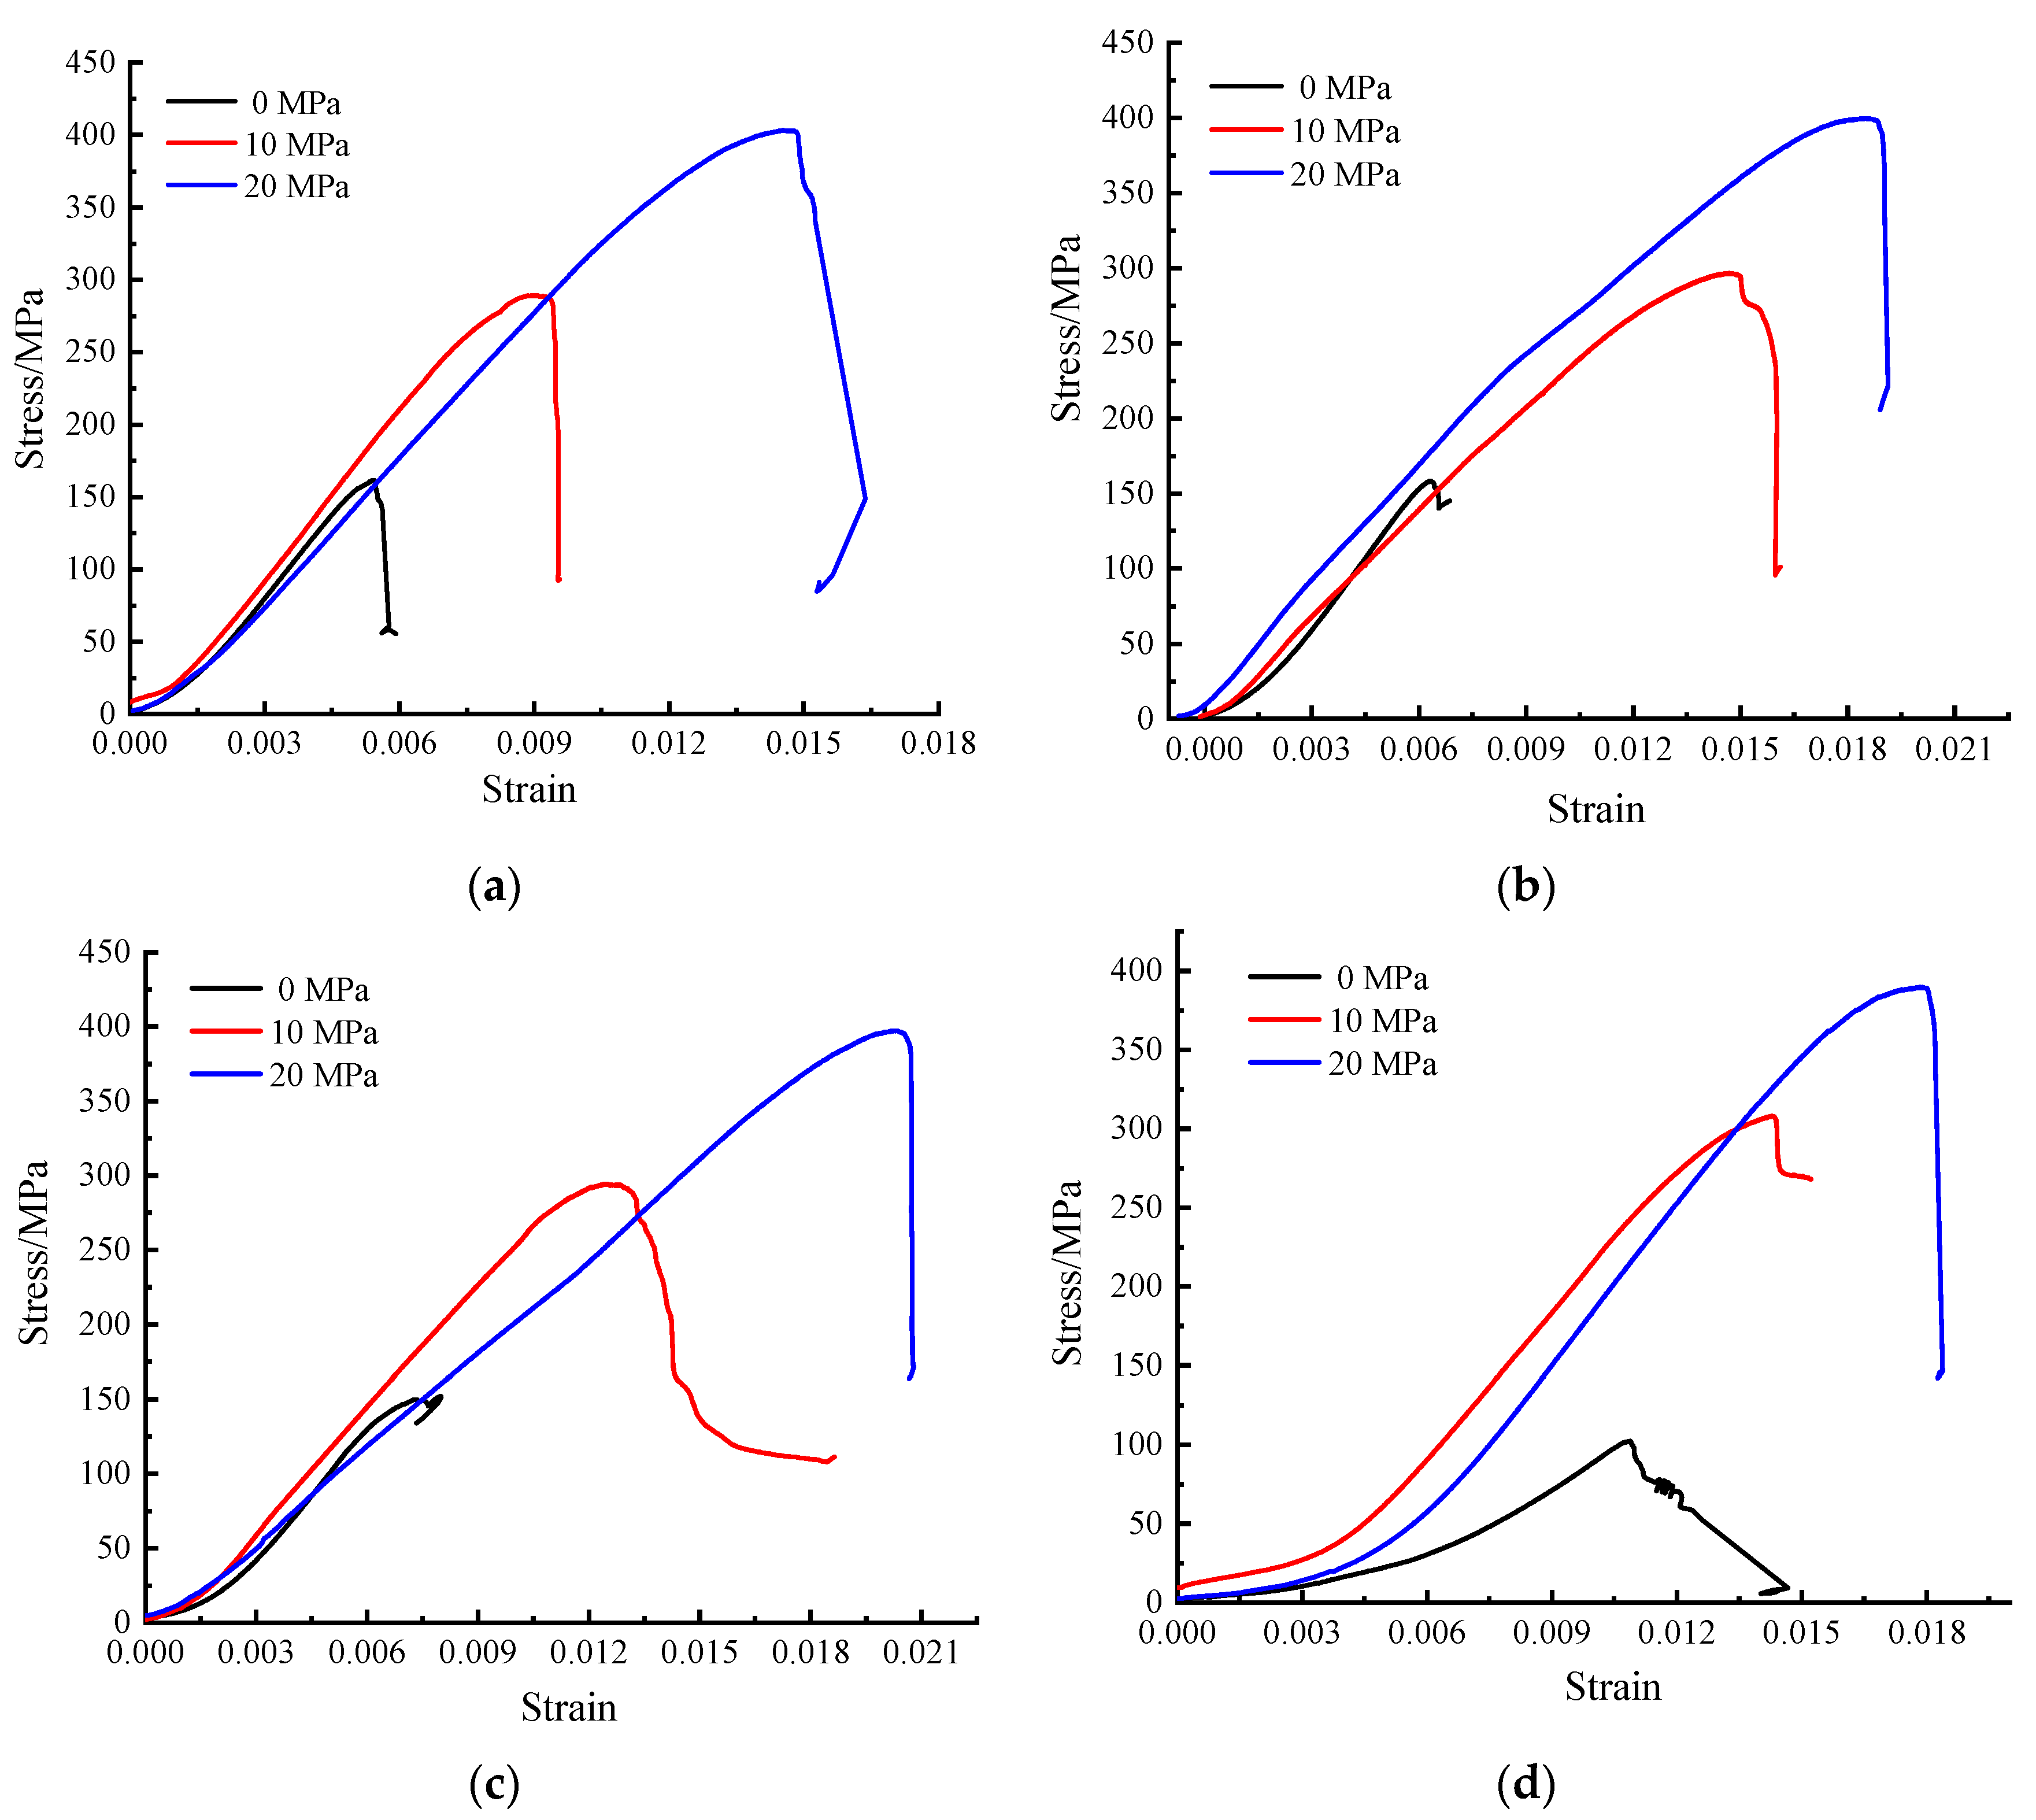
3.1. Total Stress–Strain Curve and Failure Mode

Figure 3 shows the stress–strain curves of samples with different initial thermal damage under conventional triaxial compression under three different confining pressures. The results show that the samples with different initial thermal damage under different confining pressures all underwent fracture compaction, elastic, fracture development and strain softening stages. With the increase in confining pressure, the cracks in the sample are compressed to different degrees. The closer the equivalent damage factors are, the less obvious the compaction stage is on the stress–strain curve. In the fracture development stage, the internal fractures of rock are fully developed before the peak due to confining pressure; therefore, the greater the peak front wall pressure, the more obvious the softening effect. In the post-peak failure stage, the greater the confining pressure, the stress drop rate gradually changes from fast to slow.
In order to quantitatively describe the influence of confining pressure and crack on the specimen compression deformation failure process, the characteristic mechanical parameters in Figure 3 were extracted, and the changes in characteristic mechanical parameters of rock with crack were plotted under different confining pressures, as shown in Figure 4. As can be seen from Figure 4a,b, the peak stress and its corresponding strain increase with the increase in confining pressure for rock samples with similar equivalent damage factors; however, when the confining pressure is the same, the greater the confining pressure, the difference in peak stress of different initial thermally damaged samples becomes smaller and smaller, and the peak stress of samples is almost the same under the confining pressure of 10 MPa and 20 MPa. However, the difference of peak strain of samples with different initial thermal damage under the same confining pressure does not decrease with the increase in confining pressure, indicating that the peak stress of samples is sensitive to confining pressure, and the peak strain is sensitive to the effect of equivalent fracture damage factor. Meanwhile, Figure 4c shows that the greater the confining pressure, the smaller the elastic modulus, and the smaller the equivalent damage factor under the same confining pressure, the greater the elastic modulus; however, for the sample with D = 0.89, the elastic modulus does not change significantly with the increase in confining pressure because the internal cracks are relatively developed.
Failure patterns of rocks under different confining pressures are shown in Table 1. As can be seen from the table, for rocks with similar equivalent damage factors, with the increase in confining pressure, the failure mode of specimens gradually transitions from axial splitting failure to macroscopic splitting surface with a certain angle to axial direction. In addition, under a low confining pressure, the more cracks in the sample are developed, the more sub-splitting surfaces are formed during the failure of the sample. For example, under 0 MPa, the equivalent damage factors in the cracks have the most obvious influence on the failure mode of rock. However, with the increase in confining pressure, the effect of equivalent damage factors in rock mass on the failure mode decreases. For example, the failure of all samples at 20 MPa is a macroscopic shear failure surface with a certain angle with axial stress, indicating that the development degree of internal fractures in rock mass has little influence on the failure mode of rock mass at high confining pressure.

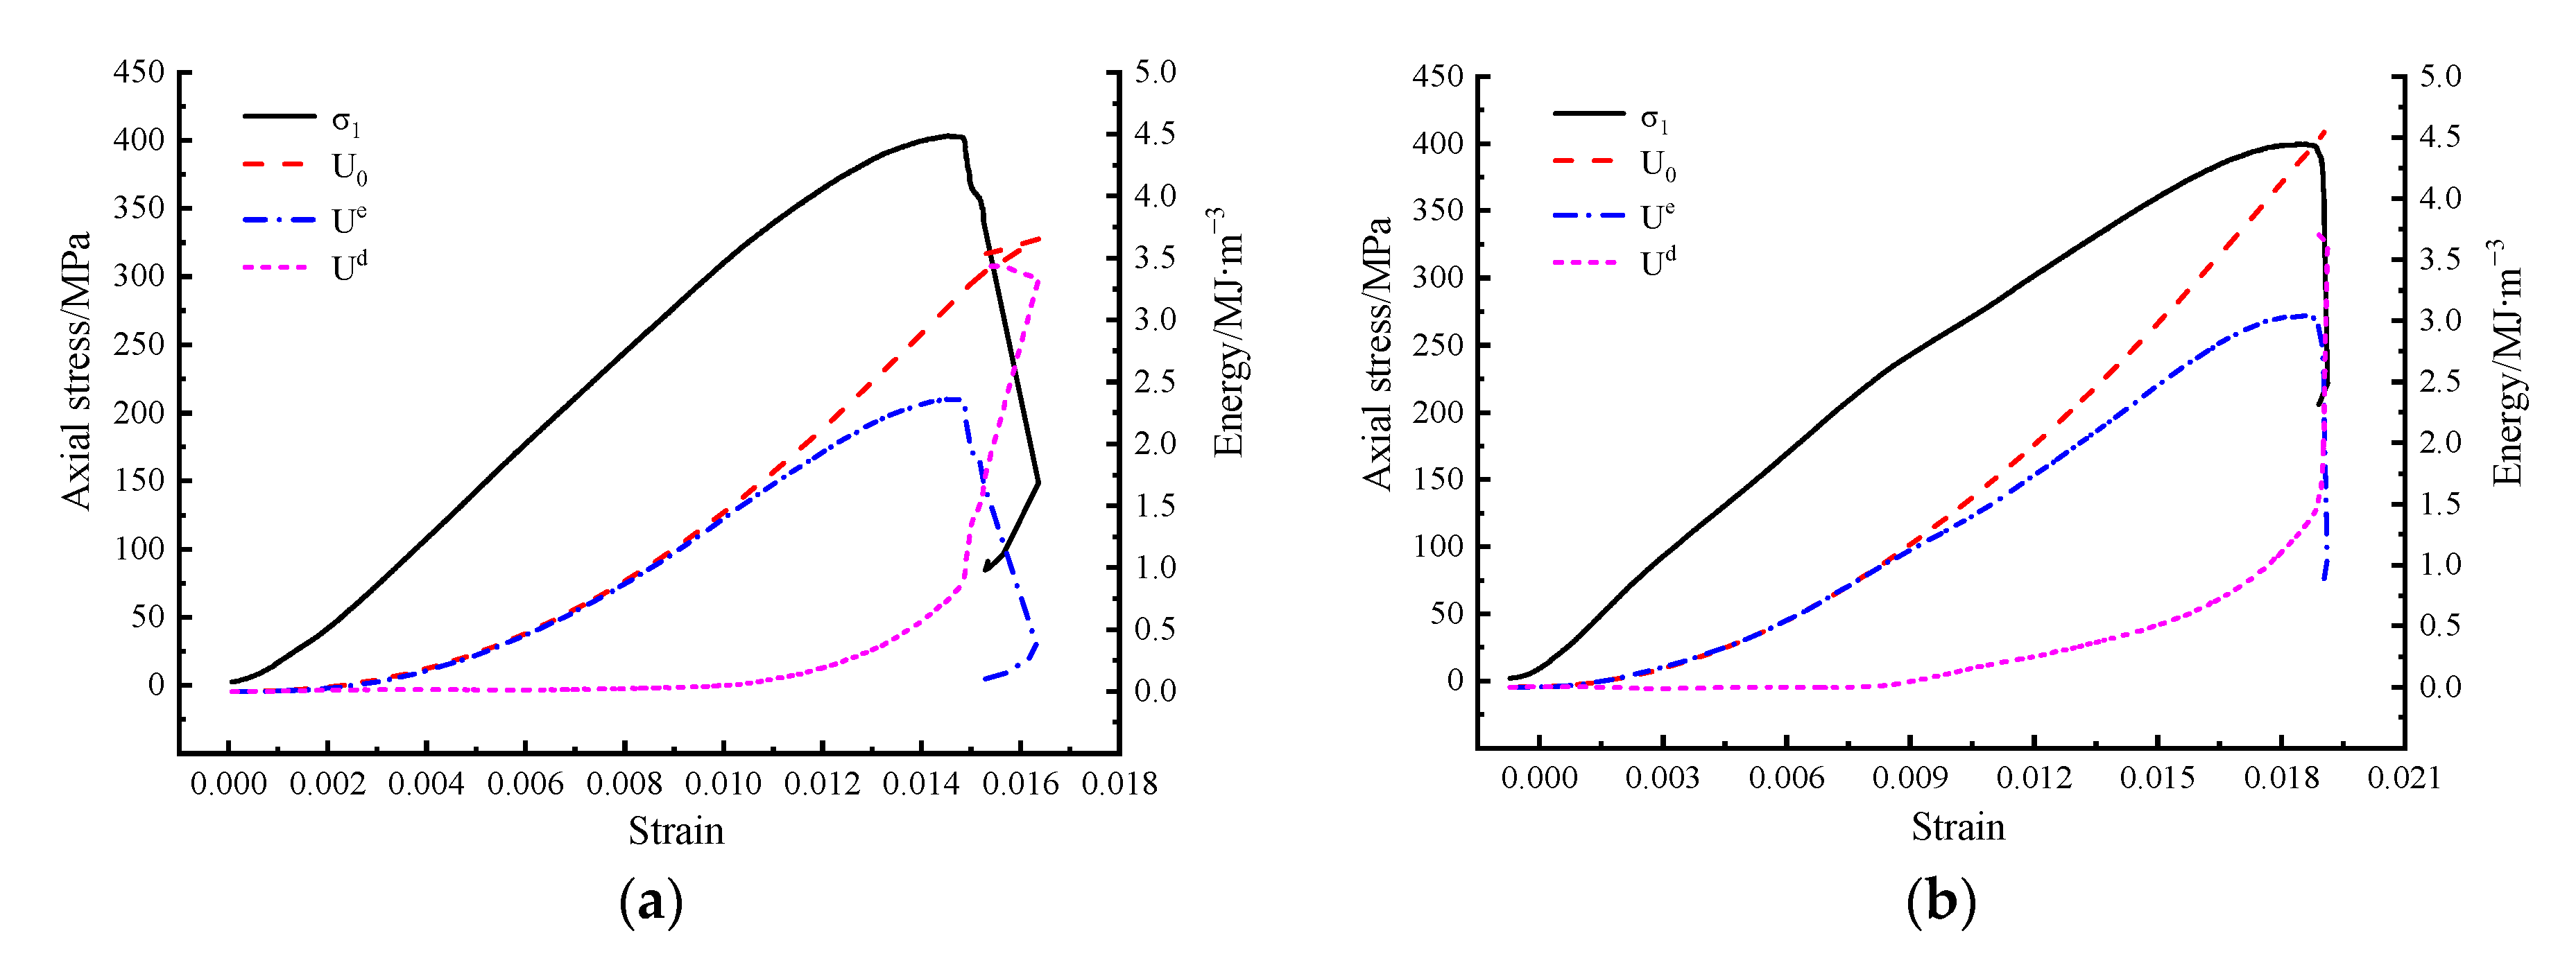
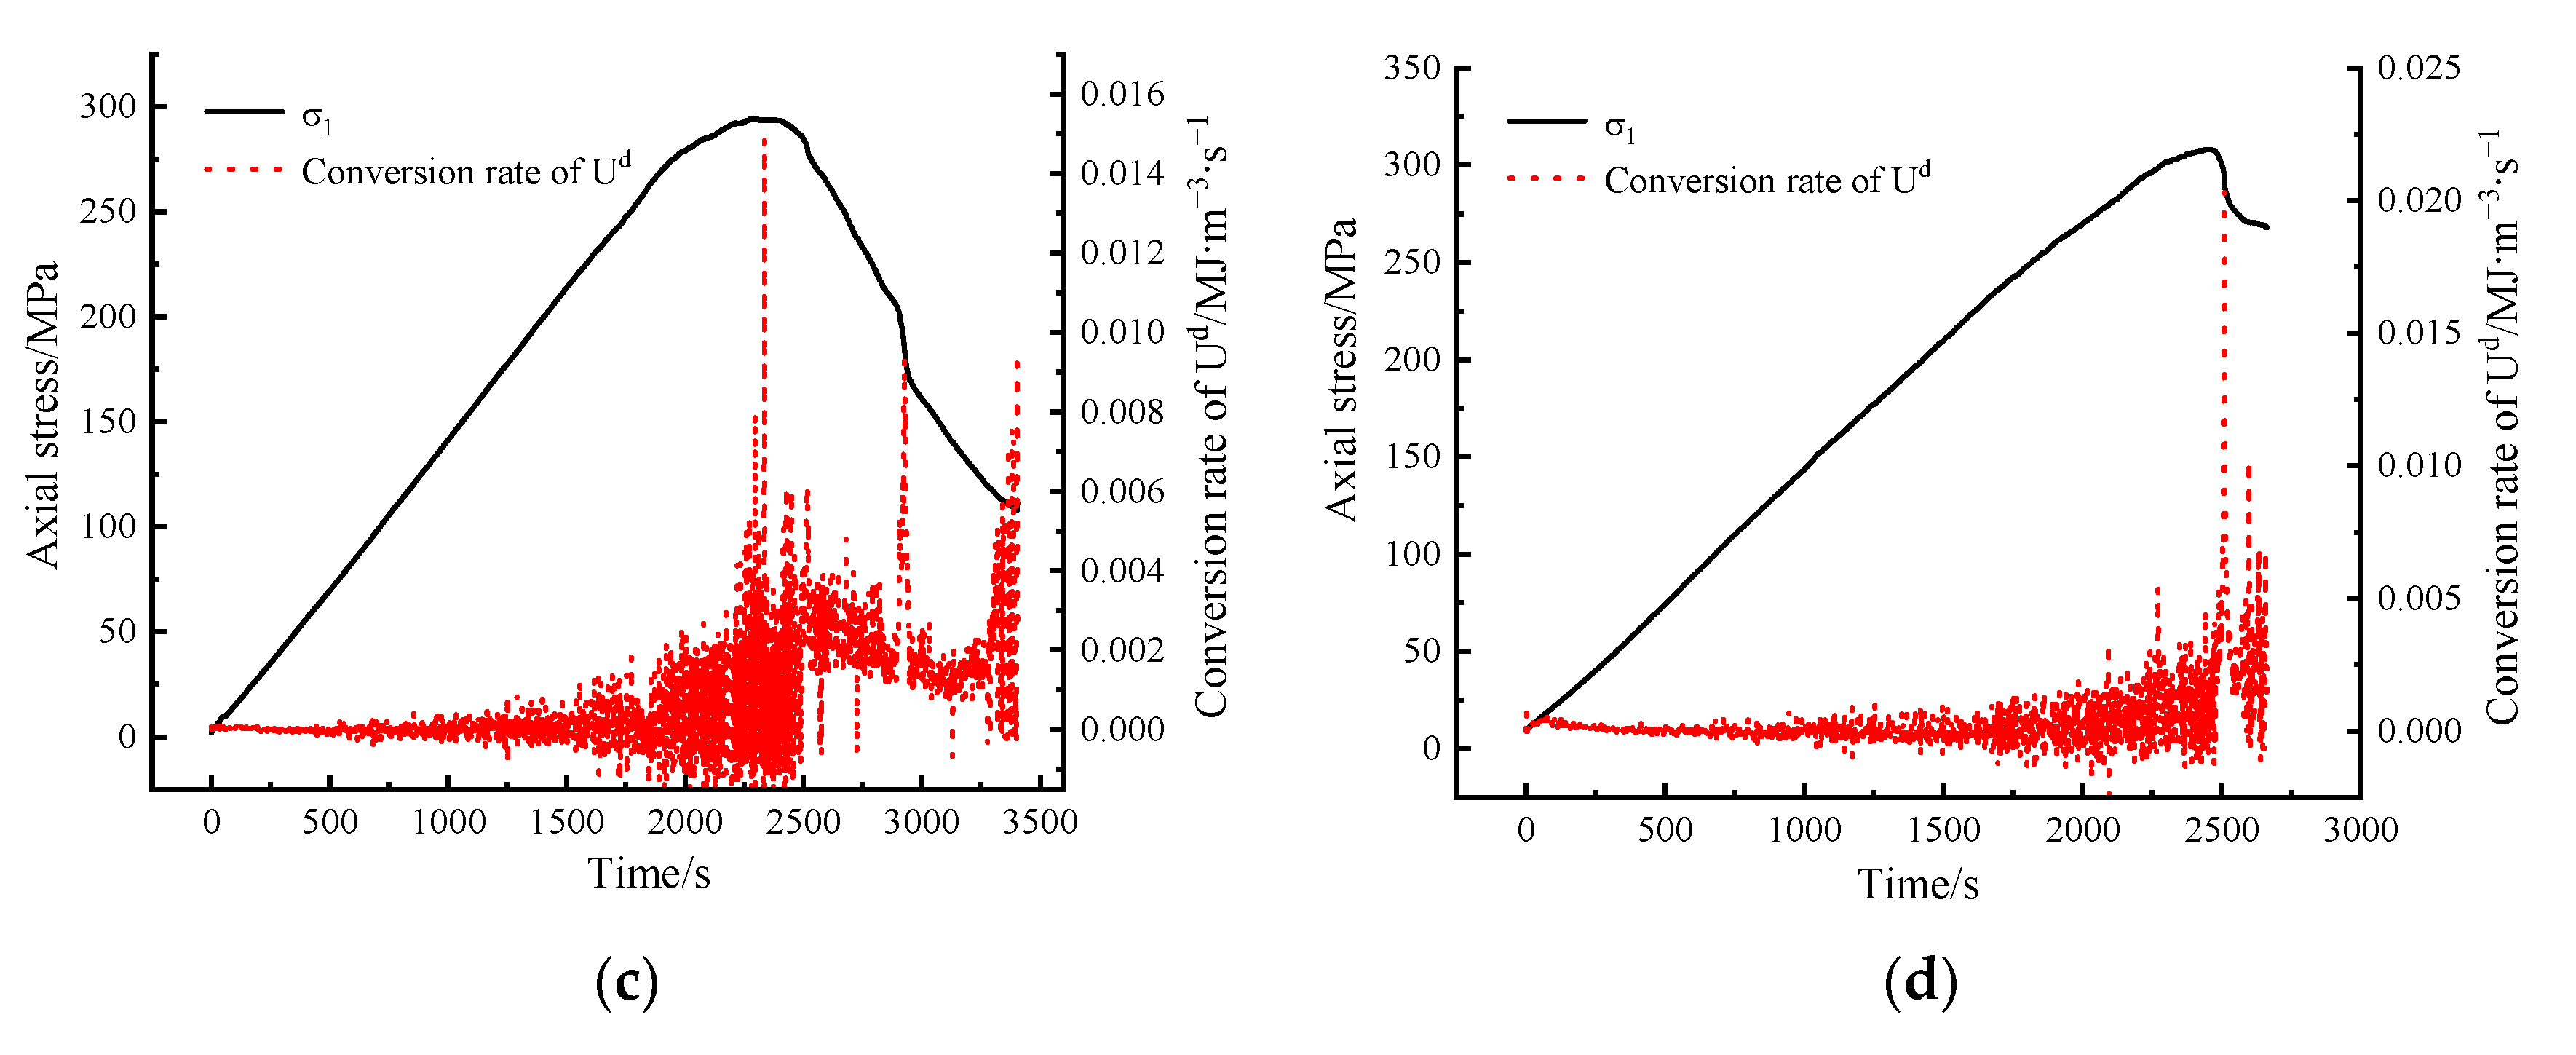
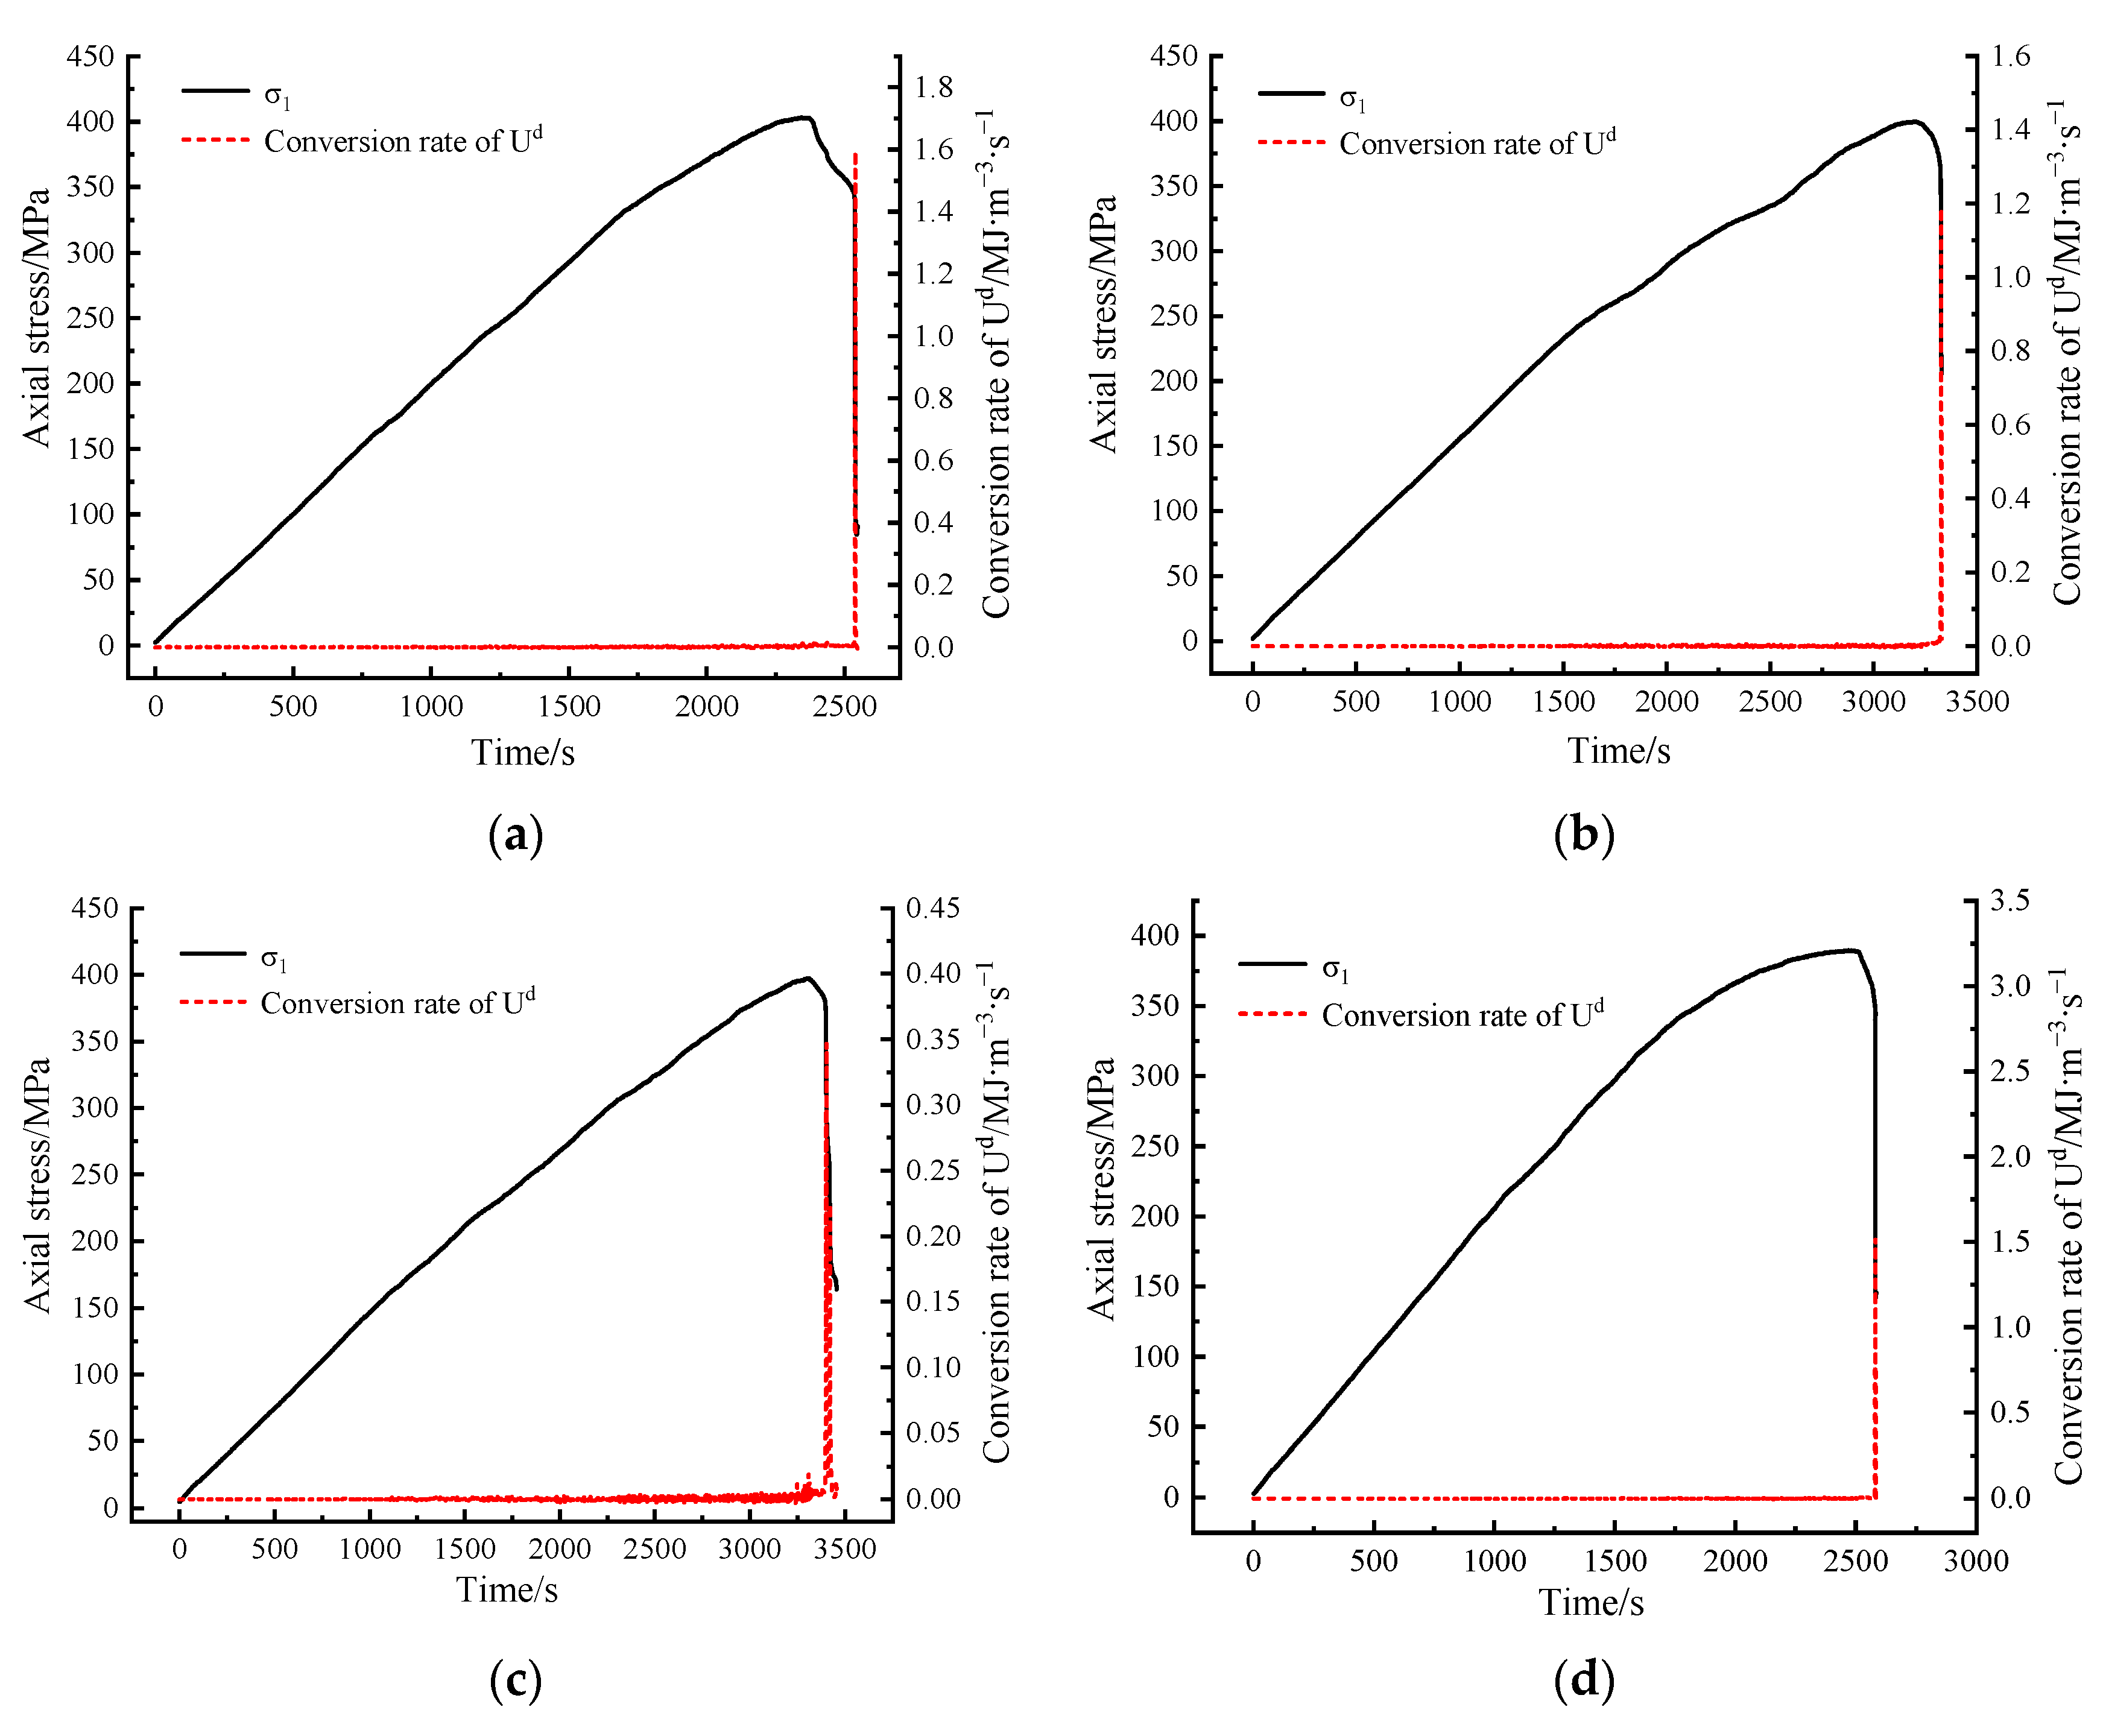
3.2. Effect Analysis of Equivalent Damage Factors on Rock Energy Evolution

According to the law of conservation of energy
W = U d + U e
where W is the energy input to rock sample by press; U e is the elastic energy; and U d is mainly damage energy during rock deformation and plastic energy used for rock particles to produce plastic deformation.
Taking the loading curve of rock as an example, assume that OA is the loading curve and AB is the unloading curve. Then, the area enclosed with the strain below AB is u i e , and the area enclosed below OA and above AB is the u i d .
u i e = ε b ε c σ i d ε i
u i d = 0 ε c σ i d ε i ε b ε c σ i d ε i
where ε b and ε c are the strain values at the point where the stress is 0 after unloading and at the beginning of unloading, respectively. In this paper, the elastic modulus E 0 of the elastic segment before the peak is taken as the unloading elastic modulus E i in the calculation of energy. For uniaxial compression test, the elastic energy U i e can be released at stress σ i .
U i e = σ i 2 / 2 E 0
For triaxial test, the stored elastic energy mainly consists of axial and circumferential parts. However, the circumferential stored elastic energy is far less than the axial elastic energy, so Equation (6) is still used to calculate the elastic energy. According to the stress–strain curve obtained from the conventional triaxial compression test, the evolution of total input strain energy density, elastic energy density, and dissipated energy density with strain under different confining pressures was obtained by combining energy calculation Equations (3)–(6), as shown in Figure 5 and Figure 6.
It can be seen from Figure 5 and Figure 6 that energy characteristic curves evolve similarly under different confining pressures. At the stage of fracture compaction and stable development, the mechanical energy input from the outside is mainly transformed into elastic energy and stored in the rock interior. This part of energy accounts for about 90~96% of the total energy, and only about 5% is used for fracture closure and the generation and expansion of new fractures. In the unstable development stage of fracture, both elastic energy and dissipative energy continue to increase, but the proportion of dissipative energy in total energy begins to increase gradually due to the plastic deformation of rock samples and the further initiation and expansion of microcracks. In the post-peak stage, macroscopic main cracks appear. The elastic energy is released quickly, and most of the energy is converted into dissipated energy, which is used for macroscopic crack sliding and friction heat energy. At the same time, a certain amount of elastic energy is stored in the post-peak residual stage under confining pressure.
The maximum dissipated energy of samples with different initial thermal damage under confining pressures of 10 MPa and 20 MPa is shown in Figure 7. The result shows that, under the same fracture degree, with the confining pressure increases, the maximum dissipative energy becomes larger. Under the same confining pressure, with the increase in rupture degree, the maximum dissipated energy increases first and then decreases, and the change rate is first slow and then fast. Because under different confining pressures and different initial thermal damage conditions, the energy characteristic curves of all specimens evolved similarly during the test, in order to obtain the influence of equivalent damage factors on energy characteristic curves under certain confining pressures, the relationship between dissipated energy and strain of 10 MPa and 20 MPa specimens was drawn as shown in Figure 8.
As can be seen from the figure, the evolution of dissipated energy ratio of specimens with different initial thermal damage is similar in the compression deformation failure process under different confining pressures. They all experience four stages, rapid increase → rapid decline → steady at a certain value → rapid rise. By comparison, it is found that the dissipated energy ratio of the sample with equivalent damage factor D = 0.89 is significantly higher than that of other damaged samples, indicating that there is mutability in the development of cracks in granite samples, and cracks in rock develop rapidly when the thermal stress reaches the threshold value of fracture propagation. Taking curve analysis in Figure 8a as an example, the proportion of dissipated energy of specimens with different initial thermal damage increased rapidly at the initial loading stage, with almost the same rising speed; however, the greater the equivalent damage factor, the slower the decline rate, and the smaller the difference with the increase in confining pressure.
The dissipative energy increment per unit time was defined as the dissipation rate, which was expressed by the Ud conversion rate. Figure 9 and Figure 10 show the variation curves of dissipated energy conversion rate of samples under different confining pressures, which are used to reflect the damage rate of rock samples during deformation. Figure 9 and Figure 10 show the change curves of dissipated energy conversion rate of samples at 10 MPa and 20 MPa, respectively. It can be seen from Figure 9 and Figure 10 that the dissipation energy conversion rate is small in the pre-peak stage, while the dissipation energy conversion rate reaches the maximum at the point of maximum stress drop.
The maximum dissipated energy conversion rate data of samples under different confining pressures were extracted, as shown in Figure 11. It can be seen that the greater the confining pressure, the greater the conversion rate of the maximum dissipated energy, and the development of fractures in rocks will directly affect the deformation and damage rate, especially under high confining pressure.

4. Discussion

(1)
In the research of rock mass engineering, the primary task is to obtain the distribution characteristics of anisotropic crack in rock mass by using ultrasonic borehole television technology. Using borehole TV, the crack dip angle in the scanning area is segmented statistics, so as to obtain the distribution law of crack occurrence. Secondly, by analyzing the relationship between crack tendency and crack depth, the statistical data of the dominant crack surface are obtained. Then, the number of fracture surfaces within each unit distance is counted to obtain the density distribution characteristics of the fracture surface. These steps are the basis for the study of fractured surrounding rock.
(2)
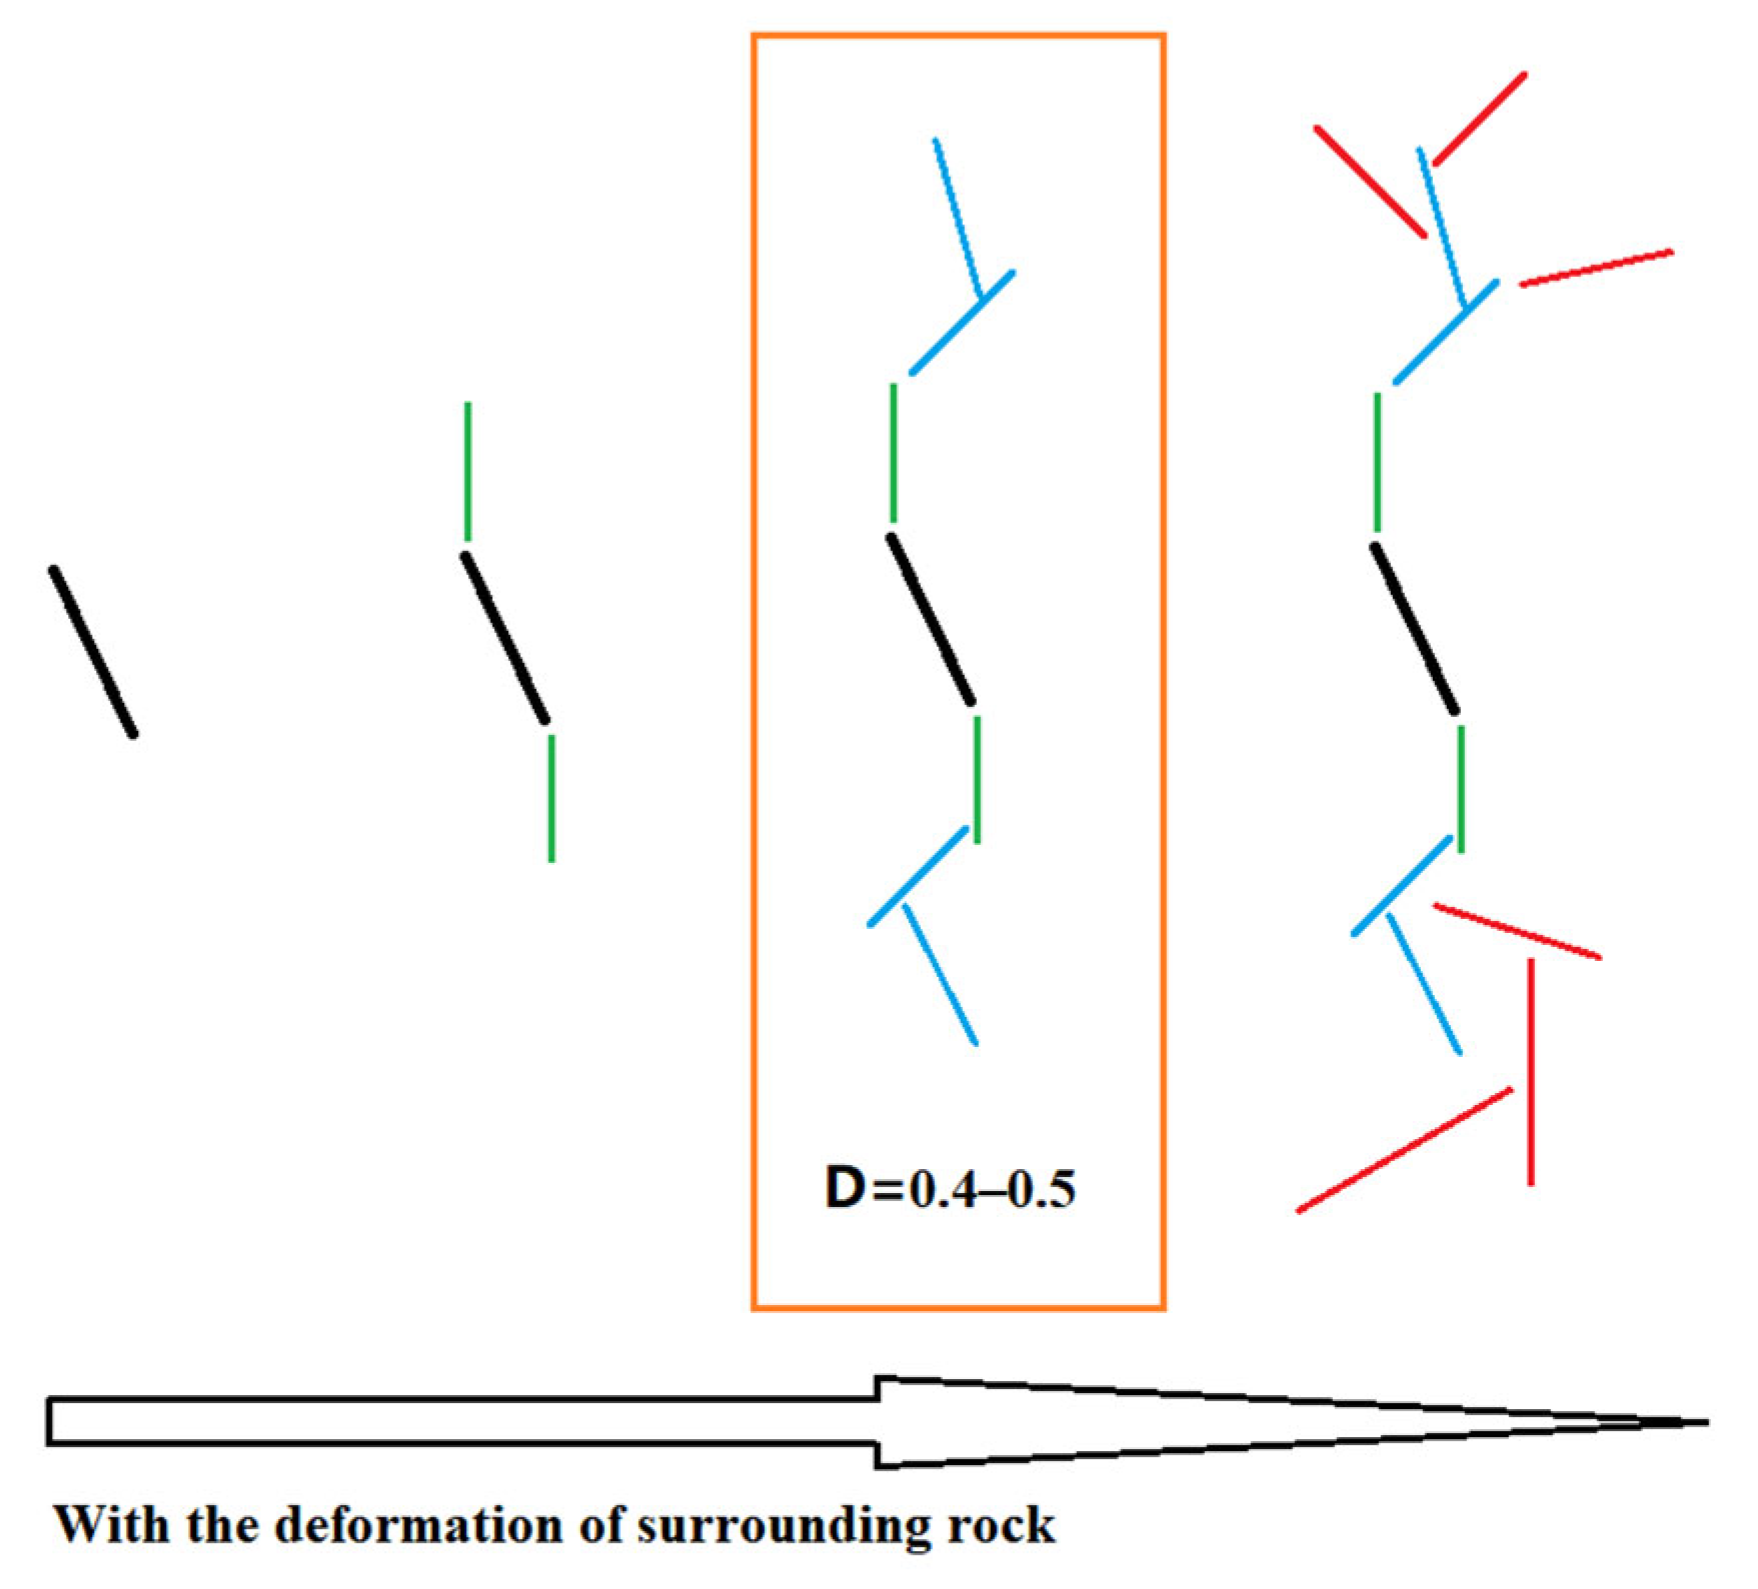
Because the failure of the granite specimens is sudden, the damage is gradual in the specimen before the failure. When the fissure degree in the rock develops to a certain extent, the fissure changes from a stable expansion to an unstable expansion, and then the fissure quickly passes through the rock, causing damage. Therefore, for brittle hard rock, if the support can be carried out before the fissure instability expansion, the development of fissure can be effectively controlled. For example, Wei et al. [41] has carried out 3D network simulation based on deep rock joint of borehole TV, hoping to achieve the purpose of evaluating the stability of surrounding rock by simulating and exploring the distribution law of fracture space. Therefore, the fissure degree corresponding to the inflection point of maximum dissipated energy is finally adopted in this paper as the target factor to measure the support time.
(3)
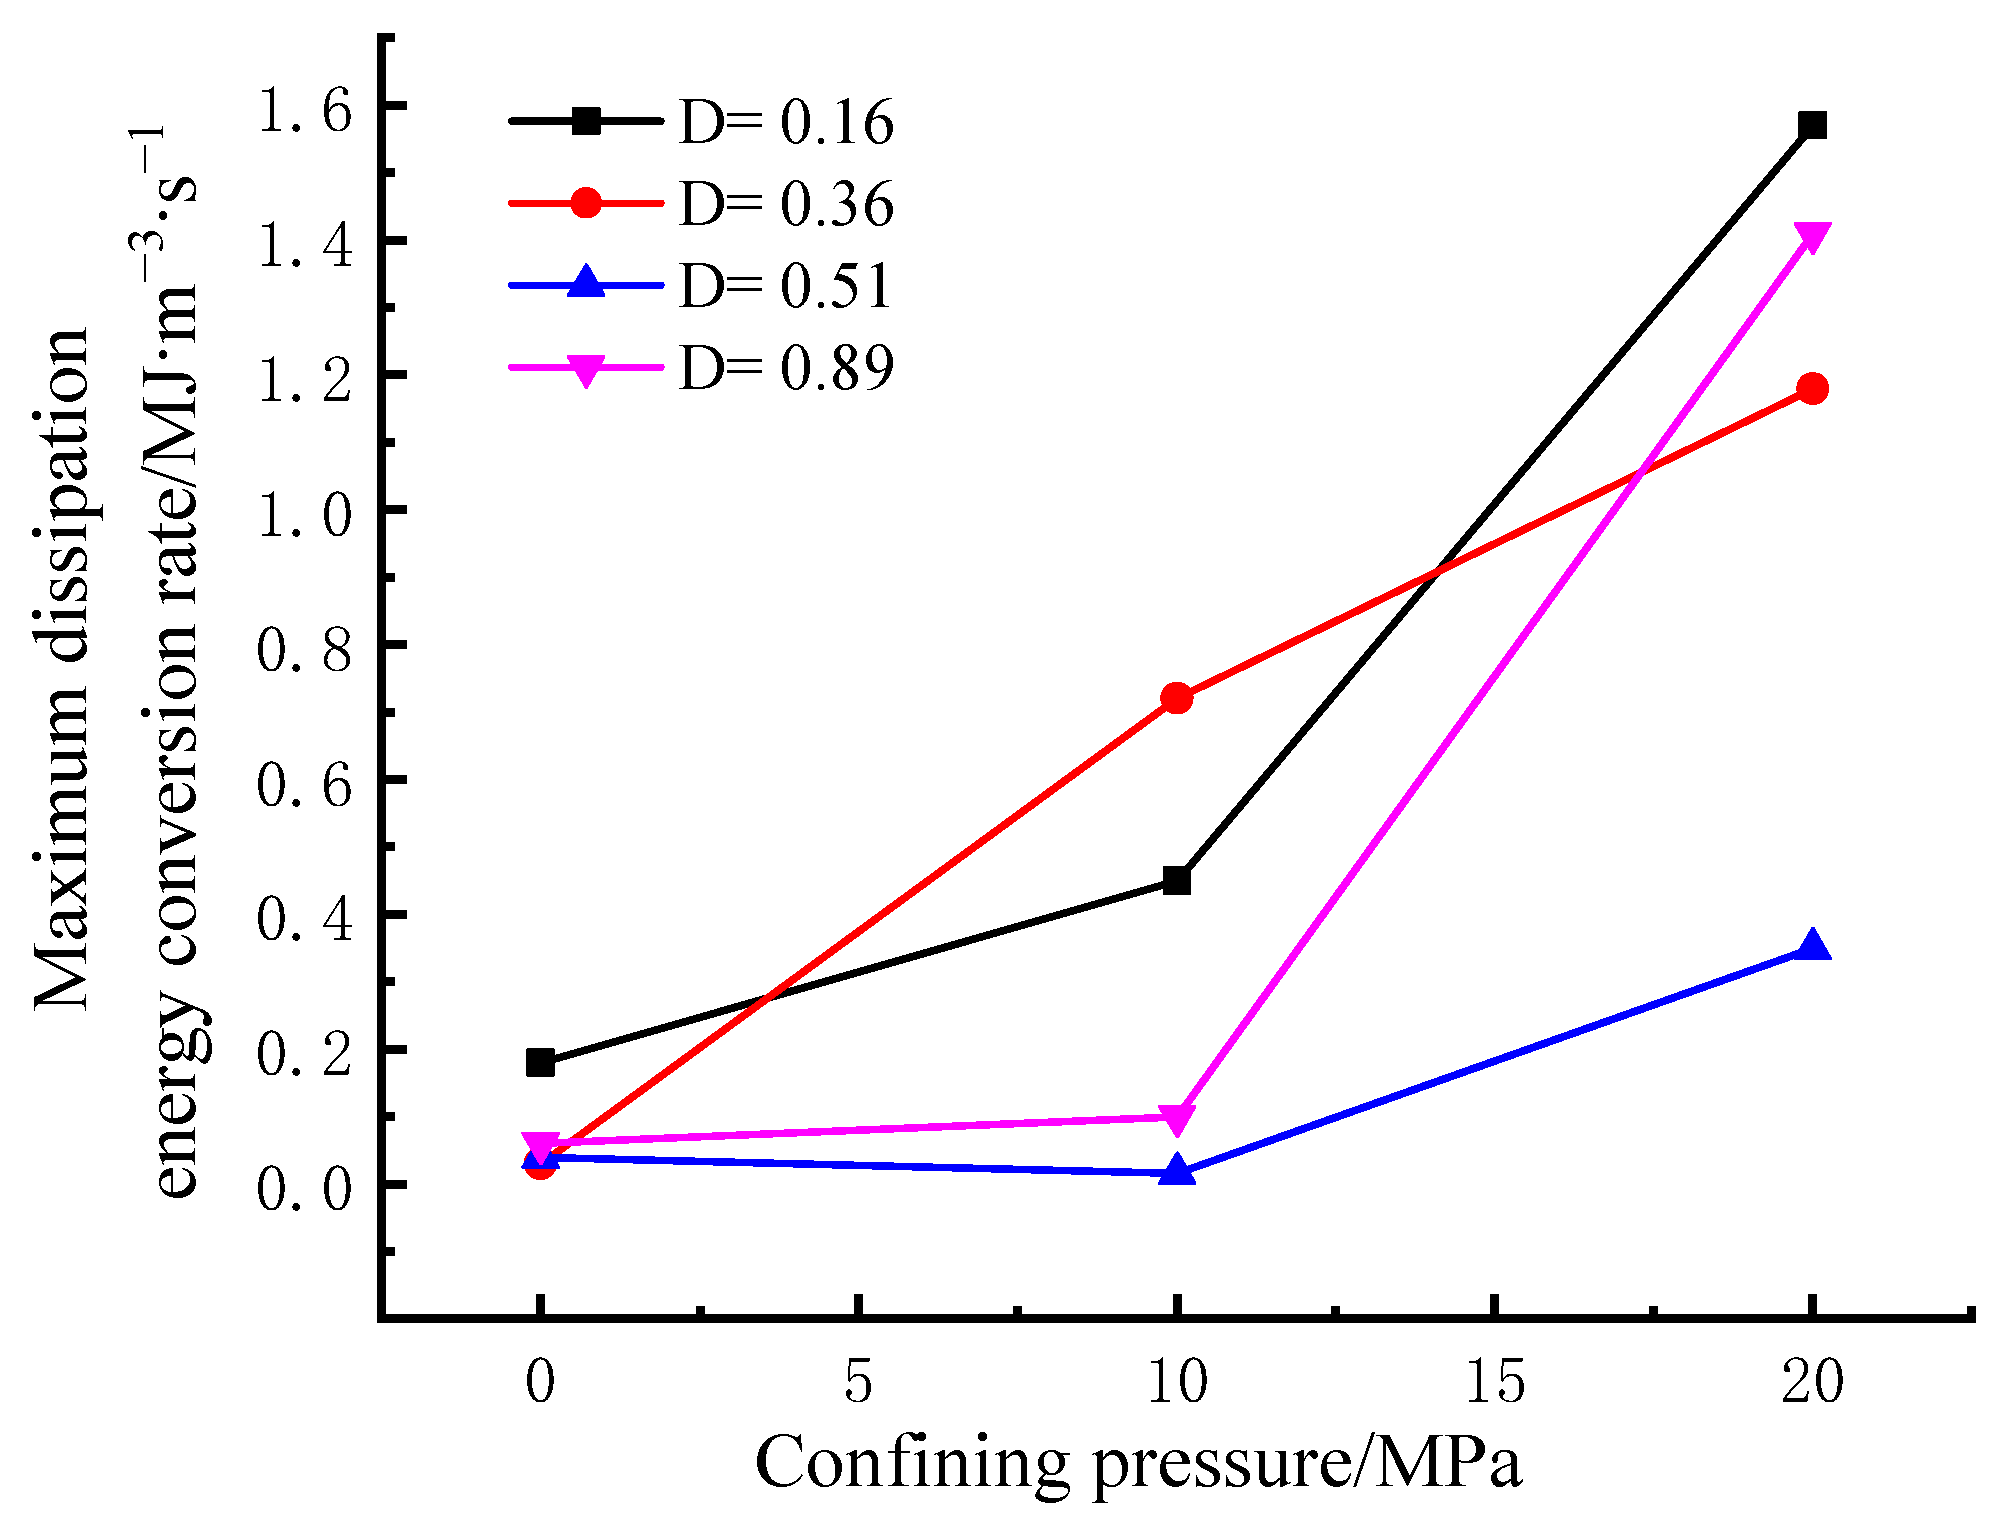
In the study of fractured rocks, the current research is more inclined to simplify fractures into one, two, or more visible artificial fractures [26,27,28,37,38,39], and then analyze the influence of the number of artificial fractures on rock mass deformation and failure, which can reflect the influence of fractures to a certain extent on the macro level. However, this simplified process completely ignores the influence of the interaction between disordered fractures on the evolution of rock deformation energy. Therefore, this paper adopts thermal damage to create this disordered fracture, and replaces the traditional fracture number with the crack degree. The results show that there is an inflection point of maximum dissipated energy change at the fissure degree D = (0.4~0.5). Before the inflection point, the maximum dissipated energy gradually increases, but the variation amplitude is small. This is because the consumption of plastic deformation energy at the crack tip increases during the deformation process, and the fracture development can reduce the brittleness of the sample and make the fracture in the rock more fully developed. After the inflection point, the maximum dissipated energy decreases rapidly, which is due to the development of fractures in the rock mass, which reduces the bearing capacity of the internal structure damage. Figure 12 shows the schematic diagram of the internal fracture degree of rock mass with surrounding rock deformation. Therefore, in engineering support, when the internal fracture degree of rock mass D = (0.4~0.5), the support can be used as the basis for the identification of critical support for key parts.

5. Conclusions and Future Work

The research results are as follows:
(1)
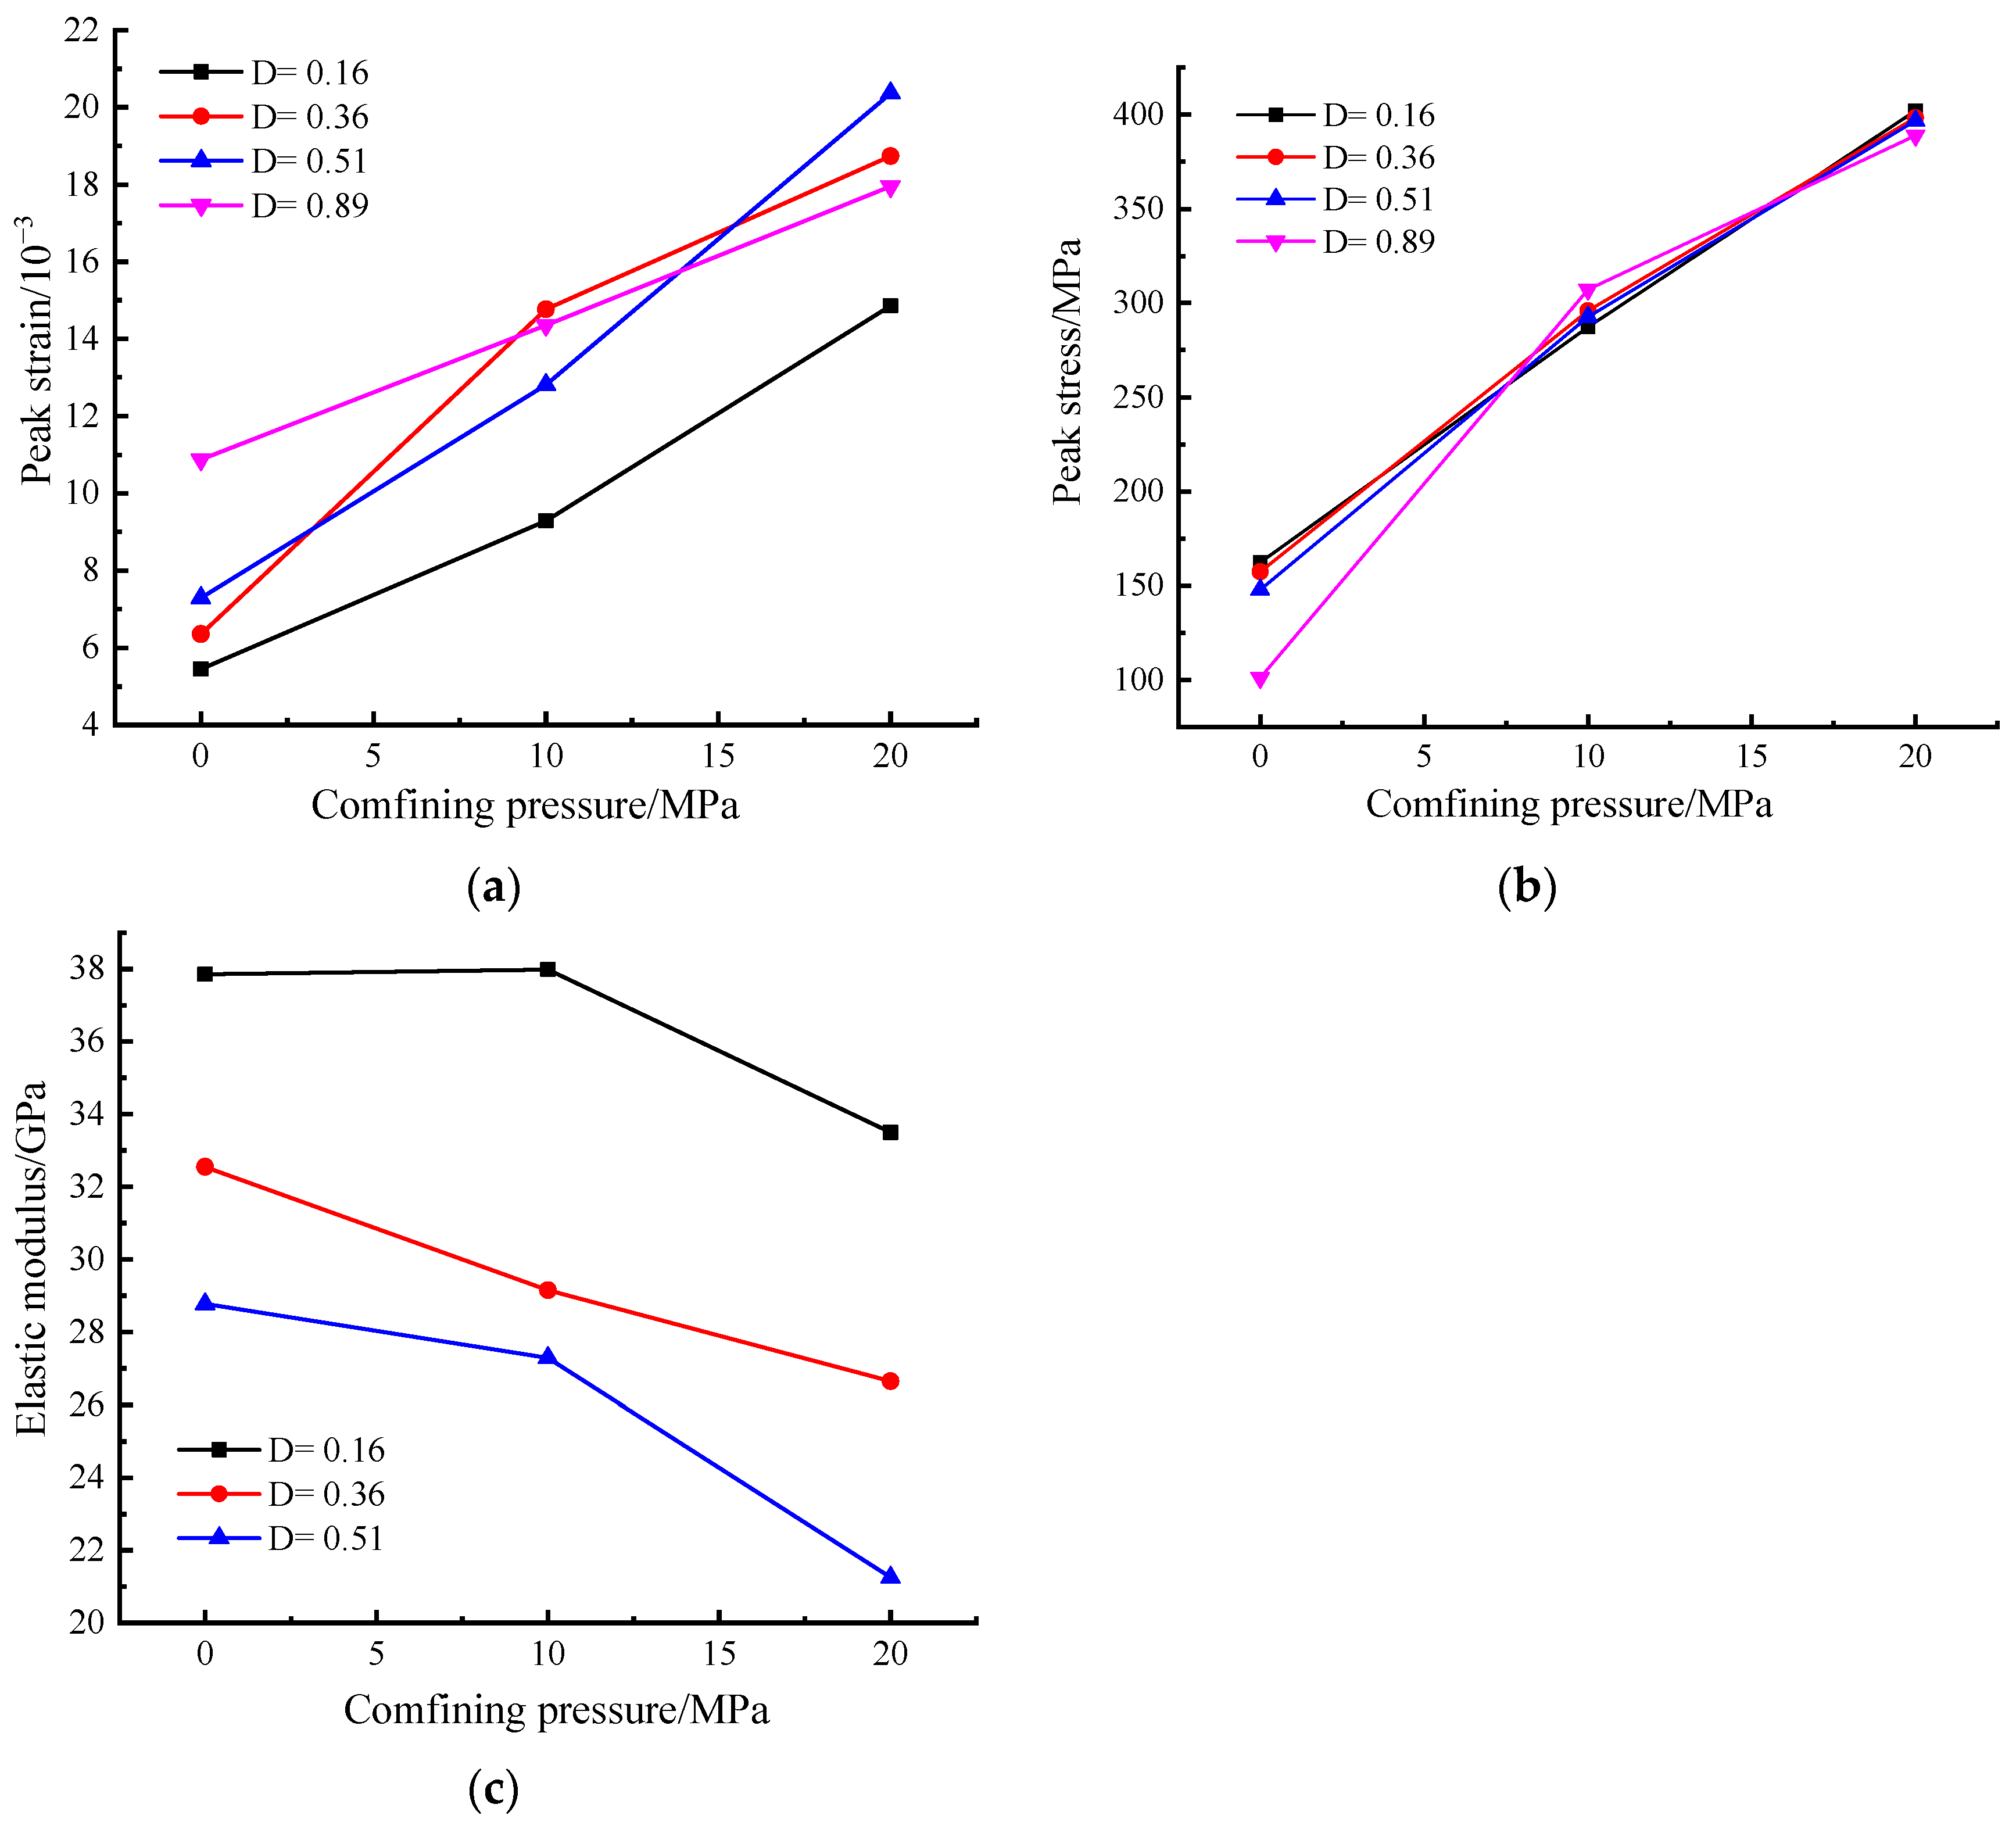
With the increase in confining pressure, the peak stress and corresponding strain of rock samples with similar equivalent damage factors increase. However, compared with the same confining pressure rock specimens of different initial thermal damage found that when the confining pressure is the same, the greater the confining pressure, the difference in peak stress of different initial thermally damaged samples becomes smaller and smaller, when the confining pressure is 0 MPa, the maximum difference of peak stress is 6 MPa, but when the confining pressure is 10 MPa and 20 MPa, the peak stress is almost identical, and the difference of corresponding peak strain does not decrease with the increase in confining pressure, and is always stable between 0.006 and 0.007. The results show that the peak stress is sensitive to confining pressure and the peak strain is sensitive to the equivalent fracture damage factor.
(2)
For rocks with similar equivalent damage factors, the greater the confining pressure, the less the influence of equivalent damage factors inside the rock mass on the failure mode. The evolution of dissipated energy ratio of specimens with different initial thermal damage is similar in the compression deformation failure process under different confining pressures, and all specimens experience four stages, rapid increase → rapid decline → steady at a certain value → rapid rise. In addition, the proportion of dissipated energy of samples with equivalent damage factor D = 0.89 is significantly higher than that of other damaged samples, indicating that the development of internal cracks in granite samples is mutational, and the internal cracks in rock develop rapidly when the thermal stress reaches the threshold value of crack propagation.
(3)
Under the same fracture degree, the maximum energy dissipation changes greatly with the increase in confining pressure. Under the same confining pressure, the maximum energy dissipated during rock failure increases slowly first and then decreases rapidly with the increase in fracture degree. Taking 20 MPa as an example, the maximum dissipated energy density remains stable at 3.5–3.6 MJ∙m-3 at D = (0.4~0.5). Before this, the dissipated energy density increases monotonically, and then slowly decreases. Therefore, there is a maximum inflection point at the fissure D = (0.4~0.5). So, when the internal fracture degree of rock mass D = (0.4~0.5), it can be used as the discriminant basis for critical support in engineering support.

Author Contributions

Conceptualization, Q.L.; Methodology, M.Z.; Validation, M.Z.; Formal analysis, M.Z.; Investigation, J.Y.; Resources, L.Q.; Data curation, Q.L. and J.Y.; Writing—original draft, M.Z.; Supervision, Q.L.; Project administration, L.Q.; Funding acquisition, L.Q. All authors have read and agreed to the published version of the manuscript.

Funding

This research was funded by the National Natural Science Foundation of China, grantnumber 52274107 and Interdisciplinary Research Project for Young Teachers of USTB (FRF-IDRY-GD21-001).

Institutional Review Board Statement

Not applicable.

Informed Consent Statement

Not applicable.

Data Availability Statement

Some or all data, models, or codes generated or used during the study are proprietary or confidential in nature and may only be provided with restrictions.

Conflicts of Interest

The authors declare no conflict of interest.

References

  1. Li, D.; Sun, Z.; Xie, T.; Li, X.; Ranjith, P.G. Energy evolution characteristics of hard rock during triaxial failure with different loading and unloading paths. Eng. Geol. 2017, 228, 270–281. [Google Scholar] [CrossRef]
  2. Liu, Z.; Zhao, G.; Meng, X.; Zhang, R.; Dong, C.; Xu, W. Energy Analysis Method for Uniaxial Compression Test of Sandstone under Static and Quasi-Dynamic Loading Rates. Adv. Mater. Sci. Eng. 2021, 2021, 9933243. [Google Scholar] [CrossRef]
  3. Meng, Q.; Zhang, M.; Han, L.; Pu, H.; Nie, T. Effects of acoustic emission and energy evolution of rock specimens under the uniaxial cyclic loading and unloading compression. Rock Mech. Rock Eng. 2016, 49, 3873–3886. [Google Scholar] [CrossRef]
  4. Yan, Z.; Dai, F.; Zhu, J. Dynamic cracking behaviors and energy evolution of multi-flawed rocks under static pre-compression. Rock Mech. Rock Eng. 2021, 54, 5117–5139. [Google Scholar] [CrossRef]
  5. Yang, Y.S.; Cheng, W.; Zhang, Z.R.; Tian, H.Y.; Li, K.Y.; Huang, C.P. Energy Evolution Law of Marble Failure Process Under Different Confining Pressures Based on Particle Discrete Element Method. Front. Mater. 2021, 8, 665955. [Google Scholar] [CrossRef]
  6. Yang, D.; Hu, J.; Wen, G.; Zeng, P. Analysis of fracture deformation field and energy evolution of granite after high confining pressure cyclic load pre-damage. R. Soc. Open Sci. 2021, 8, 201966. [Google Scholar] [CrossRef]
  7. Zhou, H.W.; Wang, Z.H.; Wang, C.S.; Liu, J.F. On acoustic emission and post-peak energy evolution in Beishan granite under cyclic loading. Rock Mech. Rock Eng. 2019, 52, 283–288. [Google Scholar] [CrossRef]
  8. Cook, N.G.W. The basic mechanics of rockbursts. J. S. Afr. Inst. Min. Metall. 1963, 64, 71–81. [Google Scholar]
  9. Walsh, J.B. Energy changes due to mining. Int. J. Rock Mech. Min. Sci. Geomech. Abstr. 1977, 14, 25–33. [Google Scholar] [CrossRef]
  10. Salamon, M.D.G. Energy considerations in rock mechanics: Fundamental results. J. S. Afr. Inst. Min. Metall. 1984, 84, 233–246. [Google Scholar]
  11. Dai, B.; Zhao, G.Y.; Konietzky, H.; Wasantha, P.L.P. Experimental investigation on damage evolution behaviour of a granitic rock under loading and unloading. J. Cent. South Univ. 2018, 25, 1213–1225. [Google Scholar] [CrossRef]
  12. Dong, X.; Karrech, A.; Basarir, H.; Elchalakani, M.; Qi, C. Analytical solution of energy redistribution in rectangular openings upon in-situ rock mass alteration. Int. J. Rock Mech. Min. Sci. 2018, 106, 74–83. [Google Scholar] [CrossRef]
  13. Luo, J.A.; Wang, L.L. Study on Energy Evolution and Damage Constitutive Model of Sandstone under Cyclic Loading and Unloading. Appl. Sci. 2023, 13, 1690. [Google Scholar] [CrossRef]
  14. Pei, F.; Ji, H.; Zhang, T.; Su, X. Acoustic Emission Characteristics and Energy Evolution of Granite Subjected to Uniaxial Compression. IOP Conf. Ser. Earth Environ. Sci. 2019, 218, 012081. [Google Scholar] [CrossRef]
  15. Qin, T.; Duan, Y.; Sun, H.; Liu, H.; Wang, L. Energy evolution and acoustic emission characteristics of sandstone specimens under unloading confining pressure. Shock Vib. 2019, 2019, 1612576. [Google Scholar] [CrossRef]
  16. Wen, T.; Tang, H.; Wang, Y. Brittleness evaluation based on the energy evolution throughout the failure process of rocks. J. Pet. Sci. Eng. 2020, 194, 107361. [Google Scholar] [CrossRef]
  17. Yang, S.; Wang, J.; Ning, J.; Qiu, P. Experimental Study on Mechanical Properties, Failure Behavior and Energy Evolution of Different Coal-Rock Combined Specimens. Appl. Sci. 2019, 9, 4427. [Google Scholar] [CrossRef]
  18. Zhang, M.; Meng, Q.; Liu, S. Energy evolution characteristics and distribution laws of rock materials under triaxial cyclic loading and unloading compression. Adv. Mater. Sci. Eng. 2017, 2017, 5471571. [Google Scholar] [CrossRef]
  19. Wong, N.Y. Crack Coalescence in Molded Gypsum and Carrara Marble. Massachusetts Institute of Technology. 2008. Available online: https://dspace.mit.edu/handle/1721.1/42927 (accessed on 7 March 2023).
  20. Bobet, A. Fracture Coalescence in rock materials: Experimental observations and numerical predictions. Massachusetts Institute of Technology. 1997. Available online: https://www.researchgate.net/publication/279823677 (accessed on 8 March 2023).
  21. Huang, D.; Wang, J.; Liu, S. A comprehensive study on the smooth joint model in DEM simulation of jointed rock masses. Granul. Matter 2015, 17, 775–791. [Google Scholar] [CrossRef]
  22. Sagong, M.; Bobet, A. Coalescence of multiple flaws in a rock-model material in uniaxial compression. Int. J. Rock Mech. Min. Sci. 2002, 39, 229–241. [Google Scholar] [CrossRef]
  23. Park, C.H.; Bobet, A. Crack initiation, propagation and coalescence from frictional flaws in uniaxial compression. Eng. Fract. Mech. 2010, 77, 2727–2748. [Google Scholar] [CrossRef]
  24. Ferro, G.; Carpinteri, A. Effect of specimen size on the dissipated energy density in compression. J. Appl. Mech. 2008, 75, 041003. [Google Scholar] [CrossRef]
  25. Zhong, P.; Li, J.; Zhou, X.; Xiao, H.; Yue, S.; Zhang, P.; Wang, Y. Study of Energy Evolution Law and Damage Characteristics during Uniaxial Cyclic Loading and Unloading of Sandstone. Appl. Sci. 2022, 12, 9985. [Google Scholar] [CrossRef]
  26. Wang, Z.Q.; Gong, X.F.; Gu, X.B. Mechanical Properties and Energy Evolution Law of Fractured Coal under Low Confining Pressure. Appl. Sci. 2022, 12, 12422. [Google Scholar] [CrossRef]
  27. Liu, X.Q.; Wang, G.; Wen, Z.; Wang, D.; Song, L.; Lin, M.; Chen, H. The Transient Unloading Response of a Deep-Buried Single Fracture Tunnel Based on the Particle Flow Method. Sustainability 2023, 15, 6840. [Google Scholar] [CrossRef]
  28. Duan, Y.W.; Zhang, G.H.; Qin, T. Analysis of Crack-Characteristic Stress and Energy Characteristics of Sandstone under Triaxial Unloading Confining Pressure. Appl. Sci. 2023, 13, 2671. [Google Scholar] [CrossRef]
  29. Meng, Q.; Zhang, M.; Zhang, Z.; Han, L.; Pu, H. Research on non-linear characteristics of rock energy evolution under uniaxial cyclic loading and unloading conditions. Environ. Earth Sci. 2019, 78, 650. [Google Scholar] [CrossRef]
  30. Pan, J.; Wu, X.; Guo, Q.; Xi, X.; Cai, M. Uniaxial experimental study of the deformation behavior and energy evolution of conjugate jointed rock based on AE and DIC methods. Adv. Civ. Eng. 2020, 2020, 8850250. [Google Scholar] [CrossRef]
  31. Ping, Q.; Zhang, C.; Su, H.; Zhang, H. Experimental study on dynamic mechanical properties and energy evolution characteristics of limestone specimens subjected to high temperature. Adv. Civ. Eng. 2020, 2020, 8875568. [Google Scholar] [CrossRef]
  32. Wang, Y.; Cui, F. Energy evolution mechanism in process of Sandstone failure and energy strength criterion. J. Appl. Geophys. 2018, 154, 21–28. [Google Scholar] [CrossRef]
  33. Zhao, H.; Song, Z.; Zhang, D.; Liu, C.; Yu, B. True triaxial experimental study on mechanical characteristics and energy evolution of sandstone under various loading and unloading rates. Geomech. Geophys. Geo-Energy Geo-Res. 2021, 7, 22. [Google Scholar] [CrossRef]
  34. Liu, W.; Zhang, S.; Sun, B. Energy evolution of rock under different stress paths and establishment of a statistical damage model. KSCE J. Civ. Eng. 2019, 23, 4274–4287. [Google Scholar] [CrossRef]
  35. Lu, J.; Yin, G.; Zhang, D.; Gao, H.; Li, C.; Li, M. True triaxial strength and failure characteristics of cubic coal and sandstone under different loading paths. Int. J. Rock Mech. Min. Sci. 2020, 135, 104439. [Google Scholar] [CrossRef]
  36. Zhang, J.; Song, Z.; Wang, S. Experimental investigation on permeability and energy evolution characteristics of deep sandstone along a three-stage loading path. Bull. Eng. Geol. Environ. 2021, 80, 1571–1584. [Google Scholar] [CrossRef]
  37. Zhang, L.; Cong, Y.; Meng, F.; Wang, Z.; Zhang, P.; Gao, S. Energy evolution analysis and failure criteria for rock under different stress paths. Acta Geotech. 2021, 16, 569–580. [Google Scholar] [CrossRef]
  38. Enfedaque, A.; Romero, H.L.; Gálvez, J.C. Fracture energy evolution of two concretes resistant to the action of freeze-thaw cycles. Mater. Constr. 2014, 64, 420–431. [Google Scholar] [CrossRef]
  39. Lin, B.; Liu, T.; Zou, Q.; Zhu, C.; Yan, F.; Zhang, Z. Crack propagation patterns and energy evolution rules of coal within slotting disturbed zone under various lateral pressure coefficients. Arab. J. Geosci. 2015, 8, 6643–6654. [Google Scholar]
  40. Matallah, M.; Farah, M.; Grondin, F.; Loukili, A.; Rozière, E. Size-independent fracture energy of concrete at very early ages by inverse analysis. Eng. Fract. Mech. 2013, 109, 1–16. [Google Scholar] [CrossRef]
  41. Wei, X.; Hou, Z.K. 3D Network Simulation of Deep Rock Joints Based on Borehole TV. J. Jilin Univ. Earth Sci. Edit. 2021, 51, 1605–1612. [Google Scholar]
Figure 1. Tubular high-temperature heating furnace and mechanical test system: (a) high temperature Muffle furnace; (b) MTS 815 press; (c) load the local magnification picture of the specimen.
Applsci 13 06498 g001
Figure 2. Relationship between granite porosity and p-wave velocity with temperature: (a) the porosity variation of samples treated at different temperatures; (b) variation of longitudinal p-wave velocity of samples.
Applsci 13 06498 g002
Figure 3. Stress–strain curves under different confining pressures: (a) D = 0.16; (b) D = 0.36; (c) D = 0.51; and (d) D = 0.89.
Applsci 13 06498 g003
Figure 4. Variation of characteristic mechanical parameters of rock with fractures under different confining pressures:(a) peak strain; (b) peak stress; and (c) modulus of elasticity.
Applsci 13 06498 g004
Figure 5. Energy evolution of the sample under 10 MPa: (a) D = 0.16; (b) D = 0.36; (c) D = 0.51; and (d) D = 0.89.
Applsci 13 06498 g005
Figure 6. Energy evolution of the sample under 20 MPa: (a) D = 0.16; (b) D = 0.36; (c) D = 0.51; and (d) D = 0.89.
Applsci 13 06498 g006aApplsci 13 06498 g006b
Figure 7. Maximum dissipation energy of samples with different initial thermal damage.
Applsci 13 06498 g007
Figure 8. Relationship between dissipation ratio and strain of samples under different confining pressures:(a) Confining pressure: 10 MPa; (b) Confining pressure: 20 MPa.
Applsci 13 06498 g008
Figure 9. Dissipation energy conversion rate of the sample under 10 MPa: (a) D = 0.16; (b) D = 0.36; (c) D = 0.51; and (d) D = 0.89.
Applsci 13 06498 g009aApplsci 13 06498 g009b
Figure 10. Dissipation energy conversion rate of the sample under 20 MPa: (a) D = 0.16; (b) D = 0.36; (c) D = 0.51; and (d) D = 0.89.
Applsci 13 06498 g010
Figure 11. The relationship between the maximum dissipation energy conversion rate of each sample and confining pressure.
Applsci 13 06498 g011
Figure 12. The schematic diagram of the internal fracture degree of rock mass with surrounding rock deformation.
Applsci 13 06498 g012
Table 1. Failure modes of fractured rock under different confining pressures.
Confining Pressure/MPaEquivalent Damage Factor (D)
D = 0.16D = 0.36D = 0.51D = 0.89
0 MPaApplsci 13 06498 i001Applsci 13 06498 i002Applsci 13 06498 i003Applsci 13 06498 i004
10 MPaApplsci 13 06498 i005Applsci 13 06498 i006Applsci 13 06498 i007Applsci 13 06498 i008
20 MPaApplsci 13 06498 i009Applsci 13 06498 i010Applsci 13 06498 i011Applsci 13 06498 i012
Disclaimer/Publisher’s Note: The statements, opinions and data contained in all publications are solely those of the individual author(s) and contributor(s) and not of MDPI and/or the editor(s). MDPI and/or the editor(s) disclaim responsibility for any injury to people or property resulting from any ideas, methods, instructions or products referred to in the content.

