Abstract
With the increasing demands for railway transportation, railway networks have expanded, leading to higher operating frequencies and speeds. However, this has also, in turn, increased the technical complexity of railway transportation systems. Derailment accidents, which occur frequently and have complex outcomes, are primary concerns in such systems. Particularly, derailments cause significant damage to adjacent areas, increasing their severity compared to other railway accidents. However, a majority of research on derailment accidents has focused on preventing or simulating specific situations, whereas the analysis of post-derailment train behaviour still requires improvements. This study aimed to predict post-derailment train behaviour using finite element analysis simulations of simplified train and track models using Korea as a case study; the key factors considered were the operating speed, derailment angle, and ground friction coefficient. Various accident cases in Korea were reviewed and compared with simulated results to verify the proposed model.
1. Introduction
Railways have long been recognised as highly efficient means of long-distance mass transport. Correspondingly, with the increasing demand for environmentally friendly transportation methods and technological advancements, railway networks have become faster, more complex, and now employ more sophisticated technologies. However, despite various operational management and technical developments, railway accident prevention has become increasingly difficult. Derailment accidents often result in extensive vehicular damage and multiple human casualties. Particularly, the post-derailment behaviour of trains can damage adjacent areas and potentially lead to large-scale disasters. In some cases shown in Table 1 and Figure 1, these disasters have occurred owing to the expansion of damage to surrounding areas, resulting in damaged vehicles and human casualties [1,2,3,4].

Table 1.
Derailment accidents.
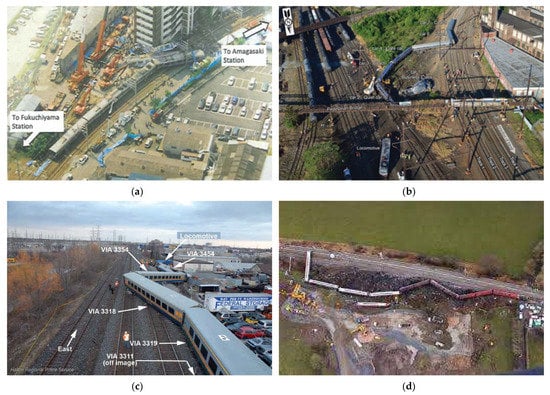
Figure 1.
Derailment accidents. (a) Amagasaki derailment [1]; (b) Philadelphia derailment [2]; (c) Burlington derailment [3]; (d) Grayigg derailment [4].
Typically, train derailments can be studied through 2D simulations using a rigid-body model or 3D simulations using finite element analysis (FEA). Of these, the 2D simulations use a lumped mass matrix based on connector coordinates that vary over time to understand the behaviour of a train after derailment. In addition, software that graphically visualises and predicts the spread of accidents in a specific area based on such simulations has been developed [5,6,7,8].
Moreover, 3D FEA simulations have been conducted for specific objectives, such as for verifying the operation stability between a track and vehicle, designing walls, and conducting detailed simulations of specific accident scenarios. However, because these simulations are performed for particular objectives, they cover a limited range of train behaviours following derailment in various situations [9,10,11,12,13,14]. Moreover, using full-scale simulations increases analysis times.
An alternative to simulation studies is field experiments. However, reproducing high-speed situations is uneconomical and challenging owing to the relatively large size of railway systems compared to that of other systems. Therefore, small-scale laboratory experiments are being conducted to investigate derailment behaviour using reduced-scale experiments for vehicles under low-speed conditions [15,16,17,18].
This study aims to develop a 3D FEA model to bridge the gap between existing 2D simulations using a rigid-body model, 3D simulations using FEA, and experiments, enabling assessments of the damage caused by train behaviour after derailment. Such an approach can ensure the safety of railway systems by providing accurate and reliable results.
2. Finite Element Model
2.1. Simulation Model Scope
The main focus of the proposed model lies on evaluating the behavioural phenomena occurring after train derailments; these include post-derailment collisions between vehicles, deceleration from interactions between the vehicle and ground, and relative velocity differences between vehicles. Notably, our model does not explicitly consider the correlation between wheels and facilities or the destruction and overturning of vehicles. However, these factors are evaluated through data postprocessing.
The target vehicle model for this study is based on the EMU-320 train, which is currently being introduced in Korea. The ground model was simplified using friction coefficients and slip rates for a typical ballast track in railway systems. Although this model does not consider intricate details regarding wheels and facilities, it provides a reliable and effective method for assessing the behaviour of vehicles after derailment.
2.2. Train Model
Recently, in Korea, EMU-260 and EMU-320 trains with distributed power propulsion have been introduced. Interestingly, these models offer acceleration and deceleration advantages owing to relatively small loads on their wheels. Although manufactured on the same platform, these trains present differences in the formation and maximum operating speeds, as indicated in Table 2. In our simulation, an FEM vehicle model was created for a double EMU-320 train, shown in Figure 2. Owing to a greater risk of outer-track deviation and secondary-yaw behaviour from the destruction of rail connections, developing an approach to consider vehicle connection conditions is necessary. A wire connector was simplified to represent the connectors used in trains. In addition, post-derailment connector damage was considered, and the yield stress for tension and compression was set, as indicated in Table 2.
Table 2.
Specifications of EMU-260 and EMU-320 [19,20].
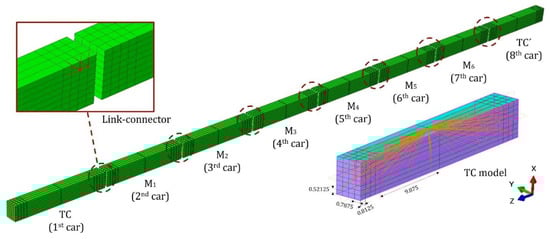
Figure 2.
FEA train model (320 elements/1 car).
The surface of the vehicle was modelled using node-element ties. This allowed us to focus on train movements after derailment and imparted the vehicle with a rigid-body-like effect without considering the damage to the vehicle. In addition, hard-contact conditions were applied to the surfaces of each vehicle to demonstrate vehicle-to-vehicle collisions. A local coordinate system was established for the bogie position of each vehicle to accurately apply braking forces in opposite directions during yaw behaviour.
2.3. Track and Ballast Model
In this simulation, the ground model was constructed using rigid shell elements to prevent deformation, as shown in Figure 3, and the characteristics of the track and ballast were applied as slip rate–friction functions.
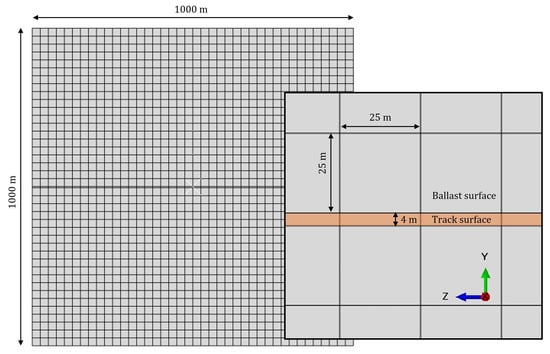
Figure 3.
Track and ballast surface finite element analyses (FEA) model.
Generally, in surface-to-surface friction, the frictional force depends on the perpendicular force applied to the contact surface and roughness, and it acts opposite to the object’s motion along the contact surface.
- : Friction force
- : Coefficient of friction
- : Mass
- : Acceleration due to gravity
- : Vertical normal force
In our analysis, the friction coefficient of the track surface was set to 0.6 in Table 3, considering Korea’s annual average temperature of 12.9 °C in 2022 [21].
Table 3.
Friction coefficients measured using a salient system tribometer [22].
Typically, the post-derailment braking behaviour of railways is affected by various factors such as the dissipation of kinetic energy when the wheels enter the ballast layer and become buried, structural friction considering elements such as sleepers and rails, residual wheel slippage until complete application of the braking force, and adhesion of the wheels to the ballast surface during complete deceleration when the ballast surface undergoes wear. Therefore, the Coulomb friction model, used under surface-to-surface contact conditions, is inappropriate for the ballast layer. Thus, this study used the Stribeck curve to simulate the relationship between the relative velocity of the wheel and ballast surface and the friction coefficient [23,24]. The slip rate in the Stribeck curve refers to a physical quantity representing the velocity of relative motion between two contact surfaces. Thus, this study considered the relative velocity as a relevant physical quantity.
- : Relative motion vector
- : Ground motion vector (velocity)
- : Train motion vector (velocity)
In Figure 4, boundary friction refers to the state of complete stopping; the wheel–ballast mixed conflict refers to the state wherein the torque of the wheel decreases, the wheel becomes stuck in the ballast, or the gravel surface wears down and becomes adhesive. In particular, wheel–ballast dynamic friction refers to the state wherein the gravel surface does not affect the system, and the wheel slips while driving at high speeds after derailment. Therefore, was set to be the same as that of the track surface and assumed to vary from one to four. The ballast conditions were evaluated, as shown in Figure 5.
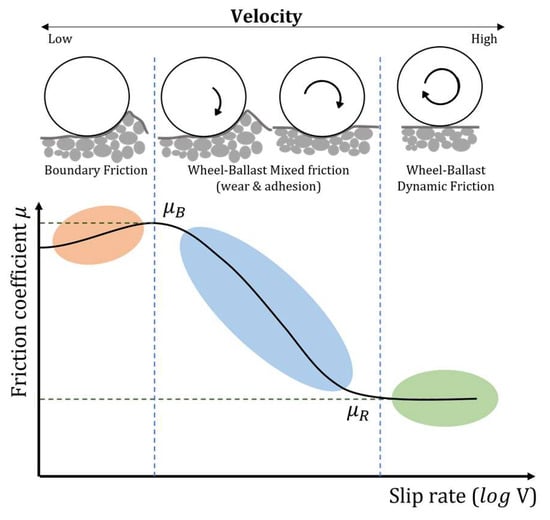
Figure 4.
Slip rate–friction coefficient curve following wheel–ballast interactions.
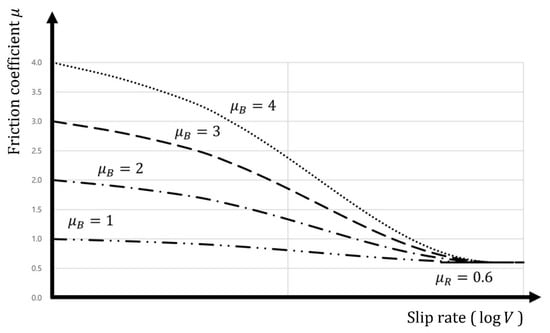
Figure 5.
Slip rate–friction coefficient curve about the wheel–ballast conditions.
3. Derailment Simulation Using the Simplified FEA Model
3.1. Derailment Simulation Method and Setting of Variable Factors
This study used the commercial FEA program Abaqus Dynamic/Explicit to conduct simulations at 0.1 s intervals for 30 s. Generally, wheel-climb derailment, wherein the front bogie of the train is derailed from the rail, is considered the most common type of derailment accident. This derailment can be reproduced based on the manner in which the moment force acts on the rear bogie.
In the simulation model, the numerical values for the vehicle and connection parts were maintained constant. The main variables analysed included the speed during derailment, angular velocity caused by the derailment, and friction coefficient of the ballast on the outer rail. Generally, the operating rate of vehicles on available routes in Korea ranges from 80 to 150 km/h. We analysed this system over a range of 20 to 40 m/s. Additionally, the response time of the braking system was considered assuming an activation time of 1 s when decelerating. Appendix A presents the simulation results.
3.2. Comparison of the Deceleration Effects under Different Friction Conditions
The speed variation along the direction of train movement was measured under constant speed conditions to investigate the deceleration effects of different ballast conditions. The angular velocity of the first car was varied from 0.05 to 0.25 rad/s. As shown in Figure 6, as the angular velocity during derailment increased, the timing at which the first car entered the ballast layer and its degree of penetration also increased, increasing deceleration. Notably, in such cases, the behaviours can vary owing to speed differences between the front and rear derailed cars. However, in cases with high angular velocities, the front car moved laterally and stopped without affecting the next car, as shown in Figure 7.
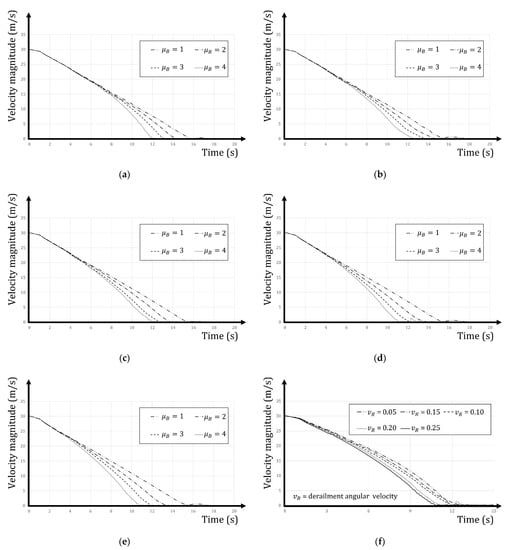
Figure 6.
Time–velocity curves of the first car: (a) 30 m/s and 0.05 rad/s; (b) 30 m/s and 0.10 rad/s; (c) 30 m/s and 0.15 rad/s; (d) 30 m/s and 0.20 rad/s; (e) 30 m/s and 0.25 rad/s. (f) Change in derailment angular velocity at 30 m/s and .
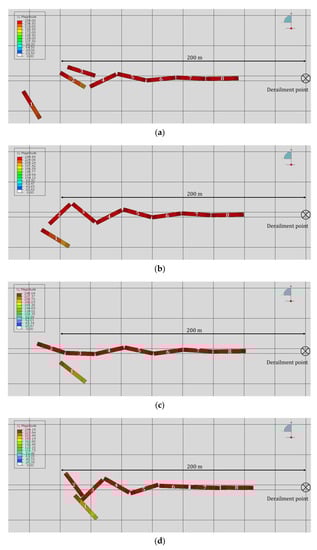
Figure 7.
Train behaviour after derailment at a constant velocity (30 m/s and 0.20 rad/s) under different friction conditions. In the images, the number on the car means the vehicle’s operation order. (a) ; (b) ; (c) ; and (d) .
Generally, the behaviour of the leading car can result in additional movements owing to the relative speed difference between the leading and following cars. This can result in excessive track destruction and damage from car collisions, which may be amplified by chain yaw movements, potentially leading to direct and indirect damage such as vehicle destruction, fatalities, delayed losses, and expanded damage to adjacent areas.
3.3. Model Validation through Comparisons with Real-World Accidents
This study compared the simulated 2D level train derailment behaviour with a real-world accident that occurred on 22 April 2016, in Republic of Korea, which is known as the “Yulchon Station Derailment”. This accident was caused by speeding when approaching a turnout, which resulted in a wheel-climb derailment. Although only a few passengers were on board, the accident could have resulted in a significant disaster under alternative circumstances. The first locomotive overturned approximately 150 m from the derailment point, and the second train stopped approximately 200 m from this point after rotating by 180° as shown in Figure 8 [25].
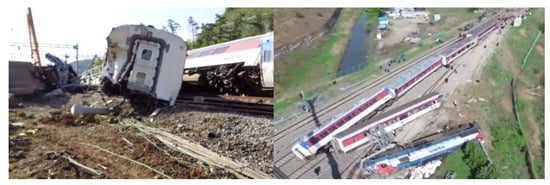
Figure 8.
Yulchon Station Derailment in Korea [25].
The simulation was compared with the Yulchon Station Derailment accident to verify the total displacement and horizontal course of the first vehicle after derailment. Additionally, the possibility of vehicle overturning was confirmed by calculating the gravitational force at the centre of gravity of the train and the resultant force due to lateral acceleration [26,27]. As shown in Figure 9, when a vehicle is travelling along a curved track or following a derailment event, gravitational acceleration continues to act in the direction of the ground at the centre of gravity of the vehicle, and a centrifugal or lateral force is generated. The load on the wheel is reduced depending on the location of the resultant force, causing tilting. Railway tracks generally use cants and slacks, while railway vehicles use dampers or tilting devices to prevent this phenomenon. However, this study simply assumes that derailment and rollover occur when the point of action of the vertical and lateral forces acting on the vehicle’s centre of gravity deviates from the end points of the wheels. Therefore, the aforementioned characteristics were excluded, and the simulation was compared to a real-world accident. The rollover limit lateral velocity could be calculated using the height of the vehicle’s centre of gravity, the distance between the wheel tips, and gravitational acceleration.
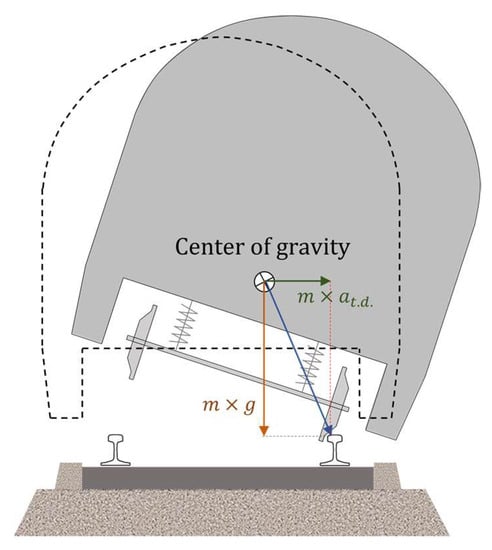
Figure 9.
Front view of rollover or derailment due to the resultant force of the lateral and gravity forces acting on a railway vehicle.
Based on investigation reports, the analysis was carried out assuming a fixed speed of 117 km/h (32.5 m/s) at the time of derailment while considering the angular velocity and frictional state of the derailment [25]. In addition, the lateral acceleration limit for determining vehicle rollover was assumed to be 1.7 m, which is the centre of gravity height of KTX vehicles currently used in Korea [27], and the spacing of the wheel tips was set to 1.4 m. Gravitational acceleration was assumed to be 9.8 m/s2, which is approximately 4 m/s2. The simulation behaviour was analysed at an angular velocity of 0.20 rad/s and friction rate of two.
As shown in Figure 10 and Figure 11 and Table 4, unlike the actual accident, the simulation showed that the second vehicle derailed, yawed, and collided with the third vehicle. In addition, it was confirmed that the displacements in the driving direction of the following cars from vehicle number four were more significant than the actual accident. This is because, due to the nature of this simplified model, structural friction and detailed characteristics, such as structural friction between vehicle wheels, rails, and components, and energy dissipation due to vehicle and connection failure, are not reflected in the actual railroad track environment [15,16,17,18]. Furthermore, although the total displacement after the derailment of the first vehicle differed from that in the real accident, an analysis of lateral acceleration indicated that the possible moment of overturn occurred at 4.8 s in Figure 12, and the displacement of the first vehicle at that time was 136.78 m. This difference can be attributed to the characteristics of the model, which do not consider the sudden deceleration and behaviour due to overturning.
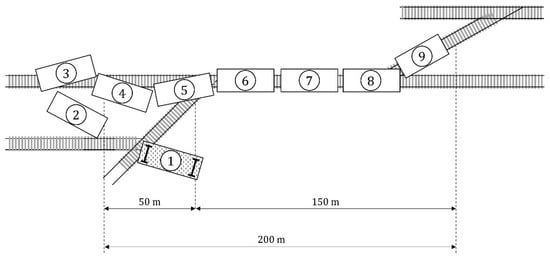
Figure 10.
Behaviour after derailment: real-world scenario. In the images, the number on the car means the vehicle’s operation order.
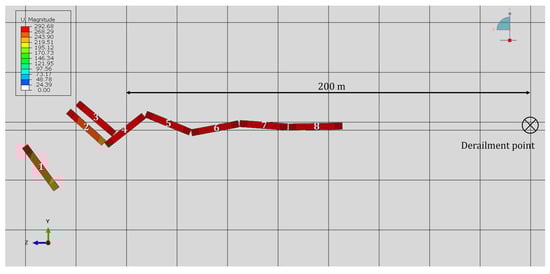
Figure 11.
Behaviour after derailment: simulation results. In the images, the number on the car means the vehicle’s operation order. (Angular velocity = 0.2 rad/s, = 2).
Table 4.
Comparison between the real-world accident and simulation.
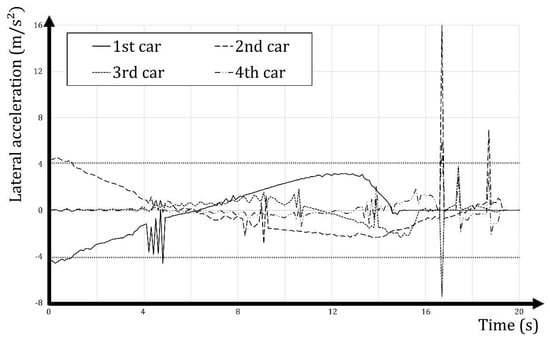
Figure 12.
Time–lateral acceleration results of the simulation.
4. Conclusions
In this study, a simulation using FEA was performed to investigate the behaviour of trains after derailment, which often results in significant property damage and casualties. The train, rail, and ground conditions were simplified for this analysis. The EMU-320 and EMU-260 trains, which are currently in operation or scheduled for introduction in Korea, were modelled using a train FEA model. The ground was modelled by applying a friction function to a rigid shell. The slip rate–friction coefficient curve was set using the Stribeck-curve method to analyse and account for the wheel–ballast interaction. The simulation results were compared with actual accident cases to assess the suitability of the model, and the lateral acceleration obtained from the analysis results was used to estimate the train rollover.
The analysis results revealed that the braking effect of the vehicle varied depending on the difference in friction conditions. Moreover, the timing and degree of the ballast surface entering the front vehicle affected the subsequent passenger cars differently. Moreover, it was possible to conservatively model real-world conditions, albeit with certain differences. However, this study simulated only the planar motion of a train, making it challenging to directly confirm instances of rollover. Additionally, because a simplified track ballast surface model was used, some parts did not consider the system friction behaviour caused by rails, sleepers, and other structures.
Future research will continue to supplement the input of wheel–ballast interactions and structural friction information to study the expected damage owing to the behaviour of trains after derailment. The results of this study can help estimate the direct and indirect damage caused by post-derailment behaviour in Korea’s current railway system.
Author Contributions
Conceptualisation, J.L. and J.K.; methodology, J.L.; software, J.L.; formal analysis, J.L.; resources, J.L.; data curation, J.L.; writing—review and editing, J.L.; project administration, J.L and J.K.; All authors have read and agreed to the published version of the manuscript.
Funding
This research was supported by the Ministry of Land, Infrastructure, and Transport (grant number RS-2021-KA163289) of the Korean Government.
Conflicts of Interest
The authors declare no conflict of interest.
Appendix A
Table A1.
Simulation results: 20 m/s.
Table A1.
Simulation results: 20 m/s.
| Velocity | Max. Total Disp. (m) | Max. Lateral Disp. (m) | No. of Yawing Cars (over 45°) | Unusual Behaviour (e.g., Collision) | ||
|---|---|---|---|---|---|---|
| m/s | rad/s | |||||
| 20 | 0.05 | 1 | 161.1 | 9.6 | 0 | - |
| 2 | 114.4 | 11.1 | 0 | - | ||
| 3 | 113.3 | 11.2 | 0 | - | ||
| 4 | 110.5 | 11.4 | 0 | - | ||
| 0.1 | 1 | 116.8 | 16.3 | 0 | - | |
| 2 | 114.4 | 17.4 | 1 | - | ||
| 3 | 113.0 | 16.9 | 1 | - | ||
| 4 | 110.5 | 16.6 | 1 | - | ||
| 0.15 | 1 | 116.7 | 21.7 | 1 | - | |
| 2 | 114.7 | 22.5 | 1 | - | ||
| 3 | 113.0 | 21.8 | 1 | - | ||
| 4 | 110.7 | 20.7 | 1 | - | ||
| 0.2 | 1 | 116.6 | 26.8 | 1 | - | |
| 2 | 115.2 | 26.2 | 1 | - | ||
| 3 | 113.6 | 25.1 | 1 | First vehicle moved laterally and stopped without affecting the next car | ||
| 4 | 111.4 | 24.0 | 1 | First vehicle moved laterally and stopped after affecting the next car | ||
| 0.25 | 1 | 118.7 | 31.6 | 1 | - | |
| 2 | 115.2 | 29.7 | 1 | First vehicle moved laterally and stopped without affecting the next car | ||
| 3 | 114.2 | 27.5 | 1 | First vehicle moved laterally and stopped without affecting the next car | ||
| 4 | 112.2 | 26.4 | 1 | First vehicle moved laterally and stopped after affecting the next car | ||
Table A2.
Simulation results: 25 m/s.
Table A2.
Simulation results: 25 m/s.
| Velocity | Max. Total Disp. (m) | Max. Lateral Disp. (m) | No. of Yawing Cars (over 45°) | Unusual Behaviour (e.g., Collision) | ||
|---|---|---|---|---|---|---|
| m/s | rad/s | |||||
| 25 | 0.05 | 1 | 177.3 | 12.6 | 0 | - |
| 2 | 175.0 | 14.0 | 1 | - | ||
| 3 | 173.1 | 14.1 | 1 | - | ||
| 4 | 170.9 | 13.3 | 1 | - | ||
| 0.1 | 1 | 177.8 | 21.3 | 1 | - | |
| 2 | 175.2 | 22.1 | 2 | - | ||
| 3 | 172.8 | 21.2 | 2 | - | ||
| 4 | 170.2 | 20.2 | 2 | - | ||
| 0.15 | 1 | 179.2 | 27.1 | 1 | - | |
| 2 | 179.2 | 26.0 | 1 | First vehicle moved laterally and stopped without affecting the next car | ||
| 3 | 173.5 | 25.4 | 2 | First vehicle moved laterally and stopped after affecting the next car | ||
| 4 | 170.7 | 24.3 | 2 | First vehicle moved laterally and stopped without affecting the next car | ||
| 0.2 | 1 | 179.9 | 32.6 | 2 | Second vehicle crashed into the third after yawing | |
| 2 | 176.3 | 30.0 | 1 | First vehicle moved laterally and stopped without affecting the next car | ||
| 3 | 174.0 | 28.4 | 1 | First vehicle moved laterally and stopped without affecting the next car | ||
| 4 | 171.5 | 26.9 | 1 | First vehicle moved laterally and stopped after affecting the next car | ||
| 0.25 | 1 | 185.6 | 35.8 | 2 | ||
| 2 | 176.2 | 33.5 | 1 | First vehicle moved laterally and stopped after affecting the next car | ||
| 3 | 175.0 | 30.9 | 1 | First vehicle moved laterally and stopped without affecting the next car | ||
| 4 | 173.1 | 29.1 | 1 | First vehicle moved laterally and stopped without affecting the next car | ||
Table A3.
Simulation results: 30 m/s.
Table A3.
Simulation results: 30 m/s.
| Velocity | Max. Total Disp. (m) | Max. Lateral Disp. (m) | No. of Yawing Cars (over 45°) | Unusual Behaviour (e.g., Collision) | ||
|---|---|---|---|---|---|---|
| m/s | rad/s | |||||
| 30 | 0.05 | 1 | 250.6 | 15.3 | 0 | - |
| 2 | 248.5 | 18 | 0 | - | ||
| 3 | 245.6 | 17.9 | 2 | - | ||
| 4 | 243.5 | 16.4 | 3 | - | ||
| 0.1 | 1 | 251.3 | 21.2 | 0 | - | |
| 2 | 251.7 | 24.2 | 1 | - | ||
| 3 | 246.5 | 24.2 | 3 | - | ||
| 4 | 242.7 | 23.1 | 3 | - | ||
| 0.15 | 1 | 254.1 | 31 | 1 | Second vehicle crashed into the third after yawing | |
| 2 | 248.9 | 30.6 | 1 | - | ||
| 3 | 246.7 | 27.4 | 3 | - | ||
| 4 | 243.3 | 26.6 | 3 | - | ||
| 0.2 | 1 | 258 | 36 | 2 | Second vehicle crashed into the third after yawing | |
| 2 | 249.9 | 29.1 | 1 | - | ||
| 3 | 248 | 28.2 | 1 | First vehicle separated from the set before affecting the rest | ||
| 4 | 244.2 | 29.6 | 3 | - | ||
| 0.25 | 1 | 261.3 | 37.8 | 2 | Second vehicle crashed into the third after yawing | |
| 2 | 251.2 | 35.5 | 2 | Second vehicle crashed into the third after yawing | ||
| 3 | 247.1 | 34.2 | 3 | - | ||
| 4 | 247.2 | 31.7 | 1 | First vehicle separated from the set before affecting the rest | ||
Table A4.
Simulation results: 35 m/s.
Table A4.
Simulation results: 35 m/s.
| Velocity | Max. Total Disp. (m) | Max. Lateral Disp. (m) | No. of Yawing Cars (over 45°) | Unusual Behaviour (e.g., Collision) | ||
|---|---|---|---|---|---|---|
| m/s | rad/s | |||||
| 35 | 0.05 | 1 | 338.4 | 16.7 | 0 | - |
| 2 | 335.4 | 16.2 | 2 | First and second vehicles yawed without crushing the following cars | ||
| 3 | 332.3 | 19.9 | 3 | First and second vehicles yawed without crushing the following cars | ||
| 4 | 328.6 | 20.6 | 4 | First and second vehicles yawed without crushing the following cars | ||
| 0.1 | 1 | 339.6 | 21.2 | 1 | Second vehicle was yawing greater than the first owing to the stopping of the first | |
| 2 | 336.3 | 19.1 | 2 | First and second vehicles yawed without crushing the following cars | ||
| 3 | 332.2 | 19.8 | 3 | First and second vehicles yawed without crushing the following cars | ||
| 4 | 327.2 | 21.1 | 4 | First and second vehicles yawed without crushing the following cars | ||
| 0.15 | 1 | 342.8 | 24.1 | 2 | Second vehicle crashed into the third after yawing | |
| 2 | 336.4 | 30.6 | 2 | First and second vehicles yawed without crushing the following cars | ||
| 3 | 334.0 | 27.7 | 2 | First vehicle separated from the set before affecting the rest | ||
| 4 | 328.8 | 25.2 | 4 | First and second vehicles yawed without crushing the following cars | ||
| 0.2 | 1 | 348.7 | 33.0 | 3 | Second vehicle crashed into the third after yawing | |
| 2 | 337.8 | 33.1 | 3 | Second vehicle crashed into the third after yawing | ||
| 3 | 333.9 | 24.9 | 3 | First and second vehicles yawed without crushing the following cars | ||
| 4 | 333.6 | 28.9 | 1 | First vehicle separated from the set before affecting the rest | ||
| 0.25 | 1 | 347.7 | 37.2 | 3 | Second vehicle crashed into the third after yawing | |
| 2 | 339.1 | 35.1 | 3 | Second vehicle crashed into the third after yawing | ||
| 3 | 333.3 | 39.3 | 3 | Second vehicle crashed into the third after yawing | ||
| 4 | 329.8 | 31.4 | 3 | First vehicle separated from the set before affecting the rest | ||
Table A5.
Simulation results: 40 m/s.
Table A5.
Simulation results: 40 m/s.
| Velocity | Max. Total Disp. (m) | Max. Lateral Disp. (m) | No. of Yawing Cars (over 45°) | Unusual Behaviour (e.g., Collision) | ||
|---|---|---|---|---|---|---|
| m/s | rad/s | |||||
| 40 | 0.05 | 1 | 444.2 | 22.0 | 2 | Second vehicle crashed into the third after yawing |
| 2 | 435.4 | 22.0 | 3 | Second vehicle crashed into the third and fourth after yawing | ||
| 3 | 430.7 | 22.2 | 4 | Second vehicle crashed into the third after yawing | ||
| 4 | 425.8 | 20.8 | 4 | First and second vehicles yawed without crashing into the other cars | ||
| 0.1 | 1 | 441.4 | 21.9 | 2 | Second vehicle crashed into the third after yawing | |
| 2 | 435.5 | 29.5 | 3 | Second vehicle crashed into the third after yawing | ||
| 3 | 431.3 | 26.3 | 3 | Second vehicle crashed into the third and fourth after yawing | ||
| 4 | 427.8 | 25.4 | 4 | Second vehicle crashed into the third and fourth after yawing | ||
| 0.15 | 1 | 446.6 | 26.0 | 3 | Second vehicle crashed into the third and fourth after yawing | |
| 2 | 436.9 | 33.5 | 4 | Second vehicle crashed into the third and fourth after yawing | ||
| 3 | 432.4 | 31.7 | 4 | First vehicle separated from the set before affecting the rest | ||
| 4 | 428.8 | 29.8 | 4 | First vehicle crashed into the third after yawing and stopped | ||
| 0.2 | 1 | 448.0 | 38.6 | 4 | Second vehicle crashed into the third and fourth after yawing | |
| 2 | 441.4 | 37.4 | 5 | Second vehicle crashed into the third and fourth after yawing | ||
| 3 | 432.0 | 34.3 | 5 | Second vehicle crashed into the third and fourth after yawing | ||
| 4 | 426.1 | 33.7 | 5 | First vehicle separated from the set before affecting the rest | ||
| 0.25 | 1 | 449.8 | 40.7 | 5 | Second vehicle crashed into the third and fourth after yawing | |
| 2 | 442.0 | 38.3 | 5 | Second vehicle crashed into the third and fourth after yawing | ||
| 3 | 432.3 | 36.9 | 5 | Second vehicle crashed into the third and fourth after yawing | ||
| 4 | 426.2 | 36.1 | 5 | Second vehicle crashed into the third and fourth after yawing | ||
References
- Aircraft and Railway Accident Investigation Commission. Japan Railway Accident Investigation Report—RA2007-3-1; Aircraft and Railway Accident Investigation Commission: Tokyo, Japan, 2007.
- National Transportation Safety Board. Railroad Accident Report—NTSB/RAR-16/02, PB2016-103218; National Transportation Safety Board: Washington, DC, USA, 2016.
- Transportation Safety Board of Canada. Railway Investigation Report—R12T0038; Transportation Safety Board of Canada: Gatineau, QC, Canada, 2013. [Google Scholar]
- Rail Accident Investigation Branch. Rail Accident Report—Derailment at Grayrigg 23 February 2007; Rail Accident Investigation Branch, Department for Transport: Derby, UK, 2011.
- Coppens, A.J.; Wong, J.D.E.; Birk, A.M.; Transportation Development Centre (Canada); W.R. Davis Engineering Ltd.; A.M. Birk Engineering, Canada; Transport Dangerous Goods Directorate. Development of a Derailment Accident Computer Simulation Model; Transport Canada Publication; W.R. Davis: Ottawa, ON, Canada, 1988. [Google Scholar]
- Birk, A.M.; Anderson, R.J.; Coppens, A.J. A computer simulation of a derailment accident: Part I-Model basis. J. Hazard. Mater. 1990, 25, 121–147. [Google Scholar] [CrossRef]
- Birk, A.M.; Anderson, R.J.; Coppens, A.J. A computer simulation of a derailment accident Part II-Sample simulation. J. Hazard. Mater. 1990, 25, 149–165. [Google Scholar] [CrossRef]
- Paetsch, C.R.; Perlman, A.B.; Jeong, D.Y. Dynamic Simulation of Train Derailments. In Proceedings of the ASME International Mechanical Engineering Congress and Exposition, Chicago, IL, USA, 5–10 November 2006; pp. 105–114. [Google Scholar]
- Zhu, X.; Lu, X.-Z.; Cheng, Q.-L.; Li, Y. Simulation of the running attitude of a train after derailment. Int. J. Crashworthiness 2020, 25, 213–219. [Google Scholar] [CrossRef]
- Bae, H.-U.; Yun, K.-M.; Moon, J.; Lim, N.-H. Impact force evaluation of the derailment containment wall for high-speed train through a collision simulation. Adv. Civ. Eng. 2018, 2018, 2626905. [Google Scholar] [CrossRef]
- Bae, H.-U.; Yun, K.-M.; Lim, N.-H. Containment capacity and estimation of crashworthiness of derailment containment walls against high-speed Trains. Proc. Inst. Mech. Eng. Part F J. Rail Rapid Transit 2018, 232, 680–696. [Google Scholar] [CrossRef]
- Zhou, X.; Jing, L.; Ma, X. Dynamic finite element simulation of wheel–rail contact response for the straight track case. Adv. Struct. Eng. 2021, 24, 856–869. [Google Scholar] [CrossRef]
- Wu, X.; Chi, M.; Gao, H.; Ke, X.; Zeng, J.; Wu, P.; Zhu, M. Post-derailment dynamic behavior of railway vehicles travelling on a railway bridge during an earthquake. Proc. Inst. Mech. Eng. Part F J. Rail Rapid Transit 2016, 230, 418–439. [Google Scholar] [CrossRef]
- Kirkpatrick, S.W.; Lin, C.-Y.; Iannacone, L.; Gharzouzi, P.; Treichel, T.; Barkan, C.P.L.; Gardoni, P. Derailment analysis for prediction of damage and probability of release for novel railroad tank car designs. Transp. Res. Rec. J. Transp. Res. Board 2022, 03611981221137589. [Google Scholar] [CrossRef]
- Song, I.-H.; Kim, J.-W.; Koo, J.-S.; Lim, N.-H. Modeling and simulation of collision-causing derailment to design the derailment containment provision using a simplified vehicle model. Appl. Sci. 2019, 10, 118. [Google Scholar] [CrossRef]
- Song, I.-H.; Koo, J.-S.; Shim, J.-S.; Bae, H.-U.; Lim, N.-H. Theoretical prediction of impact force acting on derailment containment provisions (DCPs). Appl. Sci. 2023, 13, 3899. [Google Scholar] [CrossRef]
- Wu, X.; Chi, M.; Gao, H.; Zhang, D.; Zeng, J.; Wu, P.; Zhu, M. The study of post-derailment measures to limit the extent of a derailment. Proc. Inst. Mech. Eng. Part F J. Rail Rapid Transit 2016, 230, 64–76. [Google Scholar] [CrossRef]
- Lim, N.-H.; Kim, K.-J.; Bae, H.-U.; Kim, S. DEM analysis of track ballast for track ballast–wheel interaction simulation. Appl. Sci. 2020, 10, 2717. [Google Scholar] [CrossRef]
- Korea Railroad Train Information, High-Speed Train, ‘KTX-Eum’. Available online: https://info.korail.com/infoeng/contents.do?key=1605 (accessed on 14 April 2023).
- Korea National Railway Train Specification ‘HEMU430X’. Available online: http://www.kric.go.kr/jsp/board/portal/sub02/rcd/railDogam5Detail.jsp?p_id=A030503001&seq=77 (accessed on 14 April 2023).
- Korea Meteorological Administration Annual Average Temperature. Available online: http://www.climate.go.kr/home/05_prediction_new/predict04_01.php (accessed on 14 April 2023).
- Olofsson, U. Adhesion and Friction Modification. In Wheel–Rail Interface Handbook; Lewis, R., Olofsson, U., Eds.; Woodhead Publishing: Cambridge, UK, 2009; pp. 510–527. ISBN 978-1-84569-412-8. [Google Scholar]
- Zhu, Y. Adhesion in the Wheel-Rail Contact. Comprehensive Summary. Ph.D. Thesis, KTH Royal Institute of Technology, Stockholm, Switizerland, 2013. [Google Scholar]
- Vollebregt, E.; Six, K.; Polach, O. Challenges and progress in the understanding and modelling of the wheel–rail creep forces. Veh. Syst. Dyn. 2021, 59, 1026–1068. [Google Scholar] [CrossRef]
- Aviation and Railway Accident Investigation Board. Railway Accident Investigation Report—ARAIB/R 2018-1; Aviation and Railway Accident Investigation Board: Sejong-si, Republic of Korea, 2018.
- Ling, L.; Dhanasekar, M.; Thambiratnam, D.P.; Sun, Y.Q. Lateral impact derailment mechanisms, simulation and analysis. Int. J. Impact Eng. 2016, 94, 36–49. [Google Scholar] [CrossRef]
- Kim, J.; Song, I.; Koo, J. Prediction of theoretical derailments caused by cross-winds with frequency. Appl. Sci. 2021, 11, 2947. [Google Scholar] [CrossRef]


Disclaimer/Publisher’s Note: The statements, opinions and data contained in all publications are solely those of the individual author(s) and contributor(s) and not of MDPI and/or the editor(s). MDPI and/or the editor(s) disclaim responsibility for any injury to people or property resulting from any ideas, methods, instructions or products referred to in the content. |
© 2023 by the authors. Licensee MDPI, Basel, Switzerland. This article is an open access article distributed under the terms and conditions of the Creative Commons Attribution (CC BY) license (https://creativecommons.org/licenses/by/4.0/).