
Numerical Modelling of High-Speed Loading of Periodic Interpenetrating Heterogeneous Media with Adapted Mesostructure


Abstract
:1. Introduction
2. Mathematical Problem Statement
2.1. The Main Conservation Laws
- − The particle trajectory equation
- − The mass balance equation
- − The momentum balance equation
- − The internal energy balance equation
2.2. The Equation of State
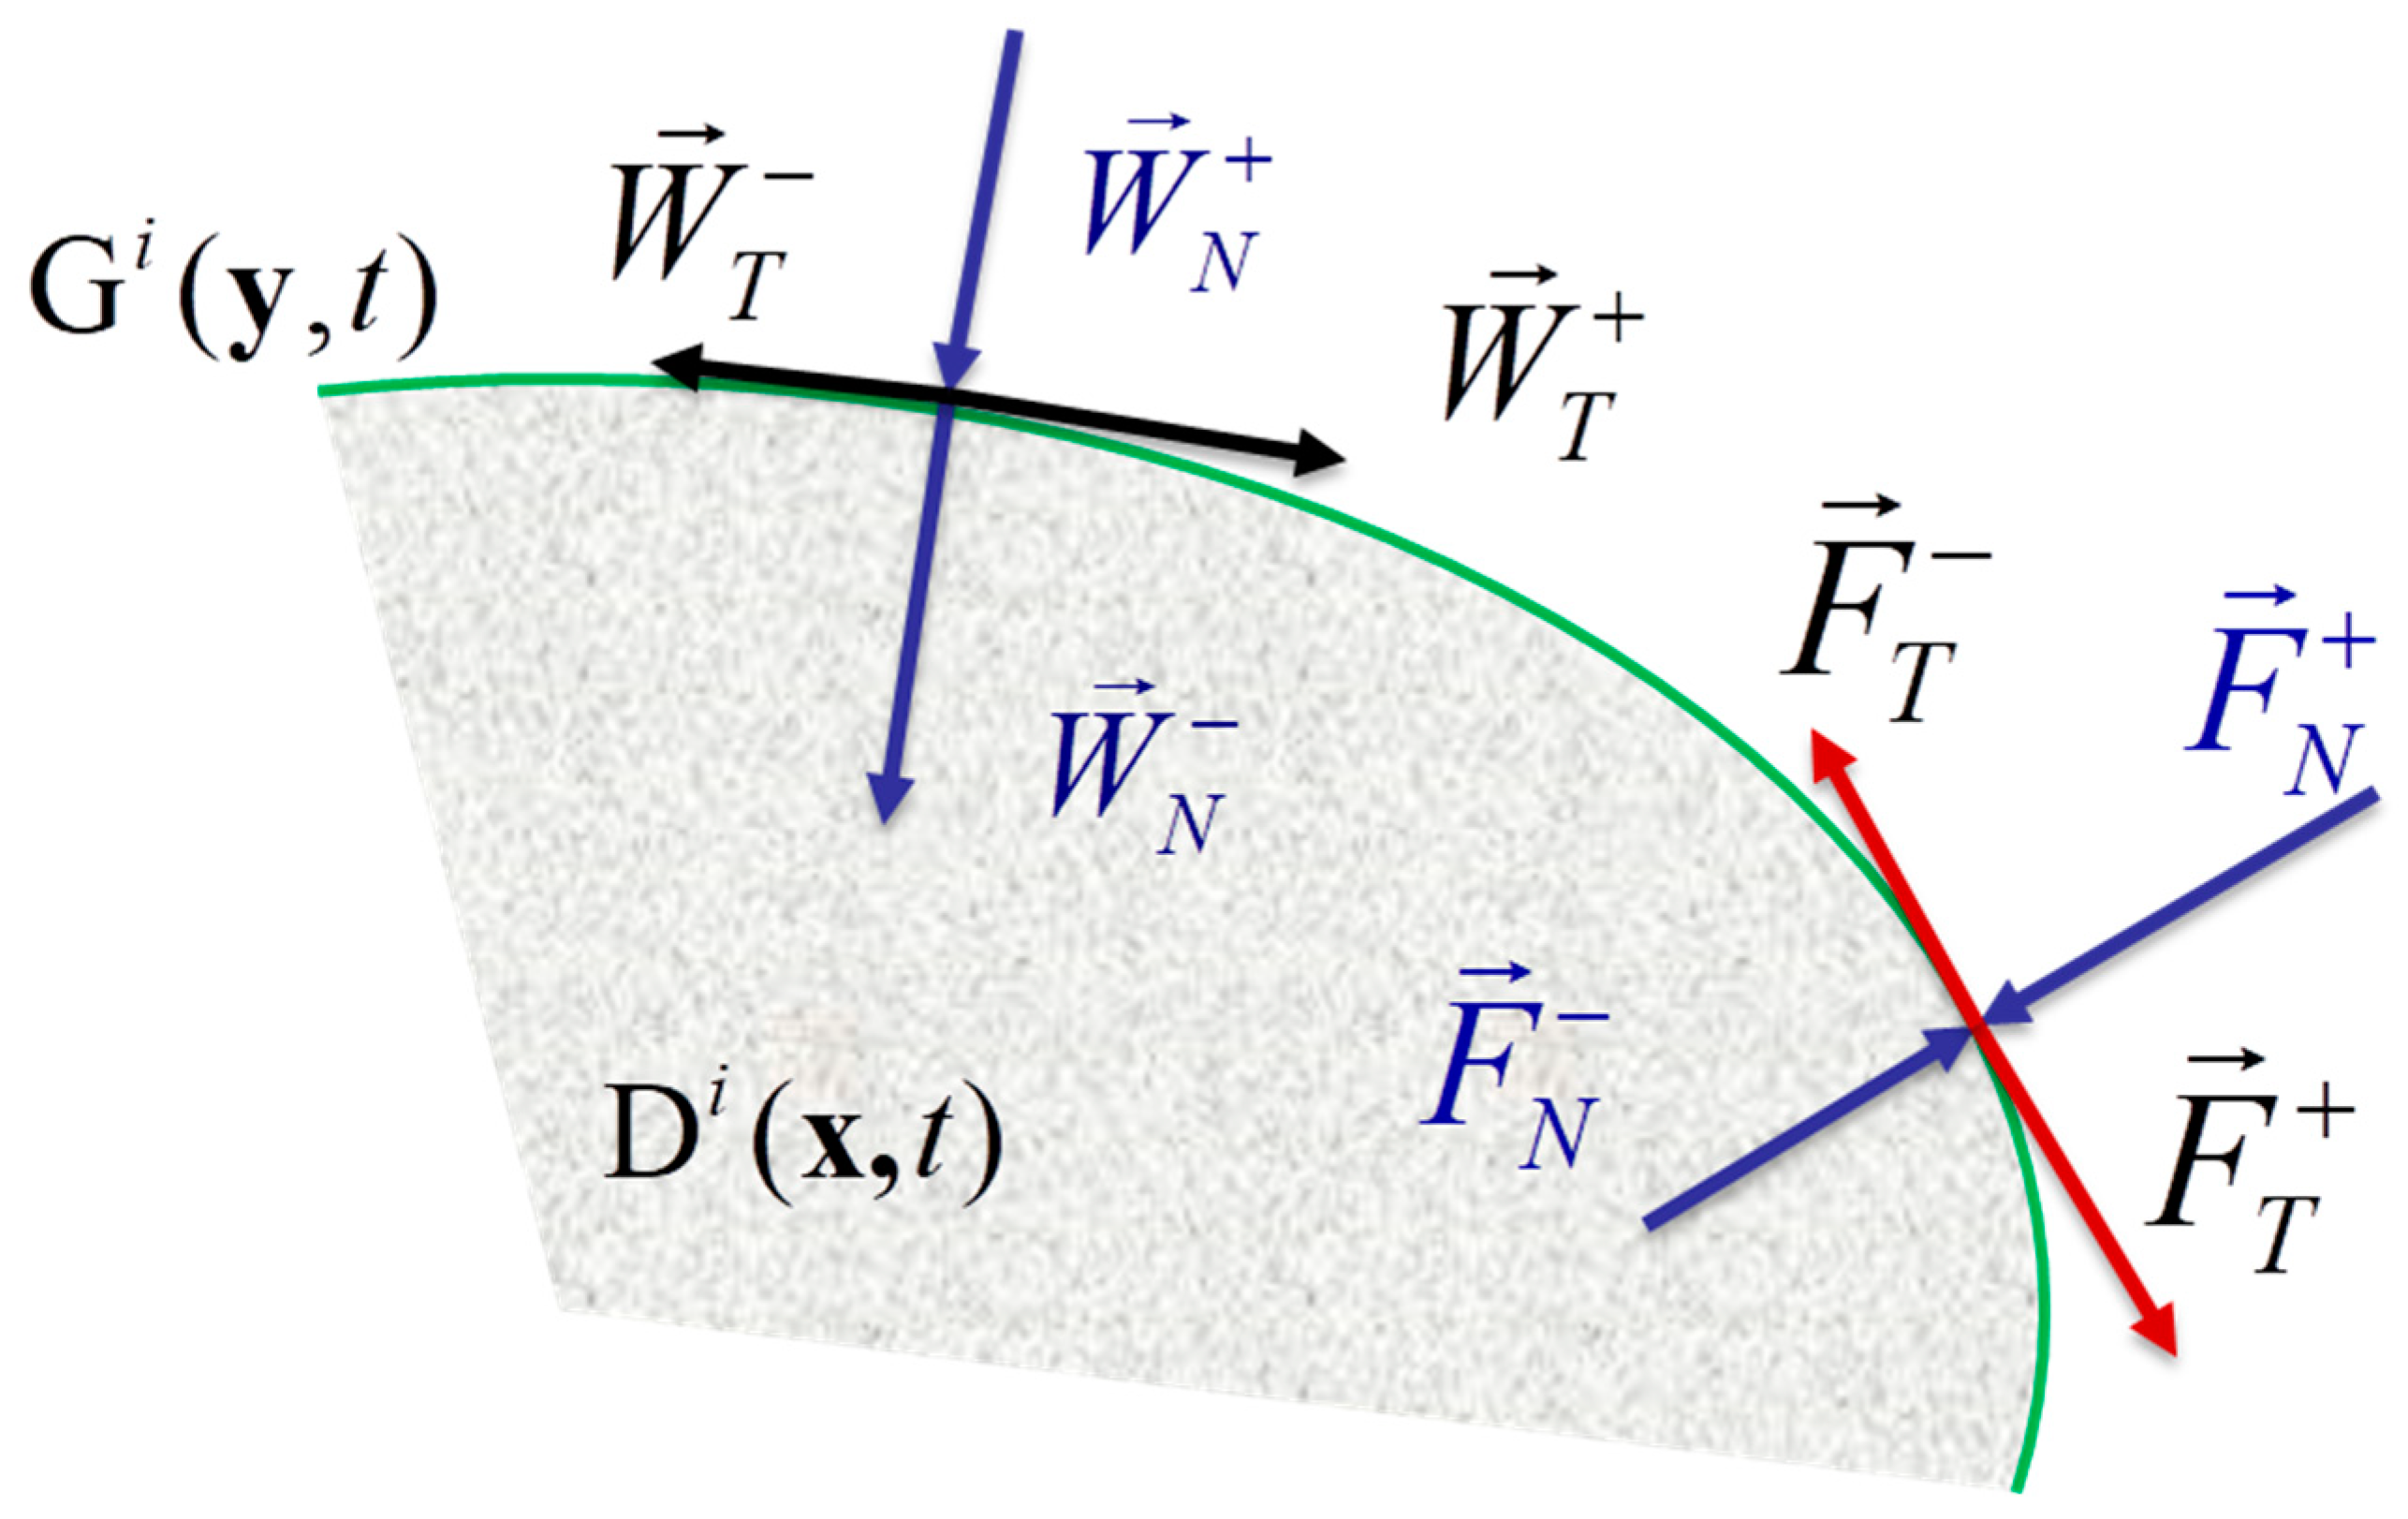
2.3. The Boundary Conditions
- the vector of the outward normal to the boundary of the domain ;
- the vector of external surface forces on the boundary ;
- the vector of velocity at the boundary. .
- kinematic
- dynamic
- mixed
- Ideal mechanical contact: The material particles belonging to the boundaries of the interacting bodies move as a single entity.
- Frictionless sliding: In this case, the conditions of non-penetration and equilibrium hold for the normal components of the reaction forces.
- Sliding with Coulomb friction: Let the friction coefficient be . The friction force is determined by the expression,
2.4. Fracture
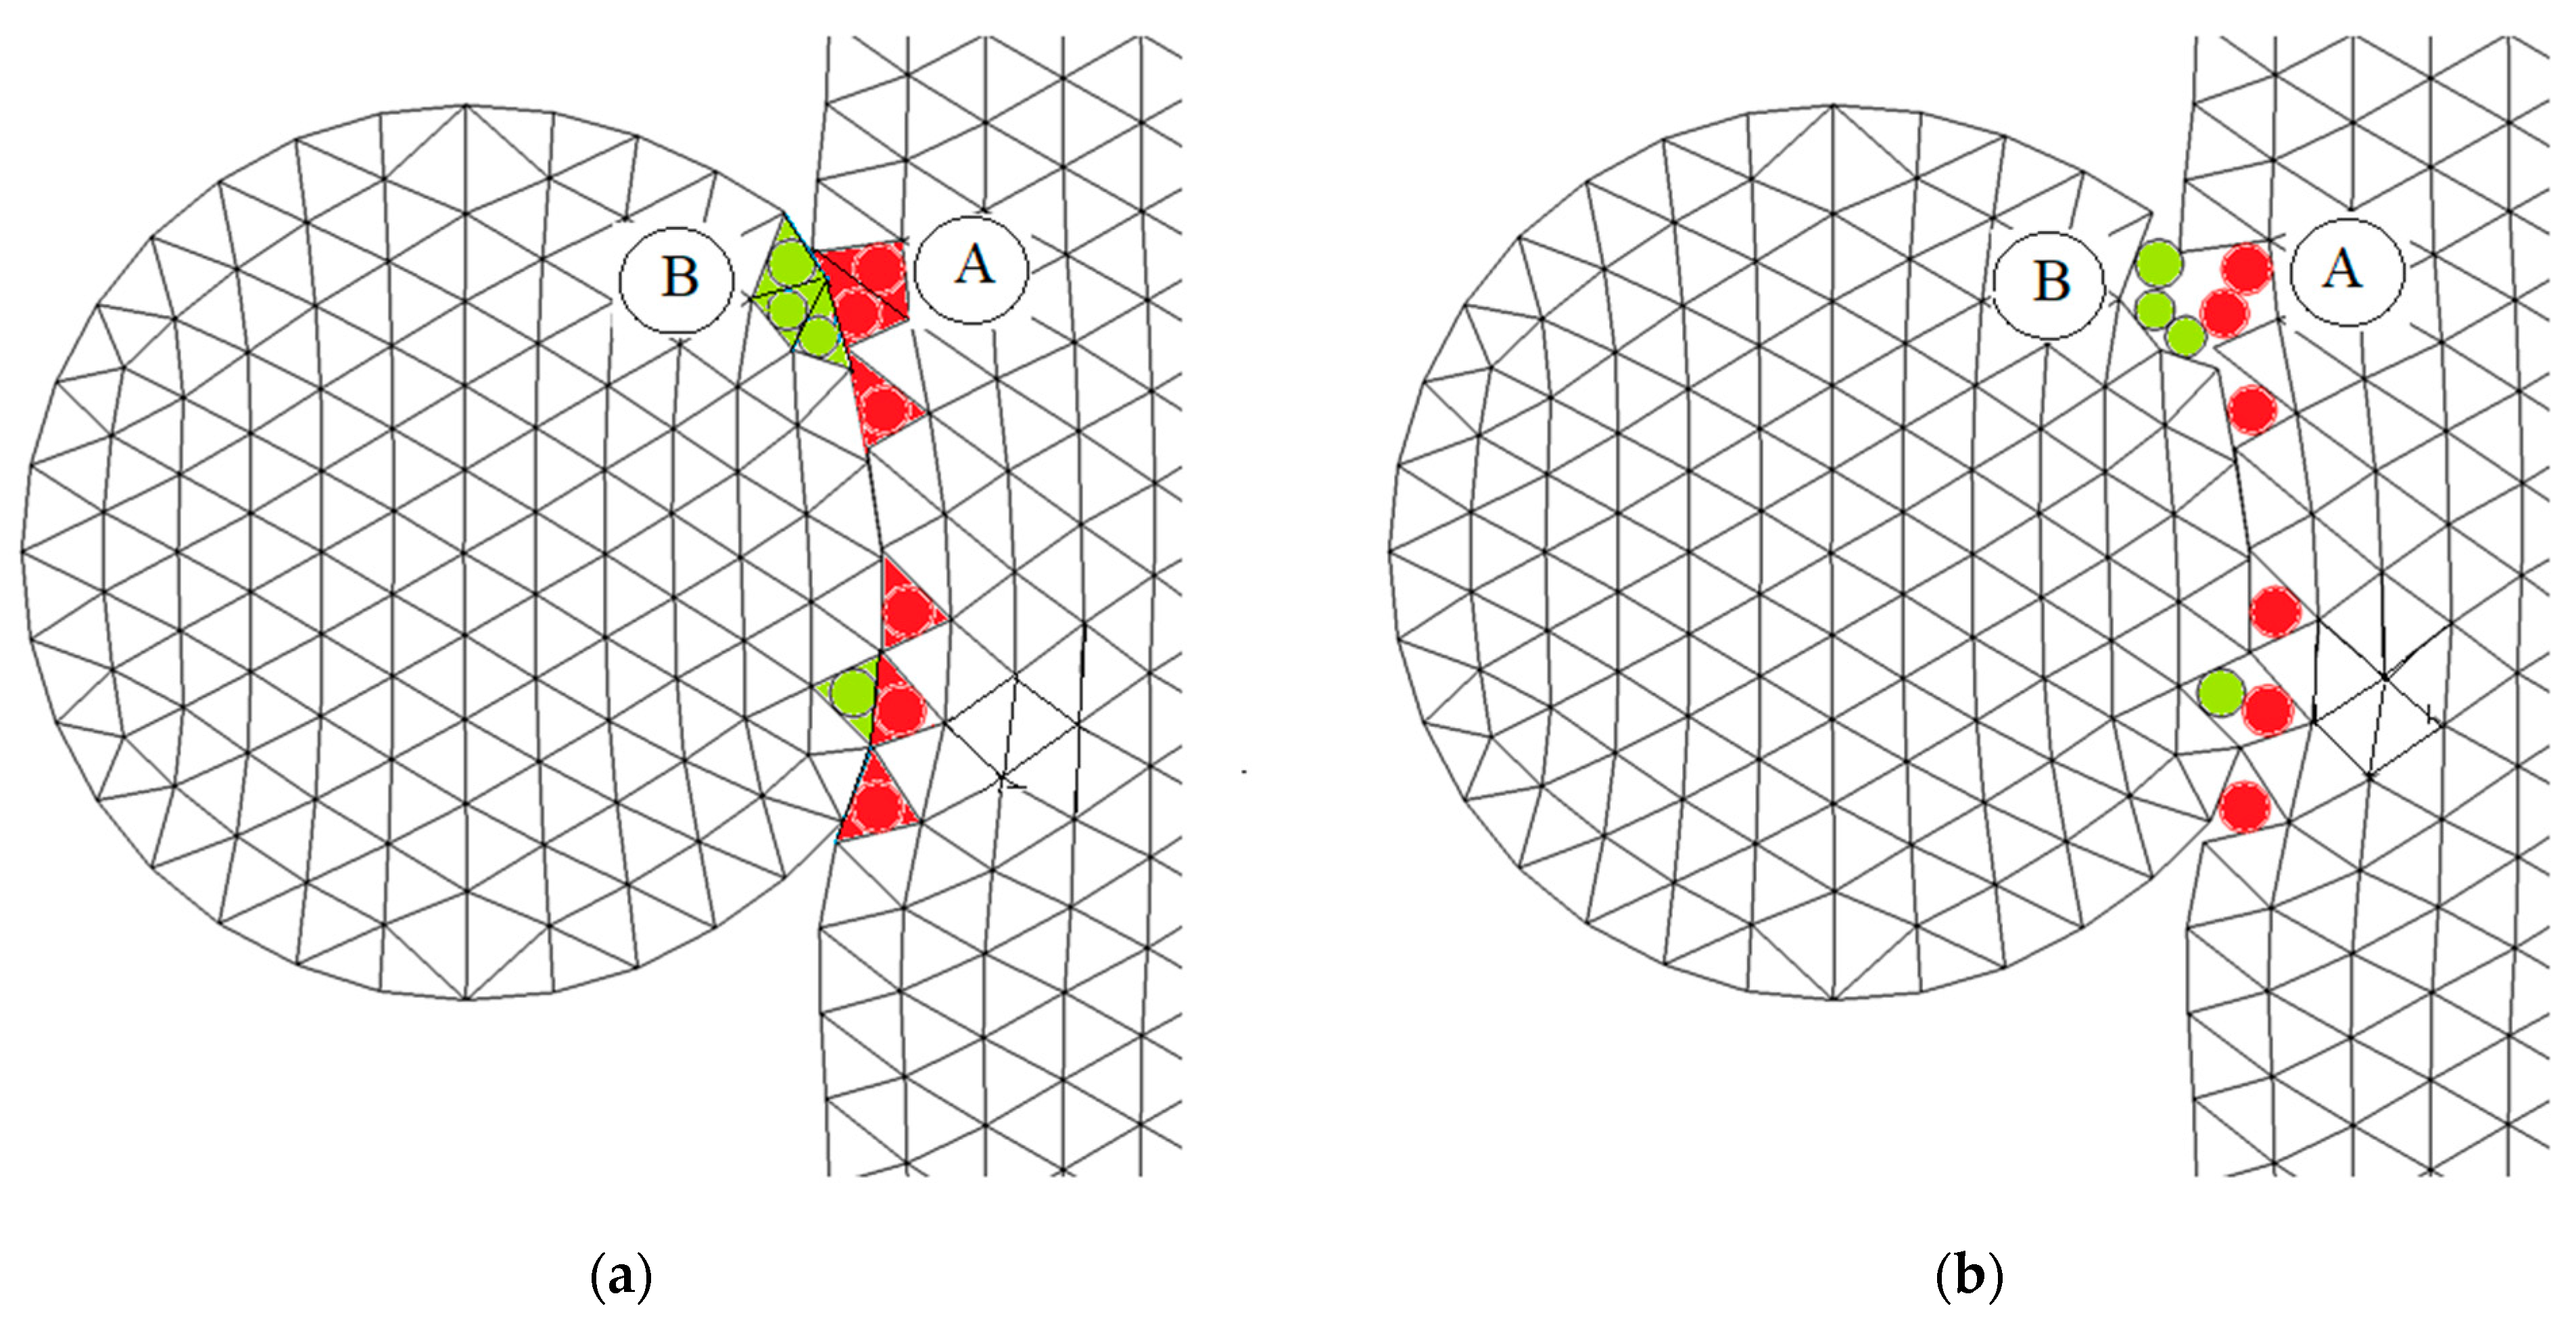
2.5. Conversion of Fractured Elements to Particles
- Element A is removed from the element grid;
- Particle A is added as a particle node;
- All of the element variables (stress, strain, damage, etc.) are transferred to the particle;
- The mass, velocity, and center of gravity of the particle node are set to those of the replaced element. The nodal velocity is obtained from the momentum of the element (three nodal masses and velocities);
- The masses of nodes b, c, and k are reduced by the removal of element A;
- For the conversion of element B (which has two sides on the surface) to node B, most of the steps are similar to those used for element A.
3. Propagation of Shock Waves in a Periodically Volume-Reinforced Metal Matrix Composite
4. Problem Statement
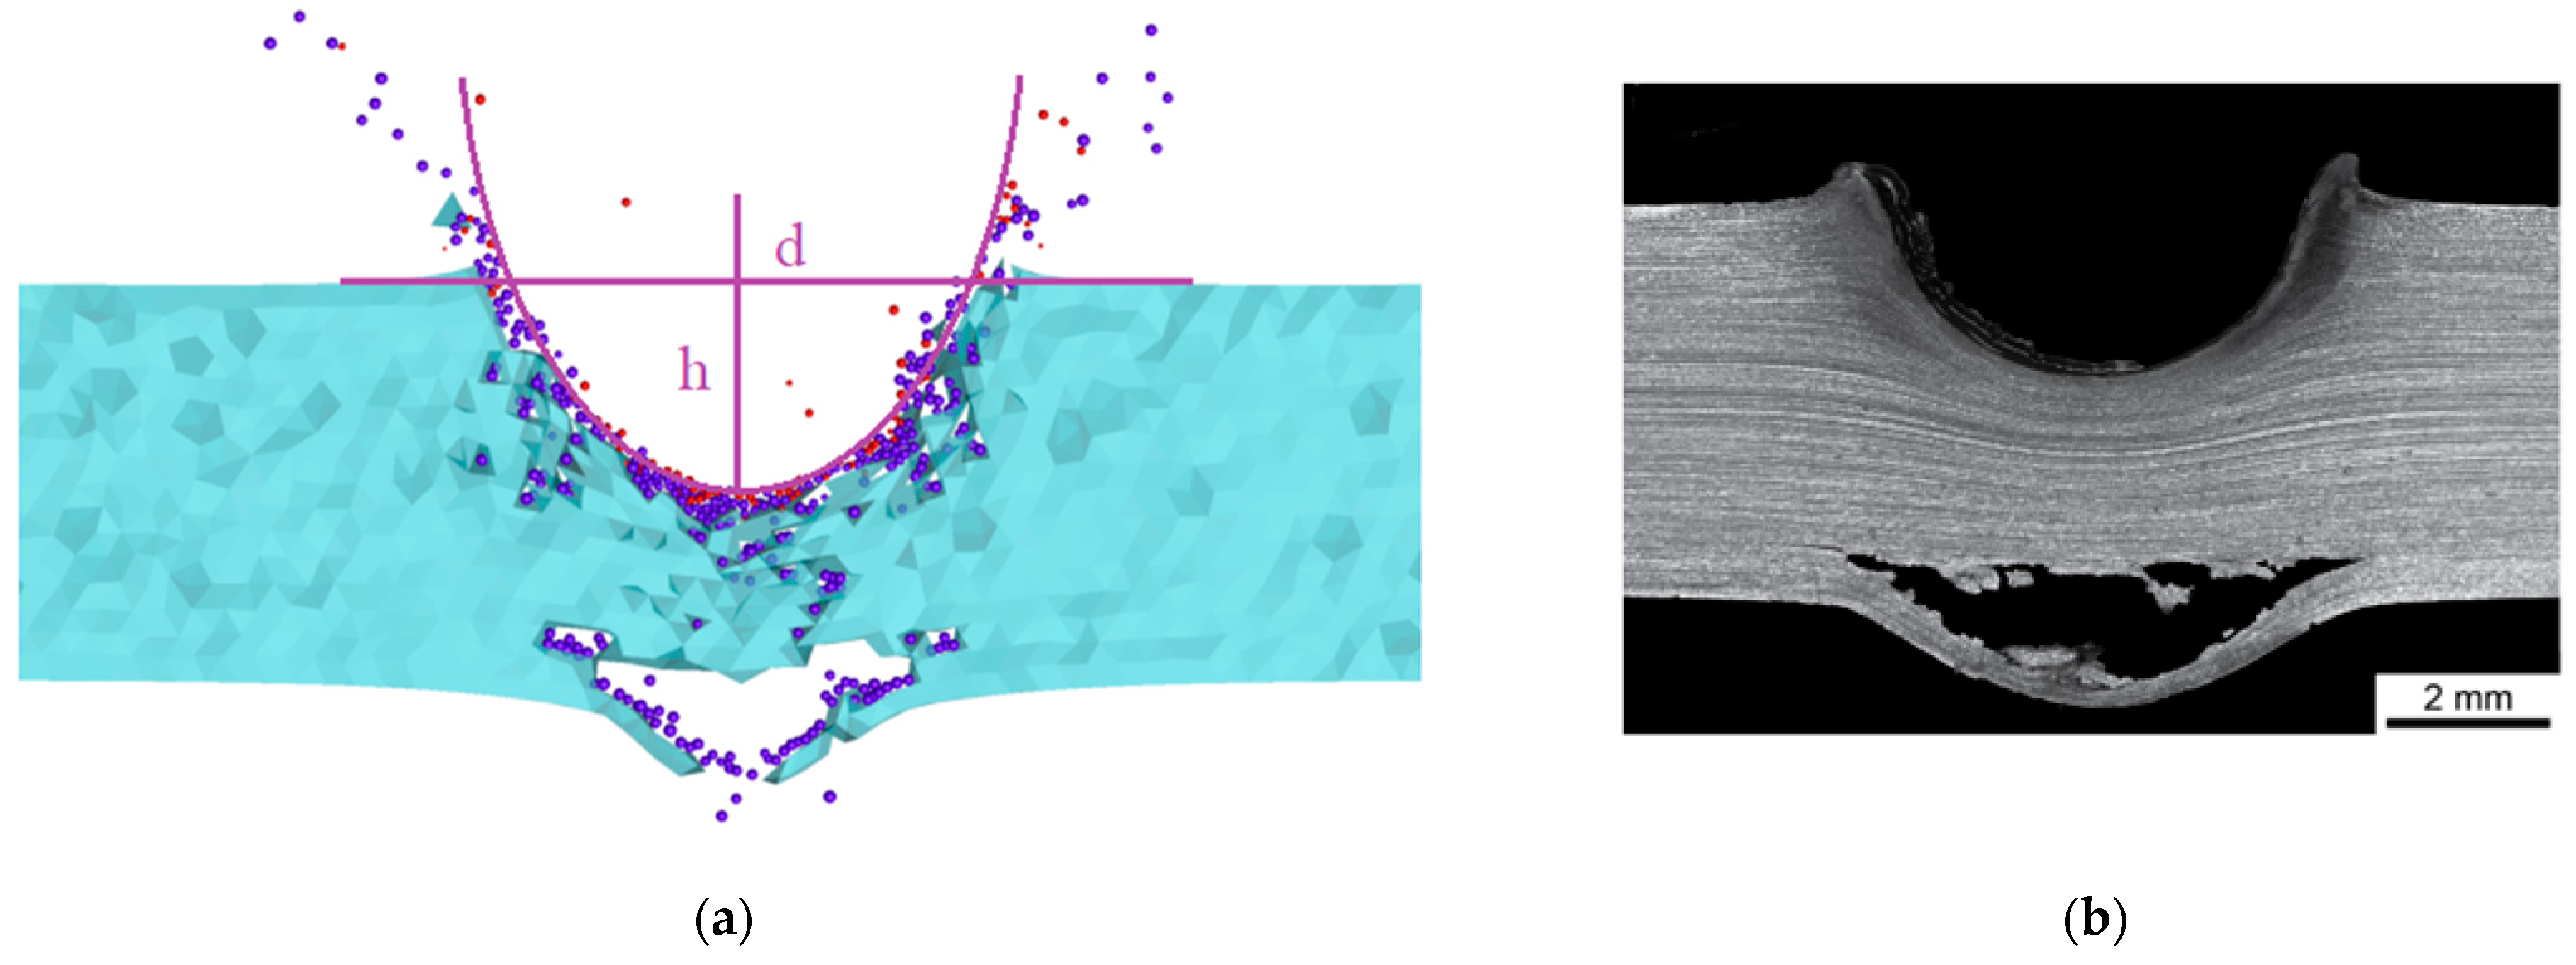
- Screen #1—a steel 316L plate, 4.5 mm thick;
- Screen #2—an A356 aluminum alloy plate, 12.0 mm thick;
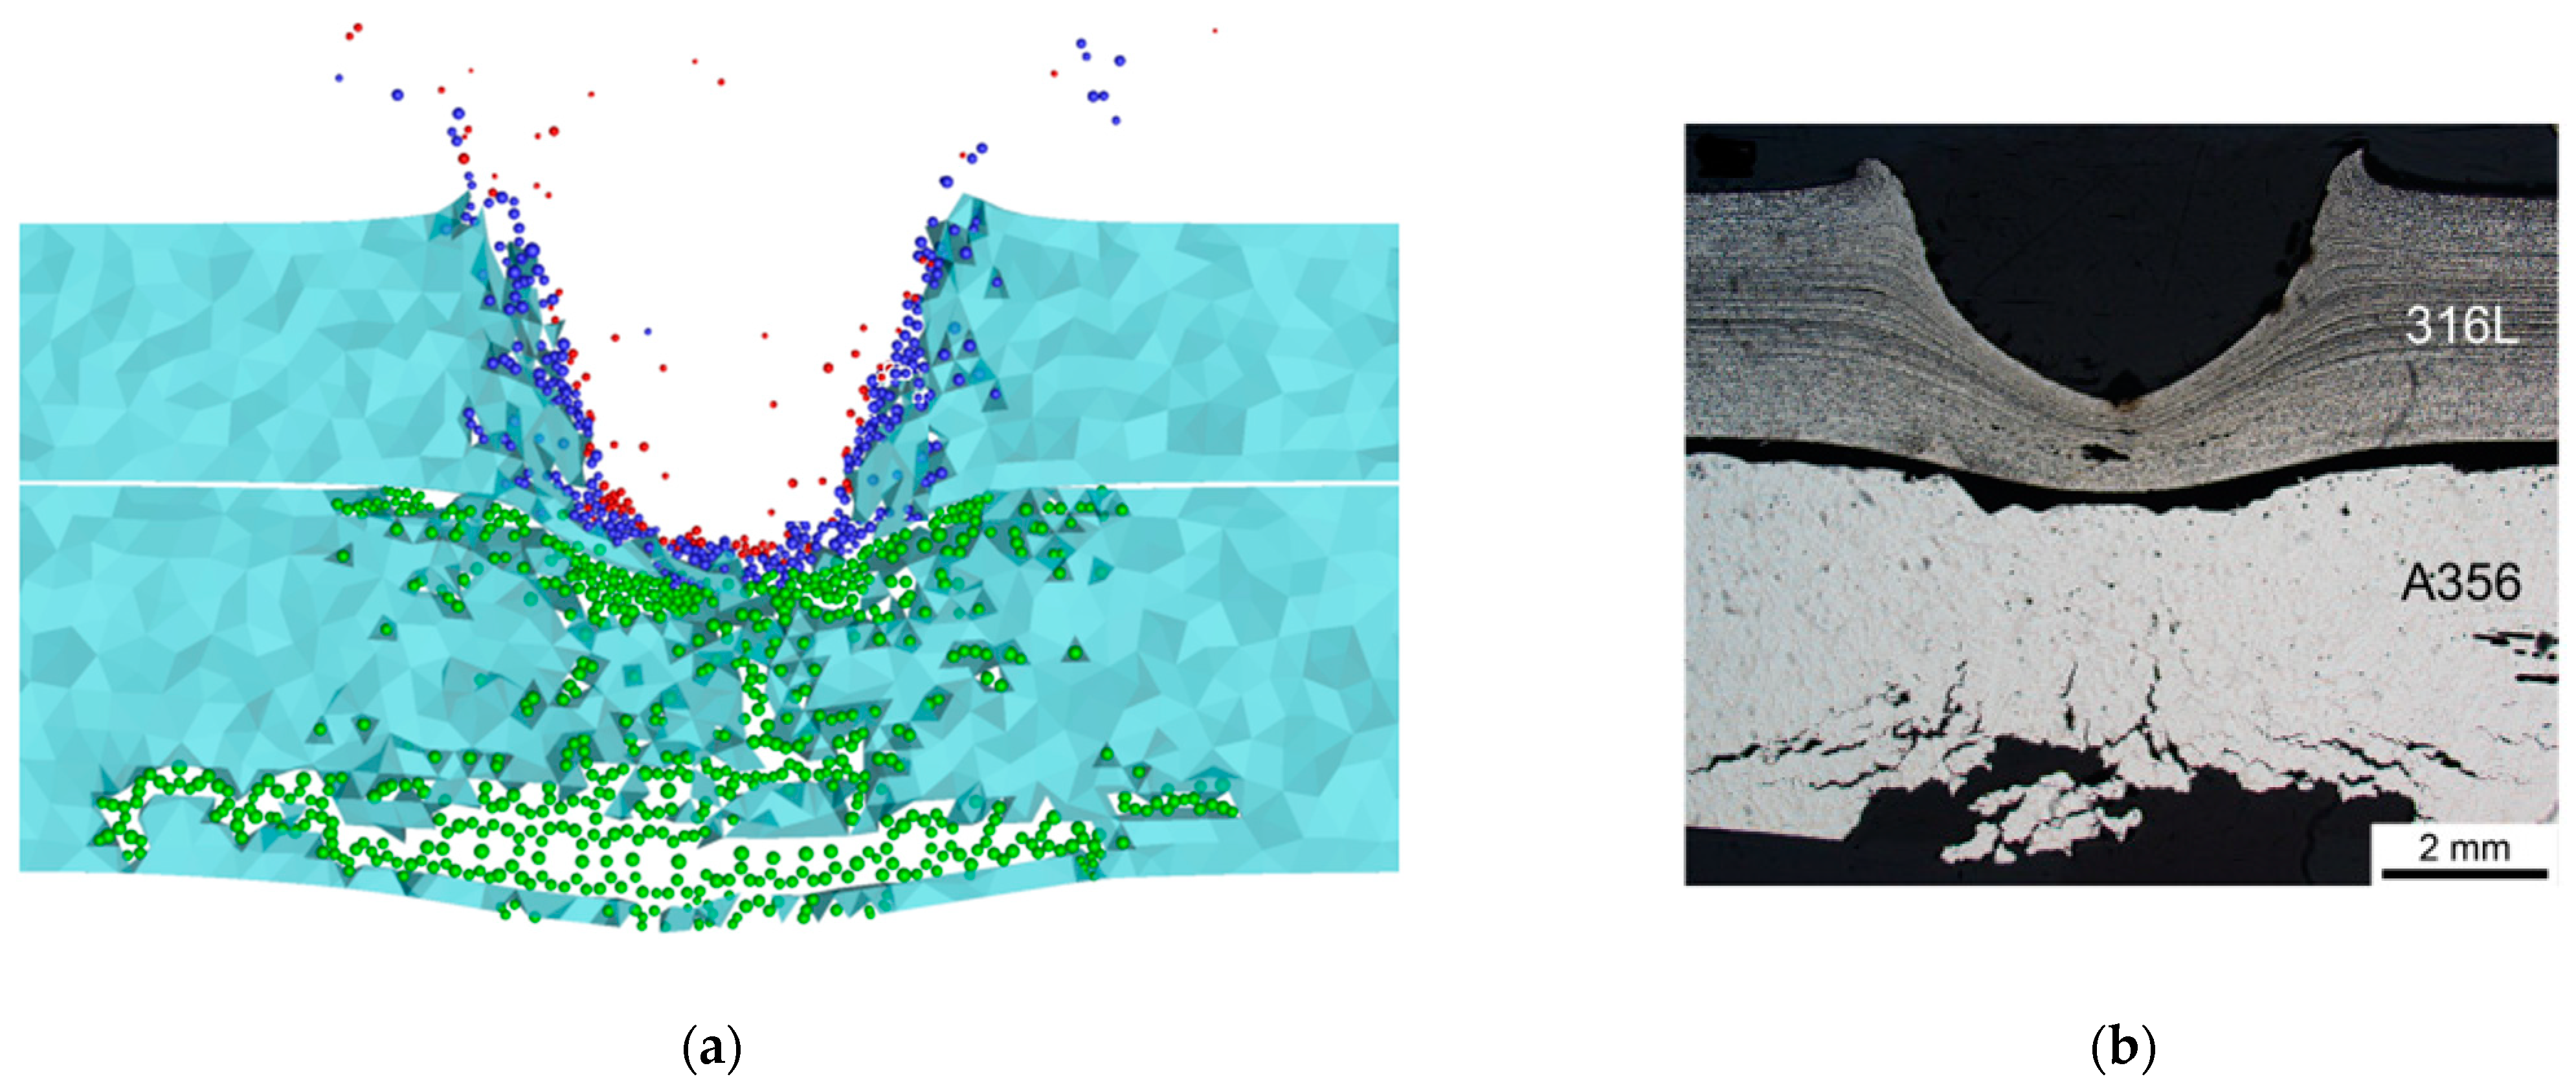
- Screen #3—a two-layer plate made of 316L/A356, 7.5 mm thick (3.0/4.5);
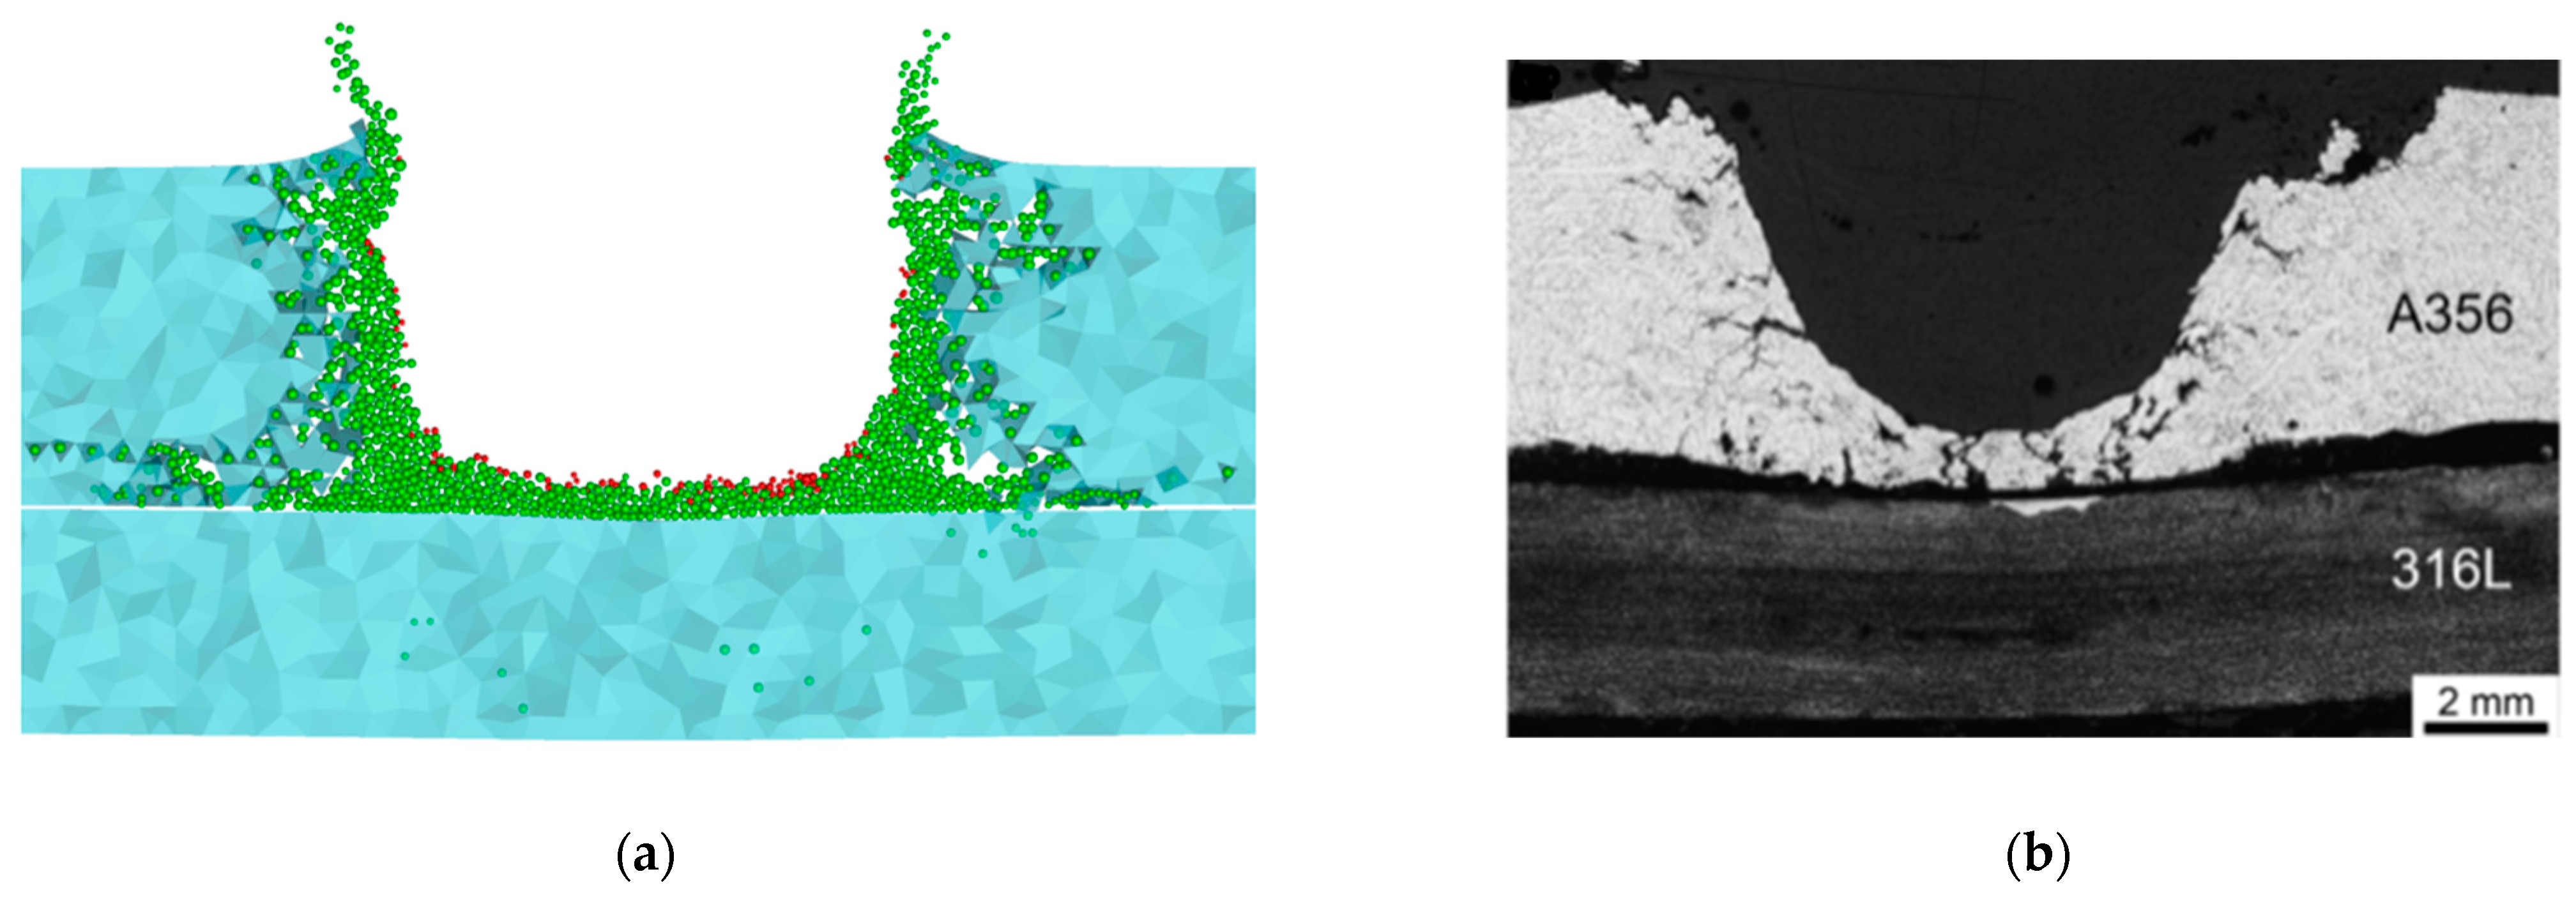
- Screen #4—a two-layer plate made of A356/316L, 7.5 mm thick (4.5/3.0);
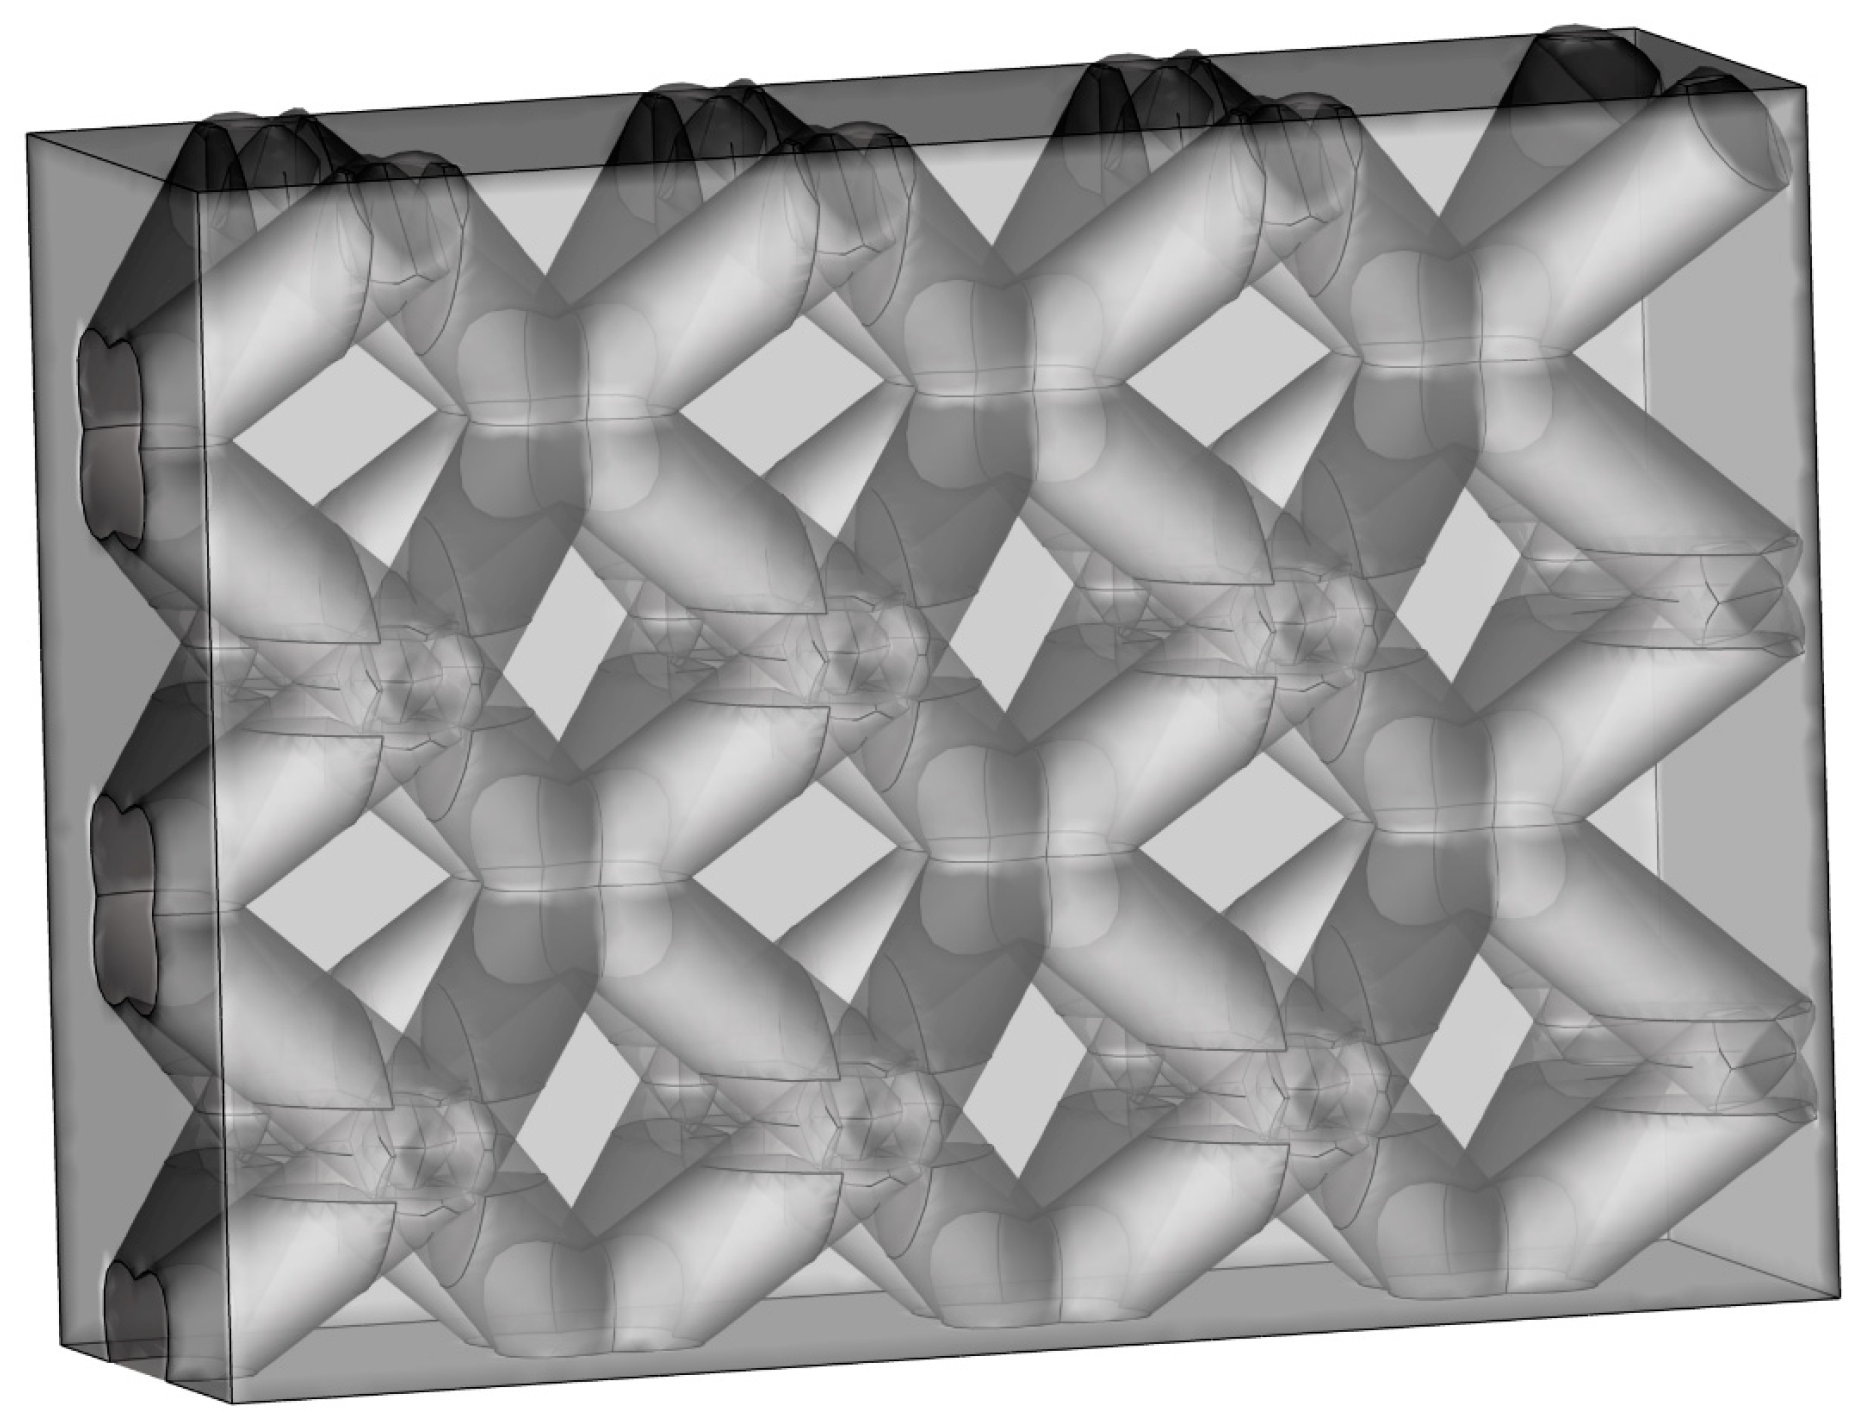
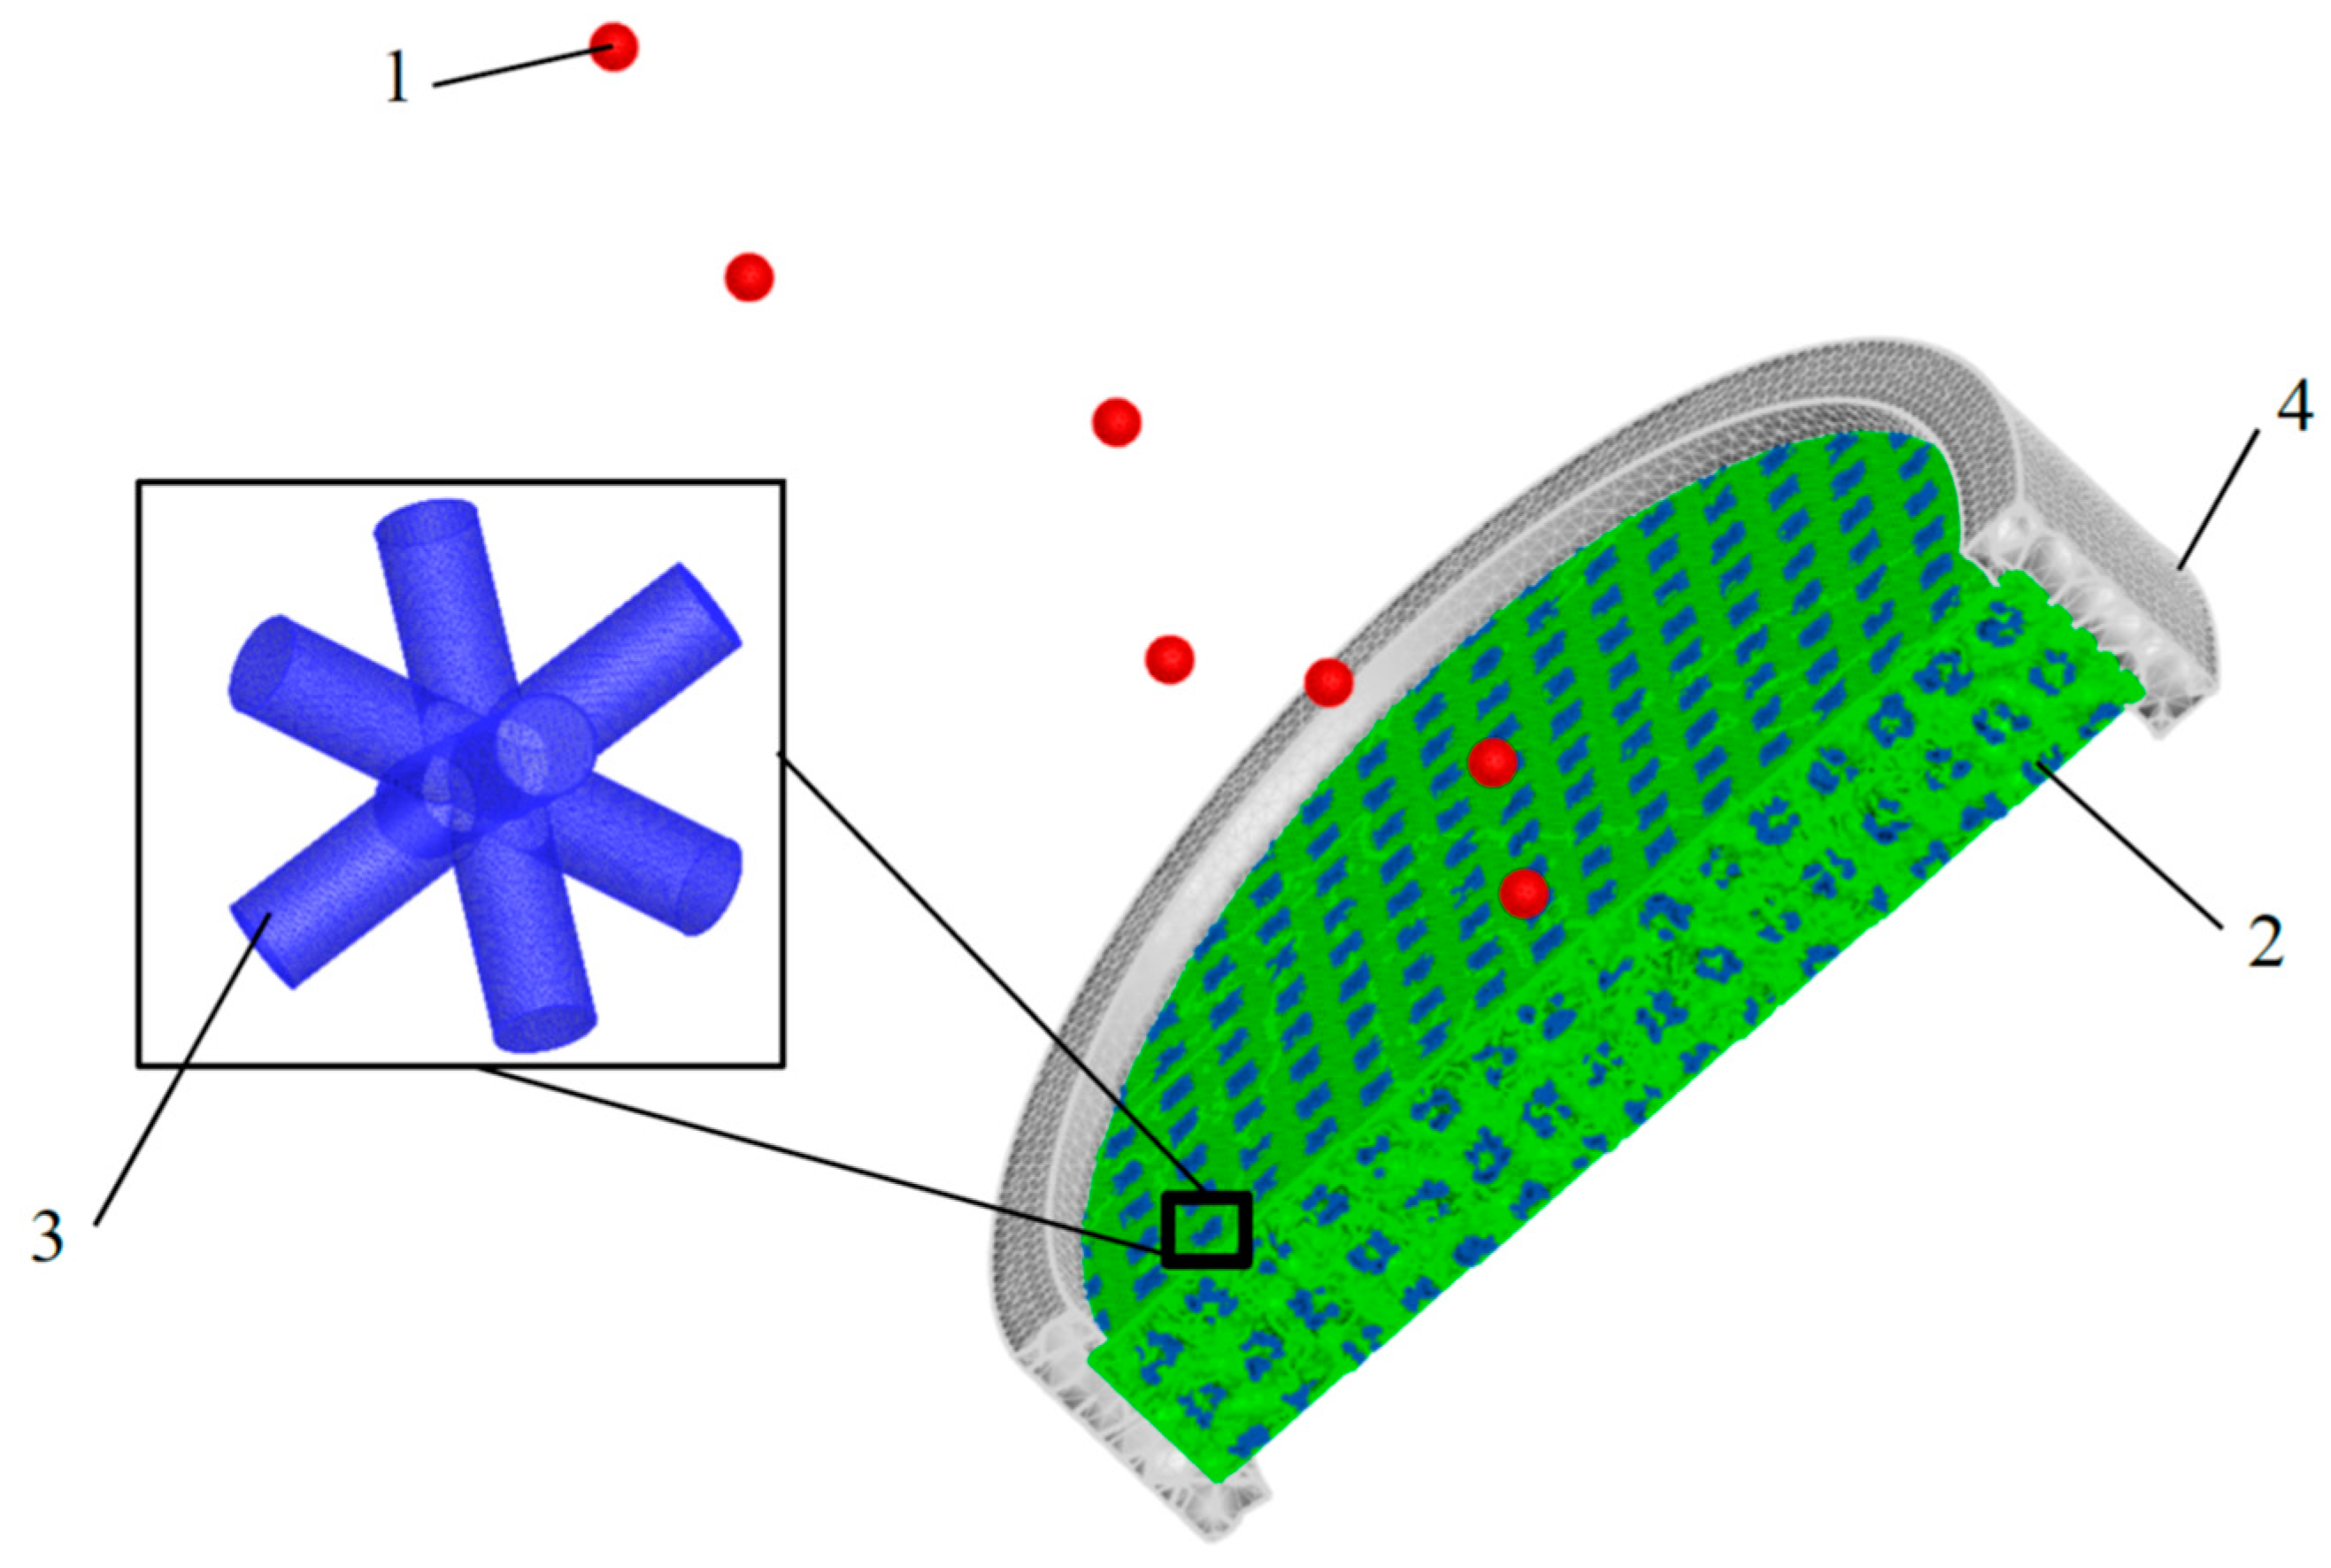
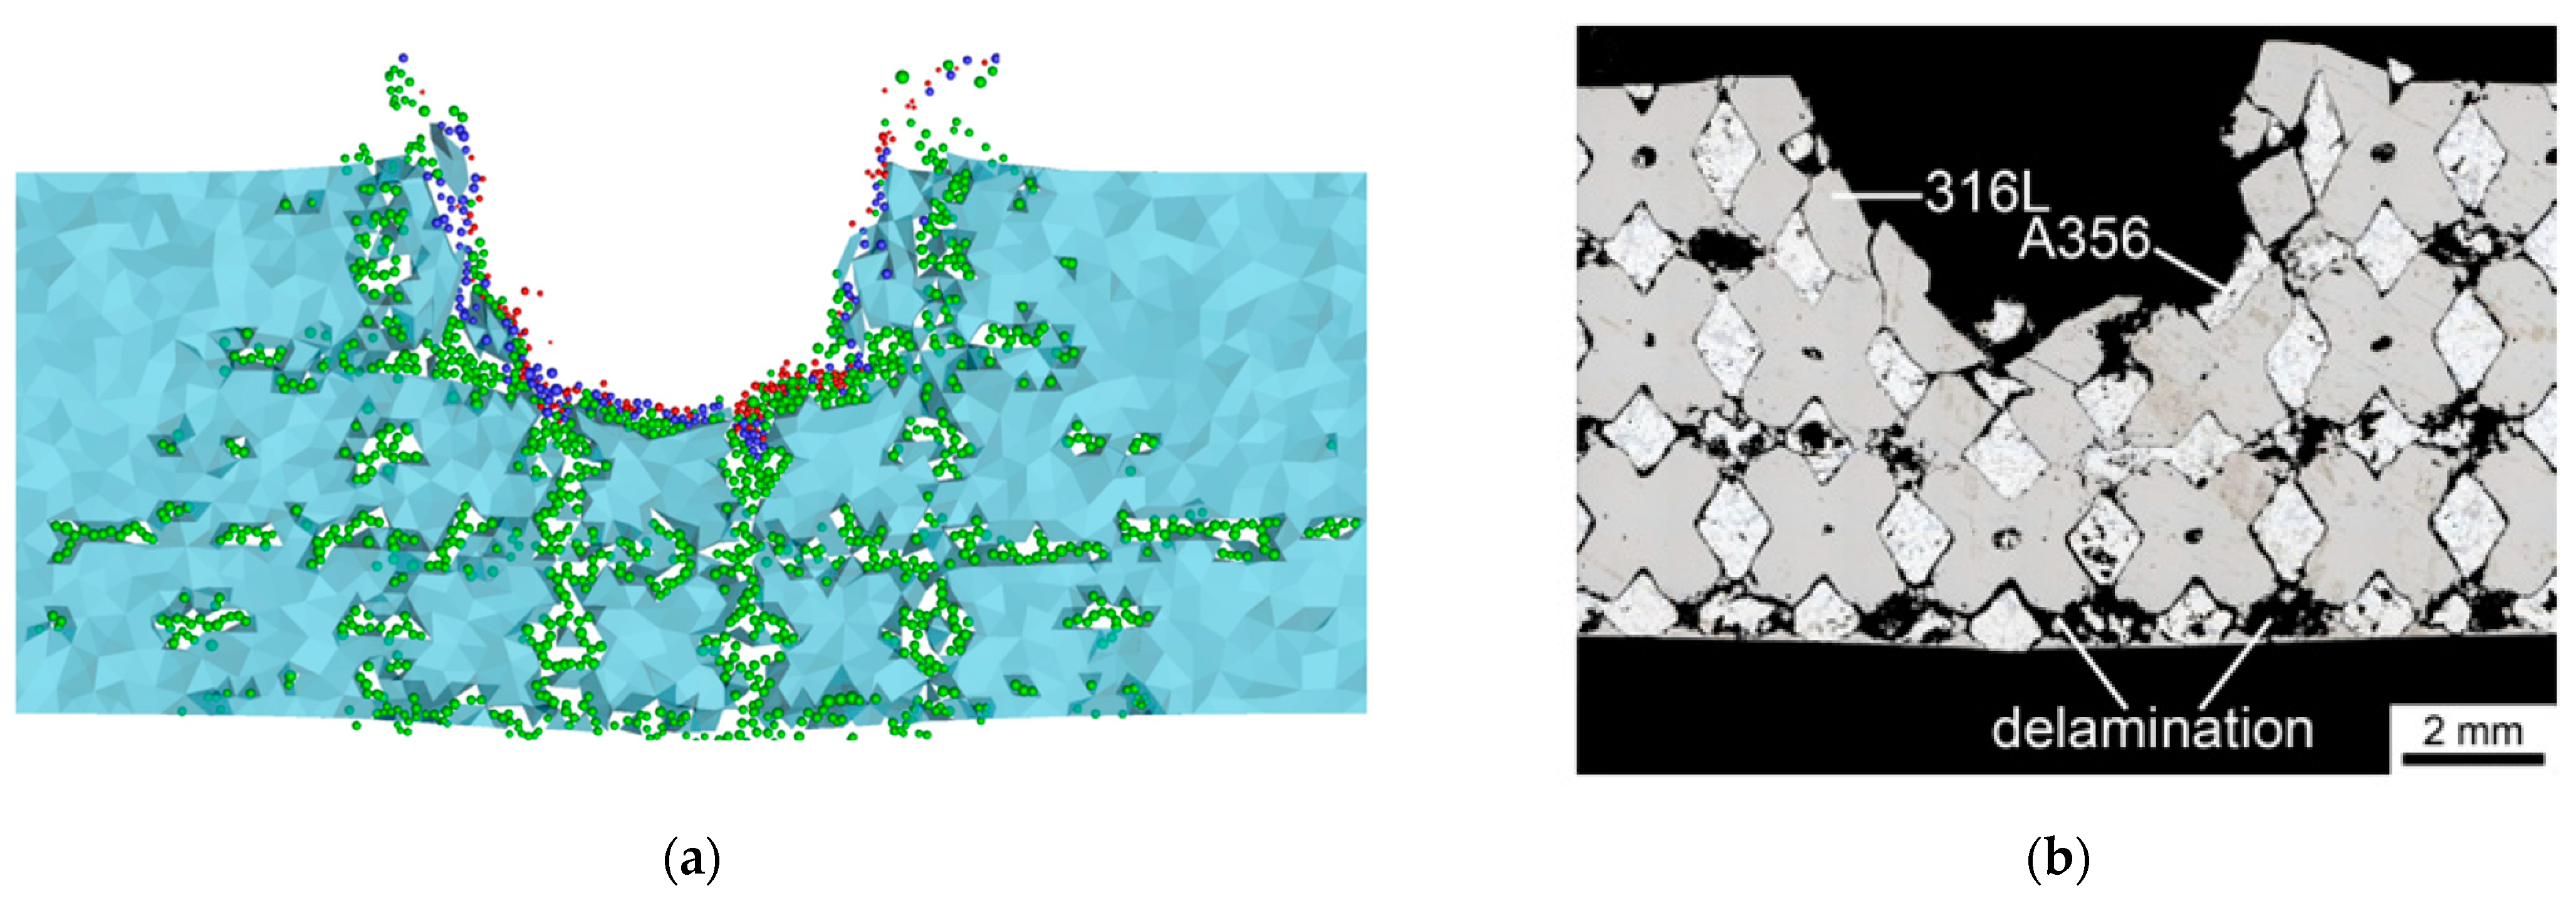
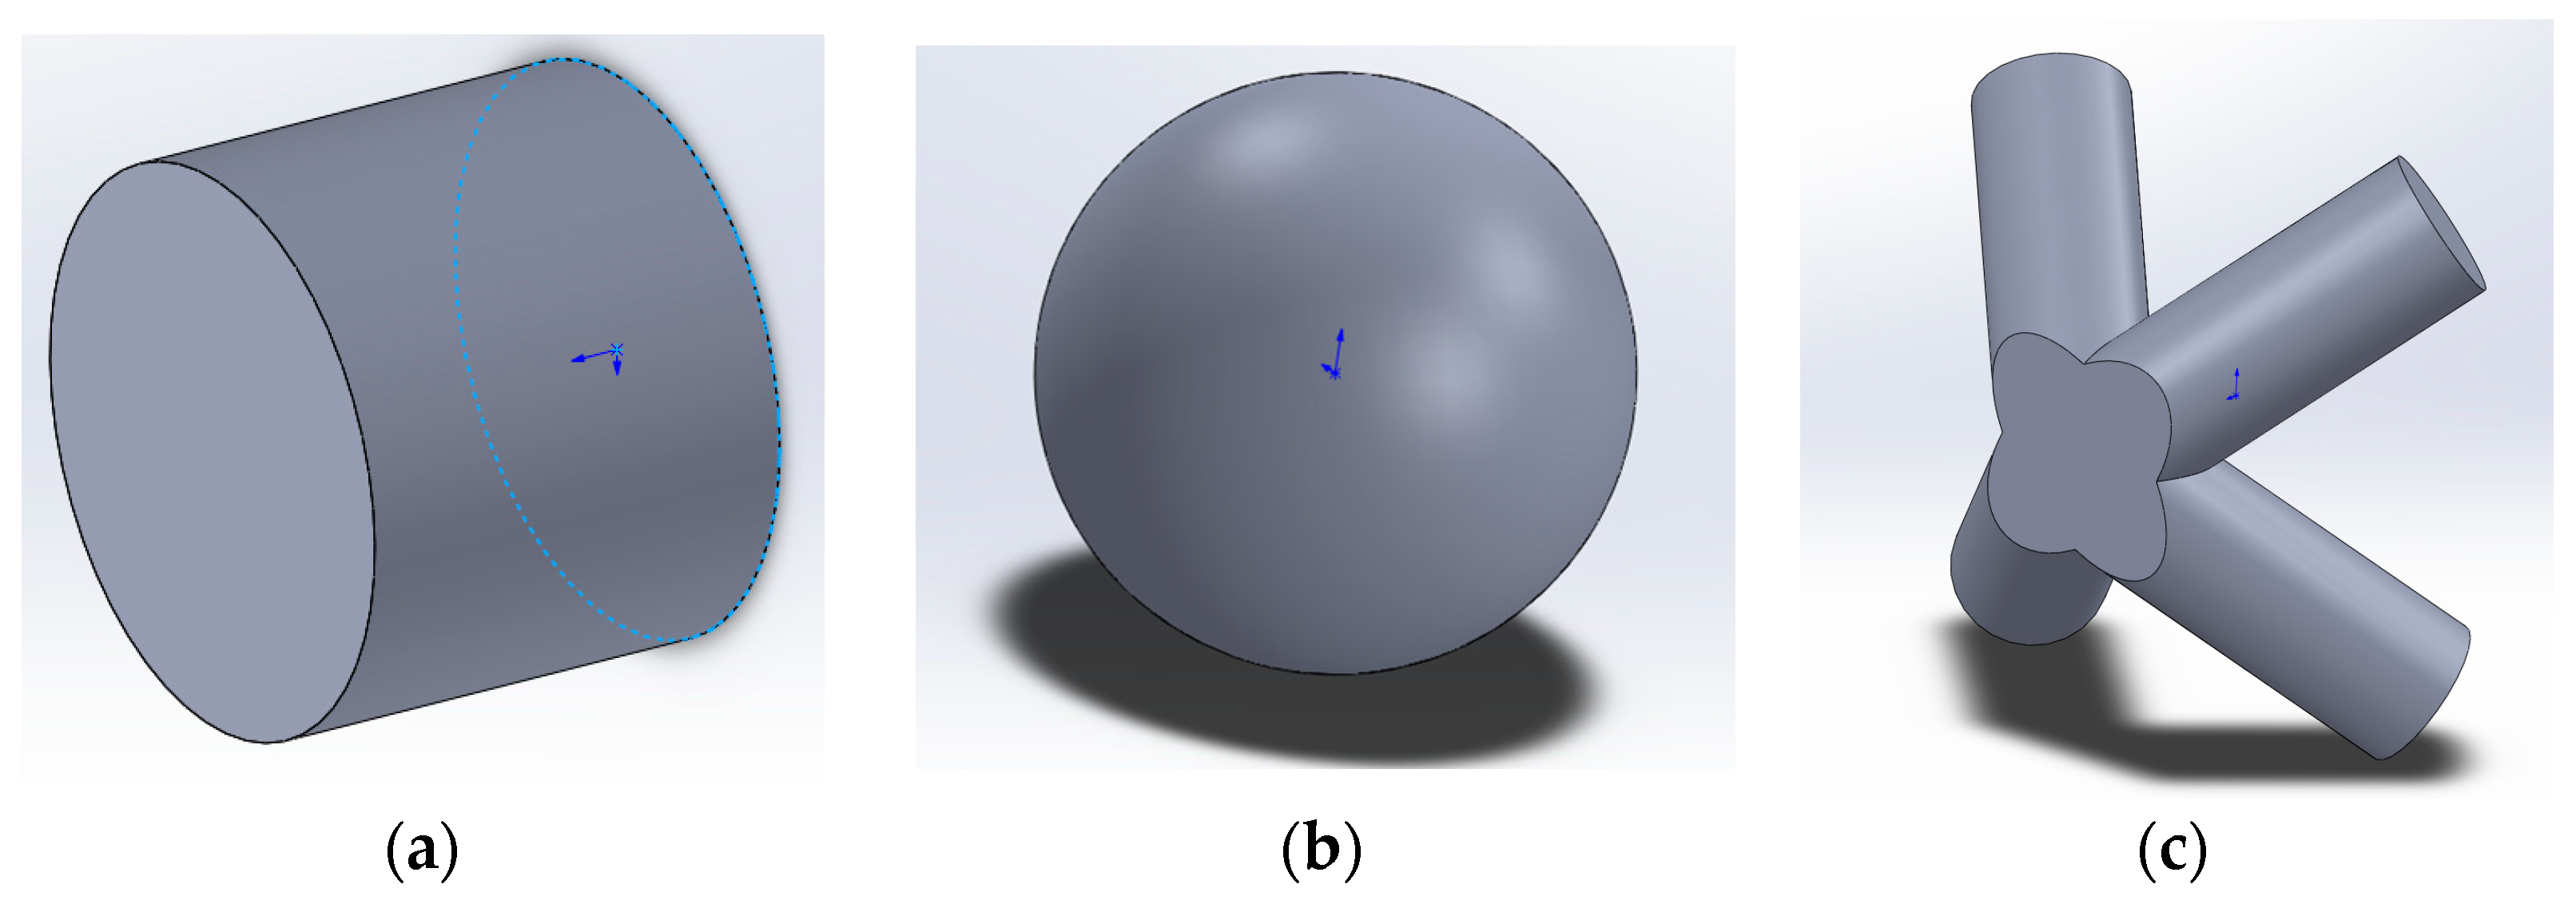
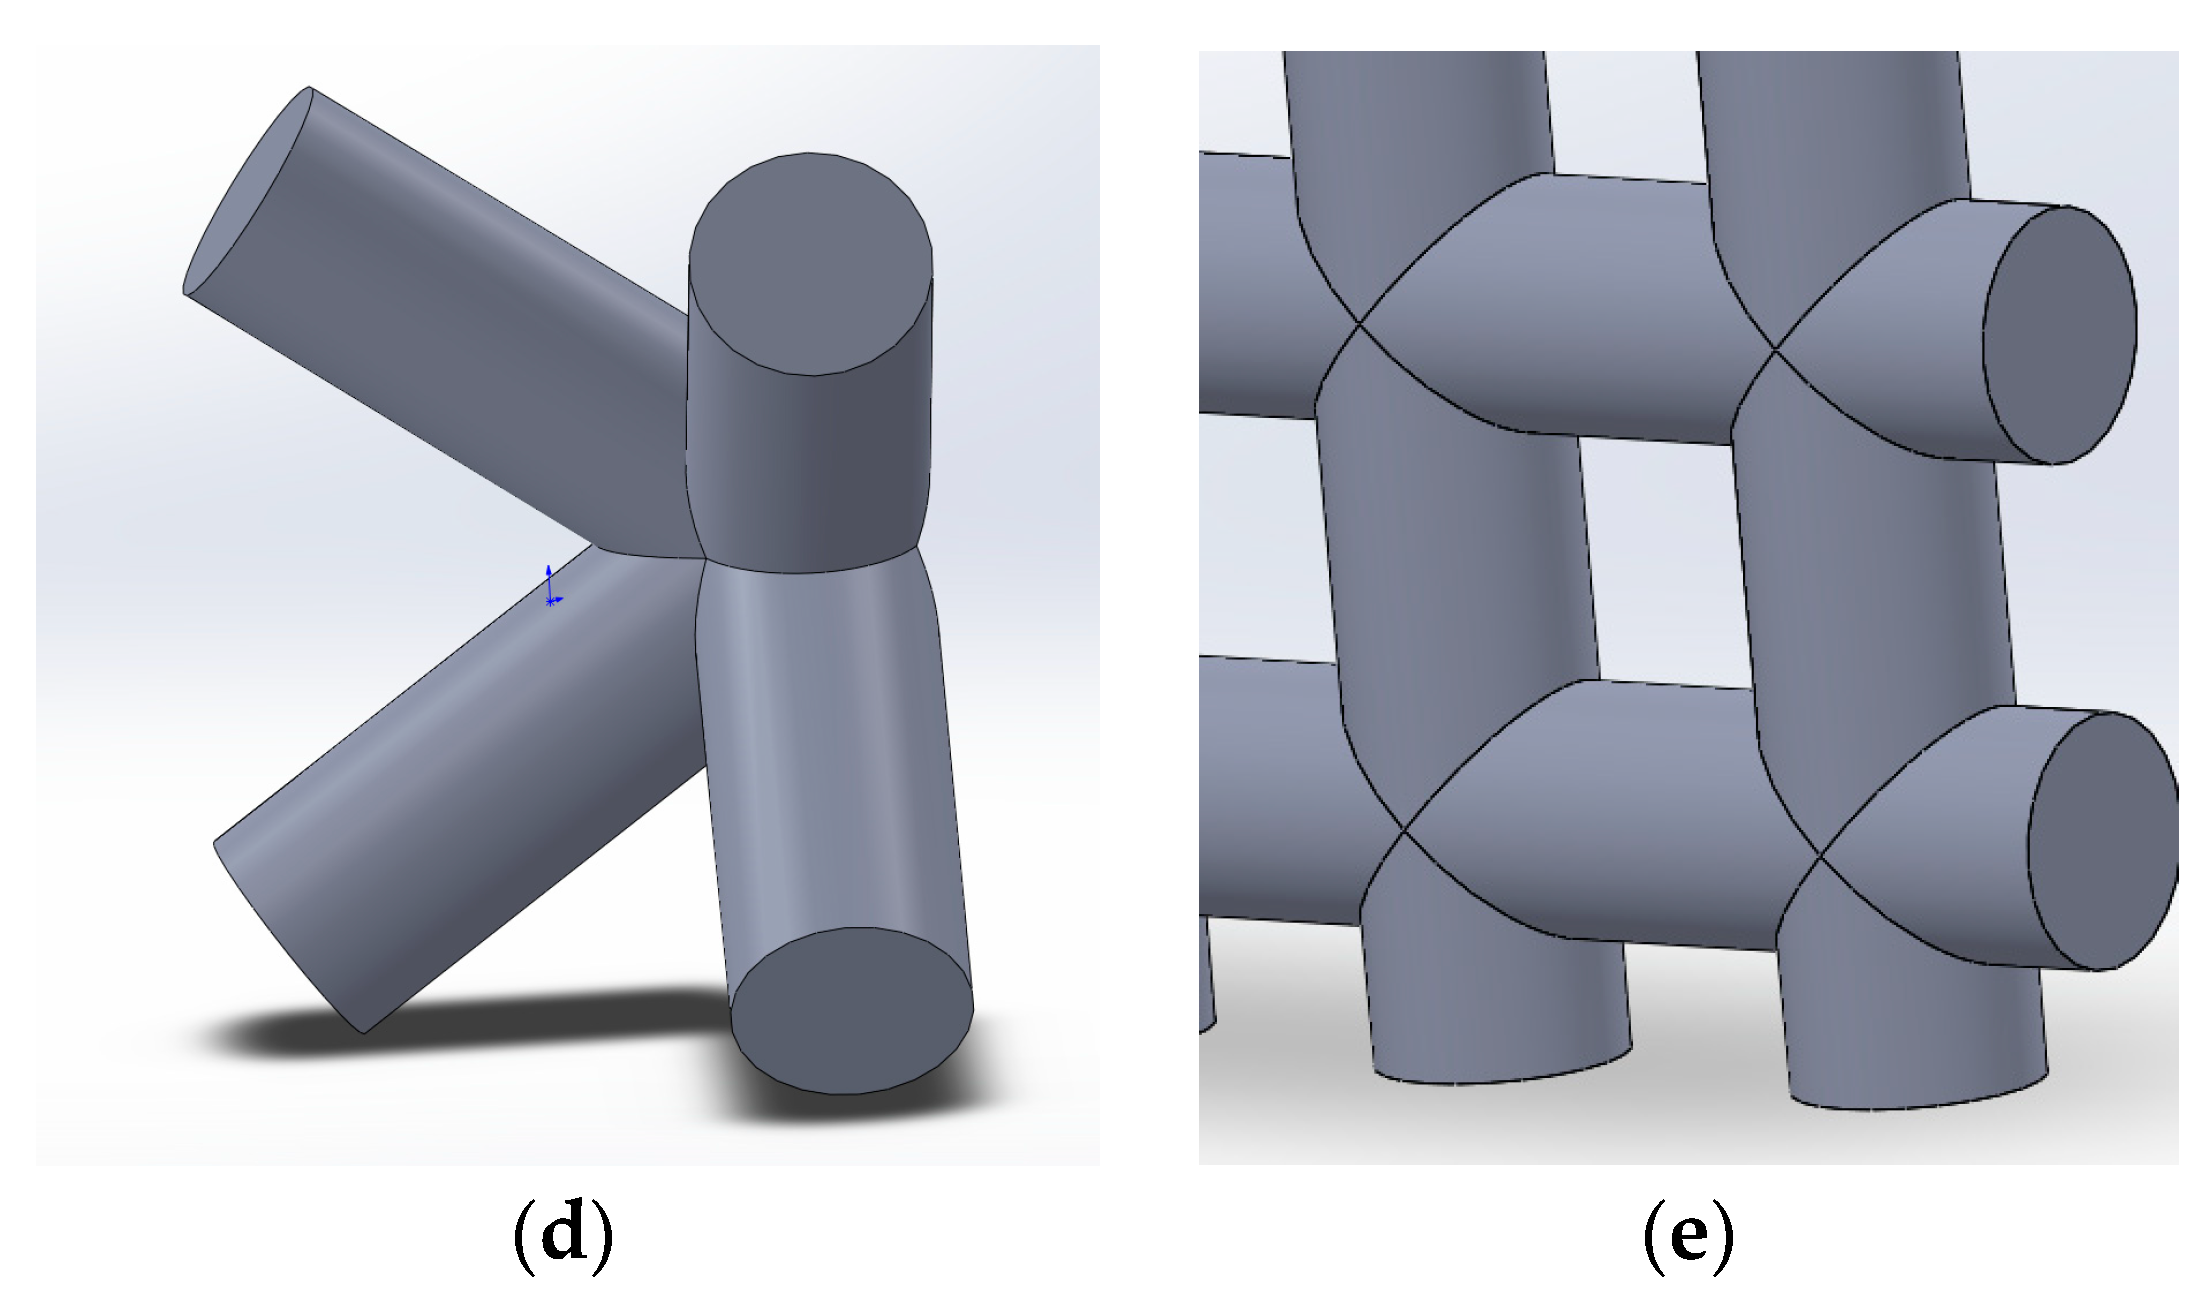
- Screen #5—a metal-matrix composite plate with the matrix composed of the A356 aluminum alloy and the volume reinforcement made of steel 316L, as is illustrated in Figure 3. The unit volume of the heterogeneous inclusion in such a plate has a face-centered cubic (FCC) symmetry with a side length of 2.5 mm and a diameter of 0.8 mm. The screen thickness is 7.5 mm;
- Screens #6, #7, and #8 are considered later as alternatives;
- Screen #9—A356 aluminum alloy plate, 13.4 mm thick.
5. Material Parameter Calibration
6. Metal Matrix Protective Screens with Interpenetrating Periodic Inclusions
7. Gradient Protective Screens
8. Multiple Impacts of Space Debris Particles
9. Conclusions
- For the first time, taking into account the fracture effects, a numerical solution has been obtained for the problem of high-velocity interaction between space debris particles and a volumetrically reinforced penetrating composite screen. It has been demonstrated that the screens constructed as two-layer A356/316L screens, volume-reinforced composites, and heterogeneous screens with a direct gradient distribution of steel in an aluminum matrix provide protection to devices from both individual space debris particles and streams of debris particles moving at speeds up to 6.0 km/s.
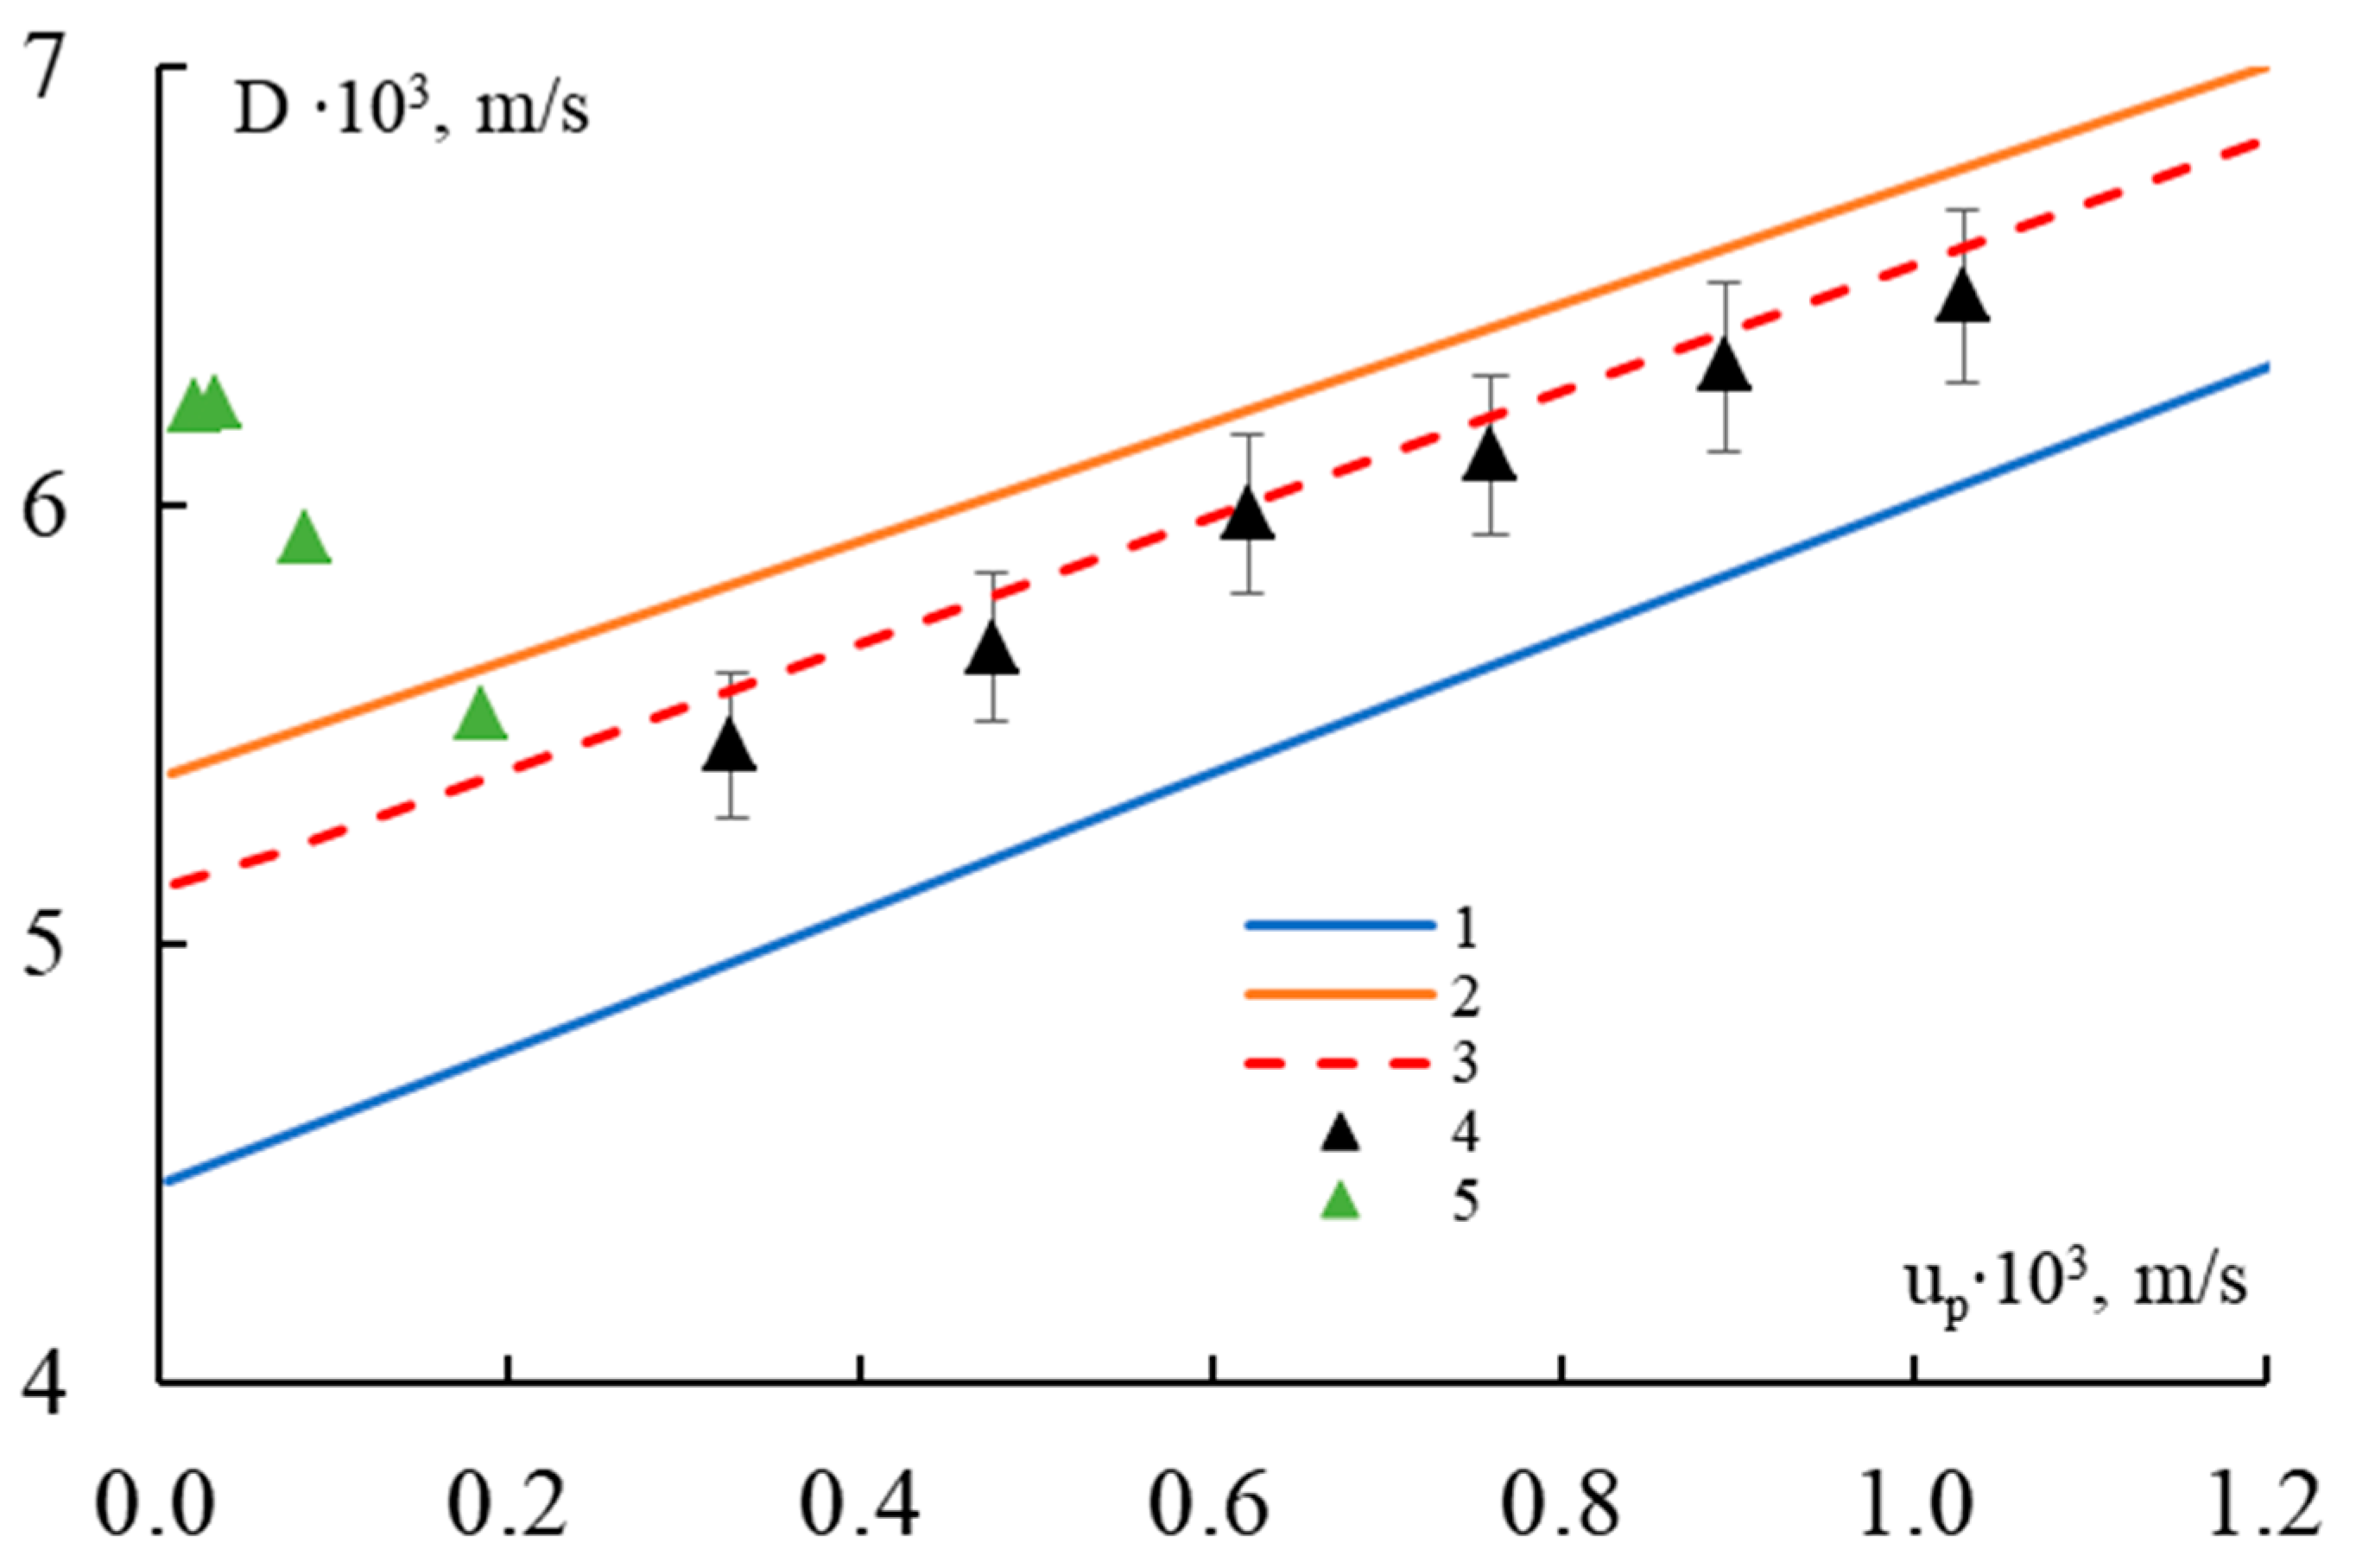
- The physico-mechanical parameters of the heterogeneous material behind the shock wave front, obtained through numerical calculations, show deviations from the parameters calculated using the mixture rule of no more than 3%.
- It has been shown that reinforcing the aluminum matrix with discrete steel inclusions within the specified mass and dimensional parameters of the screens does not provide sufficient protection for spacecraft components against high-velocity space debris particles.
Author Contributions
Funding
Institutional Review Board Statement
Informed Consent Statement
Data Availability Statement
Conflicts of Interest
References
- Smirnov, N.N. Space Debris; Smirnov, N.N., Ed.; CRC Press: London, UK, 2001; ISBN 9781482288193. [Google Scholar]
- Anz-Meador, P.D.; Opiela, J.N.; Shoots, D.; Liou, J.-C. History of On-Orbit Satellite Fragmentations, 15th ed.; NASA: Houston, TX, USA, 2018.
- Whipple, F.L. Meteorites and Space Travel. Astron. J. 1947, 52, 131. [Google Scholar] [CrossRef] [Green Version]
- Christiansen, E.L.; Crews, J.L.; Williamsen, J.E.; Robinson, J.H.; Nolen, A.M. Enhanced Meteoroid and Orbital Debris Shielding. Int. J. Impact Eng. 1995, 17, 217–228. [Google Scholar] [CrossRef] [Green Version]
- Zhuang, S.; Ravichandran, G.; Grady, D.E. An Experimental Investigation of Shock Wave Propagation in Periodically Layered Composites. J. Mech. Phys. Solids 2003, 51, 245–265. [Google Scholar] [CrossRef]
- Grujicic, M.; Pandurangan, B.; Bell, W.C.; Bagheri, S. Shock-Wave Attenuation and Energy-Dissipation Potential of Granular Materials. J. Mater. Eng. Perform. 2012, 21, 167–179. [Google Scholar] [CrossRef]
- Lamberson, L. Investigations of High Performance Fiberglass Impact Using a Combustionless Two-Stage Light-Gas Gun. Procedia Eng. 2015, 103, 341–348. [Google Scholar] [CrossRef] [Green Version]
- Rawal, S.P. Metal-Matrix Composites for Space Applications. JOM 2001, 53, 14–17. [Google Scholar] [CrossRef]
- Kok, Y.; Tan, X.P.; Wang, P.; Nai, M.L.S.; Loh, N.H.; Liu, E.; Tor, S.B. Anisotropy and Heterogeneity of Microstructure and Mechanical Properties in Metal Additive Manufacturing: A Critical Review. Mater. Des. 2018, 139, 565–586. [Google Scholar] [CrossRef]
- DebRoy, T.; Wei, H.L.; Zuback, J.S.; Mukherjee, T.; Elmer, J.W.; Milewski, J.O.; Beese, A.M.; Wilson-Heid, A.; De, A.; Zhang, W. Additive Manufacturing of Metallic Components–Process, Structure and Properties. Prog. Mater. Sci. 2018, 92, 112–224. [Google Scholar] [CrossRef]
- Filippov, A.A.; Fomin, V.M.; Buzyurkin, A.E.; Kosarev, V.F.; Malikov, A.G.; Orishich, A.M.; Ryashin, N.S. The Development of Heterogeneous Materials Based on Ni and B 4 C Powders Using a Cold Spray and Stratified Selective Laser Melting Technologies. J. Phys. Conf. Ser. 2018, 946, 012005. [Google Scholar] [CrossRef] [Green Version]
- Fomin, V.M.; Golyshev, A.A.; Malikov, A.G.; Orishich, A.M.; Filippov, A.A. Creation of a functionally gradient material by the selective laser melting method. J. Appl. Mech. Tech. Phys. 2020, 61, 878–887. [Google Scholar] [CrossRef]
- Fomin, V.M.; Golyshev, A.A.; Kosarev, V.F.; Malikov, A.G.; Orishich, A.M.; Filippov, A.A. Deposition of Cermet Coatings on the Basis of Ti, Ni, WC, and B4C by Cold Gas Dynamic Spraying with Subsequent Laser Irradiation. Phys. Mesomech. 2020, 23, 291–300. [Google Scholar] [CrossRef]
- Zhang, M.; Yu, Q.; Liu, Z.; Zhang, J.; Tan, G.; Jiao, D.; Zhu, W.; Li, S.; Zhang, Z.; Yang, R.; et al. 3D Printed Mg-NiTi Interpenetrating-Phase Composites with High Strength, Damping Capacity, and Energy Absorption Efficiency. Sci. Adv. 2020, 6, eaba5581. [Google Scholar] [CrossRef]
- Pawlowski, A.E.; Splitter, D.A.; Muth, T.R.; Shya, A.; Carver, J.K.; Dinwiddie, R.B.; Elliott, A.M. Producing Hybrid Metal Composites by Combining Additive Manufacturing and Casting. Adv. Mater. Process. 2017, 175, 16–21. [Google Scholar]
- Pawlowski, A.E.; Cordero, Z.C.; French, M.R.; Muth, T.R.; Keith Carver, J.; Dinwiddie, R.B.; Elliott, A.M.; Shyam, A.; Splitter, D.A. Damage-Tolerant Metallic Composites via Melt Infiltration of Additively Manufactured Preforms. Mater. Des. 2017, 127, 346–351. [Google Scholar] [CrossRef]
- Moustafa, A.R.; Dinwiddie, R.B.; Pawlowski, A.E.; Splitter, D.A.; Shyam, A.; Cordero, Z.C. Mesostructure and Porosity Effects on the Thermal Conductivity of Additively Manufactured Interpenetrating Phase Composites. Addit. Manuf. 2018, 22, 223–229. [Google Scholar] [CrossRef]
- Poole, L.L.; Gonzales, M.; French, M.R.; Yarberry, W.A.; Moustafa, A.R.; Cordero, Z.C. Hypervelocity Impact of PrintCast 316L/A356 Composites. Int. J. Impact Eng. 2020, 136, 103407. [Google Scholar] [CrossRef]
- French, M.R.; Yarberry, W.A., III; Pawlowski, A.E.; Shyam, A.; Splitter, D.A.; Elliott, A.M.; Carver, J.K.; Cordero, Z.C. Hypervelocity Impact of Additively Manufactured A356/316L Interpenetrating Phase Composites. In Proceedings of the Solid Freeform Fabrication 2017: Proceedings of the 28th Annual International Solid Freeform Fabrication Symposium—An Additive Manufacturing Conference Hypervelocity, Austin, TX, USA, 7–9 August 2017. [Google Scholar]
- Cheng, J.; Gussev, M.; Allen, J.; Hu, X.; Moustafa, A.R.; Splitter, D.A.; Shyam, A. Deformation and Failure of PrintCast A356/316L Composites: Digital Image Correlation and Finite Element Modeling. Mater. Des. 2020, 195, 109061. [Google Scholar] [CrossRef]
- Kraus, A.E.; Kraus, E.I.; Shabalin, I.I. Numerical Simulation of the High-Speed Interaction of a Spherical Impactor with a System of Spaced Heterogeneous Plates. J. Phys. Conf. Ser. 2019, 1404, 012026. [Google Scholar] [CrossRef]
- Kraus, A.E.; Kraus, E.I.; Shabalin, I.I. Impact Resistance of Ceramics in a Numerical Experiment. J. Appl. Mech. Tech. Phys. 2020, 61, 847–854. [Google Scholar] [CrossRef]
- Kraus, A.E.; Kraus, E.I.; Shabalin, I.I.; Buzyurkin, A.E. Evolution of a Short Compression Pulse in a Heterogeneous Elastoplastic Medium. J. Appl. Mech. Tech. Phys. 2021, 62, 475–483. [Google Scholar] [CrossRef]
- Kraus, A.E.; Kraus, E.I.; Shabalin, I.I. Reactor 3D Software Performance on Penetration and Perforation Problems. In Behavior of Materials under Impact, Explosion, High Pressures and Dynamic Strain Rates; Orlov, M.Y., Visakh, P.M., Eds.; Springer International Publishing: Berlin/Heidelberg, Germany, 2023; pp. 83–101. [Google Scholar]
- Fomin, V.M.; Gulidov, A.I.; Sapozhnikov, G.A.; Shabalin, I.I. High-Velocity Solids Interaction; SB RAS: Novosibirsk, Russia, 1999; ISBN 5-7692-0237-8. [Google Scholar]
- Wilkins, M.L. Computer Simulation of Dynamic Phenomena; Scientific Computation; Springer: Berlin/Heidelberg, Germany, 1999; ISBN 978-3-642-08315-0. [Google Scholar]
- Kraus, E.I.; Shabalin, I.I. A Few-Parameter Equation of State of the Condensed Matter. J. Phys. Conf. Ser. 2016, 774, 012009. [Google Scholar] [CrossRef]
- Kraus, E.; Shabalin, I. Melting behind the Front of the Shock Wave. Therm. Sci. 2019, 23, 519–524. [Google Scholar] [CrossRef] [Green Version]
- Maenchen, G.; Sack, E. The Tensor Code. In Methods in Computational Physics, v.3, Fundamental Methods in Hydrodynamics; Alder, B., Fernbach, S., Rotenberg, M., Eds.; Academic Press: New York, NY, USA, 1964; p. 221. [Google Scholar]
- Tuler, F.R.; Butcher, B.M. A Criterion for the Time Dependence of Dynamic Fracture. Int. J. Fract. Mech. 1968, 4, 322–328. [Google Scholar] [CrossRef]
- Johnson, G.R.; Stryk, R.A. Conversion of 3D Distorted Elements into Meshless Particles during Dynamic Deformation. Int. J. Impact Eng. 2003, 28, 947–966. [Google Scholar] [CrossRef]
- Kraus, E.I.; Shabalin, I.I. A New Model to Determine the Shear Modulus and Poisson’s Ratio of Shock-Compressed Metals up to the Melting Point. High Press. Res. 2021, 41, 353–365. [Google Scholar] [CrossRef]
- Kraus, E.I.; Shabalin, I.I.; Shabalin, T.I. Numerical Analysis of Wave Propagation in a Cermet Composite. In AIP Conference Proceedings; AIP Publishing LLC: New York, NY, USA, 2017; Volume 1893, p. 030130. [Google Scholar]
- Kraus, A.E.; Kraus, E.I.; Shabalin, I.I. Simulation of a Group Impact on a Heterogeneous Target of Finite Thickness. J. Sib. Fed. Univ. Math. Phys. 2021, 14, 1–12. [Google Scholar] [CrossRef]
- Kraus, A.E.; Kraus, E.I.; Shabalin, I.I. A Heterogeneous Medium Model and Its Application in a Target Perforation Problems. In Multiscale Solid Mechanics. Advanced Structured Materials; Altenbach, H., Eremeyev, V.A., Igumnov, L.A., Eds.; Springer: Berlin/Heidelberg, Germany, 2021; Volume 141, pp. 289–304. [Google Scholar]
- Hashin, Z. The Elastic Moduli of Heterogeneous Materials. J. Appl. Mech. 1962, 29, 143–150. [Google Scholar] [CrossRef]
- Hashin, Z.; Rosen, B.W. The Elastic Moduli of Fiber-Reinforced Materials. J. Appl. Mech. 1964, 31, 223–232. [Google Scholar] [CrossRef]
- Dremin, A.N.; Karpukhin, I.A. Method of Determining the Shock Adiabats for Disperse Materials. Zh. Prikl. Mekh. I Tekh. Fiz. 1960, 1, 184–188. [Google Scholar]
- Duvall, G.E.; Taylor, S.M. Shock Parameters in a Two Component Mixture. J. Compos. Mater. 1971, 5, 130–139. [Google Scholar] [CrossRef]
- Bakhvalov, N.; Panasenko, G. Homogenisation: Averaging Processes in Periodic Media; Mathematics and its Applications; Springer: Dordrecht, The Netherlands, 1989; Volume 36, ISBN 978-94-010-7506-0. [Google Scholar]
- Christensen, R.M. Mechanics of Composite Materials; Dover Publications: Mineola, NY, USA, 2005; ISBN 978-0486442396. [Google Scholar]
- Poole, L.L.; Gonzales, M.; Moustafa, A.R.; Gerlt, A.R.C.C.; Cordero, Z.C. Shock Dynamics in Periodic Two-Dimensional Composites. In AIP Conference Proceedings; American Institute of Physics Inc.: Melville, NY, USA, 2020; Volume 2272, p. 120020. [Google Scholar]
- Taylor, S.V.; Gonzales, M.; Cordero, Z.C. Shock Response of Periodic Interpenetrating Phase Composites. APL Mater. 2022, 10, 111119. [Google Scholar] [CrossRef]
- Baluch, A.H.; Park, Y.; Kim, C.G. High Velocity Impact Characterization of Al Alloys for Oblique Impacts. Acta Astronaut. 2014, 105, 128–135. [Google Scholar] [CrossRef]
- Kim, Y.H.; Lee, S.; Kim, N.J.; Cho, K.M. Effect of Microstructure on the Tensile and Fracture Behavior of Cast A356 AlSiCp Composite. Scr. Metall. Mater. 1994, 31, 1629–1634. [Google Scholar] [CrossRef]
- Hixson, R.S.; McQueen, R.G.; Fritz, J.N. The Shock Hugoniot of 316 SS and Sound Velocity Measurements. In AIP Conference Proceedings; AIP: Melville, NY, USA, 1994; Volume 309, pp. 105–108. [Google Scholar]
- Taylor, G.I. The Formation and Enlargement of a Circular Hole in a Thin Plastic Sheet. Q. J. Mech. Appl. Math. 1948, 1, 103–124. [Google Scholar] [CrossRef] [Green Version]


| Screen | Material of the Screen | Density, g/cm3 | Areal Density, g/cm2 | Thickness, mm |
|---|---|---|---|---|
| #1 [18] | Stainless steel 316L | 8.0 | 3.6 | 4.5 |
| #2 [18] | Aluminum alloy A356 | 2.7 | 3.24 | 12.0 |
| #3 [18] | Two-layer composite 316L/A356 | 4.8 | 3.6 | 7.5 |
| #4 [18] | Two-layer composite A356/316L | 4.8 | 3.6 | 7.5 |
| #5 [18] | Volume-reinforced composite | 4.8 | 3.6 | 7.5 |
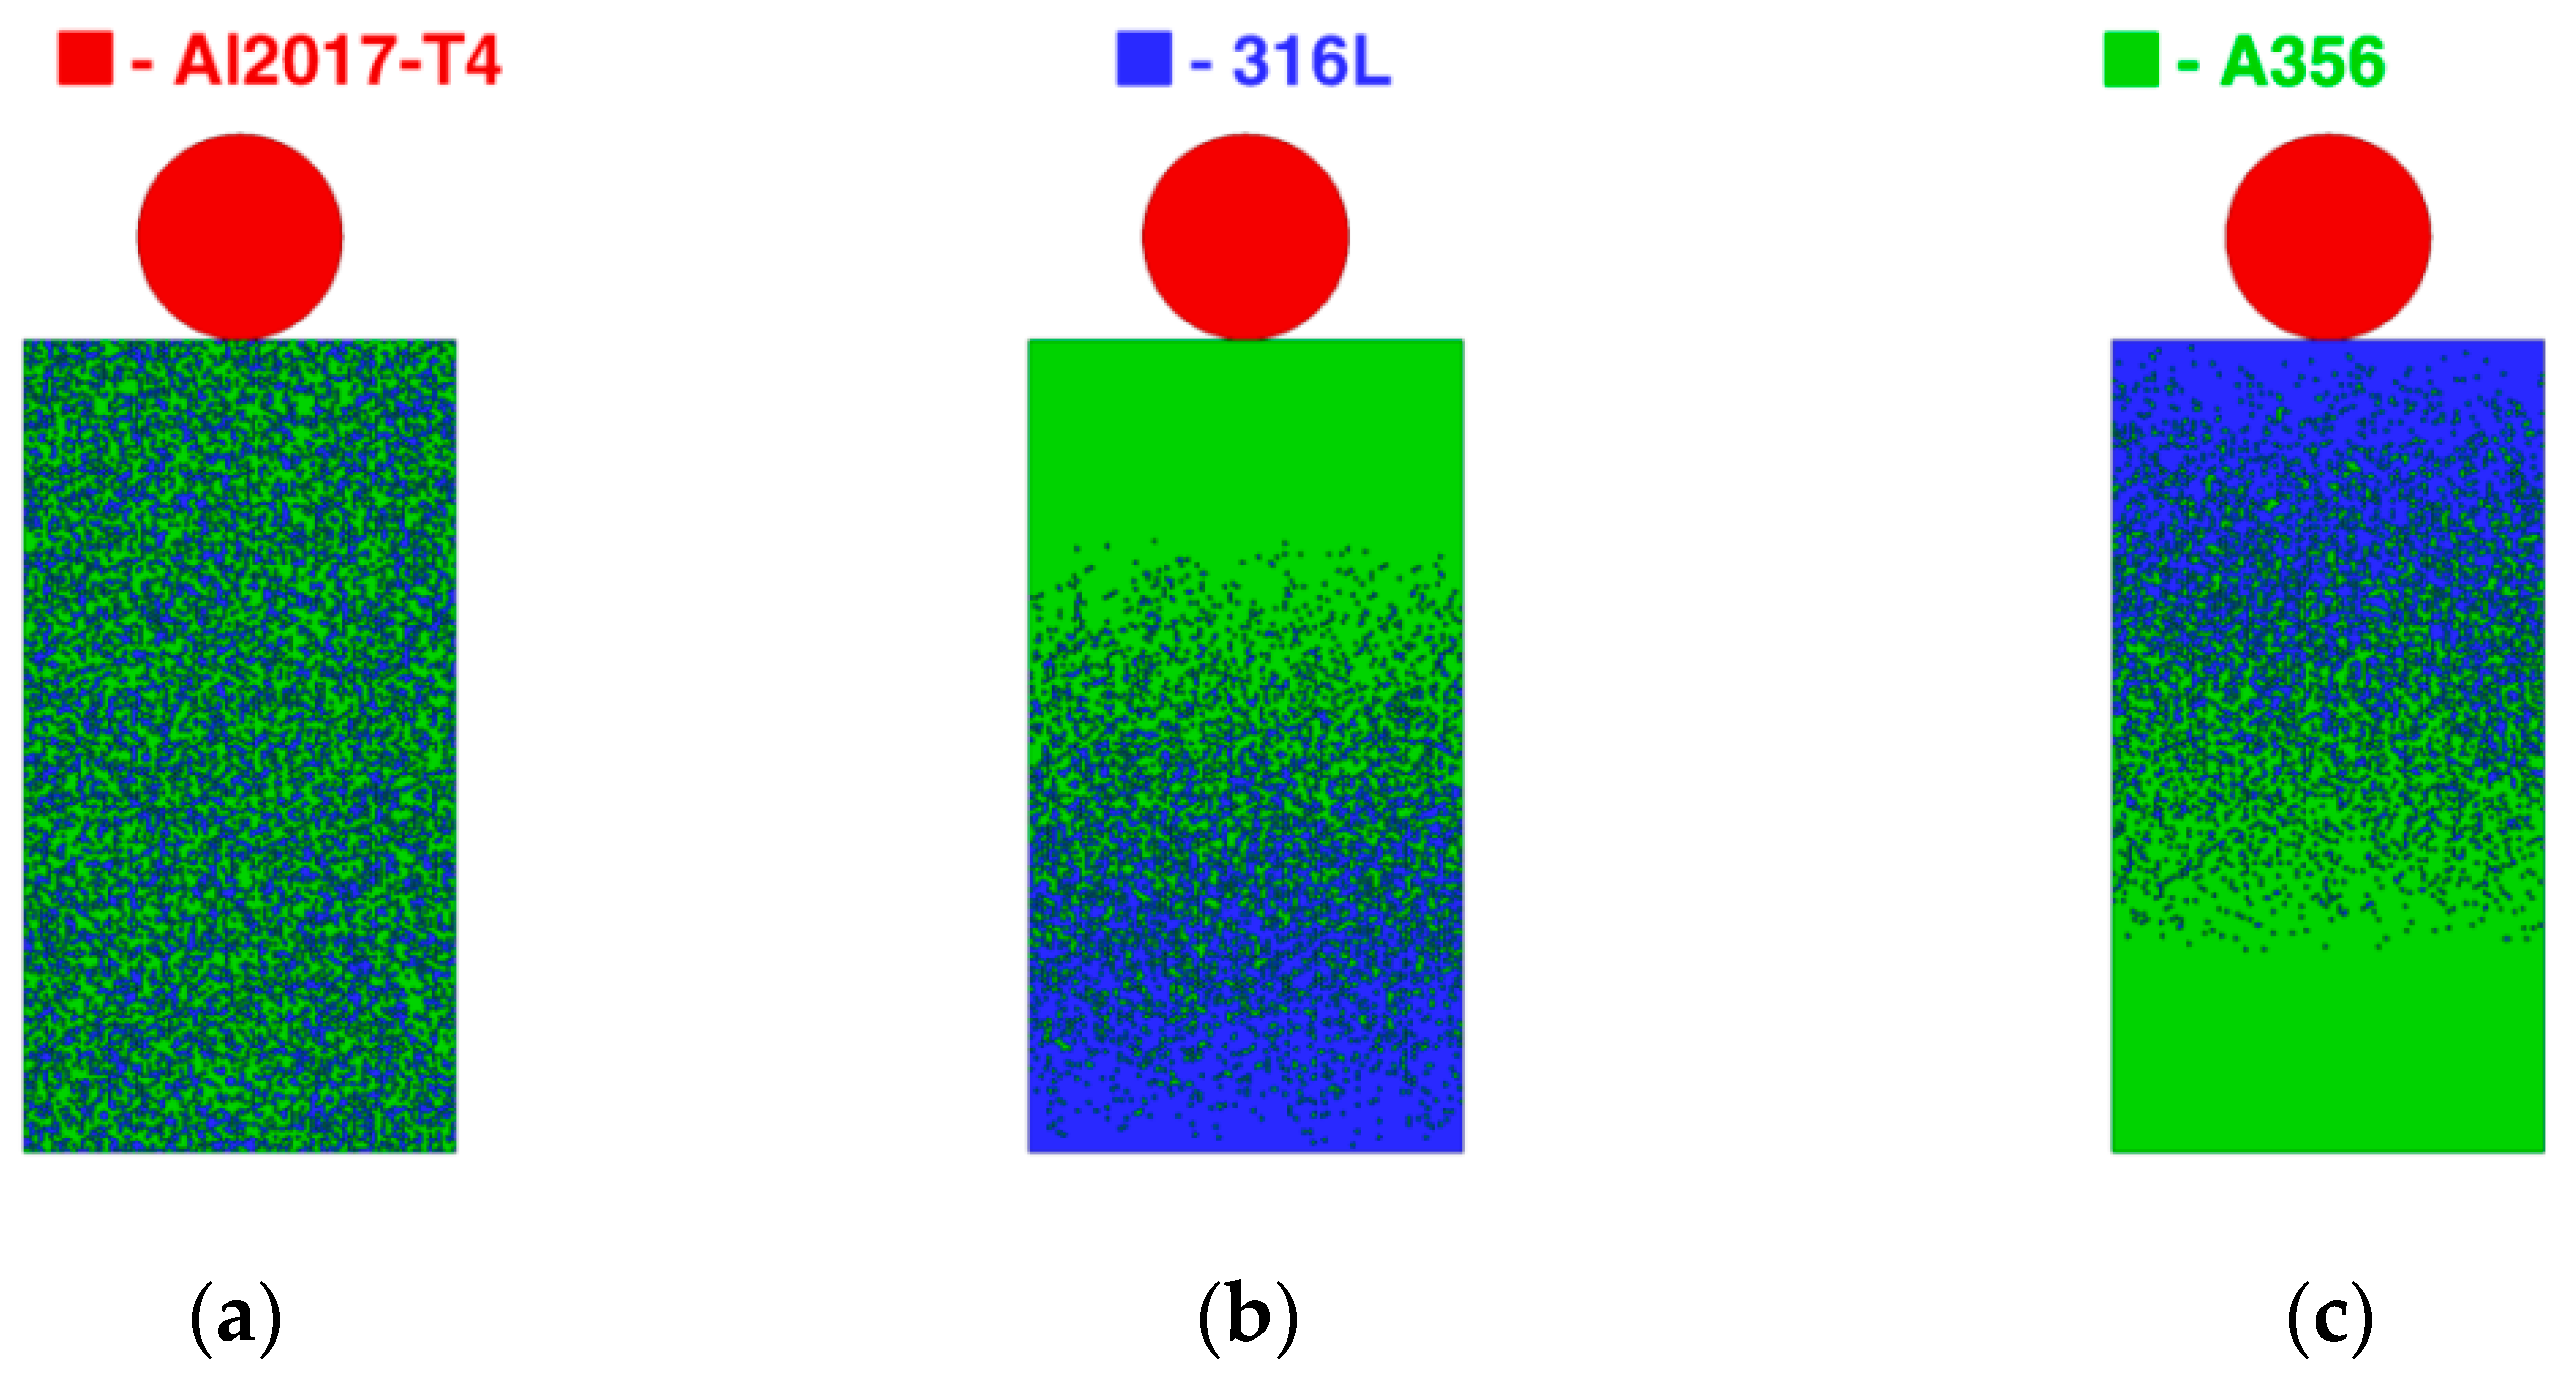
| #6 | Uniform distribution of 316L steel grains in an A356 matrix | 4.8 | 3.6 | 7.5 |
| #7 | Direct gradient distribution of 316L steel grains in an A356 matrix | 4.8 | 3.6 | 7.5 |
| #8 | Inverse gradient distribution of 316L steel grains in an A356 matrix | 4.8 | 3.6 | 7.5 |
| #9 | Aluminum alloy A356 | 2.7 | 3.6 | 13.4 |
| Screen Type | Experiment | Numerical Simulation | ||||||
|---|---|---|---|---|---|---|---|---|
| , mm | , mm | , mm3 | Spall | , mm | , mm | , mm3 | Spall | |
| #1 | 2.1 | 5.7 | 36 | spall | 2.30 | 5.60 | 31 | spall |
| #2 | 4.5 | 8.2 | 158 | spall | 4.86 | 7.20 | 133 | spall |
| #3 | 2.4 | 6.4 | 52 | spall | 3.70 | 5.35 | 55 | spall |
| #4 | 4.5 | 8.4 | 166 | no | 4.25 | 7.40 | 162.6 | no |
| #5 | 4.7 | 8.0 | 55 | delamination | 3.28 | 6.38 | 63 | single grain detachment |
| #6 | - | - | - | - | 3.20 | 5.84 | 54 | single grain detachment |
| #7 | - | - | - | - | 3.62 | 6.63 | 78 | no |
| #8 | - | - | - | - | 3.01 | 5.47 | 39 | spall |
| #9 | - | - | - | - | 4.67 | 7.42 | 134 | spall |
| , GPa | , GPa | , m/s | , GPa | , GPa | , % | ||
|---|---|---|---|---|---|---|---|
| A356 | 73.95 | 26.00 | 5392 | 0.270 | 0.20 | 0.27 | 0.045 |
| 316L | 130.00 | 79.00 | 4464 | 1.544 | 0.75 | 2.50 | 0.05 |
| Al2017-T4 | 75.71 | 27.86 | 5538 | 1.338 | 0.28 | 0.456 | 0.12 |
| Error/Screen | #1 | #2 | #3 | #4 | #5 |
|---|---|---|---|---|---|
| Error depth % | 9.5 | 8.0 | 12.5 | 5.6 | 30.2 |
| Error diameter % | 1.8 | 12.2 | 16.4 | 11.9 | 20.2 |
| Error volume % | 13.9 | 15.8 | 5.8 | 2.1 | 14.5 |
Disclaimer/Publisher’s Note: The statements, opinions and data contained in all publications are solely those of the individual author(s) and contributor(s) and not of MDPI and/or the editor(s). MDPI and/or the editor(s) disclaim responsibility for any injury to people or property resulting from any ideas, methods, instructions or products referred to in the content. |
© 2023 by the authors. Licensee MDPI, Basel, Switzerland. This article is an open access article distributed under the terms and conditions of the Creative Commons Attribution (CC BY) license (https://creativecommons.org/licenses/by/4.0/).
Share and Cite
Kraus, A.; Buzyurkin, A.; Shabalin, I.; Kraus, E. Numerical Modelling of High-Speed Loading of Periodic Interpenetrating Heterogeneous Media with Adapted Mesostructure. Appl. Sci. 2023, 13, 7187. https://doi.org/10.3390/app13127187
Kraus A, Buzyurkin A, Shabalin I, Kraus E. Numerical Modelling of High-Speed Loading of Periodic Interpenetrating Heterogeneous Media with Adapted Mesostructure. Applied Sciences. 2023; 13(12):7187. https://doi.org/10.3390/app13127187
Chicago/Turabian StyleKraus, Alexander, Andrey Buzyurkin, Ivan Shabalin, and Evgeny Kraus. 2023. "Numerical Modelling of High-Speed Loading of Periodic Interpenetrating Heterogeneous Media with Adapted Mesostructure" Applied Sciences 13, no. 12: 7187. https://doi.org/10.3390/app13127187
APA StyleKraus, A., Buzyurkin, A., Shabalin, I., & Kraus, E. (2023). Numerical Modelling of High-Speed Loading of Periodic Interpenetrating Heterogeneous Media with Adapted Mesostructure. Applied Sciences, 13(12), 7187. https://doi.org/10.3390/app13127187