
Calibrating of a Simulation Model to Predict the Flexural Capacity of Pre-Stressed Concrete Beams

1
Department of Plant Production and Agricultural Technology, Campus Universitario, University of Castilla-La Mancha, s/n, 02071 Albacete, Spain
2
School of Agricultural, Food and Biosystems Engineering, Polytechnical University of Madrid, Avda. Puerta de Hierro, 2, 28040 Madrid, Spain
*
Author to whom correspondence should be addressed.
Appl. Sci. 2023, 13(13), 7477; https://doi.org/10.3390/app13137477
Submission received: 19 April 2023
/
Revised: 19 June 2023
/
Accepted: 23 June 2023
/
Published: 25 June 2023
(This article belongs to the Special Issue Advances in Technology Applied in Agricultural Engineering)
Abstract
:Simulation models based on finite elements are currently indispensable tools for predicting the structural behavior of both reinforced and pre-stressed concrete elements. This work develops a simulation model of structural linear elements of pre-stressed concrete, using the finite element method (FEM). The main aim was to calibrate the model to predict the flexural capacity of structural elements, and so be able to undertake a double optimization through the design and the resistant behavior of the elements. Different flexural experiments were conducted in laboratory conditions on real concrete elements of different types (pre-stressed joist and tubular pre-stressed joist). In parallel, the same structural elements were analyzed by MEF simulation to calibrate the model to the real experiments. FEM analysis was performed using the ATENA software developed by Červenka Consulting (Czech Republic), especially recommended for the analysis of structural concrete elements using non-linear methods. The model was calibrated using the results obtained in real load test experiments obtained in a loading frame of 500 kN capacity. The calibration analysis shows a good fit of the results to the actual test experiments, obtaining average errors of 6% in the analysis–experiment comparison. The results of the simulation suggest that to obtain the optimum strength levels for the different typologies analyzed, it is essential to control the pre-stressing losses in the manufacturing process of the joist. The flexural capacity of all elements can be increased by around 20–30% when the real pre-stressing losses are fitted to the theoretical ones estimated.
1. Introduction
Modeling using the finite element method (FEM) is a key advance in the design of complex elements, as it allows the different designs of an element to be analyzed prior to manufacture, with the results for behavior closely fitting to those that the actual element will have. With these techniques, which are widely used in many sectors, the design, optimization and production processes of elements are streamlined, making it possible to have the final product available in less time, with corresponding economic savings for the manufacturer.
In the field of structural concrete, classic theories of analysis, together with experience, have long been sufficient to provide a solution to simple construction elements. However, as technological and social development have advanced, new construction problems have appeared for which classic theories are unable to provide a reliable answer, and hence, many authors have proposed the use of the FEM to find a practical solution. Thus, applying the FEM to the modeling of the behavior of reinforced concrete has been, and continues to be, extensively studied by many authors. An excellent review on the literature on the application of FEM for linear and non-linear analysis of reinforced concrete structures was conducted by the American Society of Civil Engineers [1,2,3].
Numerical modeling of reinforced concrete beams has been studied by the scientific community since the 1980s [4], with research topics including constitutive relationships, steel–concrete bond models, material failure criteria and finite element technology [5,6,7].
The different studies suggest that the development of the constitutive models describing the behavior of materials and the non-linear solution of the physical problem yield numerical results that are substantially similar to those obtained in laboratory tests. Studies on the non-linear analysis of concrete focus on solving the cracking response in structural elements, such as beams, floors or walls, caused by tensile stresses. Thus, a multitude of specific models have been generated which advance the knowledge on the behavior of this heterogeneous material, with the responses provided now being very close to that of the real elements [8,9].
The constitutive models used to describe the non-linear behavior of materials have a decisive impact on the structural response of the beam analyzed [10]. Thus, the beams analyzed by this author under distributed loading show that, depending on the constitutive model implemented, the load capacity and deflections of the numerical results differ from the results obtained experimentally.
Wolansky [7] studied the non-linear behavior of reinforced and pre-stressed concrete beams using the linear and volumetric elements of the commercial ANSYS program for the simulation of concrete and steel. Gómez [11] and Osorio [12] used the ANSYS program to analyze the influence of the non-linearity of materials on deflections of reinforced concrete beams, considering specifically the interaction between steel and concrete by means of a special finite element, obtaining interesting results with respect to beams tested in a laboratory.
Finite element modeling has been used to study other aspects, such as the influence of longitudinal reinforcement on the flexural response of beams [13] or the application of concrete with steel fibers [14,15,16,17]. The list of new experiments is constantly growing, underlining the importance of finite element modeling in the design of specific concrete elements and the knowledge of new situations where this material is applied.
Calculation tools are now appearing, the operation of which integrates the main models, and research efforts are being concentrated on verifying the functionality of this implementation, comparing the analyses with actual experiments [18,19]. Tools, such as ANSYS, ABAQUS and SOLIDWORKS, have emerged, with finite elements and constitutive models adapted to a greater or lesser extent to reproduce the behavior of reinforced concrete. However, in general, material models in finite element calculation tools implement constitutive models of generic materials. Therefore, in order to use them, the different parameters governing the equations must be given values according to the properties of the concrete to be modeled. This entails calibrating the model starting from zero in its different states of behavior, and it is thus sometimes necessary to configure complex curves with some uncertainty, making it difficult to adapt the material to the final outcome, since the knowledge to do so is not always available.
This problem has led to the emergence of other tools specifically designed for the modeling of concrete elements. This is the case of the commercially available ATENA tool, developed by Červenka Consulting (Czech Republic), and designed as a calculation software using the finite element method specifically for the non-linear analysis of reinforced concrete. It uses constitutive models that allow for the auto-completion of the values based on the desired compressive strength, and from which the rest of the values established in the characteristics described in Eurocode 2 [20] are completed. Of these tools, the most noteworthy is the CC3DNonLinCementitious2 model, which reproduces the behavior of concrete, assuming a hardening regime before the compressive stress is reached [21]. The ATENA tool allows the real behavior of conventional concrete and reinforced concrete structures to be simulated in a simple way, including important parameters, such as concrete cracking, crushing and reinforcement stress.
This tool has been widely used with satisfactory results that adequately reproduce those of actual experiments. Červenka et al. [22] used the tool to model real flexural tests on beams conducted by Bosco and Debernardy [23] and on elements subjected to compression performed by Nakamura [24], with results that very closely replicate those of the actual experiments.
Bendito et al. [25] used the tool to model the behavior of a beam–column element, analyzing the effect of different variables and calibrating the tool with real experiments to model structures with a similar behavior. Other scientific experimentations using the ATENA tool with satisfactory results include the works by [26,27,28,29].
Červenka [30] presented multiple validations and real applications of the tool, including a comparison with the experiment conducted by Leonhardt [31], where a simple beam with a shear rupture was analyzed, obtaining load and cracking values similar to those of said experiment.
The aim of this work was to develop a finite element simulation model which allows the behavior of different pre-stressed concrete linear structural elements to be simulated, comparing the simulation results with those of experimental tests. This model, once verified and calibrated, can serve as a tool to design, calculate and manufacture new and more complex structural elements. The ATENA tool has been used to achieve this objective.
2. Materials and Methods
2.1. Structural Elements Studied
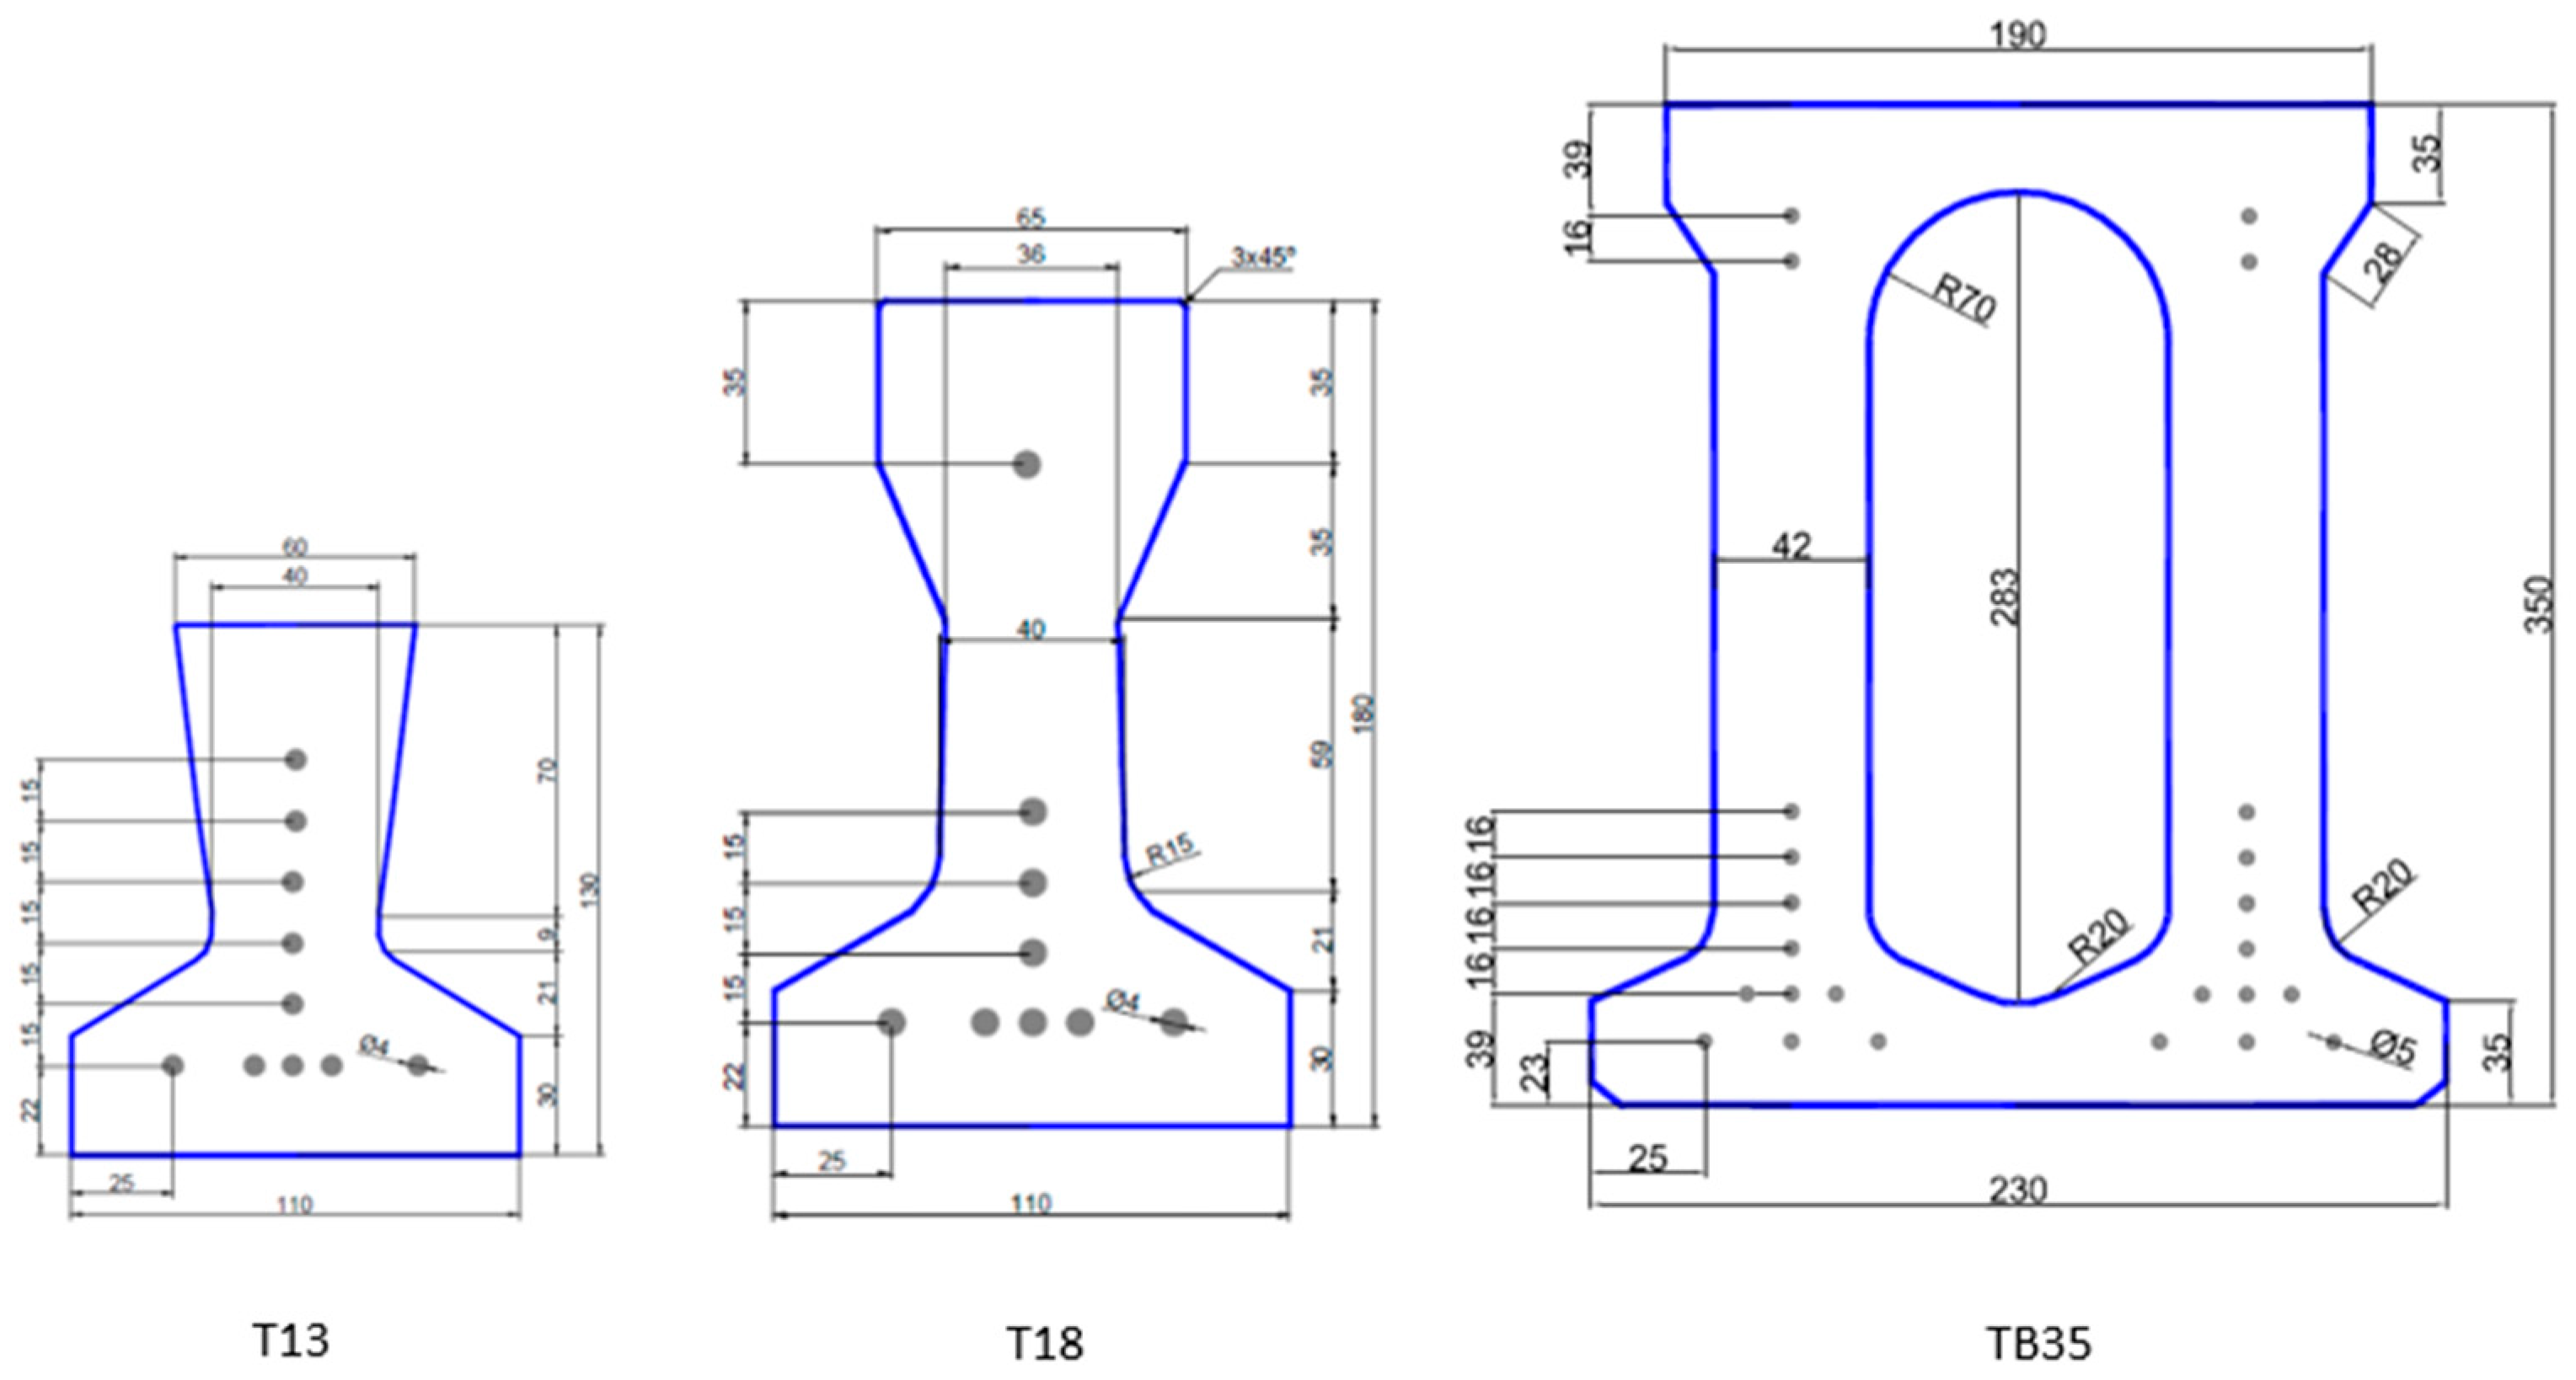
Different pre-stressed concrete linear elements were used: T13 and T18 self-resistant joists, and TB35 tubular joists (Figure 1) with different amounts of reinforcement. These elements were manufactured with HP-40 concrete (fck 40 N/mm2) and Y1860C active steel reinforcement (fyk 1667 N/mm2). The wire diameters were 4 mm for the T13 and T18 joists, and 5 mm for the TB35 joists, with an initial pre-stressing force of 1275 N/mm2.
We used both weakly reinforced elements with a low cross-section (T13 and T18) and more resistant elements (TB35), where the cross-section and reinforcement lend greater resistance to bending. Thus, in beams with low reinforcement, the resistance and the rotational capacity are mainly determined by the elastic resistance capacity of the reinforcement and its critical elongation at rupture. In highly reinforced beams, these properties are controlled by the capacity of the compressed section to absorb deformations in compression without significant softening of the concrete. Table 1 shows the main characteristics of the elements analyzed both experimentally and analytically.
In the table, losses refer to the decrease in the final pre-stressing force transmitted to the concrete from the initial pre-stressing force of the steel bars forming the reinforcement (1275 N/mm2). The resistance characteristics are those corresponding to the calculated estimation of these sections. The subtype in each joist is related to the level of reinforcement, such that the higher the level of reinforcement, the higher the index.
2.2. Experimental Flexural Tests
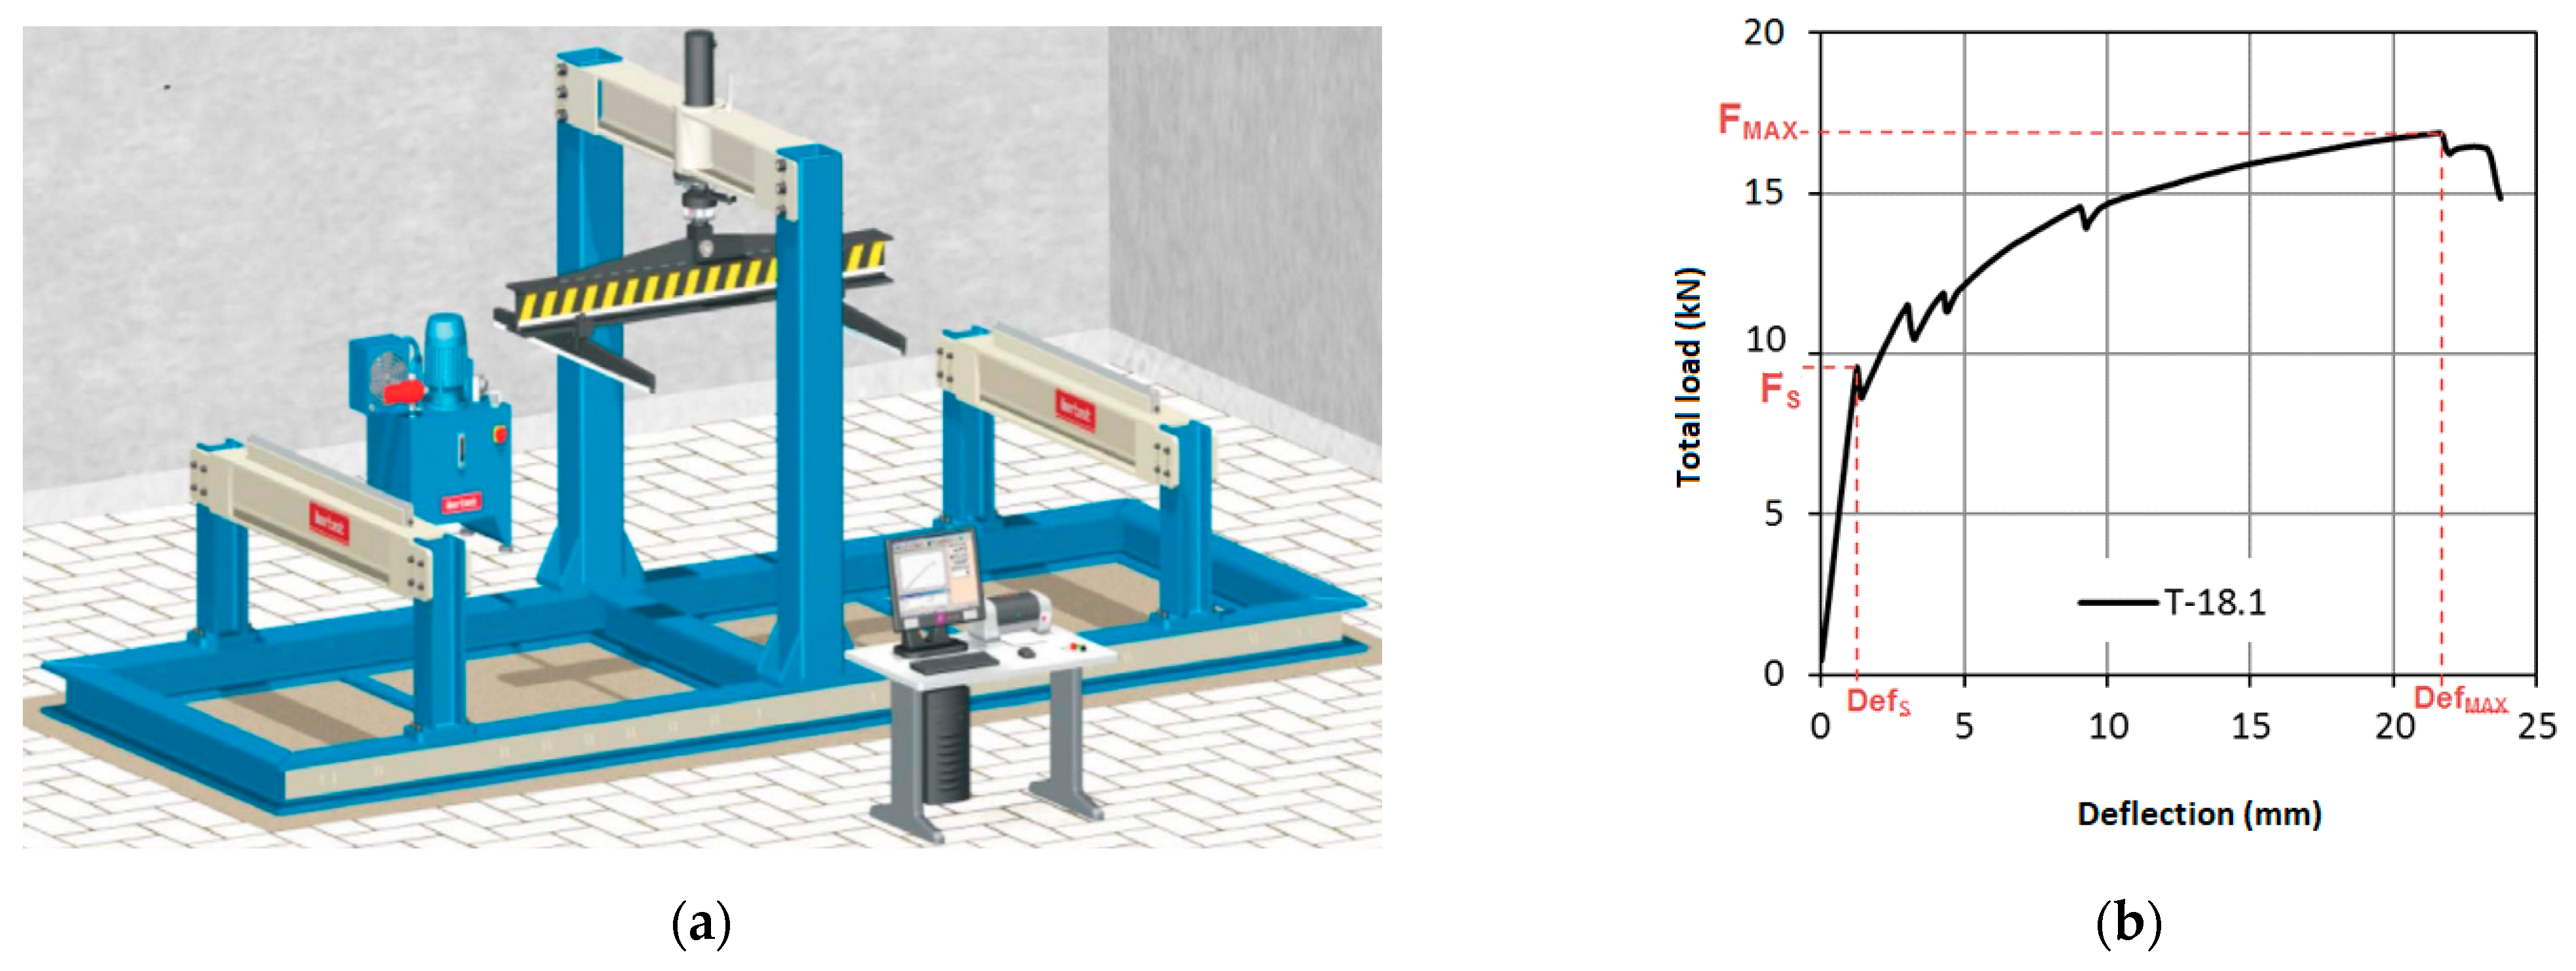
The experimental tests were conducted using a free-standing gantry (Figure 2a) for testing flexural elements, located in the Construction and Geotechnical Laboratory at the Higher Technical School of Agricultural and Forestry Engineering and Biotechnology at the University of Castilla-La Mancha (Albacete, Spain). It is a gantry especially designed for the mechanical flexural characterization of pre-cast or reinforced concrete elements (hollow core slabs, beams, joists, etc.).
To carry out the experimental tests, the recommendations published by the Eduardo Torroja Institute were followed, extrapolating the indications of the UNE-EN 12390-4 standard to determine the flexural strength of concrete specimens. Two to three repetitions of each type of element tested were performed according to the elements supplied.
In these tests, the corresponding load and displacement readings of the central point were recorded, which allow the diagram to be configured until rupture. In addition, the cracks obtained were characterized by high-resolution video, and the cracking map was then developed to compare it with that obtained in the simulation. The force was obtained by means of a 500 kN load cell located in the loading piston, while the deformation was obtained using a 0.01 mm precision LVDT deformimeter. The recorded measurements were plotted in a FORCE—DEFORMATION diagram to be compared to the analytical tests (Figure 2b). These diagrams were used to determine the following: the CRACKING FORCE (Fs) (load supported by the element at the instant the first crack appears, after which the concrete and steel begin to work together); the BREAKING FORCE (FMAX) (maximum load that the element is able to withstand before total rupture); and the CRACKING DEFORMATION (DefS) and RUPTURE DEFORMATION (DEFMAX) (deformation values measured in the beam at the moment of the first crack or the failure of the beam, respectively).
2.3. Finite Element Modeling
The ATENA Science v4 tool, from Cervenka Consulting (Prague, Czech Republic), was used to estimate the analytical models of the elements described above. This application was used to conduct the analysis and post-processing of the results. The tool was developed in the GID environment of International Center for Numerical Methods (Polytechnic University of Catalonia); it was used to perform the geometry of the model, and to apply its own constitutive models and boundary conditions. The type of analysis it performs is a NON-LINEAR analysis of reinforced concrete. The main characteristics of the model used are the following:
2.3.1. Boundary Conditions
- RESTRICTIONS. At three levels: supports, symmetry and contact between elements.
- (a)
- Supports: a restriction is applied to the centerline of the support plate, coincident with the support point of the beam in the real test. The movement is restricted for the X and Y axes, avoiding that the piece moves vertically.
- (b)
- Symmetry: The simulation model is built for half a beam. On the face corresponding to the vertical symmetry axis, a restriction to the surface is introduced, restricting the movement in the X and Z axes. This allows to reproduce the symmetry of the model taking into account the continuity of the analyzed element.
- (c)
- Contacts: To ensure contact between the top and bottom faces of the beam with the corresponding surfaces of the support plates and of application of the load, it is applied contacts between these elements.
- LOADS.
- (a)
- External load application: the load step is introduced by means of a prescribed displacement in the vertical Y axis, applied at the center of the load plate.
- (b)
- Initial horizontal deformation due to prestressing: to simulate the effect of the initial prestressing force, an initial stretch deformation of 0.006375 mm/mm is applied.
- MONITORING POINTS
- (a)
- Control of the applied force: One at the same point of application of the prescribed displacement (center point of the load plate), to collect the output data of the Y-axis reactions.
- (b)
- Strain control in the center of the beam: located in the lower part of the central section of the beam.
- (c)
- Control of the deformation at the point of application of the load: which records the millimeters that the load arm descends during the analysis.
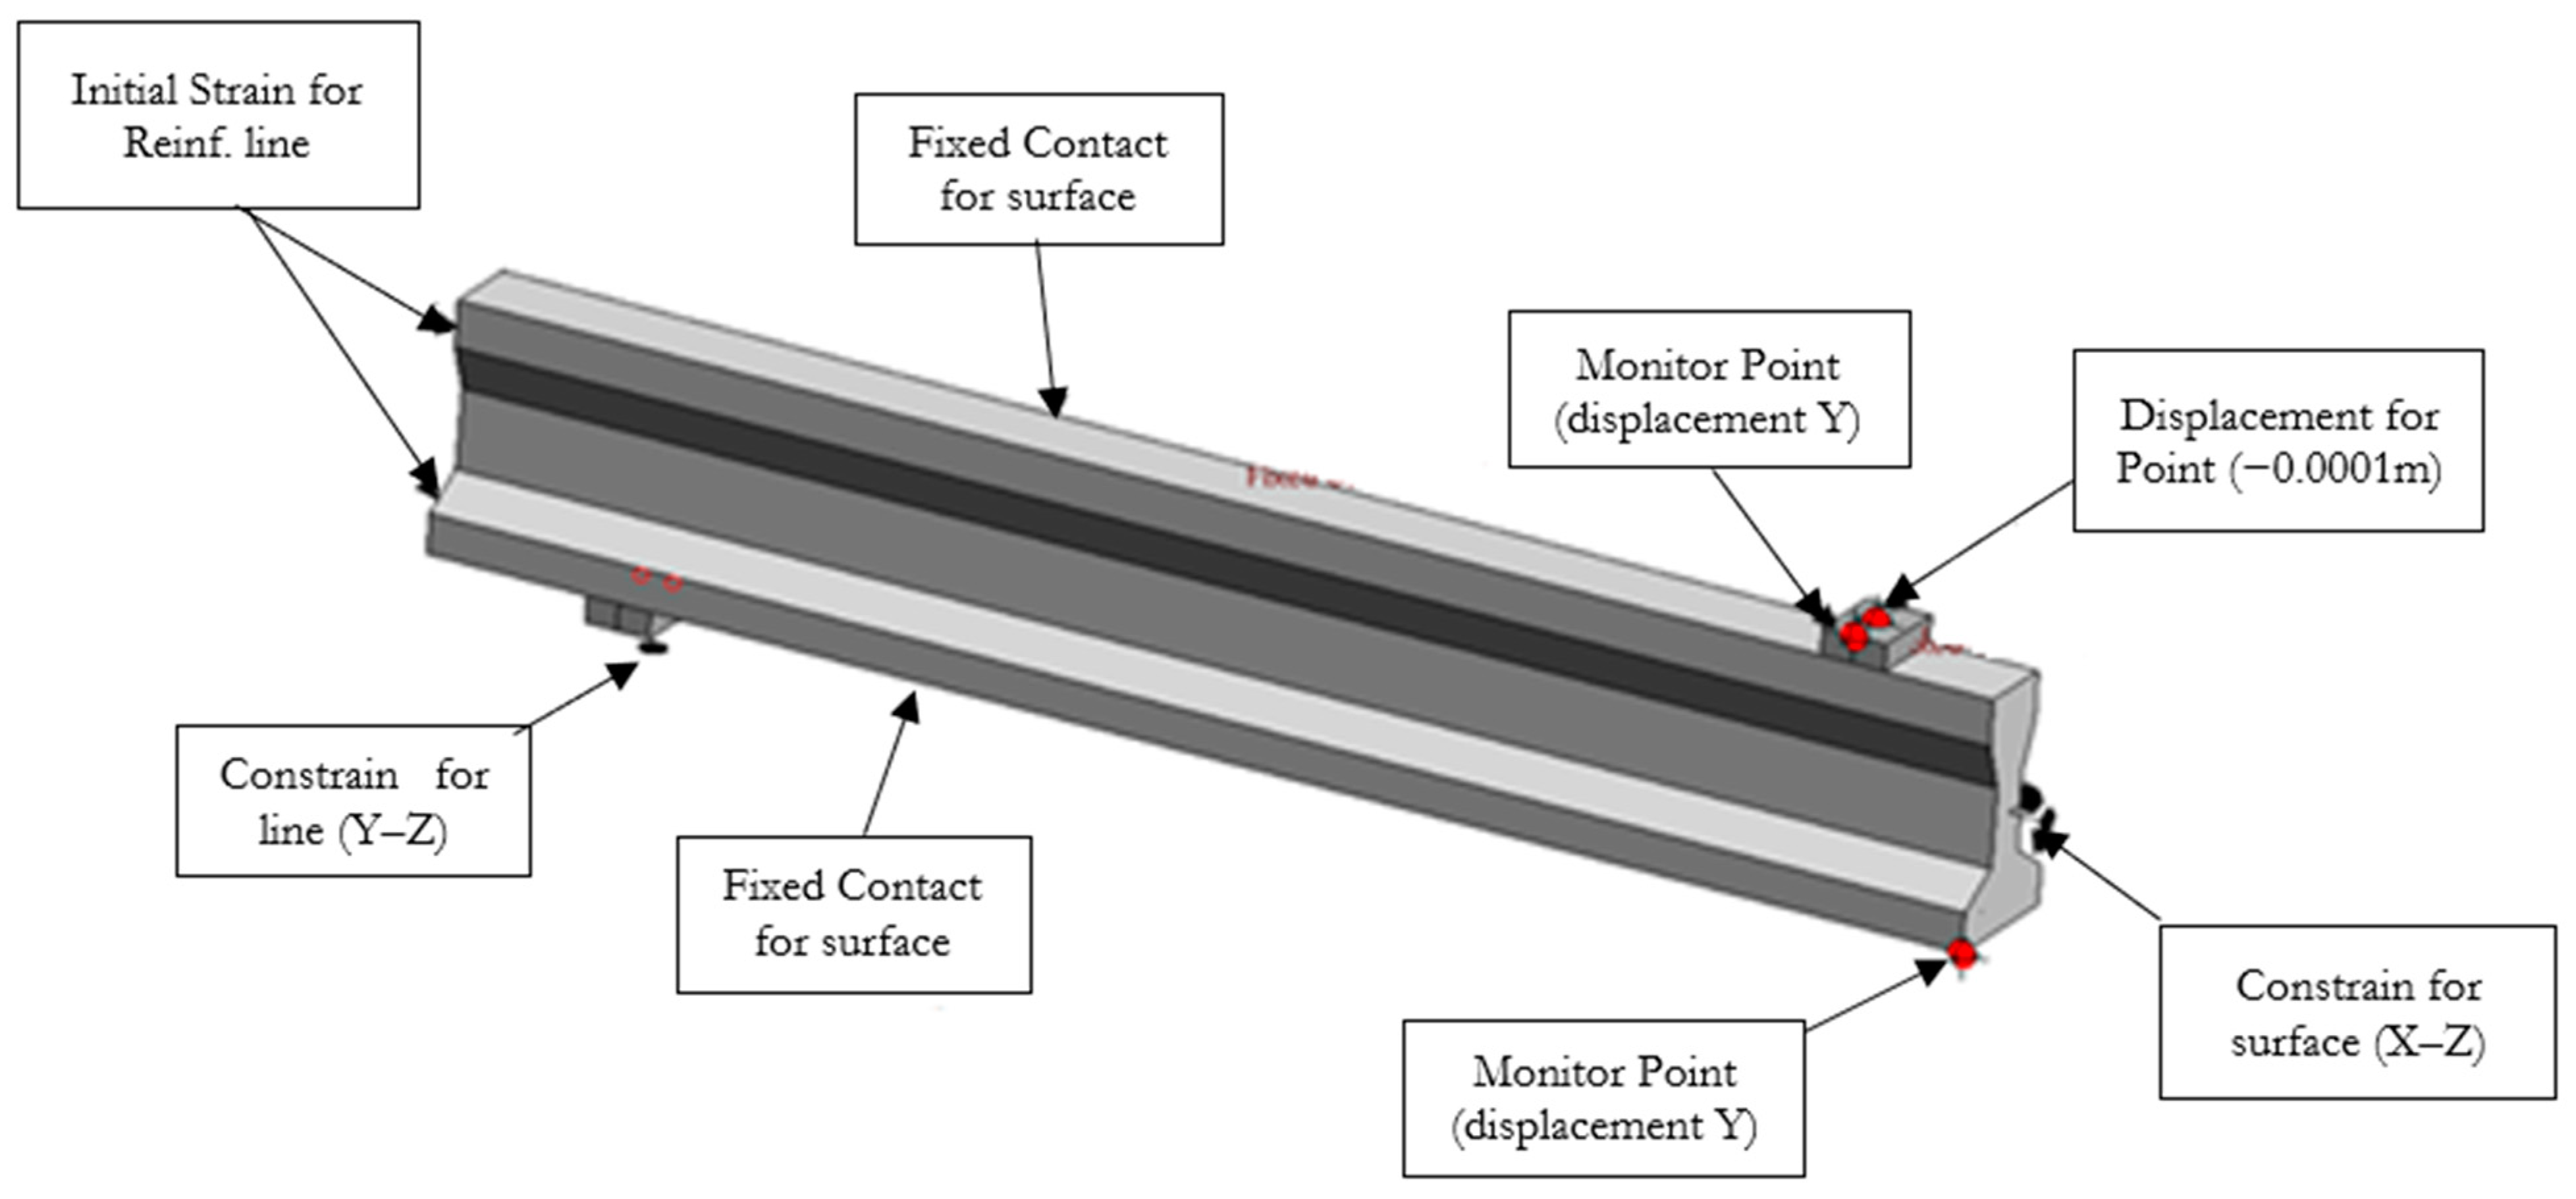
Figure 3 shows a summary of all the boundary conditions assigned to each of the pieces used for the simulation.
2.3.2. Materials
- CONCRETE. The specific concrete constitutive model CC3DNonLinCementitious2 was used. It reproduces the non-linear behavior of concrete, assuming a hardening regime prior to the compressive stress being reached, which is based on plastic fracture failure mechanisms combining constitutive models for tensile and compressive behavior. The parameters of the model were configured according to the corresponding strength classes in the experimentation, which are among those described in Eurocode 2 [20] for the actual compressive strength of elements. There are 22 parameters that define this material model, but the main ones are: compression strength, tensile strength, elasticity modulus, fracture energy and deformation to the highest peak compression.
- REINFORCEMENT. The reinforcement model used was 1DCCreinforcement, which follows the embedded reinforcement with bond approach described in [32]. This model was applied to linear elements crossing the volumetric finite elements corresponding to the concrete. Thus, the element for each reinforcement is described by the basic parameters of bar diameter, steel strength and modulus of elasticity, among others, which define its behavior, such as the type of bar (rebar or cable) or the bonding conditions of the reinforcement. There are a total of 15 basic parameters and 16 other parameters that define the adhesion conditions [30].
- STEEL IN AUXILIARY ELEMENTS. Small metallic elements were simulated at the load application points to avoid stress concentration on a node of the element. These elements without analytical interest were modelled by means of an elastic–linear material model with a modulus of elasticity of 210,000 MPa.
Thus, the concrete is of a C45-55 type according to the resistance properties of Eurocode 2, while the steel is type Y1860C.
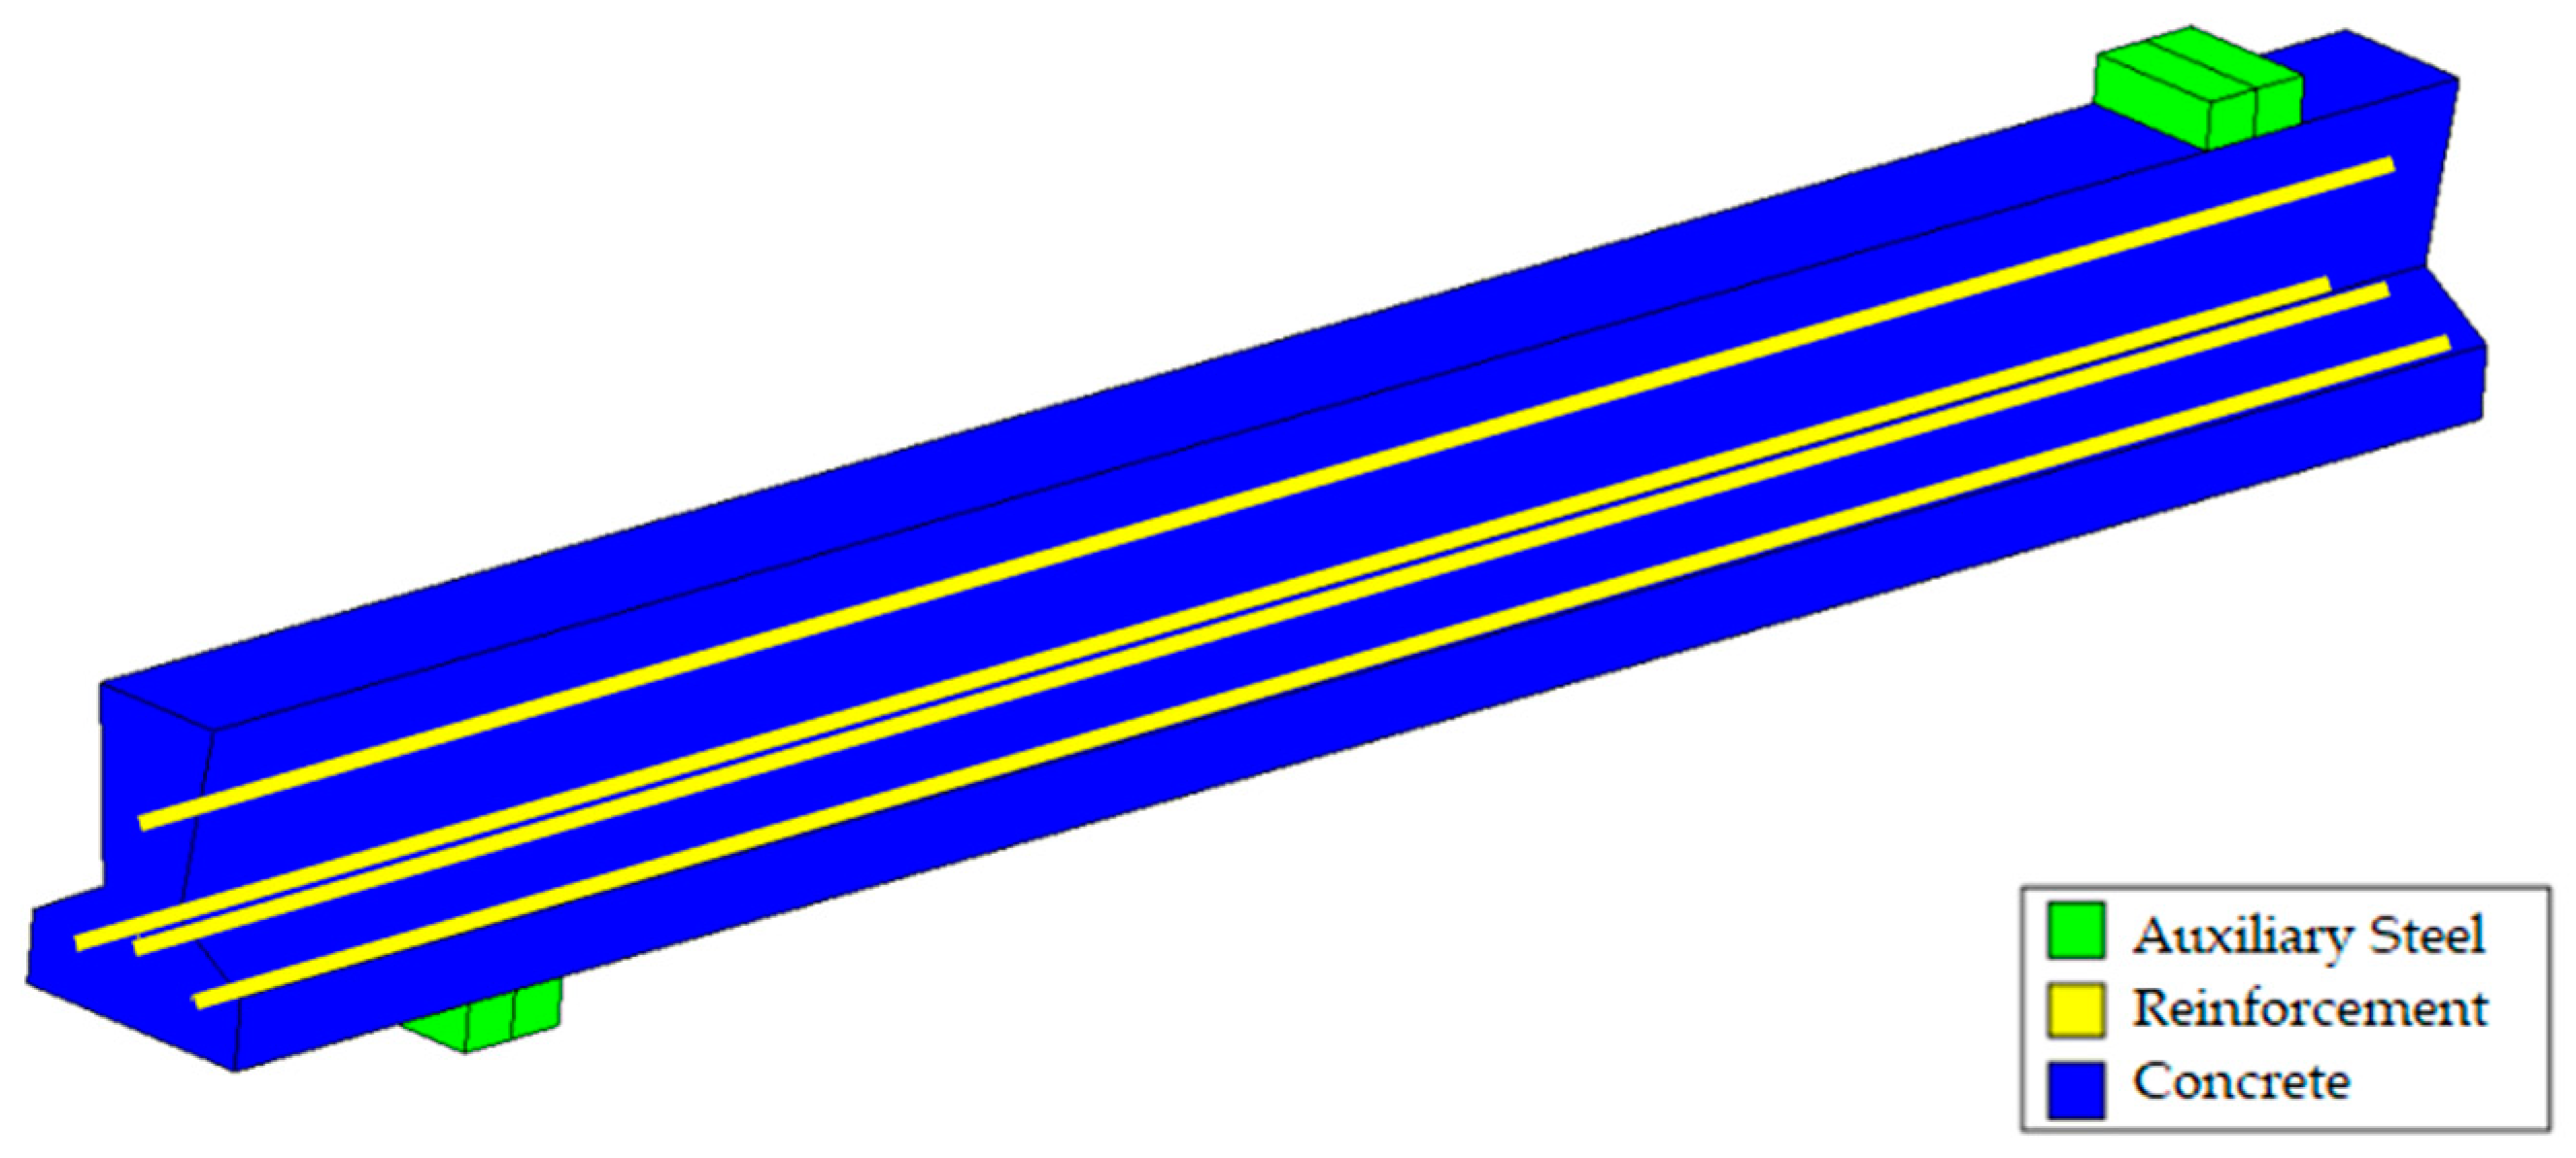
Figure 4 shows the materials that make up the beam model.
2.3.3. Meshing of the Joist
The meshing configuration of the model is of great influence to both the accuracy of the results and the speed of resolution.
Each material model is meshed separately (Figure 5).
The concrete beam was reproduced by means of solid elements, which were subsequently meshed using hexahedral elements, with a size of approximately 20–30 mm.
Since it is an irregular solid, a semi-structured mesh type is used. Furthermore, the reinforcements were modeled by means of line elements meshed into a single element from beginning to end.
To mesh the support plates, regular and uniform meshes are designed, also with volume elements of the hexahedron type. As they are auxiliary elements and not the object of analysis, it is sufficient to divide each of them into 4–6 elements.
2.3.4. Configuration of the Analysis
The simulation was configured to obtain the complete load-displacement pattern even after reaching plastification of the reinforcements or softening of the concrete, and so be able to characterize the behavior of the joist for it to be compared with that obtained in the experimental analysis. Thus, the simulation was configured using a prescribed deformation at the load application points, which allows a displacement-controlled test to be simulated.
To simulate the pre-stressing losses of the model, a pre-loading step was incorporated, in which volumetric shrinkage was applied as a boundary condition to each reinforcement, such that, depending on the section of the reinforcement, the value of the shrinkage was determined as a function of its modulus of elasticity.
This prescribed controlled deformation situation allows the classic Newton–Raphson method to be used, and furthermore, obtain the complete solution of the behavior of the element analyzed, even after its maximum resistance is reached. To obtain the stresses and displacements, the ATENA tool uses monitoring points that collect the information desired. Thus, two monitoring points are configured, one for the reaction at the point of load application and another to determine the deformation.
2.3.5. Model Calibration
The calibration was performed with the two main elements that seek to address the most extreme situations of failure of an element: (a) a weakly reinforced situation where tensile failure of the reinforcement is expected (joist T18-1) and (b) a highly reinforced element, where rupture occurs due to concrete fatigue (joist TB35.5).
The parameters used for the calibration were as follows:
- Compressive strength. The initial compressive strength value was not modified in the tests, since, to calibrate the model, we used the actual values determined in the manufacturer’s quality control process, involving the corresponding concrete compressive strength tests.
- Initial modulus of elasticity. In addition to the previous parameter, the model response requires a small calibration of the first part of the curve, which is controlled by the modulus of elasticity of the concrete and for which no real data were available to incorporate into the model. Thus, we analyzed rates of 28,000, 32,000 and 36,000 N/ mm2.
- Tensile Strength and Energy Fracture. These characteristics of concrete affect the tensile strength of the elements. The tensile strengths analyzed were 2.8, 3.5 and 4.2 MPa, while the fracture energy values analyzed were 7.0, 9.5 and 13.0 GPa.
- Pre-stressing losses. The loss of the initial pre-stressing force was estimated according to the theoretical calculation results in simulations with a resistance higher than the actual resistance, both in highly reinforced and weakly reinforced elements. Thus, the pre-stressing losses were analyzed for 5 rates: 0% (no losses), 25%, 35%, 45% and 55%.
- Bond strength. As well as the response of the curve, another factor that determines the failure of the elements is the strength of the bond of the reinforcements to the concrete. Given the difficulty of experimentally determining this parameter, as in the previous case, the simulation of this factor was performed by changing variables with values of 4, 8 and 12 MPa.
3. Results and Discussion
The results obtained in this study are described below. Greater detail can be found in [34].
3.1. Experimental Tests
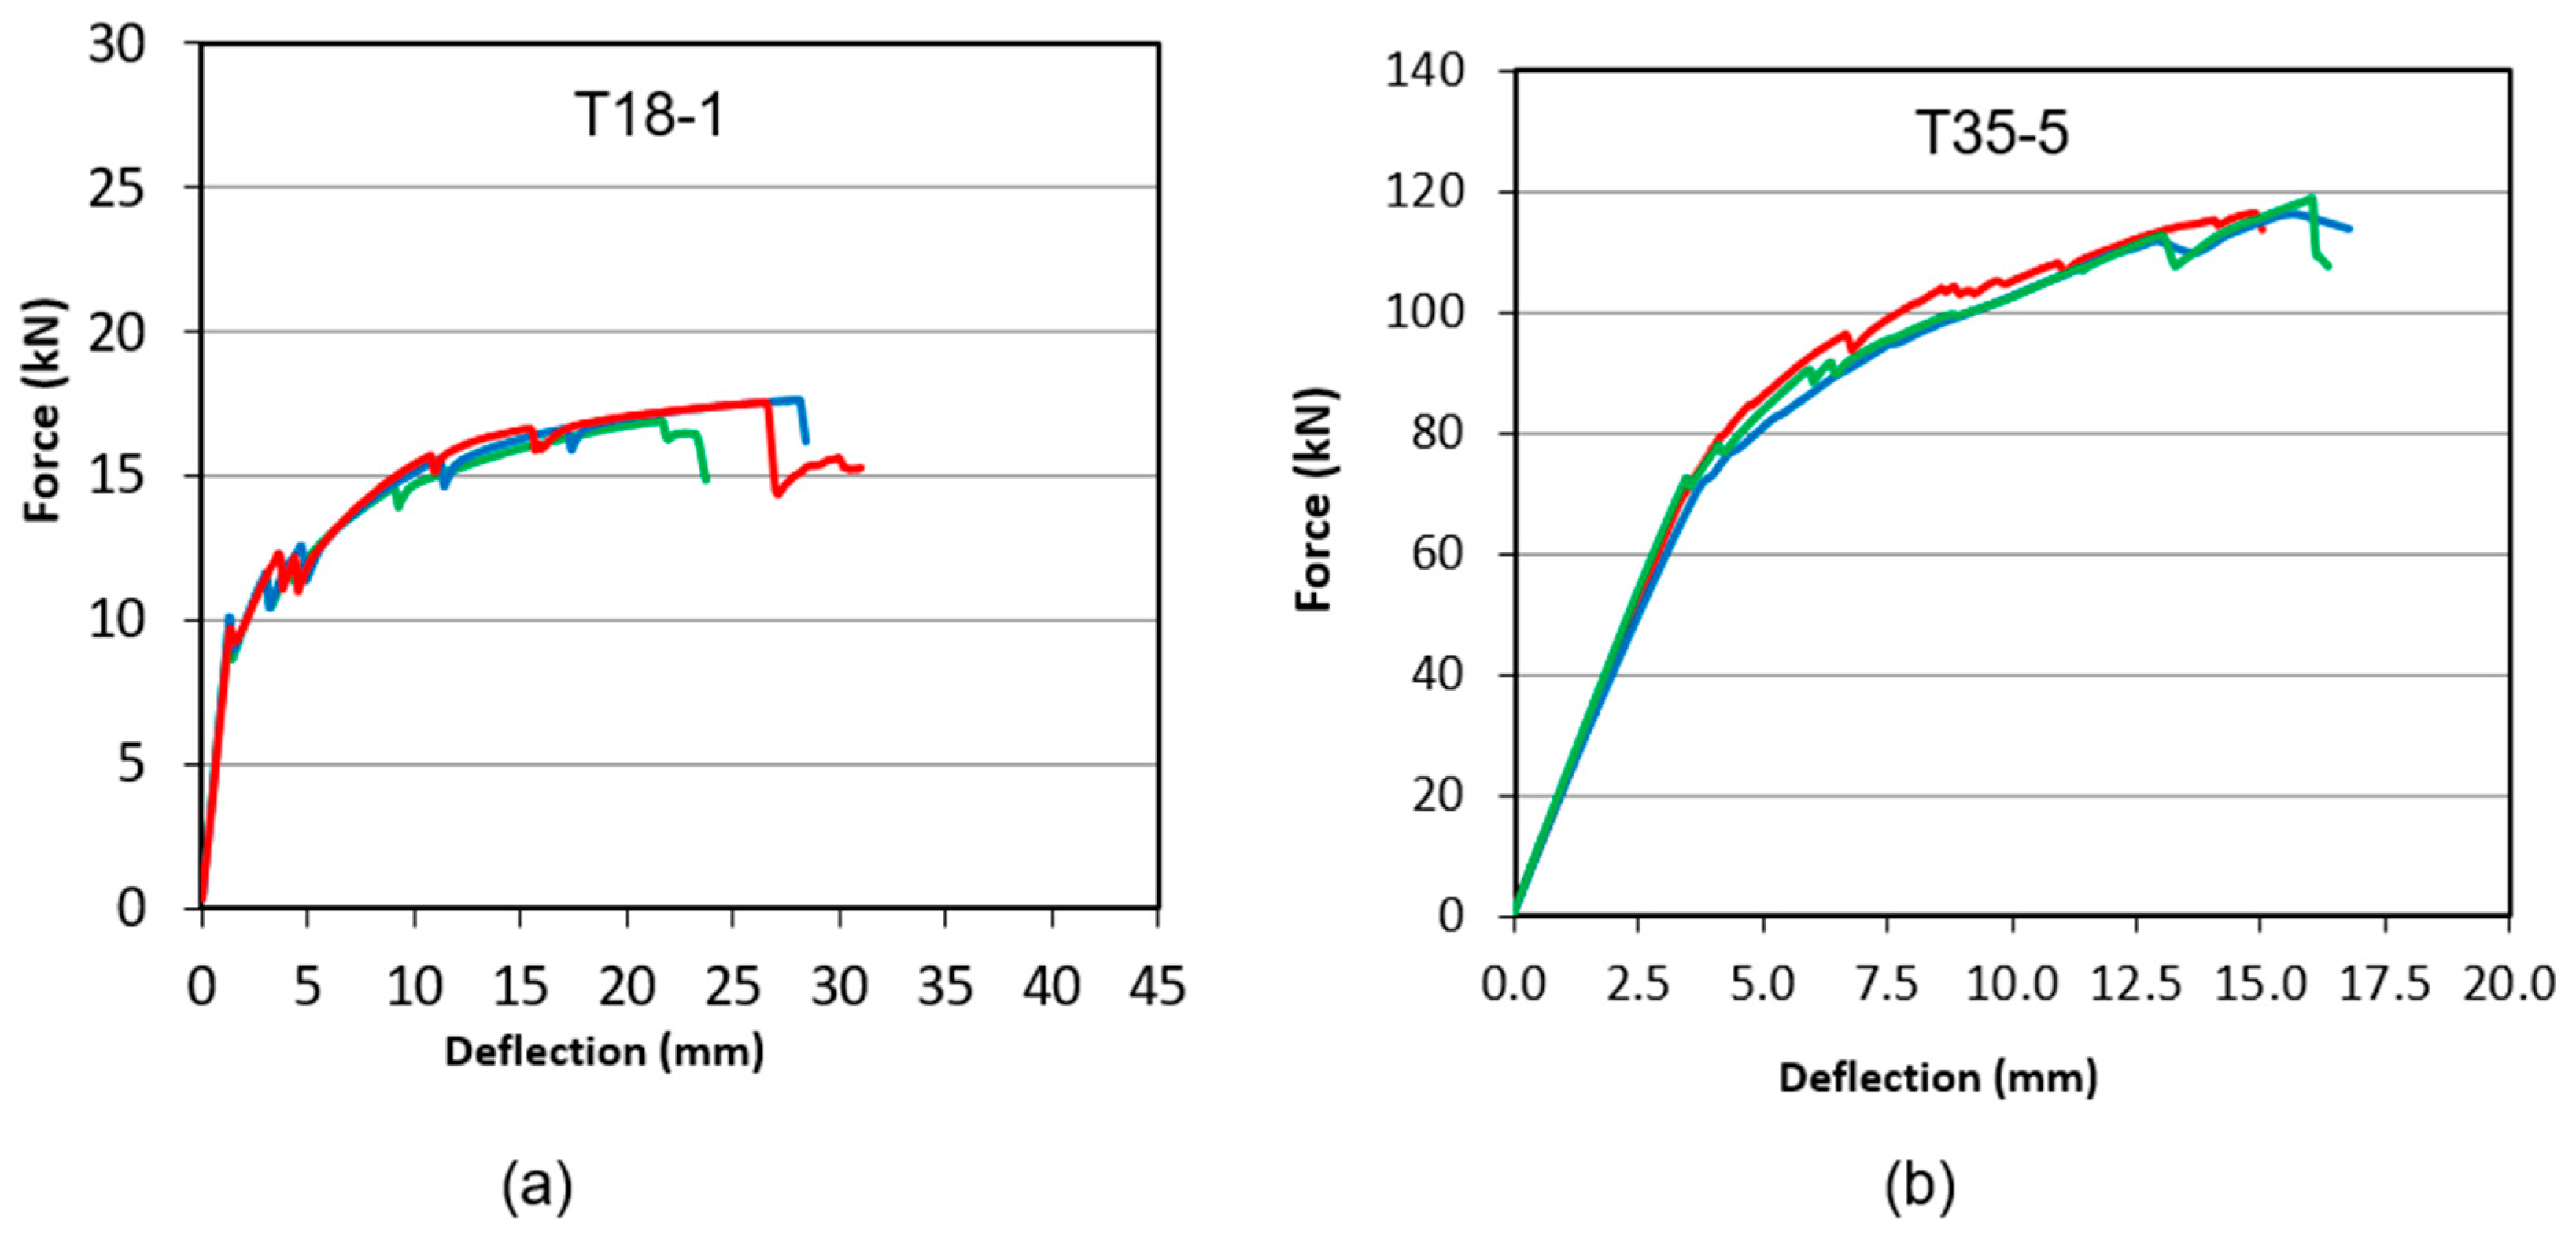
Table 2 shows the results of the experimental tests on the flexural joists. The values of force, deformation and moment in the two situations: cracking and rupture are shown here. In addition, the measured crack spacing is indicated as well. Figure 6 shows the force–deformation relationship measured in the experimental tests of joists T18-1 and T35-5, having performed 3 repetitions of each joist. These results have been used to calibrate and validate the simulation model.
3.2. Calibration
After performing various calibration analyses, the most important parameters for fitting the flexural model were: pre-stress level, modulus of elasticity of the concrete and bond strength. The most important results for each of these parameters are described below.
- Level of pre-stressing losses
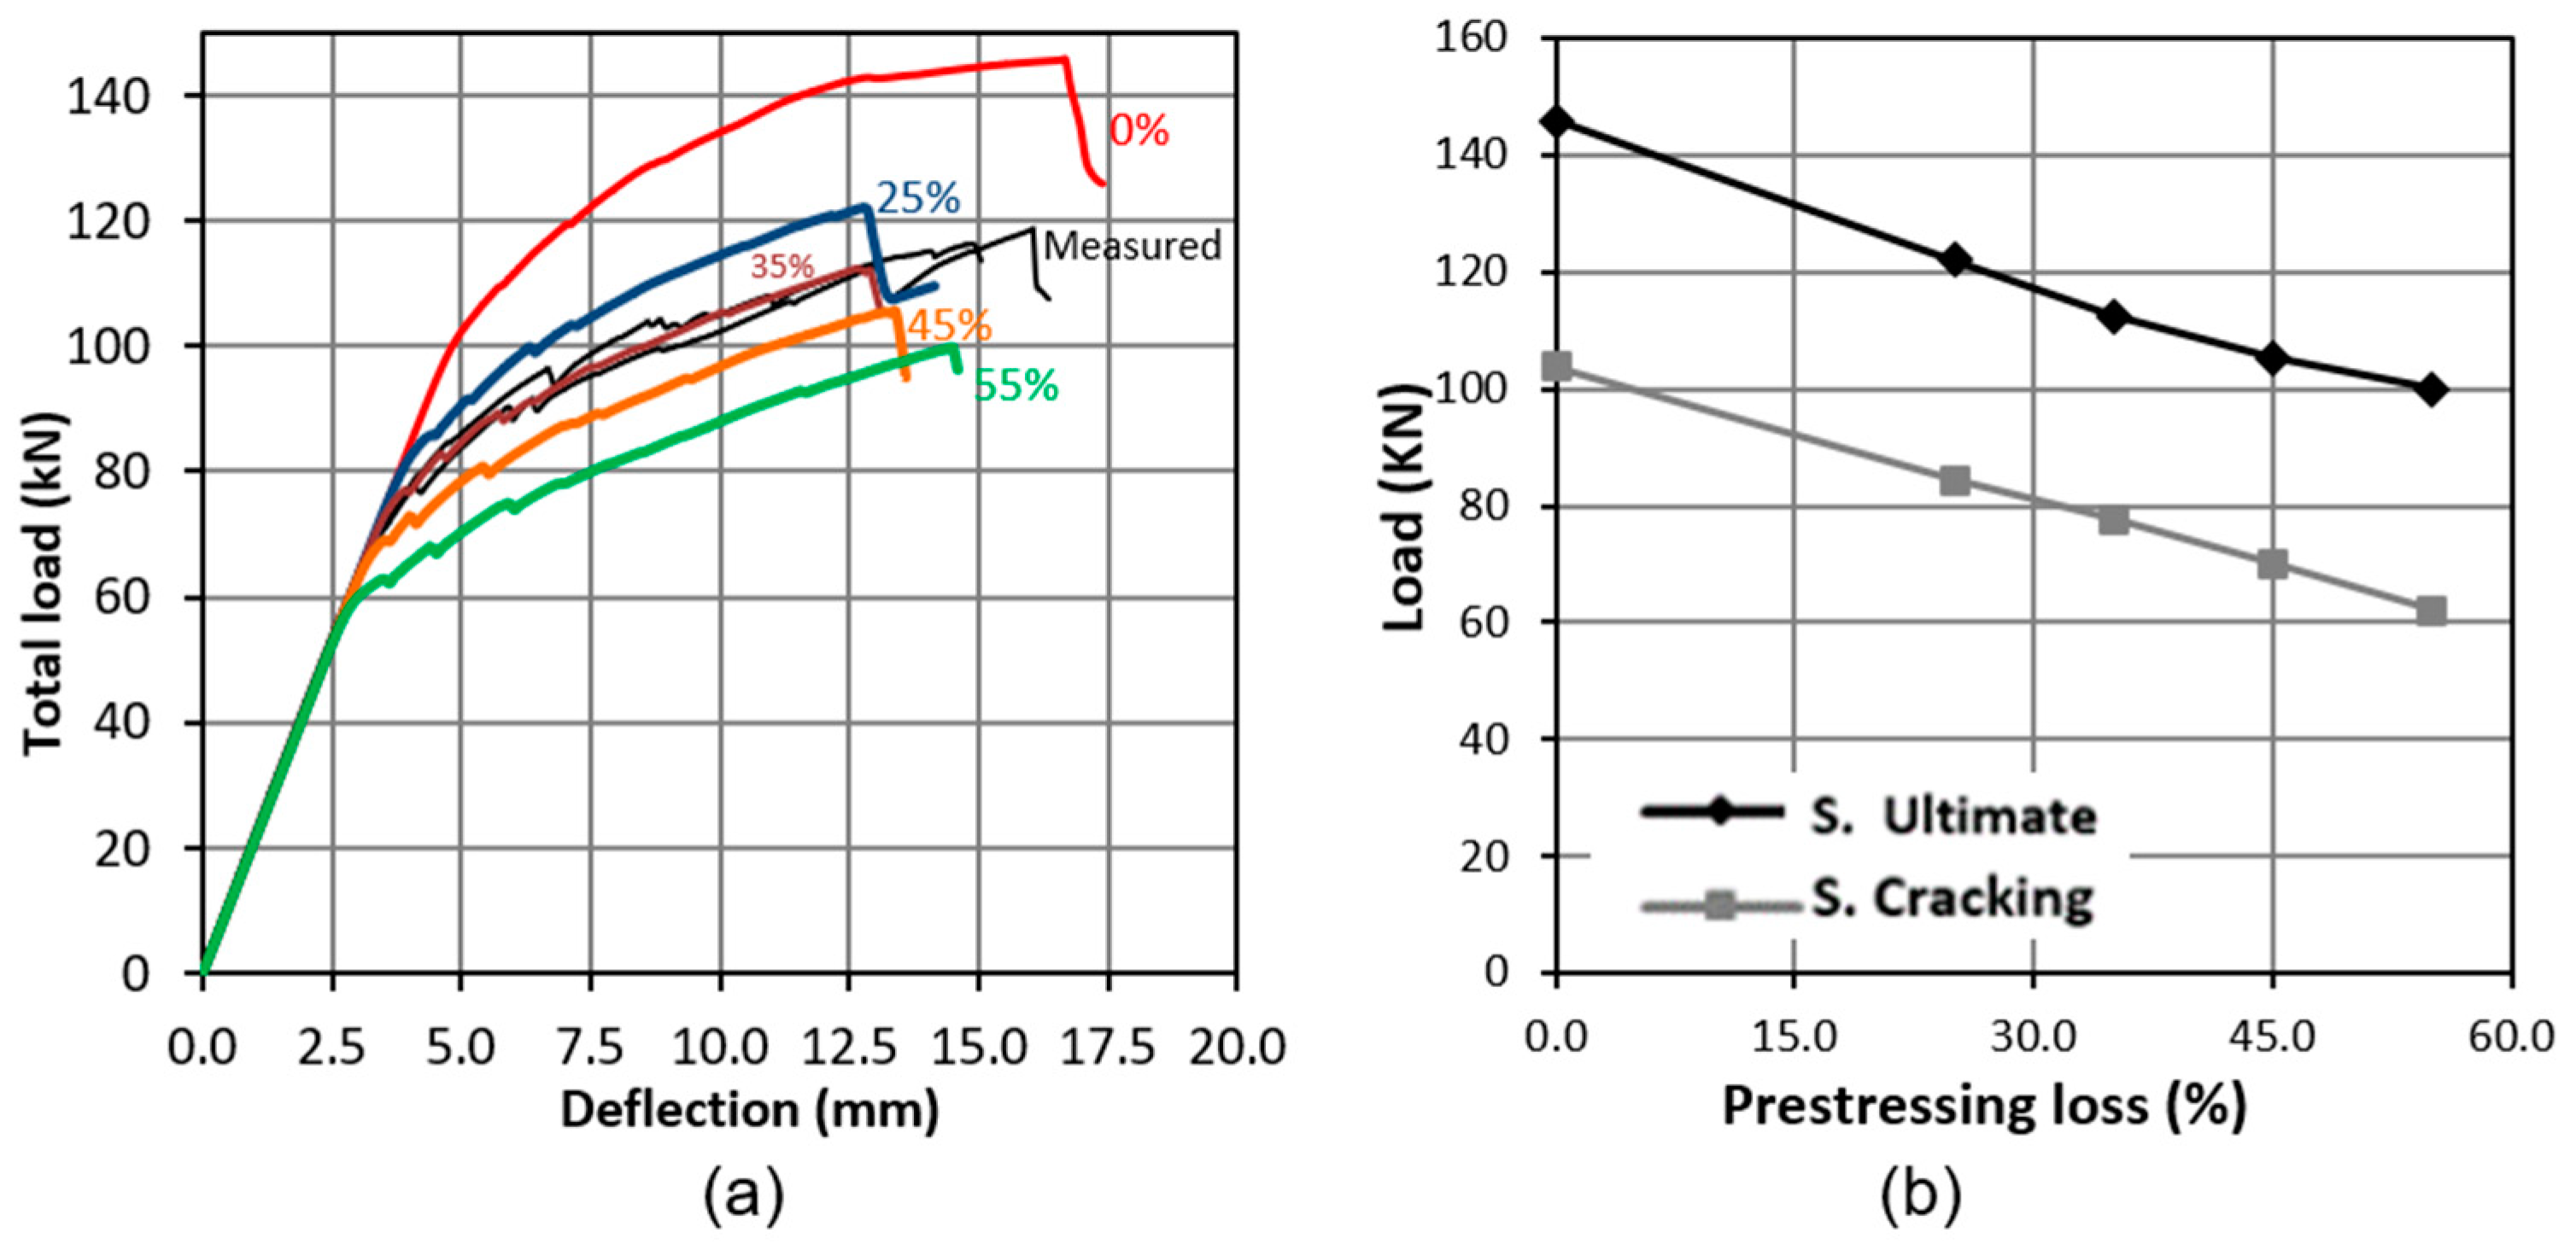
The simulation results show that the pre-stressing loss level that best replicates the response obtained in the experimental tests is 35%, and thus, it was necessary to apply a higher level of losses than that included on the data sheets. Thus, in the case of joist TB35-5 (Figure 7a), the level increases from a theoretically estimated 21.9% to 35% (+12%), while in T18-1, the increase is from theoretical 17.7% to 35% in the simulation (+13.3%). Furthermore, as shown in Figure 7b, the load losses are linearly correlated with the ultimate and cracking strength levels achieved by the element analyzed. Therefore, it is clear that this factor is the key parameter that governs the strength of the elements.
This finding show that the manufacturing of elements analyzed results in a higher level of pre-stressing loss than that estimated theoretically, which suggests that, if it were possible to limit such losses in the final products through an optimization of the process, the strength of the elements would be increased at no additional cost to the company.
- Modulus of elasticity
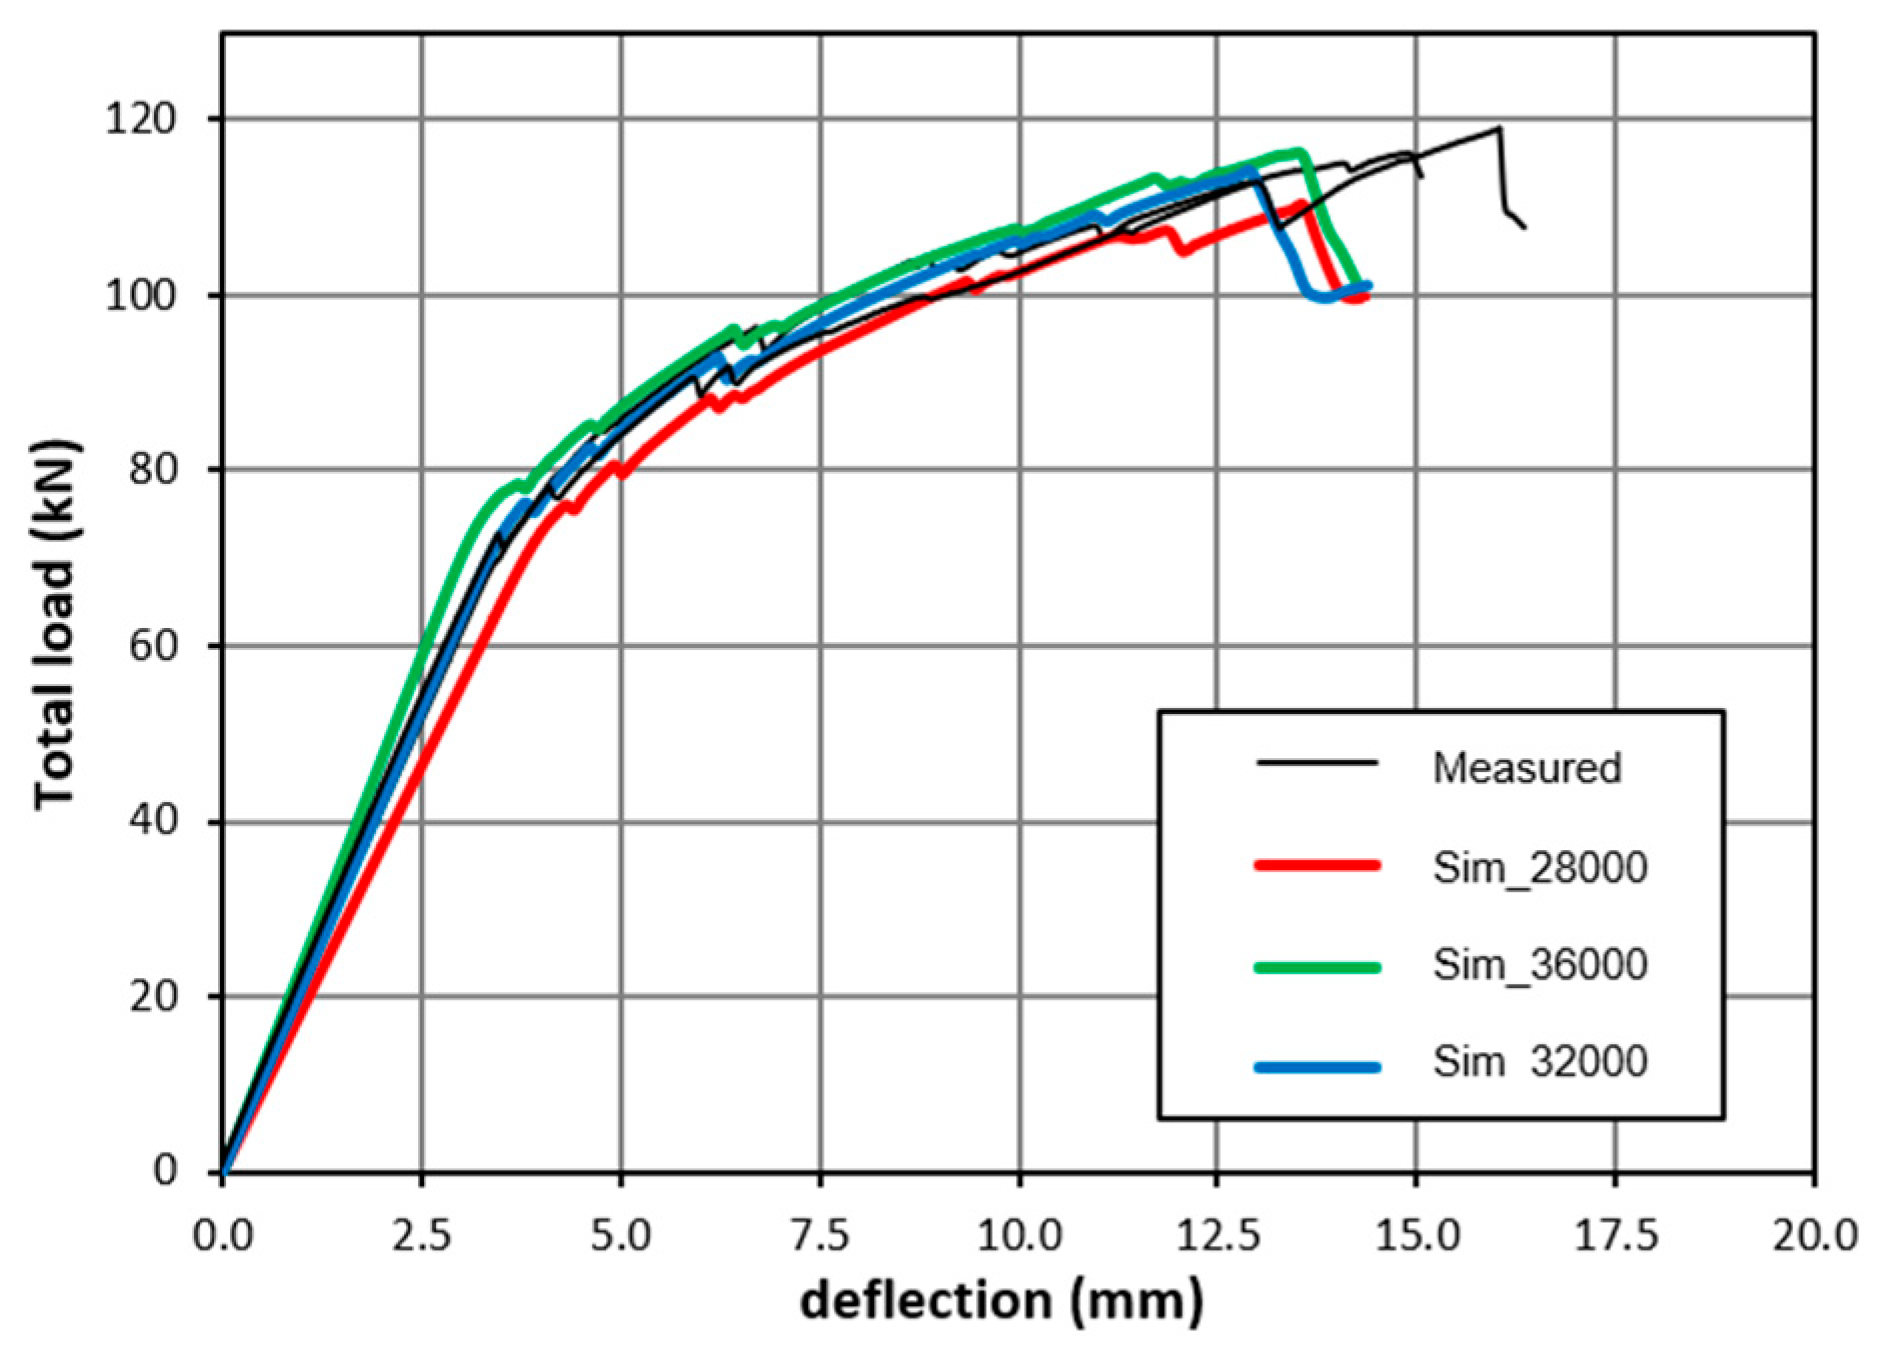
The model calibration results show that the variation of this parameter has no impact on the final strength level of the model, when mainly controlling the first part of the curve (Figure 8). Thus, the simulation suggests that the modulus of elasticity value that best fits the experimental test is 32,000 N/mm2 for both types of joists (T18.1 and TB35-5).
- Bond strength
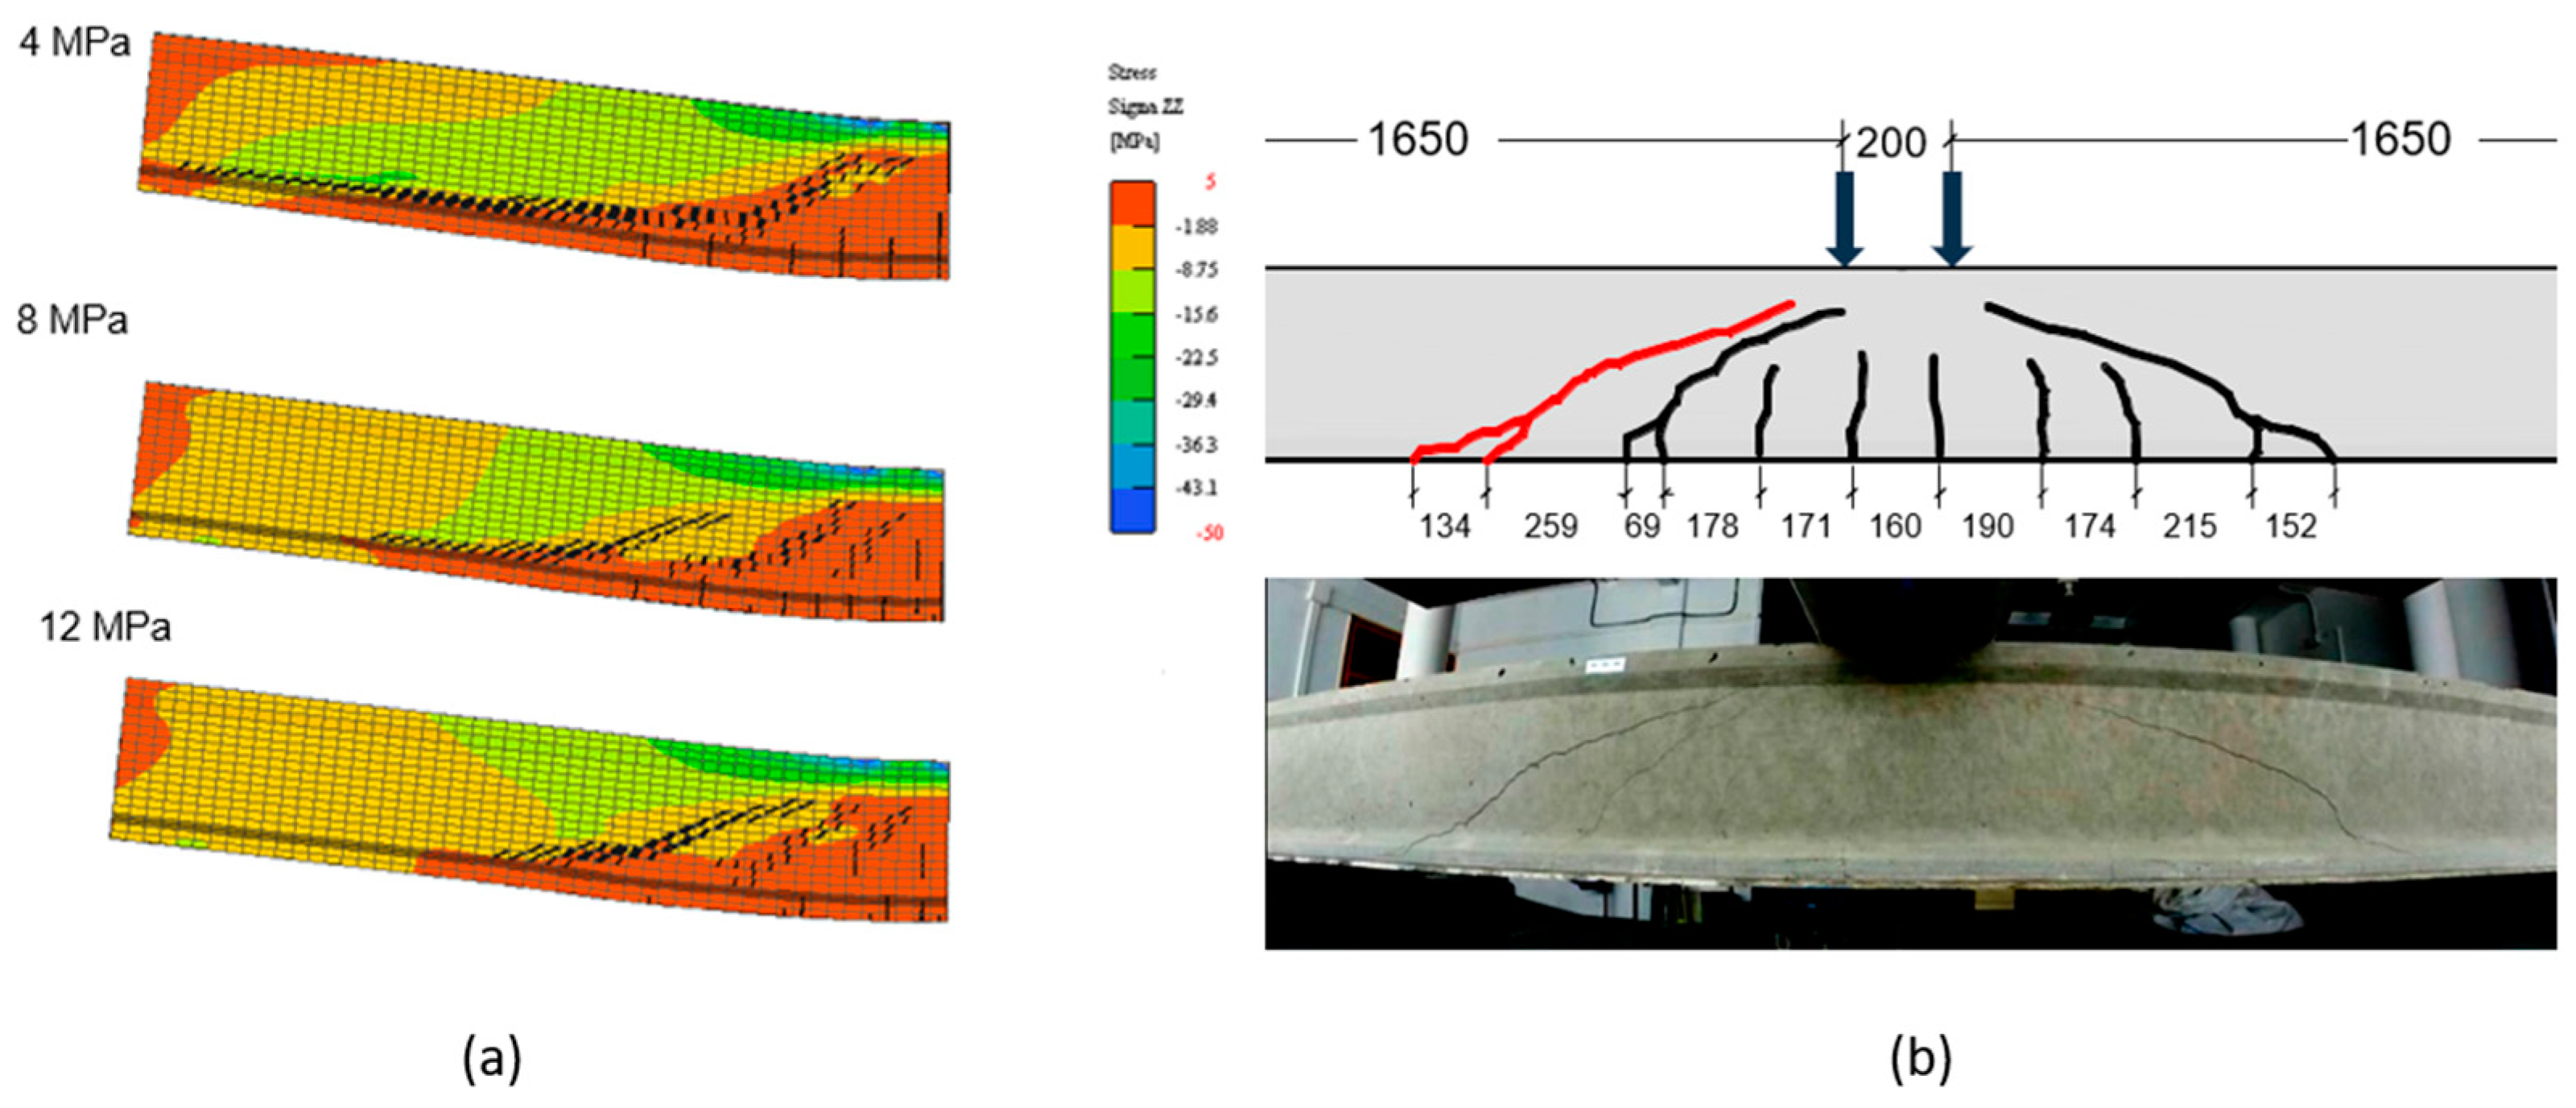
In addition to the response of the curve, we calibrated the bond strength between the reinforcement and the concrete to control the crack pattern of the model. Thus, the optimal bond value that best fits the crack patterns of the experimental tests was 12 MPa (Figure 9). This value is close to the default value generated by the tool for a steel rebar (13.4 MPa) and is far from the value generated for cold cables (0.6 MPa) and hot rolled bars (2.0 MPa). Thus, for specimens of this type, the most advisable solution is to use the model configured for “Ribbed Reinforcement” elements to generate the bond model.
The tensile strength and fracture energy were found not to be significant determinants of the response of the model to the flexural tests analyzed, and we hence opted to leave the default values. Regarding the compressive strength, no modifications were made since we used the values from the company’s quality control tests on compression.
Table 3 shows the calibration values of the model that best replicate the experimental structural response, and which were used to simulate the other pre-stressed linear elements.
3.3. Results of the Simulation of the Elements with the Parameters Obtained from the Calibration and Comparison with the Experimental Tests
Having calibrated the models, all the parts tested experimentally were simulated in order to compare the overall level of fit obtained following the adjustments. Since the aim of this study was to determine the model’s ability to faithfully reproduce the CRACKING MOMENT and ULTIMATE MOMENT in the bending of pre-stressed concrete elements, we now compare the degree of fit of these parameters between the simulation and the experimental test. Table 4 summarizes both values for each element, as well as their degree of fit, calculating the differences in both absolute values and percentages with respect to the experimental value.
The overall results of the simulation–experiment comparison show errors ranging from 0.24% to 15%, in both cracking and ultimate strength; it can be concluded, then, that overall, an acceptable degree of fit is obtained, with the average difference being between 6 and 7%. In addition, the overall comparison of the results show that the fit is very good along almost the entire load–deformation curve. It can be concluded that the load–deflection curves obtained in the bending simulations fit the experimental results reasonably well along their entire length. However, there are slight differences in some elements that are worth analyzing in order to understand the potential of the model. The main findings of the simulations are listed below, with emphasis on the greatest differences with respect to the ultimate strength of the elements.
Regarding the individual values obtained for the maximum moment, it can be seen that all the simulations yield a result similar to, or slightly lower than, that obtained experimentally, which in case of error, errs on the side of safety. This confirms that the ATENA tool is a perfect option for estimating the maximum resistance of the different elements.
The errors of above 10% obtained for the elements T18-1, TB35-3 and TB35-6 may be explained as follows:
- Joist T18-1.—This element lacks great strength, with an absolute difference in value between simulation and experiment of 1 kN-m. This difference is not particularly significant; it highlights the sensitivity in terms of the mean parameters considered in the calibration. The error with respect to the cracking moment was 5.8%.
- Tubular joist TB35-3 and TB35-6.—The elements are stronger, with the differences obtained in the maximum load being −10 y − 17 kN, respectively. Analyzing the overall fit of the load–deformation curve of each pair of elements, it can be seen that curve generated by the simulation shows a higher level of fit along its entire length compared to that of the experimental response. However, the deformation point at which the simulation obtains the rupture is similar to the experimental case.
This characteristic leads us to think that, since the simulation starts with a good response that reproduces the behavior of the joist, an additional parameter requires calibrating to adjust the curve in this last section prior to rupture. An analysis of the mode of the rupture, where it was observed that the failure of the joists in the experimental tests are generated by the appearance of a determinant oblique crack located between the point of application of the load and the support, suggests it may be necessary to calibrate the control parameters of the concrete that govern shear behavior, in order to provide this factor with greater resistance. This has not been addressed in this study of the optimization of flexural elements.
Nonetheless, given the good fit of the curves obtained by the simulation in all their progression to rupture—and given that the values err on the side of safety in terms of the maximum value actually obtained by the elements—it can be considered that the model reproduces the behavior of all the elements tested with substantial accuracy.
4. Conclusions
The main conclusion of this study is that, after performing various experimental analyses and numerical simulations of the same elements, it is possible, using the ATENA tool, to reproduce the flexural response of the elements manufactured by the company concerned. Thus, a good fit is achieved between the experimental response and the simulation in terms of the cracking moment and ultimate bending moment, with a mean error of around 6–7%.
Thus, in order to adapt the simulation response to the actual response obtained in the experimental flexural tests, it was necessary to calibrate certain parameters of the concrete constitutive model, with the most influential being the pre-stressing losses, the modulus of elasticity and bond strength, with tensile strength and fracture energy being less relevant.
A noteworthy conclusion drawn from the results of the different numerical simulations performed is the necessity of applying losses to the initial pre-stressing forces of 35% to adapt the model to the actual strength response. Thus, the application of the model suggests that the elements currently being manufactured achieve a much higher value of pre-stressing losses than those that might theoretically be obtained by calculation (15–20%). Hence, the resulting elements present a lower level of resistance compared to what could potentially be achieved if this factor were controlled.
Author Contributions
Conceptualization, J.M. and S.L.; methodology, J.M. and S.L.; software, J.C.-G.; validation, J.M. and S.L.; formal analysis, J.C.-G. and C.G.; investigation, S.L. and C.G.; resources, J.M. and J.C.-G.; data curation, S.L. and J.C.-G.; writing—original draft preparation, J.M. and C.G.; writing—review and editing, J.M., J.C.-G. and C.G.; visualization, J.M. and J.C.-G.; supervision, J.M. and S.L.; project administration, J.M.; funding acquisition, J.M. All authors have read and agreed to the published version of the manuscript.
Funding
This research received no external funding.
Institutional Review Board Statement
Not applicable.
Informed Consent Statement
Not applicable.
Data Availability Statement
Not applicable.
Conflicts of Interest
The authors declare no conflict of interest.
References
- Nilson, A.H. Internal Measurement of Bond Slip. J. Am. Concr. Inst. 1972, 69, 439–441. [Google Scholar]
- Meyer, C.; Okamura, H. Finite Element Analysis of Reinforced Concrete Structures: Proceedings of the Seminar. In Proceedings of the US-Japan Seminar on Finite Element Analysis of Reinforced Concrete Structures, Tokyo, Japan, 21–24 May 1985. [Google Scholar]
- Isenberg, J. Finite Element Analysis of Reinforced Concrete Structures II; Committee on Finite Element Analysis of Reinforced Concrete Structures, American Society of Civil Engineers: Reston, VA, USA, 1991. [Google Scholar]
- Nilson, A.H. Finite Element Analysis of Reinforced Concrete; Committee on Finite Element Analysis of Reinforced Concrete Structures, American Society of Civil Engineers: Reston, VA, USA, 1982. [Google Scholar]
- Bangash, M.Y. Concrete and Concrete Structures: Numerical Modelling and Applications; Middlesex Polytechnic: London, UK, 1989. [Google Scholar]
- Padmarajaiah, S.K.; Ramaswamy, A. A finite element assessment of flexural strength of prestressed concrete beams with fiber reinforcement. Cem. Concr. Compos. 2002, 24, 229–241. [Google Scholar] [CrossRef]
- Wolansky, A.J. Flexural Behavior of Reinforced and Prestressed Concrete Beams Using Finite Element Analysis. Master’s Thesis, Faculty of the Graduate School, Marquette University, Milwaukee, WI, USA, 2004; pp. 1–87. [Google Scholar]
- Karpenko, N.I.; Karpenko, S.N.; Petrov, A.N.; Voronin, Z.A.; Evseeva, A.V. Incremental approach to the nonlinear analysis of reinforcement concrete with cracks at plane stress state. Procedia Eng. 2015, 111, 386–389. [Google Scholar] [CrossRef] [Green Version]
- Mihai, I.C.; Jefferson, A.D.; Lyons, P. A plastic-damage constitutive model for the finite element analysis of fibre reinforced concrete. Eng. Fract. Mech. 2016, 159, 35–62. [Google Scholar] [CrossRef] [Green Version]
- Barbosa, A.F.; Ribeiro, G.O. Analysis of Reinforced Concrete Structures Using Ansys Nonlinear Concrete Model. In Computational Mechanics New Trends and Applications; Idelsohn, S., Oñate, E., Dvorkin, E., Eds.; ©CIMNE: Barcelona, Spain, 1998; pp. 1–7. [Google Scholar]
- Gómez Cassab, A. Influencia de La no Linealidad de Material en las Deflexiones Inmediatas de Vigas de Concreto Reforzado; Departamento de Ingeniería Civil y Agrícola, Universidad Nacional de Colombia: Bogotá, Colombia, 2006. [Google Scholar]
- Osorio, B.E. Desplazamientos Inelásticos de Columnas de Concreto Reforzado en Extremo Libre; Departamento de Ingeniería Civil y Agrícola, Universidad Nacional de Colombia: Bogotá, Colombia, 2006. [Google Scholar]
- Saifullah, I. Experimental and Analytical Investigation of Flexural Behavior of Reinforced Concrete Beam. Int. J. Eng. Technol. IJET-IJENS 2011, 11, 188–196. [Google Scholar]
- Kachlakev, D. Finite Element Modeling of Reinforced Concrete Structures Strengthened with FRP Laminates; Oregon Department of Transportation: Washington, DC, USA, 2001. [Google Scholar]
- Özcan, D.M.; Bayraktar, A.; Şahin, A.; Haktanir, T.; Türker, T. Experimental and finite element analysis on the steel fiber-reinforced concrete (SFRC) beams ultimate behavior. Constr. Build. Mater. 2009, 23, 1064–1077. [Google Scholar] [CrossRef]
- López, P.A. Simulación Numérica de Vigas en Concreto Reforzado con Barras Longitudinales, Transversales y Fibras Cortas de Acero Mediante el Método de los Elementos Finitos. Master’s Thesis, Facultad de Ingeniería, Universidad Nacional de Colombia, Bogotá, Colombia, 2010. [Google Scholar]
- Nuñez, A.M. Análisis Numérico-Experimental de Elementos de Hormigón Reforzado con Fibras de Acero; Departamento de Ingeniería de la Construcción y de Proyectos de Ingeniería Civil, Universidad Politècnica de Valencia: Valencia, Spain, 2011. [Google Scholar]
- Herrera, L. Modelación Numérica del Concreto Simple con Elementos Finitos Usando un Modelo Constitutivo de Daño; Departamento de Ingeniería Civil y Agrícola, Universidad Nacional de Colombia: Bogotá, Colombia, 2011. [Google Scholar]
- Verre, S. Numerical Strategy for Column Strengthened with FRCM/SRG System. Buildings 2022, 12, 2187. [Google Scholar] [CrossRef]
- EN 1992-1-1; Eurocode 2: Design of Concrete Structures—Part 1-1: General Rules and Rules for Buildings. European Committee for Standardization: Brussels, Belgium, 2004.
- Červenka, V.; Jendele, L.; Červenka, J. ATENA Program Documentation. Part 1. Theory; Červenka Consulting s.r.o.: Prague, Czech Republic, 2014; pp. 1–360. [Google Scholar]
- Červenka, J.; Červenka, V.; Laserna, S. On finite element modeling of compressive failure in brittle materials. In Computational Modelling of Concrete Structures, Proceedings of the EURO-C 2014, Saint Anton am Arlberg, Austria, 24–27 March 2014; CRC Press: Boca Raton, FL, USA, 2014; Volume 1, pp. 273–281. [Google Scholar]
- Bosco, C.; Debenardi, P.G. Influence of some basic parameters on the plastic rotation of reinforced elements. Ductility requirements for structural Concrete Reinforcement. Com. Euro-Int. Béton CEB Bull. 1993, 218, 25–44. [Google Scholar]
- Nakamura, H.; Higai, T. Compressive Fracture Energy and Fracture Zone Length of Concrete; American Society of Civil Engineers: Reston, VA, USA, 2001. [Google Scholar]
- Bendito, A.; Romero, M.L.; Bonet, J.L.; Miguel, P.F.; Fernández, M.A. Análisis no-linear por elementos finitos de un elemento figa-columna de concreto armado. Rev. Sul. Am. Eng. Estruct. Passo Fundo 2008, 5, 44–64. [Google Scholar]
- Parikh, B.; Modhera, D. Analytical Model of Reinforced Cement Concrete Beam Using Glass Fibre Reinforced Polymer. Int. J. Adv. Eng. Technol. 2010, 1, 47–59. [Google Scholar]
- Sucharda, O.; Brozovsky, J. Verified Non-linear Model for Reinforced Concrete Beams; WSEAS Press: Athens, Greece, 2012; ISBN 978-1-61804-127-2. [Google Scholar]
- Singhal, H. Finite Element Modeling of Retrofitted RC Beams; Thapat University: Patiala, India, 2009. [Google Scholar]
- Imoperatore, S.; Lavorato, D.; Nuti, C.; Santini, S.; Sguerri, L. Numerical modelling of existing RC beams strengthened in shear with FRP U-sheets. In Proceedings of the 6th International Conference on FRP Composites in Civil Engineering, Rome, Italy, 13–15 June 2012. [Google Scholar]
- Červenka Consulting s.r.o. Available online: http://www.cervenka.cz/ (accessed on 15 November 2022).
- Leonhardt, F.; Walther, R. Shear Tests on Single-Span Reinforced Concrete Beams with and without Shear Reinforcement; German Committee for Reinforced Concrete; Ernst&Sohn: Berlin, Germany, 1962; Heft 51. [Google Scholar]
- Jendele, L.; Cervenka, J. Finite element modelling of reinforcement with bond. Comput. Struct. 2006, 84, 1780–1791. [Google Scholar] [CrossRef]
- Laserna Arcas, S. Avances en el Comportamiento del Hormigón Reciclado: Fabricación, Propiedades Mecánicas y Simulación Númerica. Doctoral Thesis, UCLM, Albacete, Spain, 2015. [Google Scholar]
- Calero, M.T. Desarrollo de un Modelo de Simulación del Comportamiento Estructural de Elementos de Hormigón Pretensado Mediante Técnicas de Elementos Finitos. Master’s Thesis, UCLM, Albacete, Spain, 2016. [Google Scholar]
Figure 1.
Geometric characteristics of the joists analyzed.

Figure 2.
Free-standing gantry for flexural tests on linear elements of concrete (a) and example of strength vs. deformation graph with its characteristic values (b).
Figure 2.
Free-standing gantry for flexural tests on linear elements of concrete (a) and example of strength vs. deformation graph with its characteristic values (b).

Figure 3.
Boundary conditions used for the simulation of the T18 joist.

Figure 4.
T13 joist modelled with the assigned materials.

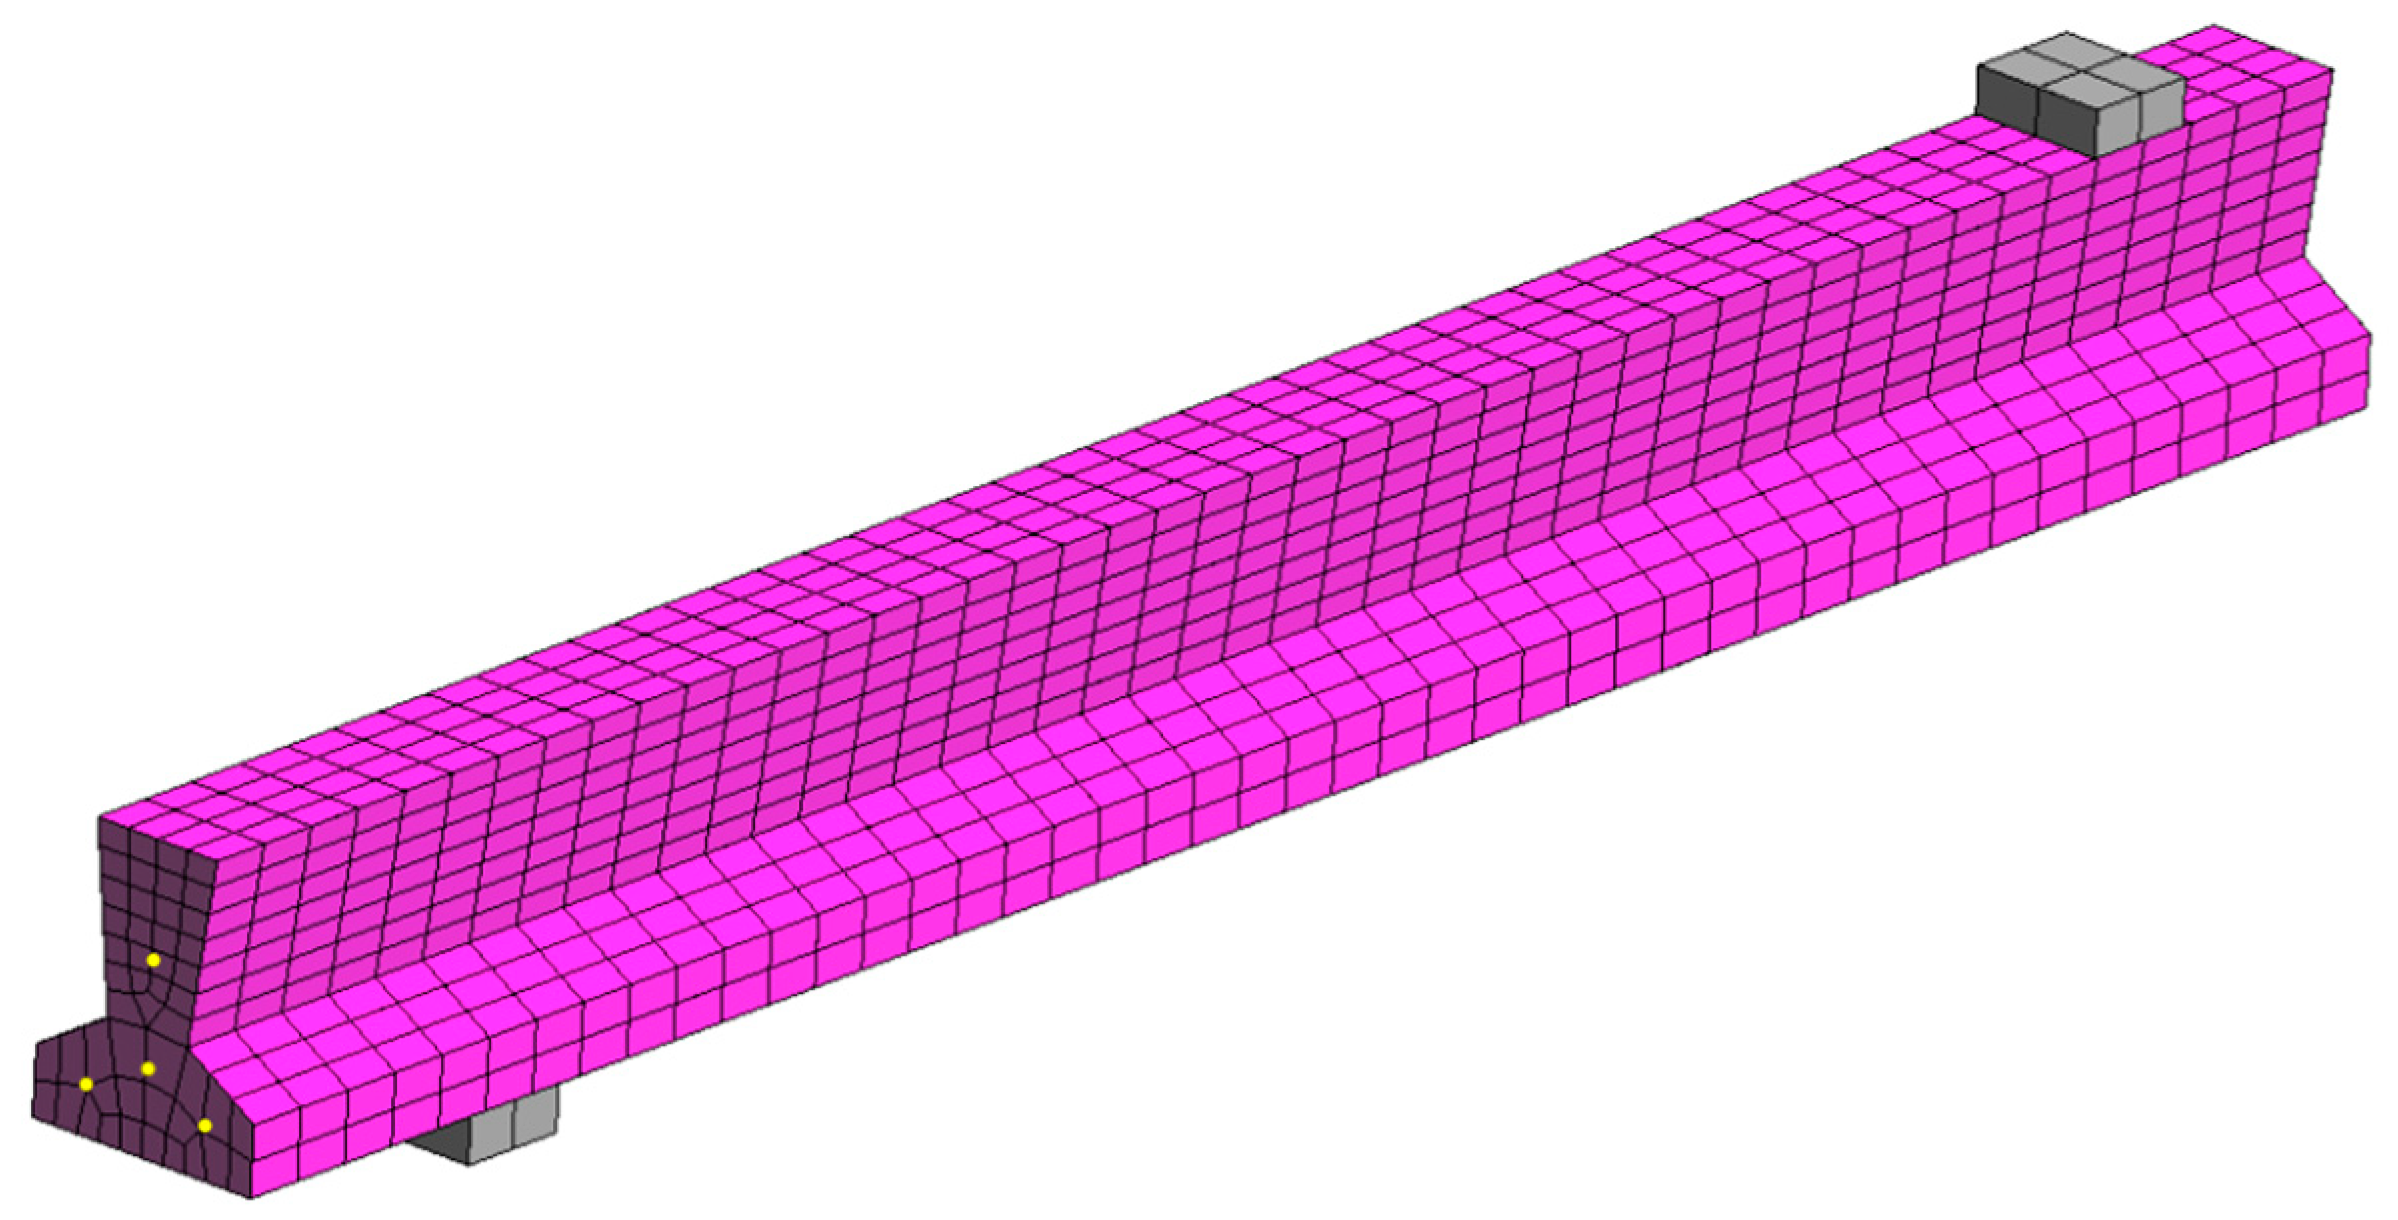
Figure 5.
Meshing result of the T13 type joist (concrete: purple color; reinforcement: yellow color; support plates: gray color).
Figure 5.
Meshing result of the T13 type joist (concrete: purple color; reinforcement: yellow color; support plates: gray color).

Figure 6.
Load–deflection diagrams for different tests in T18-1 (a) and TB35.5 (b) joists with 3 repetitions for each joist.
Figure 6.
Load–deflection diagrams for different tests in T18-1 (a) and TB35.5 (b) joists with 3 repetitions for each joist.

Figure 7.
Load–deflection diagrams for different simulated pre-stressing levels in joist TB35.5 (a) and evolution of cracking strength and ultimate strength with pre-stressing losses (b).
Figure 7.
Load–deflection diagrams for different simulated pre-stressing levels in joist TB35.5 (a) and evolution of cracking strength and ultimate strength with pre-stressing losses (b).

Figure 8.
Load–deformation diagrams simulated for different modulus of elasticity in joist TB35.5.

Figure 9.
Crack distribution in the simulation with different bond strength levels (a) and that obtained in the experimental test (b) for joist T35.5. The rupture crack is shown in red color.
Figure 9.
Crack distribution in the simulation with different bond strength levels (a) and that obtained in the experimental test (b) for joist T35.5. The rupture crack is shown in red color.


Table 1.
Structural elements analyzed and their resistance parameters according to the manufacturer’s technical data sheets.
Table 1.
Structural elements analyzed and their resistance parameters according to the manufacturer’s technical data sheets.
| Type | Repetitions | Length | Amount Reinforcement | Losses | Resistance Characteristics | |||
|---|---|---|---|---|---|---|---|---|
| (m) | Alower (‰) | Ahigher (‰) | Alower (%) | Ahigher (%) | Multimate (kN·m) | Mcracking (kN·m) | ||
| T13.1 | 2 | 2.40 | 3.0 | 1.5 | 18.6 | 17.5 | 3.8 | 1.7 |
| T13.2 | 3 | 2.40 | 4.5 | 1.5 | 20.3 | 18.5 | 4.6 | 2.3 |
| T18.1 | 3 | 2.40 | 2.3 | 1.2 | 17.7 | 16.4 | 5.9 | 2.5 |
| T18.3 | 2 | 2.40 | 4.7 | 1.2 | 21.6 | 16.5 | 9.8 | 5.0 |
| T35.3 | 2 | 4.10 | 4.1 | 1.0 | 18.2 | 11.2 | 67.5 | 49.6 |
| T35.4 | 3 | 2.03 | 5.1 | 1.0 | 20.3 | 11.2 | 76.1 | 56.8 |
| T35.5 | 2 | 3.70 | 5.1 | 2.0 | 21.9 | 11.3 | 82.2 | 63.2 |
| T35.6 | 2 | 3.26 | 6.1 | 1.0 | 22.7 | 10.9 | 86.0 | 66.2 |
Table 2.
Experimental test results for flexural joists.
| T13-1 | T13-2 | T18-1 | T18-3 | T35-3 | T35-4 | T35-5 | T35-6 | ||
|---|---|---|---|---|---|---|---|---|---|
| Cracking | Force (kN) | 5.40 | 8.00 | 9.65 | 13.73 | 45.85 | 108.77 | 79.40 | 79.99 |
| Deformation (mm) | 2.00 | 3.10 | 1.30 | 2.00 | 3.75 | 1.16 | 4.45 | 2.76 | |
| Moment (kN·m) | 2.60 | 3.80 | 4.51 | 6.46 | 37.60 | 43.78 | 63.65 | 65.58 | |
| Ultimate | Force (kN) | 11.20 | 15.90 | 17.35 | 26.90 | 81.05 | 177.77 | 117.10 | 137.90 |
| Deformation (mm) | 29.50 | 22.80 | 25.27 | 17.08 | 23.83 | 4.73 | 16.45 | 13.94 | |
| Moment (kN·m) | 5.30 | 7.50 | 8.15 | 12.64 | 66.45 | 71.57 | 96.45 | 113.10 | |
| Crack spacing (mm) | 172 | 122 | 202 | 182 | 175 | 233 | 194 | 204 | |
Table 3.
Final values of the model calibration conducted in ATENA to simulate pre-stressed elements.
Table 3.
Final values of the model calibration conducted in ATENA to simulate pre-stressed elements.
| Parameter | Calibration Value |
|---|---|
| Compressive strength | 48 MPa |
| Initial modulus of elasticity | 32,000 MPa |
| Tensile strength | 3.5 MPa |
| Fracture energy | 9.5 GPa |
| Pre-stressing losses | 35% |
| Bond strength | 12 MPa |
Table 4.
Comparison of the main bending results for cracking moment and ultimate moment, obtained experimentally and by simulation.
Table 4.
Comparison of the main bending results for cracking moment and ultimate moment, obtained experimentally and by simulation.
| Element | Cracking Moment (kN·m) | Ultimate Moment (kN·m) | ||||||
|---|---|---|---|---|---|---|---|---|
| Exper. | Simul. | Difference | (%) | Exper. | Simul. | Difference | (%) | |
| T13-1 | 2.60 | 2.99 | 0.39 | 15.00 | 5.30 | 5.19 | −0.11 | −2.08 |
| T13-2 | 3.43 | 3.60 | 0.17 | 4.96 | 6.53 | 6.49 | −0.04 | −0.61 |
| T18-1 | 4.51 | 4.25 | −0.26 | −5.76 | 8.15 | 7.14 | −1.01 | −12.39 |
| T18-3 | 6.46 | 6.27 | −0.19 | −2.94 | 12.64 | 12.67 | 0.03 | 0.24 |
| Overall joists | 7.17 | 3.83 | ||||||
| TB35-3 | 37.60 | 36.14 | −1.46 | −3.88 | 66.45 | 58.55 | −7.90 | −11.89 |
| TB35-4 | 43.78 | 50.12 | 6.34 | 14.48 | 71.57 | 73.88 | 2.31 | 3.23 |
| TB35-5 | 63.65 | 61.20 | −2.45 | −3.85 | 96.45 | 92.70 | −3.75 | −3.89 |
| TB35-6 | 65.58 | 63.72 | −1.86 | −2.84 | 113.10 | 98.56 | −14.54 | −12.86 |
| Overall tubular joists | 6.26 | 7.97 | ||||||
| Mean total | 6.71 | 5.90 | ||||||
Disclaimer/Publisher’s Note: The statements, opinions and data contained in all publications are solely those of the individual author(s) and contributor(s) and not of MDPI and/or the editor(s). MDPI and/or the editor(s) disclaim responsibility for any injury to people or property resulting from any ideas, methods, instructions or products referred to in the content. |
© 2023 by the authors. Licensee MDPI, Basel, Switzerland. This article is an open access article distributed under the terms and conditions of the Creative Commons Attribution (CC BY) license (https://creativecommons.org/licenses/by/4.0/).
Share and Cite
MDPI and ACS Style
Montero, J.; Cervera-Gascó, J.; Gilarranz, C.; Laserna, S. Calibrating of a Simulation Model to Predict the Flexural Capacity of Pre-Stressed Concrete Beams. Appl. Sci. 2023, 13, 7477. https://doi.org/10.3390/app13137477
AMA Style
Montero J, Cervera-Gascó J, Gilarranz C, Laserna S. Calibrating of a Simulation Model to Predict the Flexural Capacity of Pre-Stressed Concrete Beams. Applied Sciences. 2023; 13(13):7477. https://doi.org/10.3390/app13137477
Chicago/Turabian StyleMontero, Jesús, Jorge Cervera-Gascó, Carlos Gilarranz, and Santiago Laserna. 2023. "Calibrating of a Simulation Model to Predict the Flexural Capacity of Pre-Stressed Concrete Beams" Applied Sciences 13, no. 13: 7477. https://doi.org/10.3390/app13137477
Note that from the first issue of 2016, this journal uses article numbers instead of page numbers. See further details here.