Article

Textile Physical Barriers: An Assessment of the Prison Effect as a Design Criterion to Increase the Porosity without Loss of Efficacy

by
Antonio J. Álvarez
* and
Rocío M. Oliva
Department of Engineering, University of Almeria, 04120 Almeria, Spain
*
Author to whom correspondence should be addressed.
Appl. Sci. 2023, 13(10), 6254; https://doi.org/10.3390/app13106254
Submission received: 13 April 2023 / Revised: 9 May 2023 / Accepted: 18 May 2023 / Published: 19 May 2023
(This article belongs to the Special Issue Advances in Technology Applied in Agricultural Engineering)

Abstract

:

Featured Application

Authors are encouraged to provide a concise description of the specific application or a potential application of the work. This section is not mandatory.

Abstract

Insect-proof screens are a physical method of crop protection against pests whose use is widespread. The hole size must be optimized since too small holes give rise to poorly porous textiles that cause a significant reduction in the permeability of the textiles to air. A common design strategy is to use a rectangular-hole geometry with the aim of limiting the hole width to prevent insect entry and increasing the hole length to increase the hole surface. However, the validity of this approach has not been tested, and indications suggest that it may not be offering the expected results. The results obtained discredit this widely accepted design criterion since they show that, while the hole width is maintained, protective screens lose efficacy as the hole length increases at least in the range of values considered. It is not possible to find an explanation for these results by considering the hole geometry from a two-dimensional point of view. However, when considering the spatial arrangement of the threads, it is understood that the passage surface for the insects is larger than that considered in the orthogonal projection images and that as the hole length increases, the efficacy of the textiles decreases.

1. Introduction

Textiles for agricultural purposes are an emerging market within the technical textiles sector. Consumption of agrotextiles has grown considerably in recent decades. One of the most booming fields is dedicated to crop protection against different species of pest insects. Textiles used as physical textile barriers have become a highly effective preventive measure for pest control in regions with high concentrations of intensive greenhouse crops [1]. Their use reduces or prevents insect access to the crop and thus reduces populations in the crop environment [2,3,4,5,6,7,8]. The immediate consequence of this is that, in turn, they reduce the number of treatments with plant protection products, which is an environmental advantage [2,4,6,8,9,10,11].
Protective textiles are woven with monofilament threads and are technically defined as plain weaves. Their structure consists of two sets of threads (warp and weft) interlaced perpendicularly. There is a regularity of the interlacing, with each weft thread passing over and under each warp thread successively (Figure 1). The warp threads are arranged parallel in the longitudinal direction of the textile. The weft threads are arranged perpendicular to the warp threads, and the distance between them is normally greater than the distance between warp threads. The distance between the threads of both groups is equal when square-hole geometries are intended. The spacing between the warp threads defines the width of the holes. The interlacing between the two sets of threads gives stability to the textile.
The major limitation of the use of protective screens is related to the resistance they offer to the passage of air through their holes. Textiles with low porosity cause significant reductions in the ventilation rate of greenhouses, with all the problems that this entails [12]. This problem is aggravated by the use of very dense screens (with a high number of threads per unit length), which are intended to combat small insect species such as Bemisia tabaci or Frankliniella occidentalis. To mitigate this drawback, manufacturers have followed a design strategy that consists of manufacturing fabrics with weft threads spaced further apart to reduce the surface area occupied by the solid matrix and increase the porous surface area. Technically, the limit of this design strategy lies in the stability of the textile. In this way, the warp threads are configured like the bars of a cage to prevent the passage of insects, and the weft threads are the ones that structurally stabilize the textile by keeping the separation between the warp threads constant. We have called this design strategy the “prison effect”. Therefore, from a design point of view, the spacing between the warp threads (which defines the hole width Lpx) is given by the dimensions of the smallest pest species whose presence inside the greenhouse is intended to be avoided. With this design strategy, it is possible to alleviate the problem of very dense, low-porosity screens that cause high resistance to airflow while theoretically achieving high efficacies against pests. This approach is also based on the scientific literature since most papers provide a single dimension to characterize the hole size [13,14,15].
The pest species chosen to evaluate the efficacy of the textile physical barriers selected is the whitefly B. tabaci, which is one of the most important pests worldwide, responsible for significant production and economic losses [16] in greenhouses and outdoor crops. It is a very polyphagous insect [17] of small size that causes direct and indirect damage and is an important vector of viral diseases [18,19].
In recent decades, the global importance of using this type of agrotextiles as a preventive measure against the pressure of pests as harmful as B. tabaci has grown considerably. However, there has been no previous work evaluating the prison effect as a design criterion, and field observations have not provided the expected results since the efficacy of protective screens has not been as high as theoretically expected [20]. For these reasons, we propose this work to examine the prison effect approach and assess any overlooked variables. The hypothesis we are trying to test is that the hole length Lpy (Figure 1) has no influence on the efficacy of the textiles since the only variable that must be taken into account is the hole width Lpx defined by the separation between the warp threads that act as bars that prevent or hinder the passage of insects. The practical applicability of the results obtained in this work is of great importance because they will allow determining the suitability of the prison effect or the limitations of its application. Today, most of the screens used to protect against B. tabaci follow this design strategy, and their validity has not yet been tested.

2. Materials and Methods

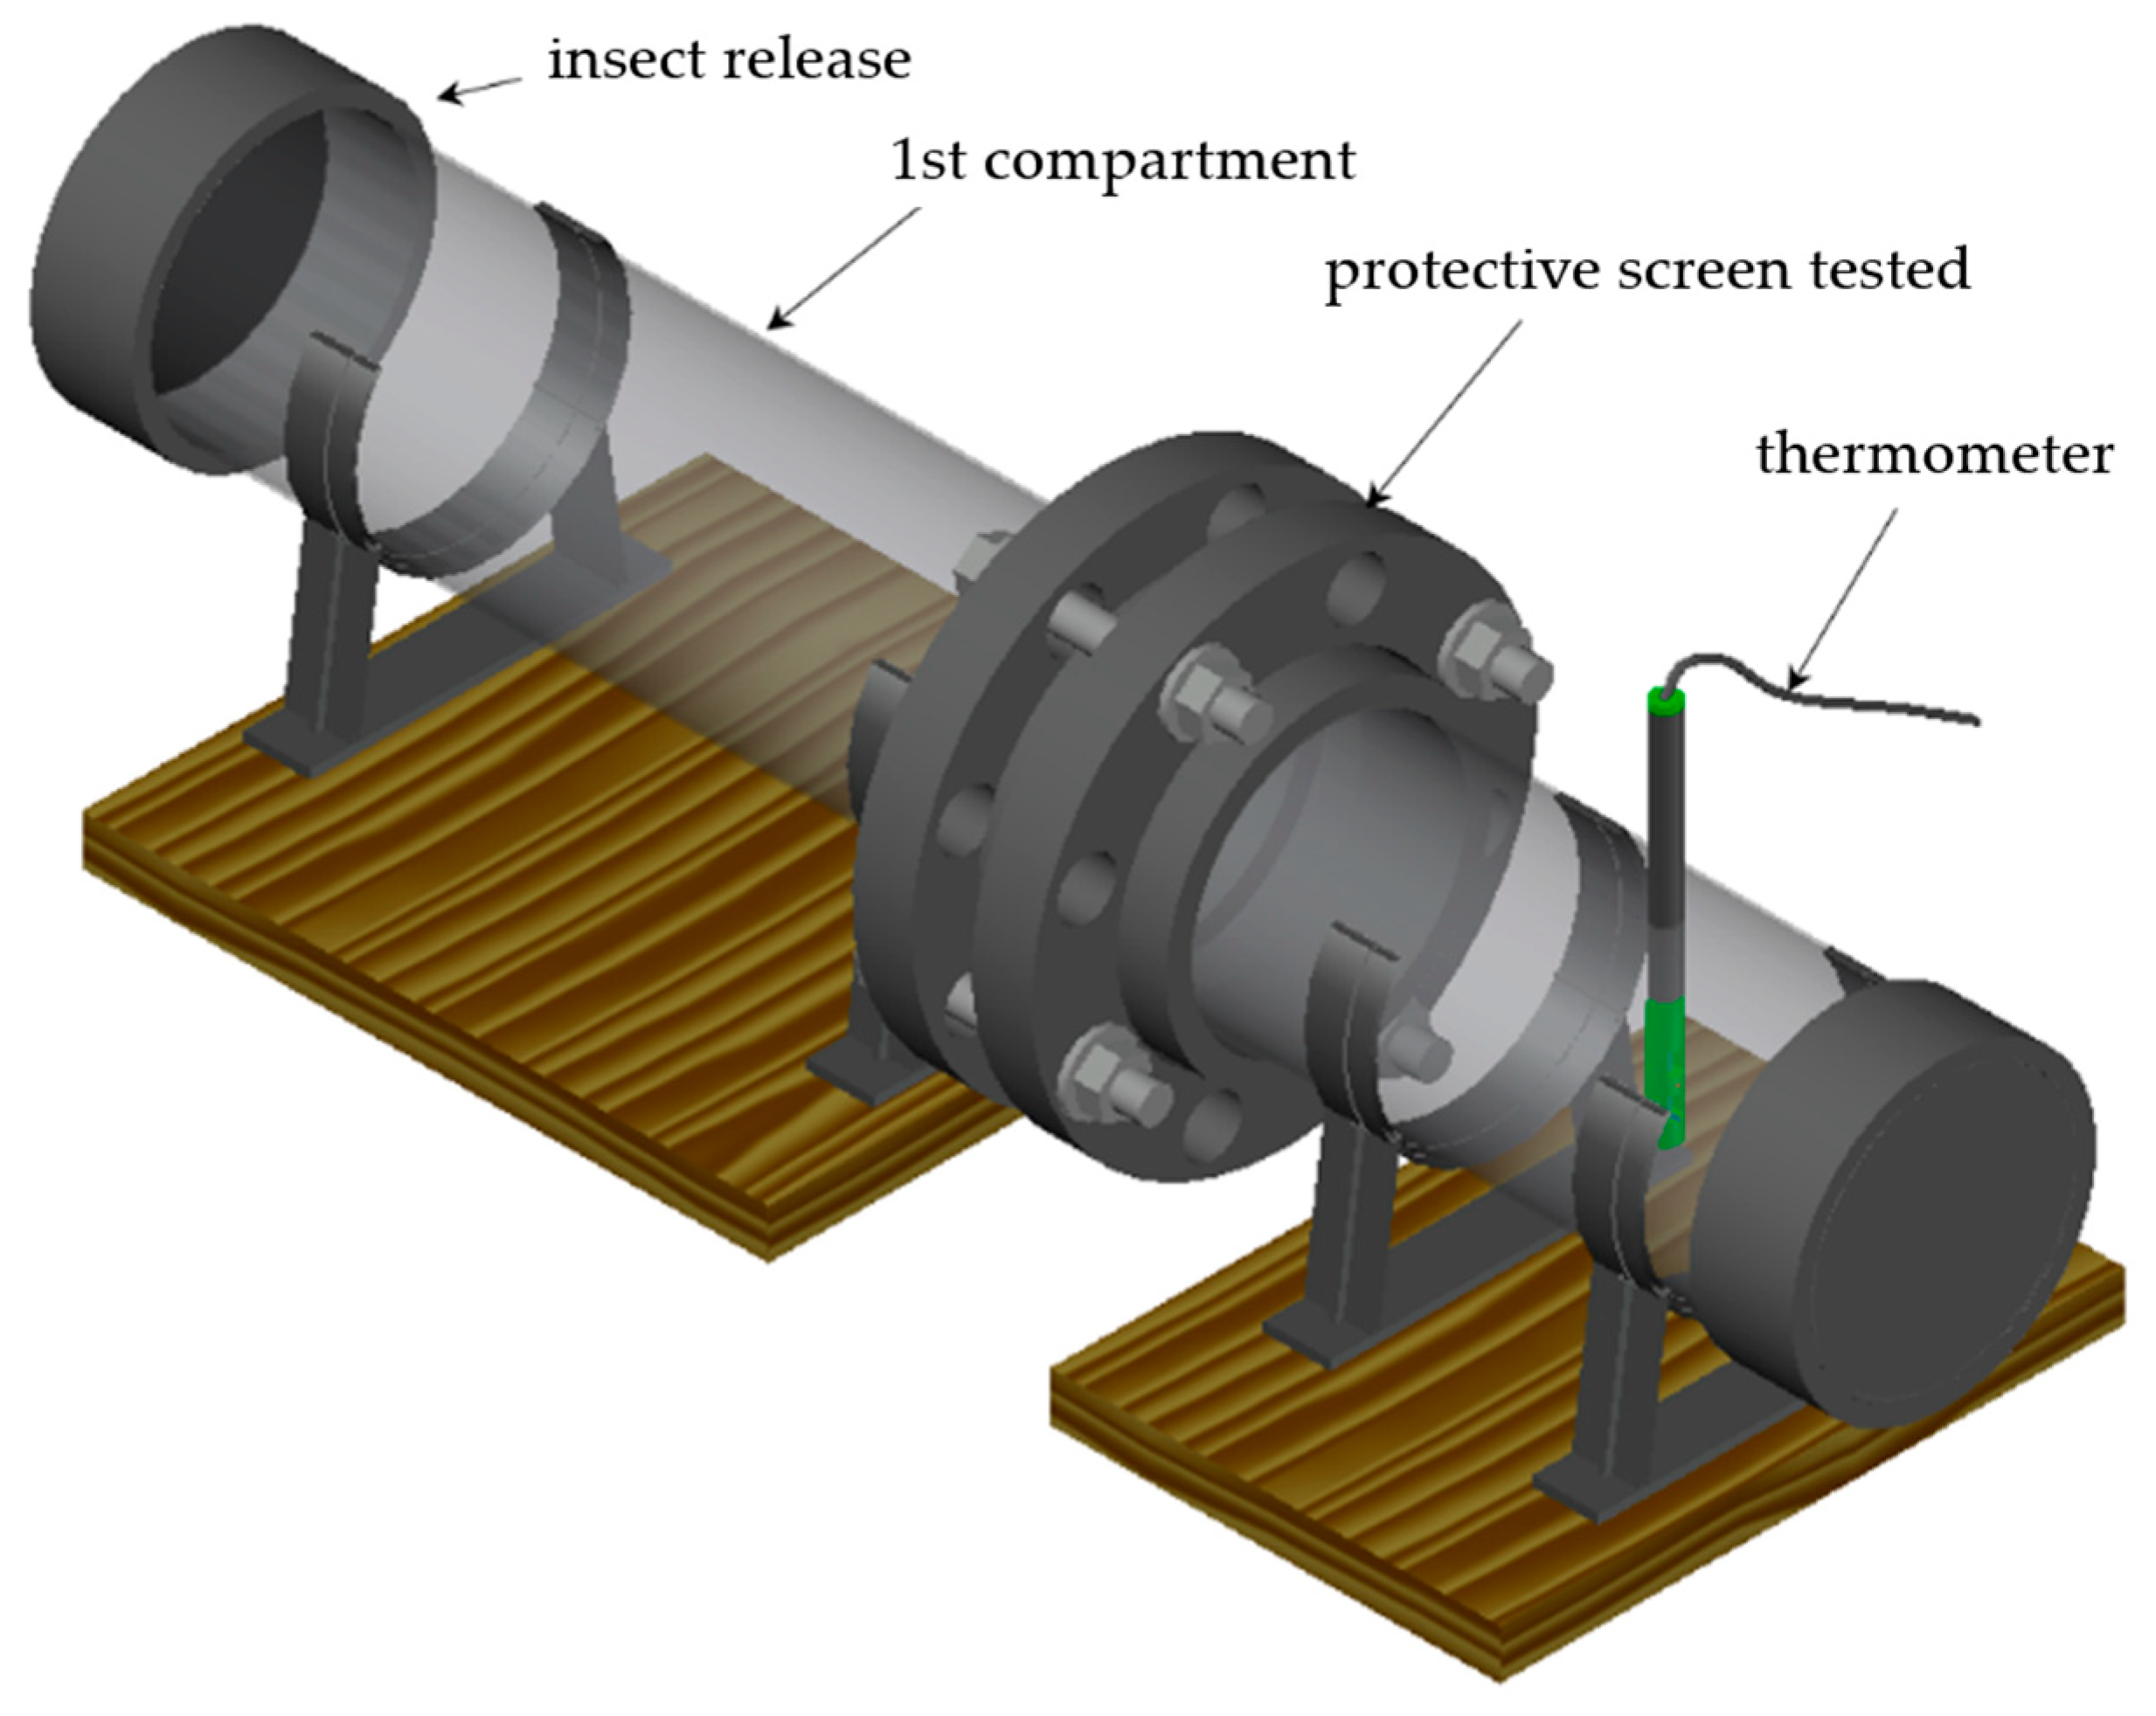
2.1. Device to Measure the Efficacy of Textiles against Insects

Laboratory tests have been carried out to measure the efficacy of a selected group of commercial insect-proof screens. Laboratory tests allow greater control of the variables involved in the relationship between insects and the textile. To carry out the tests, a device has been designed consisting of a transparent PVC tube, 11 cm in diameter, divided into two compartments that are arranged horizontally. The union between the two compartments is achieved by means of a set of flanges between which the textile sample is inserted. The ends of the two connected compartments are closed by plugs. One of the compartments has a small hole through which insects are released into the device. A thermometer (model HD29V37TC12, Delta OHM) installed in the second compartment allows us to measure the test temperature due to the importance of this variable in insect activity (Figure 2).
Each test consists of three repetitions. Approximately 150 individuals are released within the device in each repetition. After release, the release chamber is covered with a black plastic film to prevent light passage. The other chamber contains a food stimulus consisting of an eggplant leaf (Solanum melongena) whose petiole is inserted into an Eppendorf tube filled with water to prevent the leaf from dehydrating. This second chamber is illuminated with a fluorescent tube (Philips TL-D 36W/54-765) placed over the test device (parallel and aligned with its axis) at a distance of 25 cm. The illumination of the chamber, together with the food stimulus, encourages the insects to pass from the dark chamber in which they were released to this second compartment through the textile if the size of the holes allows them to pass. The experimental setup is maintained for 24 h. After this time, a watch glass with a few drops of chloroform is placed inside the device to anesthetize the insects. Once the insects are immobile, the two compartments are separated, and the number of insects in each one is counted. The efficacy ε of the screen is determined by the ratio of the number of insects that do not pass through the physical barrier to the total number of insects involved in the test:
ε % = N 1 c N 1 c + N 2 c 100
where N1C is the number of insects remaining in the release compartment, and N2C is the number of insects in the second compartment after crossing the textile.
The mass rearing of B. tabaci was carried out in the laboratory on potted eggplants (S. melongena). The initial sample of B. tabaci was collected in the greenhouse of the University of Almeria Campus (36°49′36″, −2°24′36″). The temperature in the laboratory during rearing was around 22 °C, and the plants were grown at a photoperiod of 16:8 h (light:dark). The insects were captured with an entomological aspirator and then introduced into the described test device. The dimensions of the laboratory-reared B. tabaci population were measured using digital images obtained under a microscope and generic image editing software.

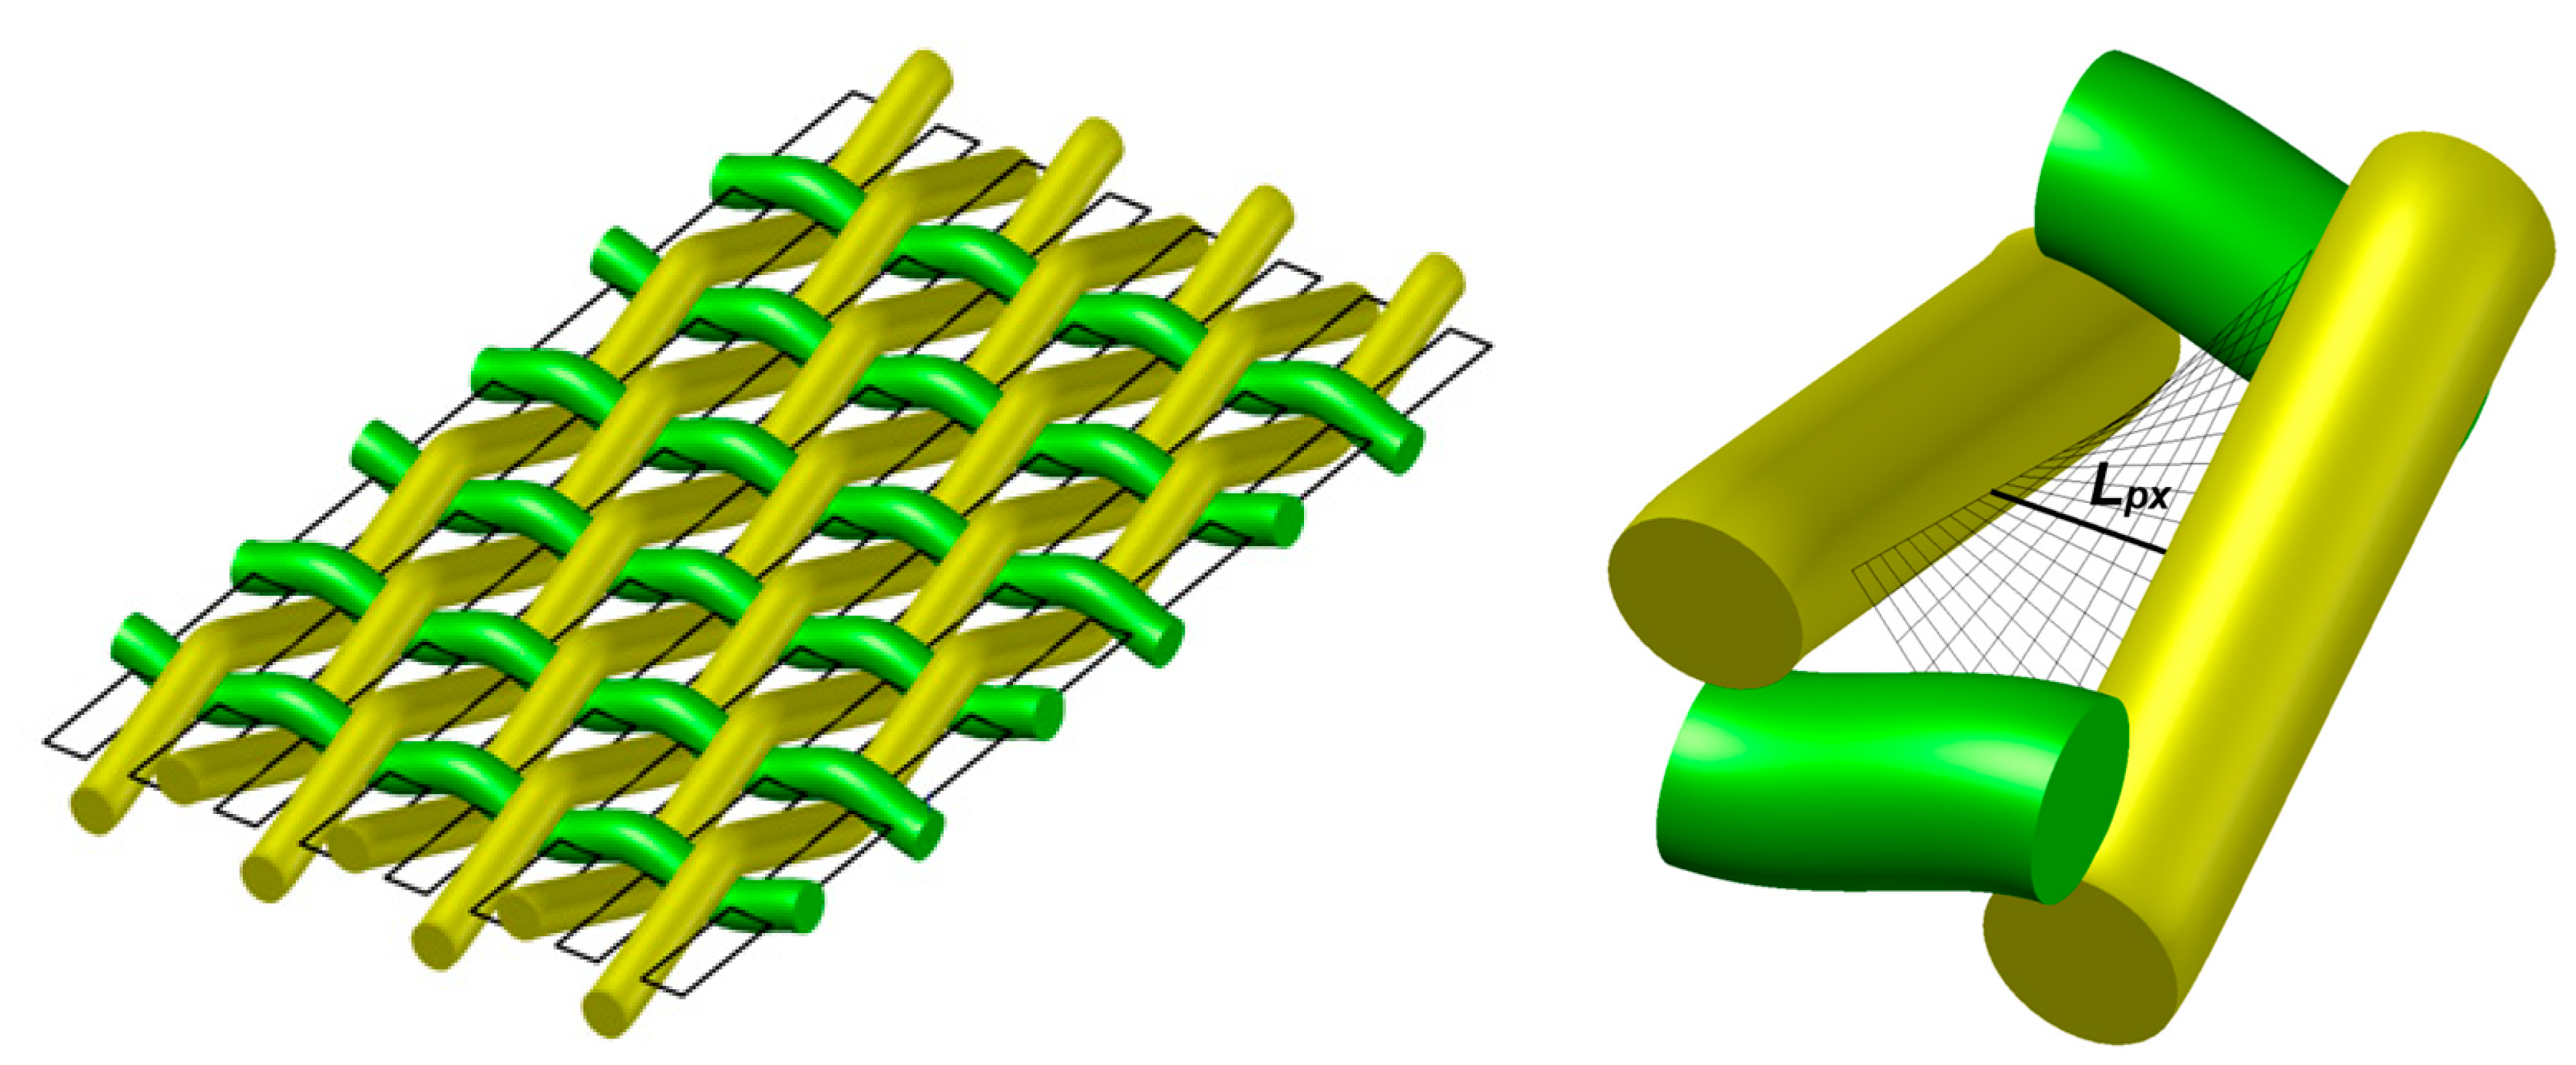
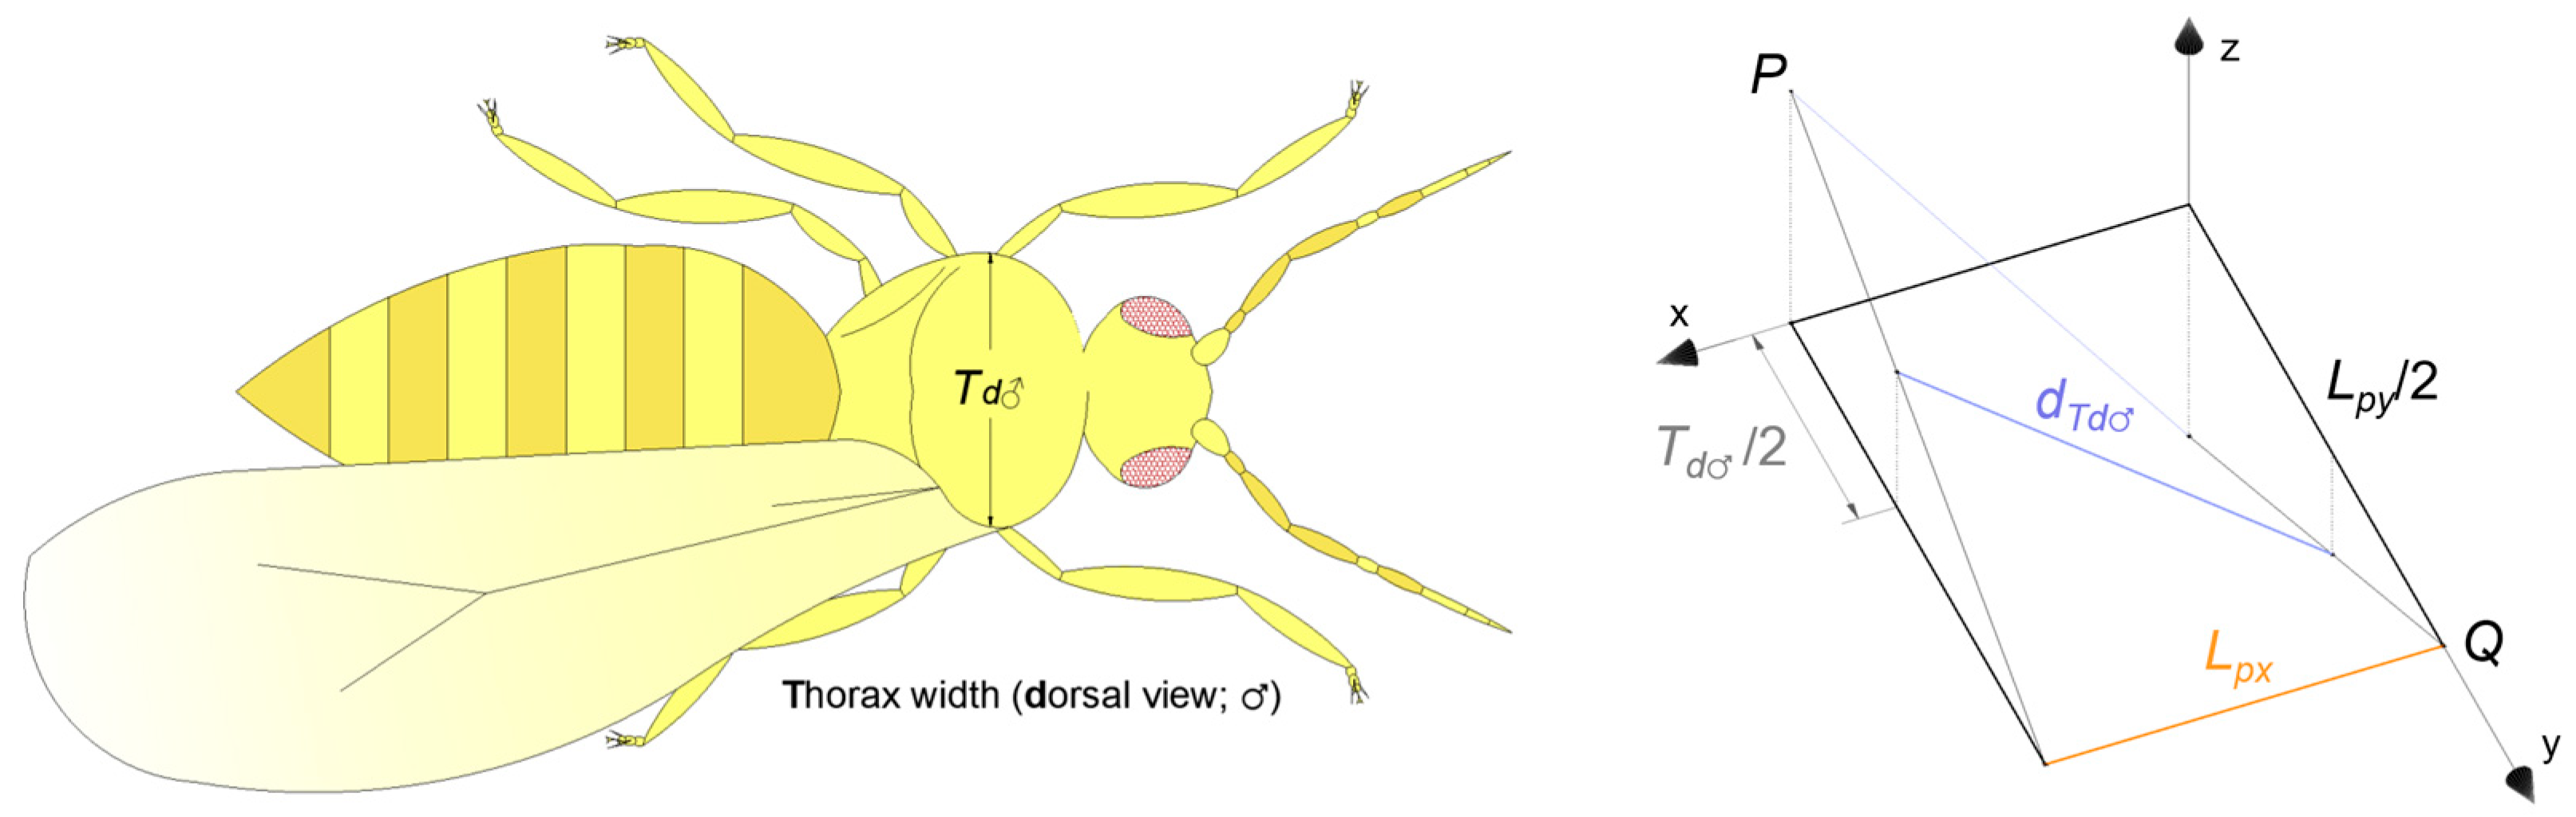
2.2. Selection and Geometric Characterization of the Protective Screens

Eight commercial insect-proof screens have been selected following the criterion that the textiles have similar hole widths Lpx and differ in the length of the holes Lpy. In this way, it is possible to evaluate the influence of this variable (Lpy) on the efficacy ε of the textiles against B. tabaci. The selection of the textiles tested has consisted of considering (according to our experience and the commercial offer) holes of dimensions that would allow the passage of B. tabaci in calm conditions with the aim of obtaining efficacies of less than 100% to compare between the textiles that were chosen for their similarity in hole width and their variability in hole lengths. The threads used to make the fabrics are made of high-density polyethylene (HDPE). The textiles have not been used in the field.
The geometrical characteristics of the fabrics have been obtained following the methodology described in [21], which uses software (Euclides v1.4) that analyses digital images obtained under a microscope or stereo microscope and can obtain the coordinates of the vertices that define the holes of the porous matrix analyzed. From these pairs of data, it is possible to calculate all the parameters that characterize the textile from a geometric point of view: the width Lpx and length Lpy of the holes, the number of threads per unit length ρx × ρy (thread density), the thickness of the weft Dhx and warp threads Dhy, and the porosity φ.

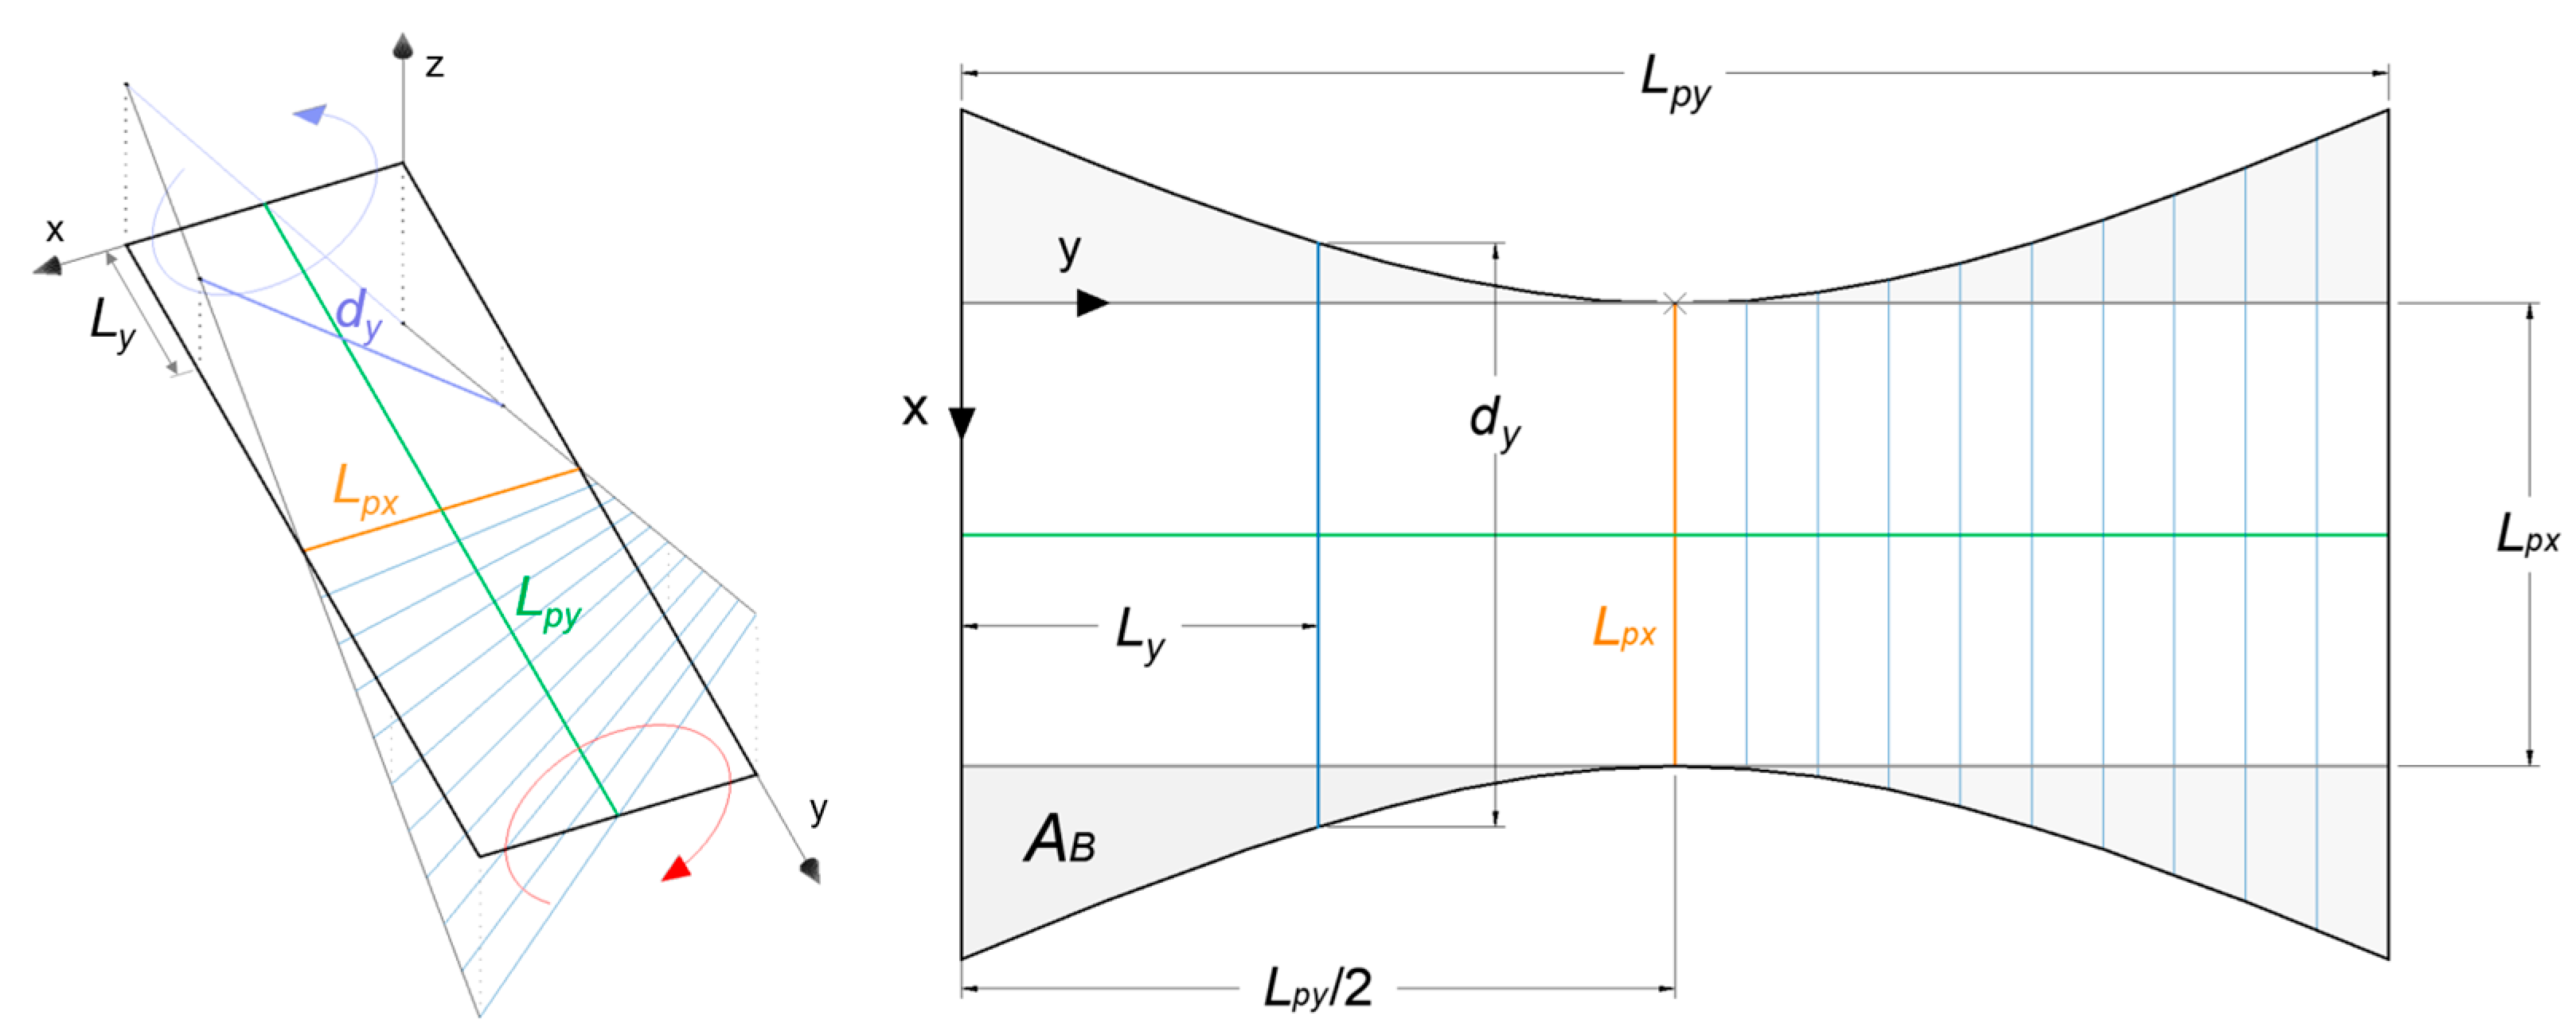
2.3. Three-Dimensional Characterization of Protective Screens

The perpendicular interlacing between warp and weft threads (Figure 3) implies that both sets of threads undergo deformations that determine that the weave structure does not conform to a plane. Considering the spatial arrangement of the threads is of great importance when it comes to the exclusion of insects since the separation between the threads is larger than the distance between the threads measured in the images taken under a microscope (2D). The spacing between two consecutive warp threads is not constant but varies from the center of the hole (considering the longitudinal direction) to the end (defined by the weft thread closing the contour). The hole surface area A3D is also larger than the one considered in the orthogonal projection measurements A2D. The first step in the three-dimensional characterization of the protective screens is to measure the thickness of the textiles. For this purpose, we used a digital micrometer (model 3050T, Baxlo) and followed the protocol of the ISO 5084: 1996 standard [22].
The porous surface defined by the crossing of two weft threads and two consecutive warp threads has been identified as a hyperbolic paraboloid region [23] (Figure 3 and Figure 4). It is a warped surface, that is, a ruled surface (doubly ruled in this case), which is not developable since two consecutive positions of the generatrix are not coplanar. This means that this type of surface cannot be extended on a plane as a cylindrical or conical surface can. The length dy of any generatrix on this surface can be calculated by the following expression [23,24]:
d y = L p x 2 + t t D h y L p y 2 L y L p y 2
where Lpx and Lpy are the width and length of the hole measured in orthogonal projection, respectively; tt is the thickness of the textile; and Ly is the distance measured from a hole vertex in the longitudinal direction (2D), which can take values between 0 and Lpy.
The approximate method [23,24] proposes to calculate the surface area of the three-dimensional hole surface by “flattening” this warped surface (Figure 4). Since this surface is not developable, it is an approximate method that slightly underestimates the values. The approximate area of the surface defined by the spatial configuration of two consecutive warp threads bounded by two consecutive weft threads is as follows:
A 3 D = L p x L p y + 4 A B
where AB is the area enclosed between the abscissa axis and the second-degree polynomial that defines one of the branches shown in Figure 4.
A B = 0 L p y 2 k x 2 + m x + n d x = k x 3 3 + m x 2 2 + n x 0 L p y 2 = k L p y 3 24 + m L p y 2 8 + n L p y 2
where k, m, and n are the parameters of the best polynomial fit that defines one of the branches of the hyperbola (Figure 4). Finally, from Equations (2) and (3), we obtain the expression that allows for the approximate calculation of the area of the porous surface:
A 3 D = L p x L p y + 4 A B = L p x L p y + k L p y 3 6 + m L p y 2 2 + 2 n L p y

2.4. Determination of the Sample Size

To estimate the population means (tagma sizes), the following expression has been used to determine the sample size n [25]:
n = σ z α / 2 E 2
where σ is the population standard deviation, E is the established error margin, and zα/2 is the critical value based on the desired confidence level (zα/2 = 1.96 for the normal distribution, considering a confidence level of 95%). Allowing an error of 10 μm and estimating the population standard deviation at 25 μm, the value of n would have to be greater than 24 individuals. The differences between the sample sizes n of males and females (Table 1) are justified considering the differences between the sex ratios of this species.

3. Results

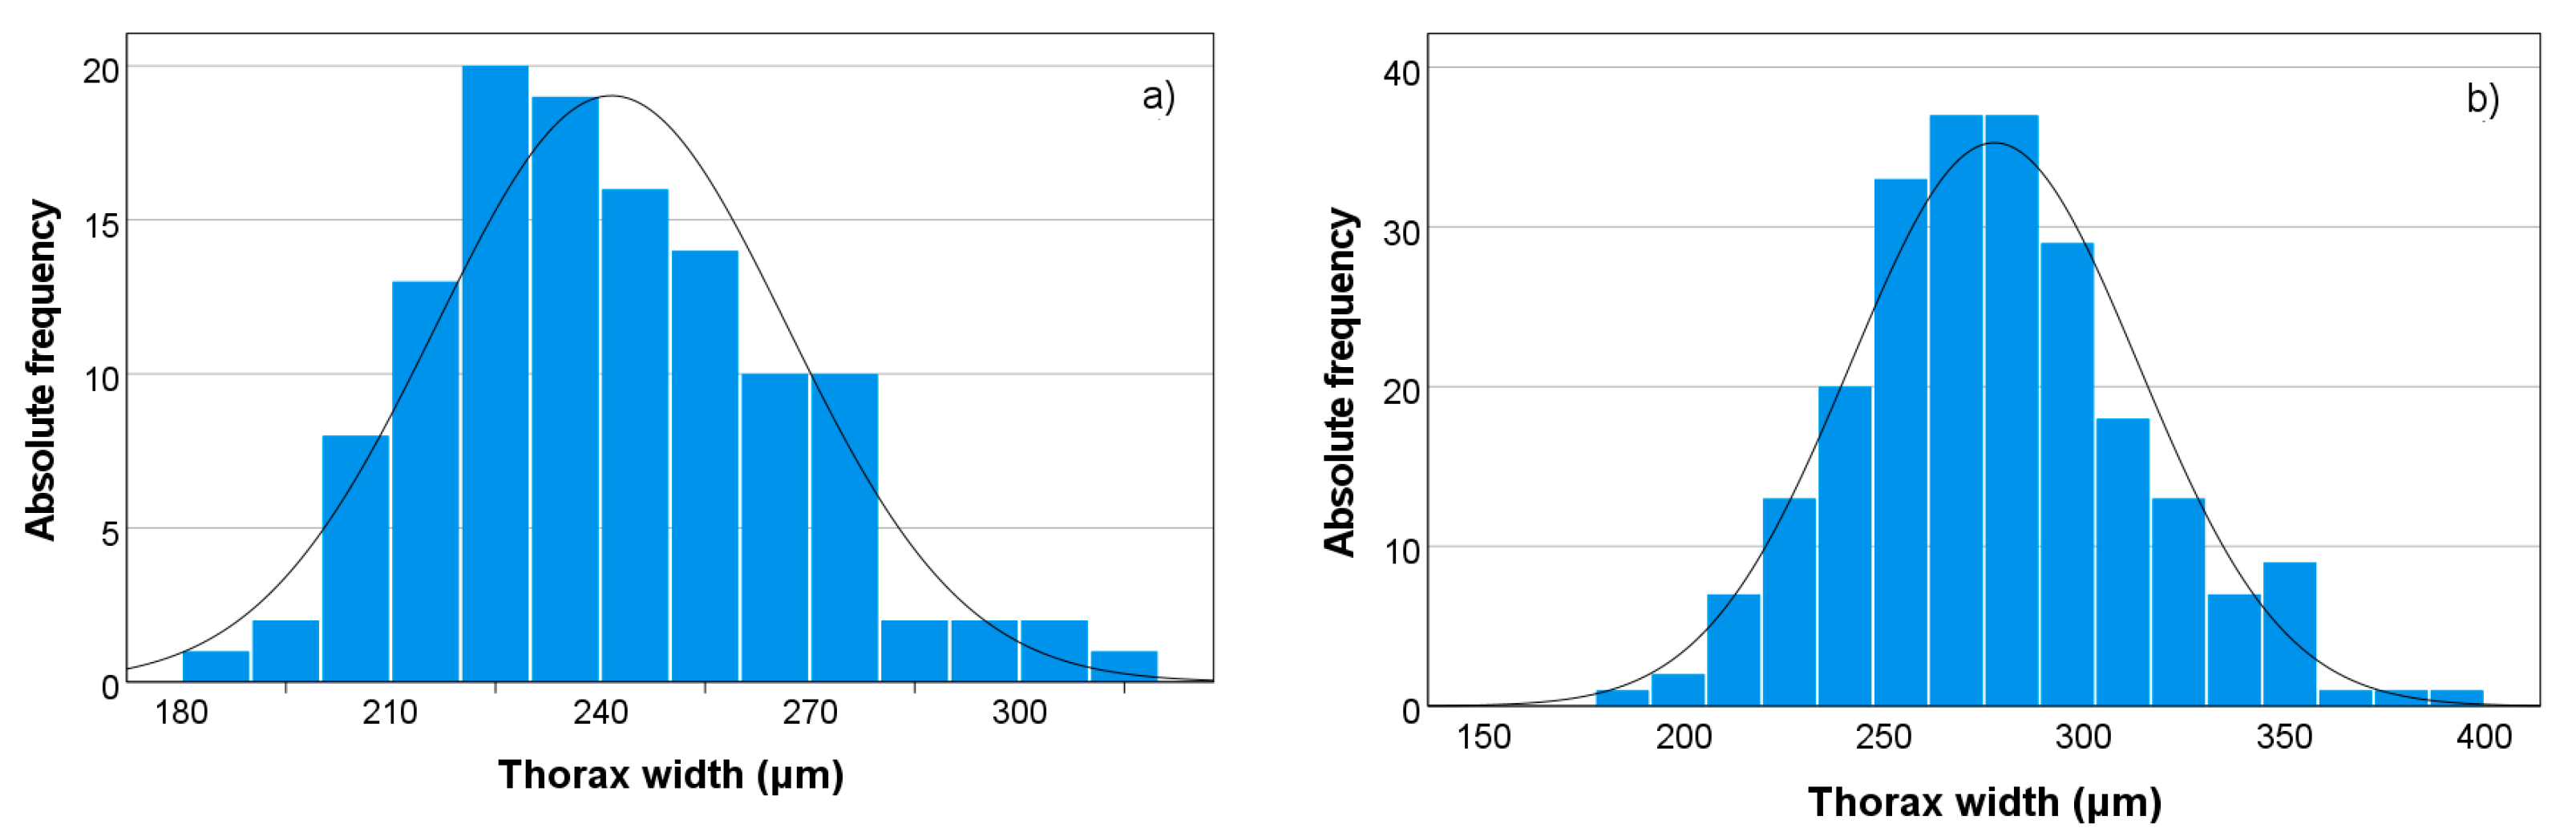
3.1. Morphometric Analysis of B. tabaci

Table 1 shows the mean, maximum, and minimum values of the thorax, abdomen, and length of the sampled population of B. tabaci reared in the laboratory. All measurements were made on the dorsal view of the insects and indicated that the females were larger than the males. The largest tagma is the abdomen for females and the thorax for males. The abdomen is the tagma that shows the greatest differences between males and females.

3.2. Geometric Characterization of the Selected Textiles

Table 2 summarizes the values of the geometrical variables that define the textiles used in the tests (the textiles are arranged according to the hole length Lpy). The hole width Lpx is defined by the thread density in the warp direction ρy and the thickness of the warp threads Dhy. In the case of the selected textiles, the small differences between the thread densities compensated by the small differences between the thread thicknesses result in hole widths that are very close to each other, all of which lie in the range between 348 and 367 μm. On the other hand, the differences in weft thread densities ρx and, to a lesser extent, the differences in weft thread thickness Dhx offer a wide range of hole lengths Lpy (between 387 and 1018 μm) that will allow us to relate this variable to the efficacy of the textiles.
The porosity values shown in Table 2 have been measured on the digital images following the method described in the Materials and Methods section. The porosity of the textiles can be expressed as the ratio of the hole surface to the total surface, and its calculation is influenced by both the hole dimensions (Lpx and Lpy) and the thickness of the threads (Dhx and Dhy):
φ = L p x L p y L p x + D h y L p y + D h x
This suggests that porosity increases with increasing hole width Lpx and hole length Lpy and decreases with increasing thread thicknesses (Dhx and Dhy). Therefore, in Table 2, the order of the fabrics with respect to the hole length Lpy does not correspond exactly to increasing porosities due to the small differences in the hole widths Lpx and the thread thicknesses (Dhx and Dhy).

3.3. Efficacy of Textile Physical Barriers

Figure 5 shows the results obtained in the efficacy tests against B. tabaci carried out with the eight insect-proof screens selected under calm conditions (without simulating the effect of the wind). The trend shows that the efficacy of the textiles decreases with increasing hole length. For example, textile number 5 with a hole length of 363 μm gives an efficacy against B. tabaci of 98.8%, while if the length value is increased to 1018 μm, the efficacy values drop drastically to 17.8% (screen number 3). Textile numbers 2 and 6 show an efficacy of over 60%, with higher performance than textile numbers 4, 7, and 8 with smaller hole lengths.
Therefore, the results represented in Figure 5 show that the hypothesis we are trying to prove, which states that the hole length does not influence the efficacy of protective screens, is false. The one-way ANOVA test confirms this statement since it gives an F-value of 15.183 and a p-value < 0.001 in the study relating the hole length values Lpy to the efficacy achieved. The statistically different groups are indicated in Table 2 according to the results obtained in the Student–Newman–Keuls test.

4. Discussion

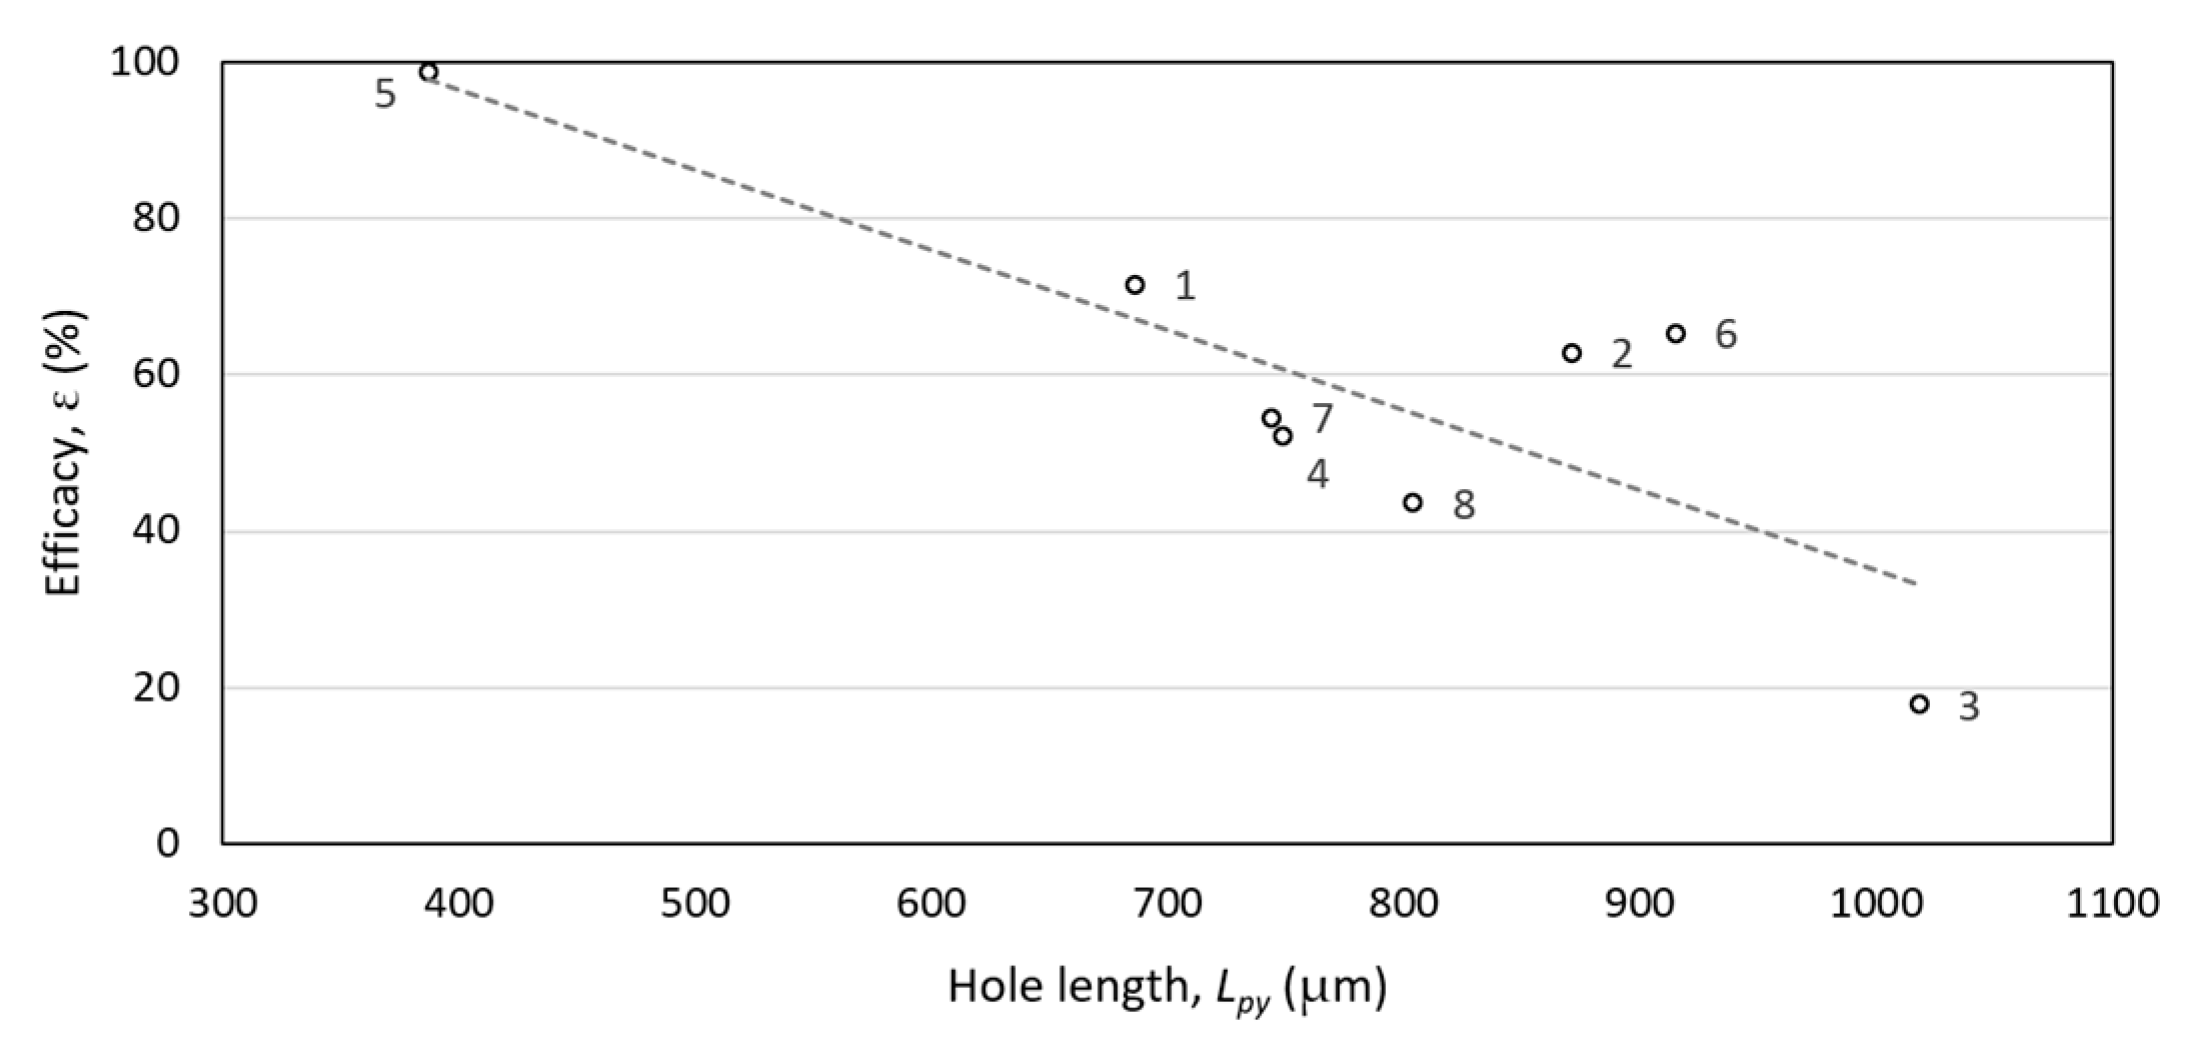
4.1. Hole Dimensions vs. Insect Size

The hole dimensions of an effective protective textile against a given pest species should be established according to the dimensions of the insects. In the case of B. tabaci, taking into account the smaller size of the males and taking into account the mean values, the reference is 242 μm which corresponds to the thorax width (Table 1). In the case of females, the mean value for thorax width is 278 μm. Other authors [14] have given mean values of 216 μm for males and 261 μm for females [14]. Although in females, the abdomen is larger than the thorax, thorax measurements are usually considered a reference in the design of the hole size due to the greater rigidity of this tagma [14].
The differences between the mean values provided in this work are normal compared to other studies, given the influence that variables such as temperature have on the size of the individuals [26]. However, this variation in the sizes of individuals forces the particularization of the design of the textiles according to the geographical location and even the annual period of greatest pest incidence.
Continuing with the measurements shown in Table 1 and using a simplistic analysis, it would be necessary to have holes with a width of less than 242 μm to avoid insects passing through the screen. Obviously, the problem is much more complex since this reference measurement is an average value, and obviously, there are individuals of smaller size (Table 1 and Figure 6). As can be seen in the frequency histogram in Figure 6, in the sampled population, there is a representation of sizes below the average with high relative frequencies. This might suggest that for design purposes, some percentile values should be considered instead of the mean values.
On the other hand, it is also necessary to consider the presence of wings in this species and to take into account that these organs make it difficult for insects to pass through the holes. Other variables known to influence the textile-insect relationship are temperature and air velocity [27]. In summary, it is very difficult to predict a reference value for the hole width to ensure the exclusion of B. tabaci or any other species, given all the factors involved [14], but it is clear that average values are not a good option. In any case, it is essential to support theoretical predictions with laboratory tests to assess the efficacy of protective screens.

4.2. Prison Effect Assessment

The null hypothesis that hole length does not influence the efficacy of the textiles has been rejected in view of the results and the statistical analysis carried out (Table 2 and Section 3.3). Therefore, the design strategy followed by manufacturers to improve the porosity values of textiles results in a reduction in the efficacy of physical barriers, achieving just the opposite effect to the one desired from the point of view of crop protection. In other words, as the hole length increases (at the same width), the efficacy of the textiles decreases (at least in the range of values tested). Therefore, these screens will have a higher permeability to airflow (due to their higher porosity) but will be less restrictive in terms of insect exclusion.
In order to find the reasons that contraindicate the prison effect as a design strategy, it is necessary to take into account that, in this approach, the woven structure of insect screens is considered to conform to a plane, that is, the woven structure can be explained in two dimensions from a macroscopic point of view. However, from an insect perspective, the region defined by the crossing of threads that make up a hole cannot be explained from the two-dimensional perspective, and it is necessary to resort to the third dimension to explain it [23,24,28] (Figure 3).
The described methodology based on the geometrical characterization of fabrics from digital images obtained under a microscope only allows measurements of the orthogonal projection of the textiles. However, the spatial arrangement of the threads that make up the fabric determines that the three-dimensional structure of the fabric is important from the point of view of insect exclusion. During the textile design phase, the density and thickness of the textile threads can be defined, and from these variables, the rest of the parameters that characterize the 2D screen can be obtained. Going a step further and trying to characterize the textile three-dimensionally in this design phase implies knowing the value of the thickness tt that the fabric will have. If the threads would not undergo any deformation or if it would be negligible, the thickness of the mesh would be the sum of the thicknesses of the warp and weft threads (Dhx + Dhy). However, as can be seen in Table 3, the thickness tt of the textiles is less than the sum of the thicknesses (the ratio (Dhx + Dhy)/tt offers values lower than unity), and with these variables, no relationship can be established that allows us to predict the thickness tt. Therefore, in addition to the variables that define the textile, such as the density and thickness of the threads, other variables related to the loom adjustments during the making process finally determine the thickness tt of the protective screen.
To quantify the shape of the holes, a shape ratio can be obtained from the ratio between the width and length of the holes (Lpx/Lpy) (Table 3). As the shape ratio approaches unity, we have hole geometries in which the difference between the width Lpx and the length Lpy is small, and therefore, the holes are close to a square. On the other hand, as the shape ratio decreases in value, the difference between width and length is marked, and we are dealing with holes in which the weft threads are further apart in relation to the warp threads. Table 3 also shows the distance DPQ between points P and Q (Figure 7). Considering half of the hole, this is the largest distance left by the threads. In this case, it does not offer any additional information because the hole width is not a variable, but it can be a very interesting parameter when comparing protective screens with different hole widths and lengths.
As expected, the three-dimensional porous surface area A3D calculated with Equation (4) gives higher values than the surface area A2D measured in the images obtained under the microscope (Table 3). The increase in the porous surface area obtained by considering the spatial arrangement of the threads is variable depending on the textile considered since it depends on the thickness of the screens and the thickness of the threads (Table 3). Therefore, using finer threads in the manufacturing process will allow us to obtain fabrics of lesser thickness with smaller differences between the 2D and 3D porous surface areas, which can have a positive effect on the exclusion of insects (and in the porosity).
In the three dimensions, the only generatrix of the hole surface area that coincides with Lpx (hole width measured in the two dimensions) is the hole axis (central part of the distance between the warp threads, Figure 3 and Figure 4). This is the most restrictive place for the passage of insects because it coincides with the minimum separation between the warp threads. Taking into account the thorax of males Td (the smaller one), the generatrix of the 3D porous surface area that is at a distance 242/2 μm (half the average thorax dimension) taken from the outline of the weft thread that closes the hole in the warp direction is dTd (Ly = Td/2 ⇒ dy = dTd) (Table 3, Equation (1) and Figure 7). This value can serve as an indicator of whether the distance of the warp threads considered in space is small enough to prevent the passage of insects. In addition, it should be checked that the middle of the hole (Lpy/2) has a value lower than the mean value of the considered thorax measurement Td. Therefore, screen number 5 is the only one with an efficacy close to 100%. These parameters do not perfectly order the screens according to their efficacy, which may be due to the variability in the sizes of the insects captured for each test and the small differences between the textiles in terms of thread densities, thread thicknesses, and thickness. The hole uniformity of the meshes should also be considered, and the screen color (crystal, black, and white) can also be a factor of variability.
According to the above, a limit on hole length Lpy must be defined to separate the weft threads Lpx based on the reference measurement chosen according to the pest species considered. To set this limit, previous theoretical considerations can be made to allow textile prototype designs; however, given the complexity of the three-dimensional problem, together with the variability of sizes in insect populations and their ability to pass through the holes, it must be the experimentation that allows obtaining definitive solutions.
Given the size distributions of insect populations, the consideration of mean values of their body measurements is not a good indicator when designing screen holes. For design proposals, it might be interesting to choose some percentile (<50) instead of mean values.
From a macroscopic point of view, considering that the textile conforms to a plane, bringing the warp threads closer together would be sufficient to guarantee greater efficacy of the textile regardless of the distance between the weft threads. However, from the microscopic perspective, the weave structure is three-dimensional and is defined by the alternating crossing of warp and weft threads in space. When considering the warp threads in the context of a single hole, the minimum distance between them coincides with the middle of the hole, and this separation coincides with the distance Lpx measured in digital images taken under a microscope. However, the spatial separation between the threads increases as we move towards the weft thread that closes the contour, and therefore, the insect has more space to pass through. Therefore, we can say that this minimum distance Lpx divides the hole into two parts in such a way that results in the following:
  • If the hole is long enough, one of the halves will offer a porous surface large enough for the insect to pass through. Additionally, that is what happens in holes as their length increases: the spatial separation of the warp threads increases from the segment defining the axis of the hole, and the insects find a larger free surface to pass through the textile.
  • However, if the hole, although rectangular, is not long enough, the insect will not be able to pass through any of the halves defined by the central axis, and in these cases, the spacing between the weft threads according to the design criterion will improve the porosity without loss of efficacy, considering that the hole width is well defined according to the target pest species.
Given a sufficiently restrictive hole width for the passage of B. tabaci, the limit that establishes that an increase in hole length does not imply a loss of efficacy in the screen is difficult to determine and will depend on the species under consideration. In the case of B. tabaci, it can be said that the length of each hole half may be at most equal to the thorax width of the flies or the chosen percentile, but it will be the experimentation that will define the optimal dimensions more accurately.

5. Conclusions

The population size distribution of the target pest species should be considered to improve the design of protection screens. In this respect, the average values of the body of the insects are not a good reference in the design of these textiles.
The design strategy (prison effect) followed by manufacturers to achieve insect-proof screens effective against B. tabaci, but at the same time to avoid high thread densities resulting in low porosity and low air-permeability textiles, causes drops in efficacy as the hole length increases due to the arrangement of the threads in the space (at least in the case of the B. tabaci species and for the range of values considered in this work). Therefore, another aspect of improving protection screen design is to take into account the three-dimensional reality of the holes. For this, it is necessary to know the thickness of the textiles, but although it can be estimated, it cannot be predicted with accuracy because variables related to the loom settings are involved.
Future research could assess how the efficacy of textiles designed under the effect prison criterion evolves considering smaller hole widths than those considered in this work. Another line of work would involve the evaluation of the prison effect with other pest species.

Author Contributions

Conceptualization, A.J.Á. and R.M.O.; methodology, A.J.Á. and R.M.O.; software, A.J.Á.; validation, A.J.Á. and R.M.O.; formal analysis, A.J.Á. and R.M.O.; investigation, A.J.Á. and R.M.O.; resources, A.J.Á. and R.M.O.; data curation, A.J.Á. and R.M.O.; writing—original draft preparation, A.J.Á. and R.M.O.; writing—review and editing, A.J.Á.; visualization, A.J.Á.; supervision, A.J.Á.; project administration, A.J.Á.; funding acquisition, R.M.O. All authors have read and agreed to the published version of the manuscript.

Funding

This research received no external funding.

Institutional Review Board Statement

Not applicable.

Informed Consent Statement

Not applicable.

Data Availability Statement

Not applicable.

Acknowledgments

The authors are thankful to the following companies and institutions for their support: AB Ludvig Svensson; Beniplast-Benitex S.A.; Condepols S.A.; Cotexsa Alcalaina S.A.; Criado y López S.L.; Ginegar Plastic Products Ltd.; Granada-La Palma S.C.A; Holland Gaas BV; Politiv Europe; Saint Gobain Cultilene; Textil Villa de Pego S.L.; and Wageningen UR Greenhouse Horticulture.

Conflicts of Interest

The authors declare no conflict of interest.

References

  1. Bailey, B. Screens stop insects but slow airflow. Fruit Veg. Technol. 2003, 3, 6–8. [Google Scholar]
  2. Berlinger, M.J.; Gol’berg, A.M.; Dahan, R.; Cohen, S. The use of plastic covering to prevent the spread of tomato yellow leaf curl virus in greenhouses. Hassadeh 1983, 63, 1862–1865. [Google Scholar]
  3. Berlinger, M.J.; Dahan, R.; Mordechai, S. Integrated pest management of organically grown tomatoes in Israel. Appl. Agric. Res. 1988, 3, 233–238. [Google Scholar]
  4. Berlinger, M.J.; Lebiush-Mordechi, S.; Leeper, A. Application of screens to prevent whitefly penetration into greenhouses in the Mediterranean basin. Bull. OILB SROP 1991, 14, 105–110. [Google Scholar]
  5. Berlinger, M.J.; Leblush-Mordechl, S.; Fridja, D.; Mor, N. The effect of types of greenhouse screens on the presence of western flower thrips: A preliminary study. OILB-SROP Bull. 1992, 16, 13–19. [Google Scholar]
  6. Robb, K.L.; Parrella, M.P. Chemical and no-chemical control of western flower thrips. In Proceedings of the Fourth Conference of Insect and Disease Management on Ornamentals, Kansas City, MO, USA, 1–3 March 1988; pp. 94–103. [Google Scholar]
  7. Baker, J.R.; Jones, R.K. Screening as part of insect and disease management in the greenhouse. N.C. Flower Grow. Bull. 1989, 34, 1–9. [Google Scholar]
  8. Roberts, W.J.; Vasvary, L.; Kania, S. Screening for insect control in mechanically ventilated greenhouses. ASAE 1995, 95-4541, 12. [Google Scholar]
  9. Baker, J.R.; Shearin, E.A. An update on screening for the exclusion of insect pest. N.C. Flower Grow. Bull. 1994, 39, 6–11. [Google Scholar]
  10. Ross, D.S.; Gill, S.A. Insect screening for greenhouses. In Agricultural Engineering Information Facts; University of Maryland: College Park, MD, USA, 1994; Volume 186, pp. 1–21. [Google Scholar]
  11. Teitel, M. The effect of insect-proof screens in roof openings on greenhouse microclimate. Agric. For. Meteorol. 2001, 110, 13–25. [Google Scholar] [CrossRef]
  12. Soni, P.; Salokhe, V.M.; Tantau, H.J. Effect of screen mesh size on vertical temperature distribution in naturally ventilated tropical greenhouses. Biosyst. Eng. 2005, 92, 469–482. [Google Scholar] [CrossRef]
  13. Bethke, J.A. Screening Greenhouses for Insect Size. Grow. Talks 1990, 102. [Google Scholar]
  14. Bethke, J.A.; Paine, T.D. Screen hole size and barriers for exclusion on insect pest of glasshouse crops. J. Entomol. Sci. 1991, 26, 169–177. [Google Scholar] [CrossRef]
  15. Bethke, J.A. Considering installing screening? This is what you need to know. Greenh. Manag. 1994, 13, 34–37. [Google Scholar]
  16. Kanakala, S.; Ghanim, M. Global genetic diversity and geographical distribution of Bemisia tabaci and its bacterial endosymbionts. PLoS ONE 2019, 14, e0213946. [Google Scholar] [CrossRef] [PubMed]
  17. Burban, C.; Fishpool, L.D.C.; Fauquet, C.; Fargette, D.; Thovenel, J.C. Host-associated biotypes within west African populations of the whitefly Bemisia tabaci (Gennadius), (Hom., Aleyrodidae). J. Appl. Entomol. 1992, 113, 416–423. [Google Scholar] [CrossRef]
  18. Jones, D.R. Plant viruses transmitted by whiteflies. Eur. J. Plant. Pathol. 2003, 109, 195–219. [Google Scholar] [CrossRef]
  19. Navas-Castillo, J.; Fiallo-Olivé, E.; Sánchez-Campos, S. Emerging virus diseases transmitted by whiteflies. Ann. Rev. Phytopathol. 2011, 49, 219–248. [Google Scholar] [CrossRef]
  20. Álvarez, A.J.; Oliva, R.M. First laboratory experiences and field observations on the validity of the prison effect. 2021; unpublished work. [Google Scholar]
  21. Álvarez, A.J.; Oliva, R.M.; Valera, D.L. Software for the geometric characterisation of insect-proof screens. Comput. Electron. Agric. 2012, 82, 134–144. [Google Scholar] [CrossRef]
  22. ISO 5084:1996; Textiles—Determination of Thickness of Textiles and Textile Products. International Organization for Standardization: Geneva, Switzerland, 1996; 5p.
  23. Álvarez, A.J.; Oliva, R.M.; Jiménez-Vargas, A.; Villegas-Vallecillos, M. A three-dimensional approach to the porous surface of screens. J. Text. Inst. 2019, 110, 639–646. [Google Scholar] [CrossRef]
  24. Álvarez, A.J. Estudio de las características geométricas y del comportamiento aerodinámico de las mallas antiinsectos utilizadas en los invernaderos como medida de protección vegetal. Editor. Univ. Almer. 2010, 273, 446. [Google Scholar]
  25. Triola, M.F. Elementary Statistics, 9th ed.; Pearson Education, Inc.: London, UK, 2004; pp. 296–347. [Google Scholar]
  26. Atkinson, D. Temperature and organism size: A biological law for ectotherms? Adv. Ecol. Res. 1994, 25, 1–58. [Google Scholar]
  27. Oliva, R.M.; Álvarez, A.J. Factors influencing the efficacy of insect-proof screens. Acta Hortic. 2017, 1170, 1027–1034. [Google Scholar] [CrossRef]
  28. Álvarez, A.J.; Oliva, R.M. Insect exclusion screens: The size of the holes from a three-dimensional perspective. Acta Hortic. 2017, 1170, 1035–1042. [Google Scholar] [CrossRef]
Figure 1. Representation of a protective screen with warp threads running horizontally.
Applsci 13 06254 g001
Figure 2. Experimental device to measure the efficacy of protective screens.
Applsci 13 06254 g002
Figure 3. Representation of a protective screen in perspective and detail of a hole (created using AutoCAD 2023).
Applsci 13 06254 g003
Figure 4. Hyperbolic paraboloid region describing the 3D porous surface area (left) and the “flattening” of this region for the approximate calculation approach (right) (created using AutoCAD 2023).
Applsci 13 06254 g004
Figure 5. Efficacy ε against B. tabaci of the tested protective screens vs. mean hole length Lpy (the number next to the points identifies each textile) (created using MS Excel v2304).
Applsci 13 06254 g005
Figure 6. Frequency histogram of the thorax width measured in dorsal view in males (a) and females (b) of B. tabaci (created using SPSS v28.0).
Applsci 13 06254 g006
Figure 7. Representation of a male B. tabaci (left); half of a hole and reference measurements to theoretically assess the efficacy of the hole (right) (created using AutoCAD 2023).
Applsci 13 06254 g007
Table 1. Morphometric characterization of the B. tabaci population reared in the laboratory. Minimum, mean, and maximum values of thorax, abdomen, and length differentiated by males and females; n is the sample size, and SD is the standard deviation.
TagmaMinimum (µm)Mean ± SD (µm)Maximum (µm)n
Thorax (Td)190181242 ± 25278 ± 36314387120229
Abdomen119163162 ± 29292 ± 39286399
Length587629804 ± 75968 ± 8810091246
Table 2. Geometric characteristics of the protective textiles: thread color, average thread density in weft and warp directions ρx× ρy, average hole width Lpx, average hole length Lpy, average thickness of weft Dhx and warp Dhy threads, and porosity of the screens φ.
TextileThread Colorρx × ρy
(Threads cm−2)
Lpx ± SD (μm)Lpy ± SD (μm)Dhx ± σ (μm)Dhy ± σ (μm)φ (%)
5crystal15.9 × 16.1363 ± 21387 a ± 26240 ± 13258 ± 1035.7
1black10.5 × 16.3355 ± 25686 b ± 57263 ± 7258 ± 942.0
7crystal9.7 × 16.7355 ± 31744 b ± 22288 ± 10244 ± 1142.9
4crystal10.0 × 16.3358 ± 25749 b ± 22251 ± 9256 ± 1043.8
8crystal9.5 × 15.9367 ± 34804 b ± 27249 ± 7263 ± 2144.5
2crystal8.9 × 16.8348 ± 30871 b ± 26247 ± 8247 ± 845.7
6white8.7 × 16.8361 ± 17915 c ± 28230 ± 10233 ± 1048.8
3crystal7.9 × 16.5349 ± 381018 c ± 22252 ± 6257 ± 1046.3
a, b, c superscripts indicate groups identified by the Student–Newman–Keuls test.
Table 3. Textile thickness tt, ratio between the sum of thread thicknesses and textile thickness (Dhx + Dhy/tt), shape factor Lpx/Lpy, generatrix related to the mean male thorax value dTd, 3D diagonal of half a hole DPQ, 2D and 3D hole surface areas (A2D and A3D), percentage variation in hole surface, and efficacy ε values against B. tabaci.
Textilett ± SD (μm)(Dhx + Dhy)/tt
(μm μm−1)
Lpx/Lpy
(μm μm−1)
dTd (μm)DPQ (μm)Lpy/2
(μm)
A2D ± SD
(mm2)
A3D (mm2) A 3 D A 2 D A 2 D (%)ε (%)
5454 ± 50.910.9383704231940.140 ± 0.0130.1538.398.8
1474 ± 50.910.5173825053430.244 ± 0.0270.2626.771.6
7486 ± 50.910.4773915283720.264 ± 0.0240.2888.254.5
4404 ± 50.800.4783725233750.267 ± 0.0220.2773.752.2
8472 ± 40.920.4563955544020.295 ± 0.0290.3135.943.6
2444 ± 50.900.4003765664360.303 ± 0.0270.3215.662.8
6464 ± 51.000.3953995944580.330 ± 0.0180.3557.065.3
3418 ± 40.820.3433706225090.355 ± 0.0400.3693.817.8
Disclaimer/Publisher’s Note: The statements, opinions and data contained in all publications are solely those of the individual author(s) and contributor(s) and not of MDPI and/or the editor(s). MDPI and/or the editor(s) disclaim responsibility for any injury to people or property resulting from any ideas, methods, instructions or products referred to in the content.

