Abstract
(1) Background: Spondylolisthesis, a common disease among older individuals, involves the displacement of vertebrae. The condition may gradually manifest with age, allowing for potential prevention by the research of predictive algorithms. However, one key issue that hinders research in spondylolisthesis prediction algorithms is the need for publicly available spondylolisthesis datasets. (2) Purpose: This paper introduces BUU-LSPINE, a new dataset for the lumbar spine. It includes 3600 patients’ plain film images annotated with vertebral position, spondylolisthesis diagnosis, and lumbosacral transitional vertebrae (LSTV) ground truth. (4) Methods: We established an annotation pipeline to create the BUU-SPINE dataset and evaluated it in three experiments as follows: (1) lumbar vertebrae detection, (2) vertebral corner points extraction, and (3) spondylolisthesis prediction. (5) Results: Lumbar vertebrae detection achieved the highest precision rates of 81.93% on the AP view and 83.45% on the LA view using YOLOv5; vertebral corner point extraction achieved the lowest average error distance of 4.63 mm on the AP view using ResNet152V2 and 4.91 mm on the LA view using DenseNet201. Spondylolisthesis prediction reached the highest accuracy of 95.14% on the AP view and 92.26% on the LA view of a testing set using Support Vector Machine (SVM). (6) Discussions: The results of the three experiments highlight the potential of BUU-LSPINE in developing and evaluating algorithms for lumbar vertebrae detection and spondylolisthesis prediction. These steps are crucial in advancing the creation of a clinical decision support system (CDSS). Additionally, the findings demonstrate the impact of Lumbosacral transitional vertebrae (LSTV) conditions on lumbar detection algorithms.
1. Introduction
1.1. Background Knowledge
Spondylolisthesis occurs when a vertebra slips out of its position relative to the vertebra below it. The disease is common among elderly individuals [], leading to chronic lower back pain, nerve compression, and even paralysis in severe cases []. Therefore, predicting spondylolisthesis is crucial for successful treatment and preventing complications. Medical imaging, specifically X-ray imaging, is widely used for detecting spondylolisthesis [,]. However, manual detection of spondylolisthesis from X-ray images can be time-consuming, prone to errors, and dependent on the radiologist’s skill [].
Several automated methods have been proposed for spondylolisthesis detection to address these limitations [,,,]. However, these methods often rely on private datasets, which limit repeatability and direct accuracy comparison. This paper introduces a new dataset of lumbar spine X-ray images called BUU-LSPINE, which includes ground truth annotations of the vertebra position and spondylolisthesis diagnosis. Our dataset is valuable because it has many high-quality X-ray images with diverse demographics and types of spondylolistheses. Additionally, our dataset includes crucial clinical information such as patient age and gender, the presence of lumbosacral transitional vertebrae (LSTVs) [], and pixel spacing [], making it a unique resource for developing and evaluating automated spondylolisthesis detection algorithms.
LSTV, also called Bertolotti’s syndrome [], is a congenital disability that affects the last lumbar vertebra [,,]. Generally, the human lumbar spine consists of five vertebrae (L1 to L5), but patients with LSTV have a different number of lumbar vertebrae []; patients with four lumbar are denoted as having a sacralization of L5, and patients with six lumbar are denoted as having a lumbarization of S1. Misclassification of LSTV can affect the diagnosis and medical treatment [] and affect the results of algorithms that use lumbar vertebrae. For example, Deng et al. [] indicated some failed prediction results from spinal disease due to lumbarization and sacralization.
Pixel spacing in medical images specifies the distance, in millimeters (mm), between the centers of adjacent pixels along the x and y axes of the picture. This attribute is critical in converting distance in pixels on an image to physical space [].
1.2. Literature Review
Most studies on spondylolisthesis rely on a private dataset, as seen in studies 1 to 6 in Table 1. Unfortunately, this approach makes comparing their results to others difficult. Cai et al. [] researched spondylolisthesis using a publicly available dataset. However, they had to synthesize the condition by manually displacing the vertebrae in X-ray images, as shown in Study 7 in Table 1. The only study with spondylolisthesis that publicly provides its dataset is from Fraiwan et al. [], as shown in study 8 in Table 1. However, this dataset does not include vertebra position, which is crucial information to locate the disease position and its severity. Moreover, some cases have various spondylolisthesis locations in one patient, so identifying disease locations is essential to determine multiple instances of spondylolisthesis in one image.

Table 1.
Literature review for spinal detection algorithms.
While current public datasets for the human spine are great for detecting vertebrae, they do not include any ground truth for spinal diseases, like spondylolisthesis, as shown in studies 9 to 12 in Table 1. In contrast, our BUU-LSPINE dataset offers a comprehensive, diverse, and suitable dataset for spondylolisthesis detection. It includes both vertebral position and spondylolisthesis diagnosis, as shown in study number 13 in Table 1. Furthermore, our dataset comprises more patients than the other studies, as shown in the column number of patients. Moreover, including LA view images in our dataset is crucial in spondylolisthesis studies. This significance is highlighted by the presence of LA view images in numerous spondylolisthesis studies listed in Table 1. The LA view is vital for spondylolisthesis studies due to the potential consequences of vertebral slippage on the sagittal plane, such as spinal canal compression and the risk of nerve damage [].
Our literature review identified a lack of publicly available datasets that include accurate vertebral positioning and a reliable spondylolisthesis ground truth. To address this gap, we created and published a public dataset with these ground truths, described in the next section.
2. Materials and Methods
2.1. BUU-LSPINE
BUU-LSPINE was developed by cooperation between Burapha University (BUU), Thailand, and the Korea Institute of Oriental Medicine (KIOM), Republic of Korea.
This study was conducted by the Declaration of BUU and approved by the Institutional Review Board of the BUU with the reference number HS024/2565(E3). The dataset collection underwent an anonymization process to eliminate all personal data. We preserved only the patients’ gender and age. All records in our dataset were assigned the four digits’ unique identification number. This information allows users access to each record anonymously. However, it is essential to note that some unique identification numbers are missing due to the filtering process.
BUU-LSPINE is a collection of PF X-ray images of 3600 patients, as shown in Table 2. Each patient’s record has two views: an anteroposterior (AP) and a lateral (LA), as shown in Figure 1. Our dataset of 3600 patients comprises 7200 images because each has two views. All lateral images were flipped to face the left side. A record of our dataset includes two JPG X-ray images and two CSV ground truth files. Our dataset consists of three ground truths: vertebral position, spondylolisthesis, and LSTV. Further elaboration on the ground truths is provided in the following section.
Table 2.
BUU-LSPINE description.
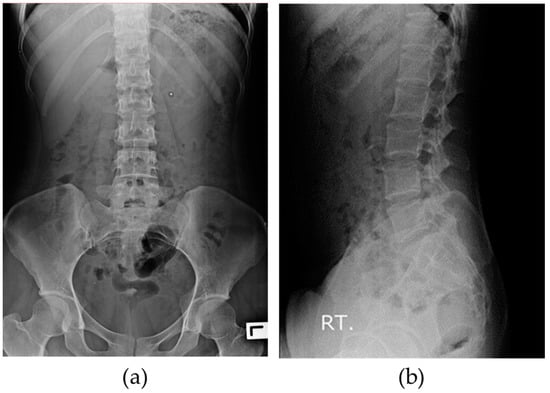
Figure 1.
X-ray images in BUU-LSPINE: (a) anteroposterior (AP) view; (b) lateral (LA) view.
The X-ray imaging process involves two essential parameters: the x-ray tube voltage (kV) and the x-ray tube current and the exposure time (mAs). Both parameters play a vital role in controlling the quality and contrast of the X-ray image, which depends on the thickness of the patients. Thicker patients require higher kV values to enhance the penetration capability of the X-ray radiation, while thinner patients necessitate lower kV values for optimal imaging results. For our plain film examinations, we typically used a range of 70–75 kV and 32–40 mAs for the AP view, while for the LA view, we utilized a range of 80–90 kV and 50–60 mAs, as shown in row 18 of Table 2.
2.2. Ground Truth Data
After we obtained permission from the Burapha University Hospital Institutional Review Board (IRB), we followed an annotation pipeline to make our dataset, as shown in Figure 2. Starting with collecting patient DICOM images from the hospital database, we filtered data using the following exclusion criteria to ensure that data consisted of all lumbar vertebrae and had good-quality pictures. Data with these criteria were excluded from our dataset.
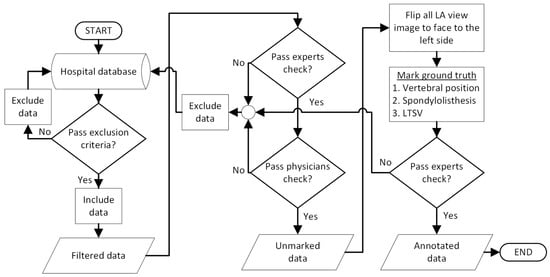
Figure 2.
Annotation pipeline of BUU-LSPINE.
Exclusion criteria:
- Low quality and high noise (challenging to distinguish the vertebrae);
- Embedded medical devices (cover the lumbar vertebrae area);
- Missing some of the lumbar vertebrae;
- Highly damaged vertebrae (challenging to determine the vertebral body).
We then submitted the filtered dataset to experts and physicians for review. Experts were computer vision experts, and physicians were radiologists and orthopedics doctors of KIOM and BUU. Next, we horizontally flipped all right-facing LA views to appear as left-facing views in the images. Subsequently, physicians annotated the ground truth of vertebral positions, LSTV, and made a diagnosis of spondylolisthesis. Ground truths are annotated on the CSV files, as shown in Table 3 for the AP view and Table 4 for the LA view. Finally, we conducted a dataset review meeting, inviting experts from various fields, such as orthopedics, radiology, and image processing. The complete version of the verified dataset, including X-ray images of the lumbar spine and the corresponding ground truth annotations of lumbar vertebrae position and spondylolisthesis diagnosis, is included.
Table 3.
A ground truth CSV file in BUU-LSPINE (AP view).
Table 4.
A ground truth CSV file in BUU-LSPINE (LA view).
2.2.1. Vertebral Positions
Ground truths of vertebral positions are the coordinates of all corner points of lumbar vertebrae. Two left and right corner points are combined as one vertebral edge line. Each row in Table 3 represents one vertebral edge line. There are two types of vertebral edge lines, the upper and lower edge line. The upper edge line ends with the ‘a’ character, and the lower edge line ends with the ’b’ character, as shown in Table 3.
In the AP view, there are ten vertebral edge lines, the upper and lower edges of five vertebrae, as shown on the left-hand side of Figure 3. Coordinates of all corner points are shown in CSV files with the same name as the corresponding images. Each row in a CSV file from Table 3 represents the coordinates of the left and right points defining a line segment, as shown on the right-hand side of Figure 3.
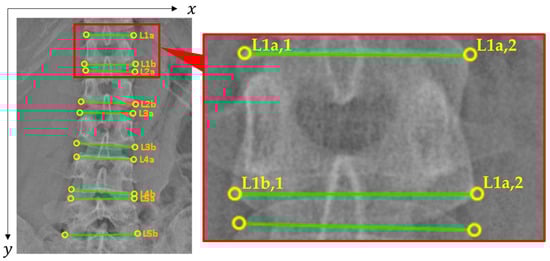
Figure 3.
Ground truth of vertebral positions in BUU-LSPINE (AP view). We annotated ten lines of edges of vertebrae (L1–L5), with each line containing coordinates of two points left and right.
In the LA view, there are eleven vertebral edge lines. The first ten lines are the same as in the AP view. The extra line is annotated on the upper edge of the first sacral vertebra, as shown in the last row of Table 4 and Figure 4. The purpose of the S1a line is to be a reference line to measure the slippage of the L5 vertebra. This line allowed us to diagnose spondylolisthesis on the L5 vertebra, the most common vertebra that occurs in the disease. Moreover, the class of the S1a row is not a diagnosis of spondylolisthesis but the LSTV class of the patients. The LSTV ground truth details are described in Section 2.2.3.
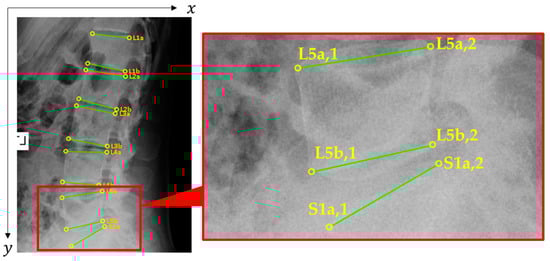
Figure 4.
Ground truth of vertebral positions in BUU-LSPINE (LA view). We annotated eleven lines of edges of vertebrae (L1–L5 and S1a), with each line containing coordinates of two points left and right.
2.2.2. Spondylolisthesis
Physicians investigated all vertebrae and diagnosed spondylolisthesis for each vertebra. The diagnosis results are marked as class 0 to 4 in the lower edge of the vertebra’s row and the last column of the CSV files. The total number of each class is shown in Table 5. We must inform you that we marked spondylolisthesis on the lower edge line of each vertebra. All class labels on the upper edge line have no meaning.
Table 5.
Total number of spondylolisthesis classes (number of vertebrae).
2.2.3. LSTV
Diagnosing LSTV requires physicians to identify the L5 vertebra precisely. In sacralization instances, the L5 vertebra is fused with the sacrum and acts like a sacral vertebra. In lumbarization cases, the first sacral vertebra is separate from the sacrum and acts like the last lumbar. Moreover, lumbarization can be partially or entirely detached, requiring physicians’ skills to determine.
LSTV ground truths of BUU-LSPINE are marked on an S1a row in the CSV file of the LA view, as shown in the last row of Table 4. The total number of LSTV classes is shown in Table 6.
Table 6.
Total number of LSTV classes (number of patients).
2.3. Benefit of BUU-LSPINE
BUU-LSPINE has different benefits among stakeholders. This dataset provides a valuable resource for researchers to research localization and identification of the human lumbar spine and spondylolisthesis. We demonstrated the usage of our dataset ground truth by conducting three experiments, which is explained in Section 2.4. Physicians require a system to support their work. The diagnostic process sometimes includes measuring and calculating the angle or distance between vertebrae, which is time-consuming. Our BUU-LSPINE datasets can be used to develop algorithms to help such tasks, as demonstrated in Section 2.4. Patients need reliable results. The BUU-LSPINE has 3600 records of different patients. It is large enough to be a reasonably representative sample for statistical analysis to help physicians make diagnostic decisions, as shown in Figure 5. Further research is required to inspect the full benefits of our dataset.
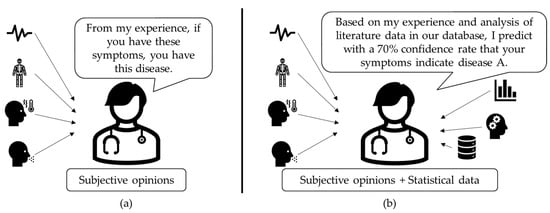
Figure 5.
Diagnosis process: (a) subjective opinions; (b) subjective opinion + statistical data.
2.4. Experiments
We demonstrated the utility of BUU-LSPINE by conducting three different experiments: (1) detection of lumbar vertebrae; (2) extraction of corner points; (3) prediction of spondylolisthesis. In our tests, we used a Windows PC with an i7-8700 CPU running at 3.20 GHz, 16 GB of RAM, and an RTX 3080 graphics card. With the implementation of TensorFlow 2.7.0, we used Python 3.8.8.
2.4.1. Lumbar Vertebrae Detection
The targets of lumbar vertebrae detection experiment were detecting bounding boxes around vertebral bodies. The processes of this experiment are shown in Figure 6. The input was raw X-ray images, as shown in Figure 7a. We separated BUU-LSPINE into training and testing sets with a 0.8:0.2 ratio. The bounding boxes’ ground truth of the detection was created using corner points’ ground truth, as shown in Figure 7b. Then, we trained YOLOv5, MobileNetV1, MobileNetV2, ResNet50V1, ResNet101V1, ResNet152V1, ResNet50V2, ResNet101V2, ResNet152V2, EfficientDet D0, and EfficientDet D1 models, with a batch size of 4, a learning rate of 0.04, and all images resized to 640 × 640 pixels. The targets were bounding boxes of five vertebrae (‘APL1’, ‘APL2’, ‘APL3’, ‘APL4’, and ‘APL5’) on AP view and (‘LAL1’, ‘LAL2’, ‘LAL3’, ‘LAL4’, and ‘LAL5’) on LA view. Since the human spine typically consists of five lumbar vertebrae, our model chose only one candidate with the highest likelihood from each class. We stopped our training process early when there was no further improvement in precision. The detection results are shown in Figure 7c.
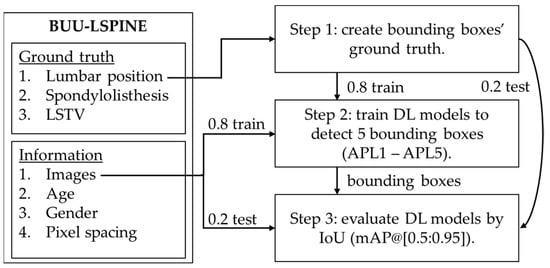
Figure 6.
Usage of BUU-LSPINE in the detection of lumbar vertebrae.
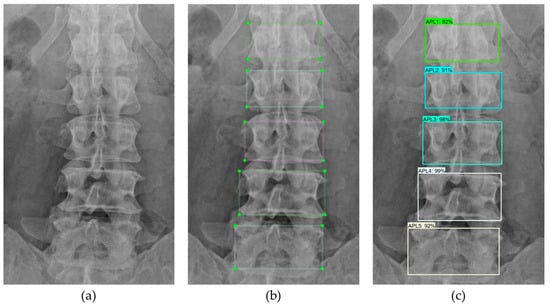
Figure 7.
Detection of lumbar vertebrae: (a) input image; (b) ground truth; (c) detection.
2.4.2. Vertebral Corner Points Extraction
The targets of the vertebral corner points extraction experiment were coordinates of all corner points of vertebral bodies. The processes of this experiment are shown in Figure 8. The input was raw X-ray images, as shown in Figure 9a. We separated BUU-LSPINE into training and testing sets with a 0.8:0.2 ratio. Pixel spacing ratios were used to convert corner points in pixels to millimeters. We then used it as the ground truth for training key point detection models, as shown in Figure 9b. Next, we chose MobileNetV1, MobileNetV2, ResNet50V1, ResNet101V1, ResNet152V1, ResNet50V2, ResNet101V2, ResNet152V2, DenseNet201, EfficientNetB0, and EfficientNetB1models, with a batch size of 4, a learning rate of 0.001, and all images resized to 640 × 640 pixels. The targets were 20 corner point coordinates for five vertebrae. We stopped our training process early when there was no further improvement in accuracy. A comparison between the ground truth corner points and the marked corner points is shown in Figure 9. The outcomes of the corner point extraction were four corner points of each vertebra, a total of five vertebrae, as shown in Figure 9c.
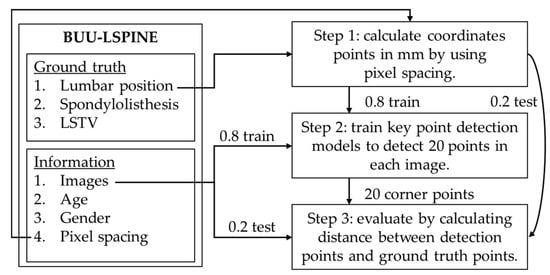
Figure 8.
Usage of BUU-LSPINE in the extraction of corner points.
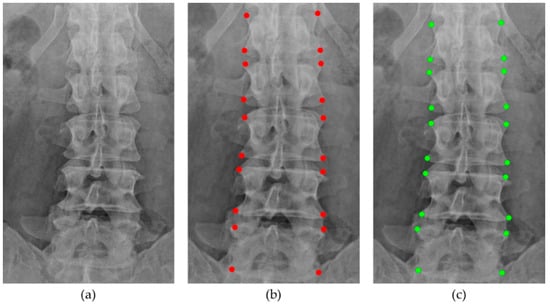
Figure 9.
Extraction of corner points: (a) input images; (b) ground truth; (c) detection.
2.4.3. Spondylolisthesis Prediction
Tracking the progression of vertebrae displacement using the Meyerding classification allows for evaluating the severity of spondylolisthesis []. The Meyerding classification consists of five classes depending on the percentage of the displacement distance of the upper vertebra relative to its lower adjacent vertebra, as shown in Figure 10 and Table 7. Analyzing the positions of pairs of vertebrae provides clues regarding symptoms of spondylolisthesis.
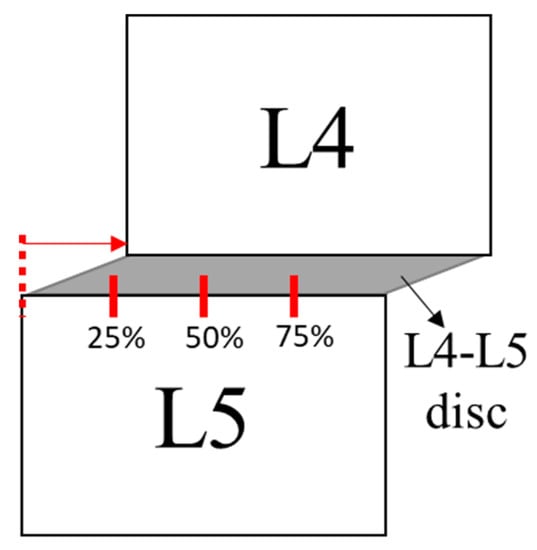
Figure 10.
The Meyerding classification.
Table 7.
Classes of the Meyerding classification system.
The direction of the slip determines the different types of spondylolistheses, as shown in Figure 11.
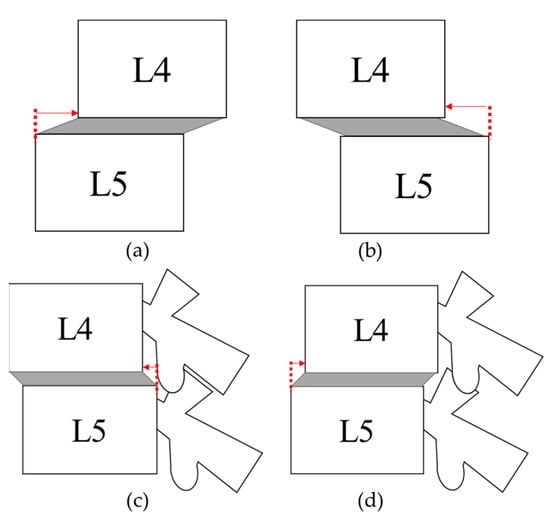
Figure 11.
Spondylolisthesis: (a) left laterolisthesis; (b) right laterolisthesis; (c) anterolisthesis; and (d) retrolisthesis.
Treatments for spondylolisthesis include selective nerve blocks, which are aimed at reducing back pain, and posterior spinal fusion treatments that help stabilize the spinal structure, as shown in Figure 12.
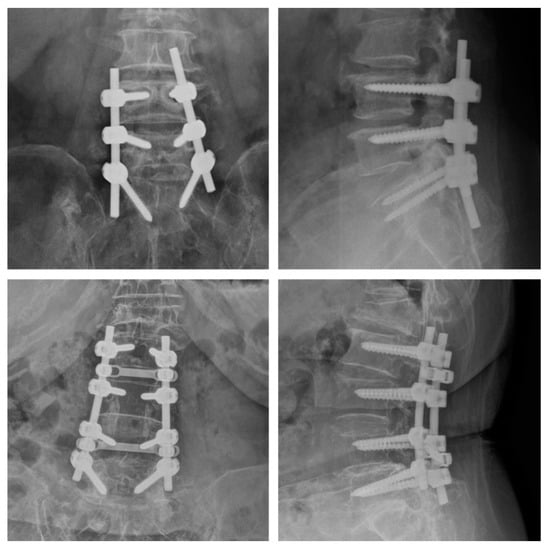
Figure 12.
Posterior spinal fusion.
The diagnosis of spondylolisthesis is based on the position of an adjacent pair of vertebrae, and the direction of the slip can identify its types. Therefore, our proposed method involved pairing every adjacent lumbar vertebra to begin the process, as shown in Figure 13. Then, we changed the reference coordinates of all corner points to the position of the left ends of the upper edge of the lower vertebra in an instance pair, as shown in Figure 14a. Through this analysis, we can establish the relationship between the positions of the upper and lower vertebrae in each pair of lumbar vertebrae. Lastly, we used classifiers to predict the spondylolisthesis in each pair, as shown in Figure 14b,c.
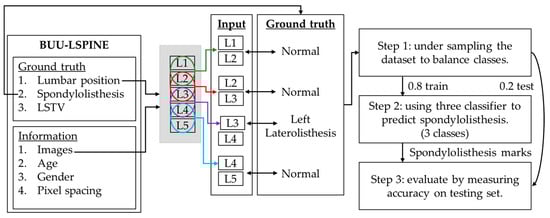
Figure 13.
Proposed method for the spondylolisthesis prediction.
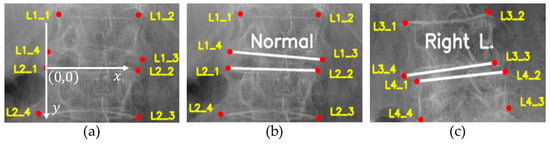
Figure 14.
New dataset’s records: (a) reference point; (b) normal case; (c) disease case.
We conducted experiments to predict spondylolisthesis by creating a new dataset using BUU-LSPINE, as shown in Figure 13. We coupled the corner points of the upper vertebra with the lower vertebra as one record. Then, we used the upper-left corner point of the lower vertebra as a reference point for every point in the record, as shown in Figure 14a. The target ground truth of this experiment was the spondylolisthesis diagnosis ground truth from our proposed dataset, as shown in Figure 14b,c. Our new dataset consisted of 14,400 records in AP view (4 pairs of vertebrae: (L1–L2), (L2–L3), (L3–L4), and (L4–L5)) per image) and 18,000 records in LA view (5 pairs of vertebrae: (L1–L2), (L2–L3), (L3–L4), (L4–L5), and (L4–S1) per image). Since the ground truth diagnosis in our new dataset was highly imbalanced, we used under-sampling to match the minimum number of records in each class (61 of left laterolisthesis in the AP view and 194 of retrolisthesis in the LA view). Then, we split the dataset into training and testing sets with a ratio of 0.8:0.2, respectively.
3. Results
3.1. Lumbar Vertebrae Detection
We evaluated lumbar vertebrae detection results by using the mean average precision (mAP) metric over various intersection over union (IoU) thresholds ranging from 0.5 to 0.9 (mAP@0.5:0.95). Table 8 shows the evaluation of models. YOLOv5 achieved the highest precision of 81.93% and 83.45%, as well as the highest recall of 95.82% and 95.72% on the AP and LA views, respectively.
Table 8.
Evaluation of models for detection of lumbar vertebrae.
LSTV conditions can impact the detection of lumbar vertebrae since our model was trained under the assumption that every person’s spine consists of five lumbar vertebrae, as shown in Figure 15 and Figure 16. Patients with lumbarization, characterized by the presence of six vertebrae instead of the usual five, can lead to a consistent omission of one vertebra in our model’s detection, as shown in Figure 15b and Figure 16b. Patients with sacralization, where there are four vertebrae instead of the usual five, cause our model to attempt to locate the missing vertebra and mistakenly mark the position on the first sacrum instead of the fifth lumbar, as shown in Figure 15c and Figure 16c. These results highlight the importance of LSTV information in the lumbar spine dataset, which is included in our BUU-LSPINE dataset.
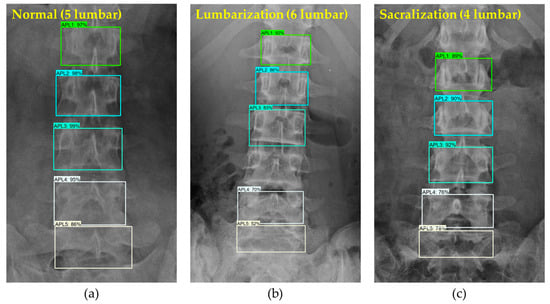
Figure 15.
Results of lumbar vertebrae detection (AP view): (a) normal patient with 5 lumbar vertebrae; (b) lumbarization patient with 6 lumbar; and (c) sacralization patient with 4 lumbar.
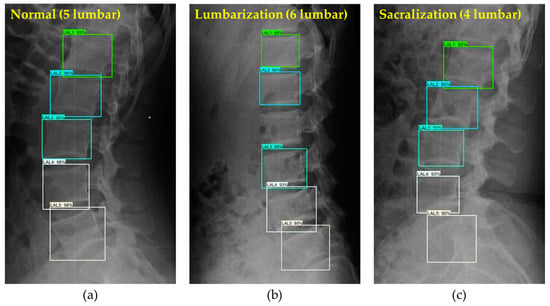
Figure 16.
Results of lumbar vertebrae detection (LA view): (a) normal patient with 5 lumbar vertebrae; (b) lumbarization patient with 6 lumbar; and (c) sacralization patient with 4 lumbar.
3.2. Vertebral Corner Point Extraction
We evaluated vertebral corner point extraction results using the Euclidean distance between the ground truth and the detected points. Table 9 shows the evaluation results for models. Resnet152V2 achieved the lowest average error distance of 4.63 mm on the AP view and DenseNet201 achieved 4.91 mm on the LA view. According to statistics in our dataset, the average width of lumbar vertebrae in the AP view was 52.45 mm, which means the average error in our detection was 8.83%. The average width of lumbar vertebrae in the LA view was 40.54 mm, which means the average error in our detection was 12.11%. When comparing the average error in the percentage of vertebra width with the Meyerding classification system from Table 7, where each grade range is 25%, we observed relatively high average errors of 8.83% and 12.11%, respectively. This suggests that further improvements are needed in our feature point extraction models to achieve higher accuracy. Addressing this challenge remains an essential area of focus for researchers aiming to enhance the system’s performance.
Table 9.
Evaluation of models for extraction of corner points.
The vertebral corner points provide valuable information for algorithms to predict spondylolisthesis, as shown in Figure 17 and Figure 18. We can measure the extent of vertebral slip by analyzing the relative positions of the upper with the adjacent lower vertebrae. Moreover, the direction of the slip can be crucial information in classifying the types of spondylolistheses.
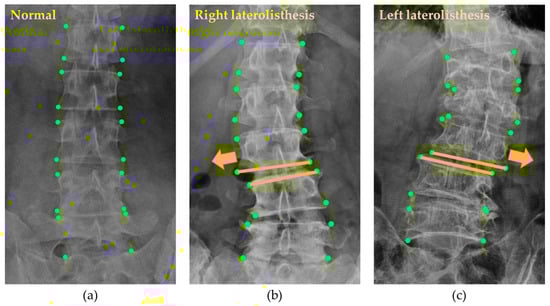
Figure 17.
Detected corner points of patients with and without diseases: (a) normal; (b) right laterolisthesis; (c) left laterolisthesis.
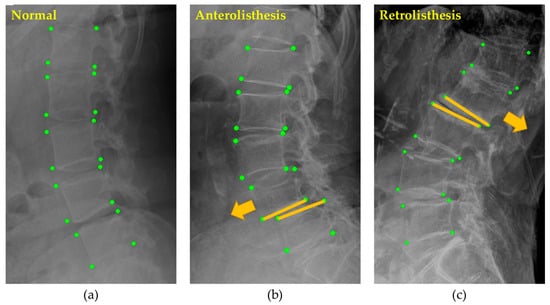
Figure 18.
Detected corner points of patients with and without diseases: (a) normal; (b) anterolisthesis; (c) retrolisthesis.
3.3. Spondylolisthesis Prediction
We evaluated the spondylolisthesis prediction experiments by using three classifiers. The accuracies of the prediction are shown in Table 10. SVM achieved the highest accuracy in the testing set of 95.14% in the AP view and 92.26% in the LA view. The prediction results are classes of pairs of adjacent vertebrae. The spondylolisthesis class indicates the slippage of the upper vertebra in each pair, as shown in Figure 19.
Table 10.
Accuracies of spondylolisthesis prediction.
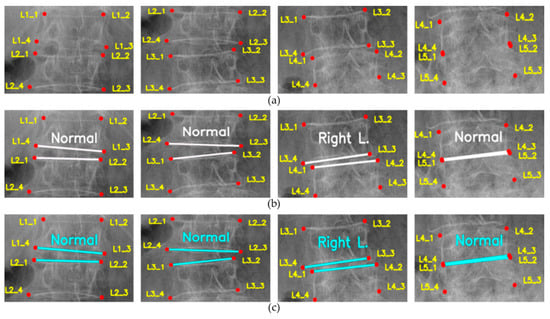
Figure 19.
Spondylolisthesis prediction: (a) input points; (b) ground truth; (c) prediction.
4. Discussion
We demonstrated the utilization of the BUU-LSPINE dataset in three experiments.
The first experiment uses PF images and corner points to create the bounding box ground truth to train lumbar vertebra detection models. The results demonstrate a high precision in detecting lumbar vertebrae positions. However, the experiment also reveals the influence of LSTV conditions on vertebrae detection algorithms, underscoring the importance of considering these conditions during the research of such algorithms.
The second experiment shows the utilization of the BUU-LSPINE’s corner point ground truth. The results show the potential of our datasets in researching lumbar vertebral corner point detection algorithms. However, the detected corner points from the best model in our experiment have a relatively high average error distance compared with the Meyerding Classification System. These errors may lead to incorrect classification of the grade of the vertebrae slippage.
In the third experiment, we introduce algorithms for predicting spondylolisthesis by pairing the adjacent vertebrae and adjusting the reference points of all corner points within the vertebrae pair. Then, we use classifiers to predict the spondylolisthesis based on the relation between all corner points and new reference points in each pair. The results show the performance in predicting the diseases. However, it is crucial to note that the capability of spondylolisthesis prediction depends on the performance of the vertebral corner point detection algorithms.
These experiments demonstrate the potential of the BUU-LSPINE dataset, but further research is required to explore our dataset capabilities. However, these experiments serve as an initial demonstration. Our dataset will catalyze new ideas and encourage others to use it in improving models, evaluating algorithms, and expanding the boundaries of what is possible.
5. Conclusions
The primary contribution of this publication is the valuable BUU-LSPINE dataset, which serves as an essential tool for researching the lumbar spine, LSTV, and spondylolisthesis. The dataset comprises records from 3600 patients, including 621 cases of spondylolisthesis, providing comprehensive data for in-depth analysis.
Spondylolisthesis is a prevalent condition affecting individuals, and its symptoms may gradually manifest over time. Early detection of the disease necessitates the development of algorithms for locating lumbar vertebrae and predicting spondylolisthesis. Our dataset offers essential information for the development and research of such algorithms.
The dataset is available at https://services.informatics.buu.ac.th/spine/ (accessed on 26 July 2023). In future studies, we intend to expand the size of our dataset and improve our feature point detection and spondylolisthesis prediction algorithms. We aim to develop a CDSS that can support physicians in diagnosing spinal conditions.
Author Contributions
Conceptualization, P.K., W.Y., J.-S.J., K.C. and A.O.; methodology, P.K.; software, J.-S.J.; validation, S.L., A.O., J.-S.J. and K.C.; formal analysis, P.K.; investigation, P.K.; resources, S.L. and J.-S.J.; data curation, P.K.; writing—original draft preparation, P.K.; writing—review and editing, P.K., W.Y., S.L., A.O., J.-S.J. and K.C.; visualization, P.K.; supervision, K.C. and A.O.; project administration, K.C.; funding acquisition, J.-S.J. All authors have read and agreed to the published version of the manuscript.
Funding
This research was funded by the Korea Institute of Oriental Medicine, grant numbers KSN1823130 and KSN1922110.
Institutional Review Board Statement
The study was conducted by the Declaration of BUU and approved by the Institutional Review Board of the BUU with the reference number HS024/2565(E3).
Informed Consent Statement
Not Applicable.
Data Availability Statement
Available online: https://services.informatics.buu.ac.th/spine/ (accessed on 22 July 2023).
Acknowledgments
The authors gratefully appreciate the physicians and radiologists of the Burapha University Hospital, Thailand, for their valuable assistance in consulting and annotating the ground truths of the dataset used in this study. Furthermore, the authors gratefully acknowledge the support of the Korea Institute of Oriental Medicine for their valuable contribution to the research project titled ‘Automated Identification of Abnormal Lumbar Vertebrae Pose in X-Ray Images’. The author thanks John Gatewood Ham of the Faculty of Informatics of BUU for the language review.
Conflicts of Interest
The authors declare no conflict of interest.
Abbreviations
| LSTV | Lumbosacral transitional vertebrae |
| AP | Anteroposterior |
| LA | Lateral |
| SVM | Support Vector Machine |
| CDSS | Clinical Decision Support System |
References
- Chan, A.K.; Sharma, V.; Robinson, L.C.; Mummaneni, P.V. Summary of guidelines for the treatment of lumbar spondylolisthesis. Neurosurg. Clin. 2019, 30, 353–364. [Google Scholar] [CrossRef]
- Beck, A.W.; Simpson, A.K. High-grade lumbar spondylolisthesis. Neurosurg. Clin. 2019, 30, 291–298. [Google Scholar] [CrossRef]
- Yamaguchi, K.T.; Skaggs, D.L.; Acevedo, D.C.; Myung, K.S.; Choi, P.; Andras, L. Spondylolysis is frequently missed by MRI in adolescents with back pain. J. Child. Orthop. 2012, 6, 237–240. [Google Scholar] [CrossRef]
- Kunze, K.N.; Lilly, D.T.; Khan, J.M.; Louie, P.K.; Ferguson, J.; Basques, B.A.; Nolte, M.T.; Dewald, C.J. High-grade spondylolisthesis in adults: Current concepts in evaluation and management. Int. J. Spine Surg. 2020, 14, 327–340. [Google Scholar] [CrossRef]
- Alqarni, A.M.; Schneiders, A.G.; Cook, C.E.; Hendrick, P.A. Clinical tests to diagnose lumbar spondylolysis and spondylolisthesis: A systematic review. Phys. Ther. Sport 2015, 16, 268–275. [Google Scholar] [CrossRef]
- Zhao, S.; Wu, X.; Chen, B.; Li, S. Automatic spondylolisthesis grading from MRIs across modalities using faster adversarial recognition network. Med. Image Anal. 2019, 58, 101533. [Google Scholar] [CrossRef]
- Nguyen, T.P.; Chae, D.-S.; Park, S.-J.; Kang, K.-Y.; Yoon, J. Deep learning system for Meyerding classification and segmental motion measurement in diagnosis of lumbar spondylolisthesis. Biomed. Signal Process. Control 2021, 65, 102371. [Google Scholar] [CrossRef]
- Varçın, F.; Erbay, H.; Çetin, E.; Çetin, İ.; Kültür, T. End-to-end computerized diagnosis of spondylolisthesis using only lumbar X-rays. J. Digit. Imaging 2021, 34, 85–95. [Google Scholar] [CrossRef]
- Fraiwan, M.; Audat, Z.; Fraiwan, L.; Manasreh, T. Using deep transfer learning to detect scoliosis and spondylolisthesis from X-ray images. PLoS ONE 2022, 17, e0267851. [Google Scholar] [CrossRef]
- Sekharappa, V.; Amritanand, R.; Krishnan, V.; David, K.S. Lumbosacral transition vertebra: Prevalence and its significance. Asian Spine J. 2014, 8, 51. [Google Scholar] [CrossRef]
- Li, X.; Morgan, P.S.; Ashburner, J.; Smith, J.; Rorden, C. The first step for neuroimaging data analysis: DICOM to NIfTI conversion. J. Neurosci. Methods 2016, 264, 47–56. [Google Scholar] [CrossRef]
- Hughes, R.J.; Saifuddin, A. Imaging of lumbosacral transitional vertebrae. Clin. Radiol. 2004, 59, 984–991. [Google Scholar] [CrossRef]
- Gopalan, B.; Yerramshetty, J.S. Lumbosacral transitional vertebra-related low back pain: Resolving the controversy. Asian Spine J. 2018, 12, 407. [Google Scholar] [CrossRef]
- McGrath, K.; Schmidt, E.; Rabah, N.; Abubakr, M.; Steinmetz, M. Clinical assessment and management of Bertolotti Syndrome: A review of the literature. Spine J. 2021, 21, 1286–1296. [Google Scholar] [CrossRef]
- Landauer, F.; Trieb, K. Diagnostic Limitations and Aspects of the Lumbosacral Transitional Vertebrae (LSTV). Appl. Sci. 2022, 12, 10830. [Google Scholar] [CrossRef]
- Molina, D.; Blumenthal, S. Chapter 13—Lumbosacral Spine Plain Radiographs. In Atlas of Spinal Imaging; Louie, P.K., An, H.S., Samartzis, D., Eds.; Elsevier: Amsterdam, The Netherlands, 2022; pp. 173–181. [Google Scholar] [CrossRef]
- Konin, G.; Walz, D. Lumbosacral transitional vertebrae: Classification, imaging findings, and clinical relevance. Am. J. Neuroradiol. 2010, 31, 1778–1786. [Google Scholar] [CrossRef]
- Deng, Y.; Wang, C.; Hui, Y.; Li, Q.; Li, J.; Luo, S.; Sun, M.; Quan, Q.; Yang, S.; Hao, Y. Ctspine1k: A large-scale dataset for spinal vertebrae segmentation in computed tomography. arXiv 2021, arXiv:2105.14711. [Google Scholar]
- Riddle, W.R.; Pickens, D.R. Extracting data from a DICOM file. Med. Phys. 2005, 32 Pt 1, 1537–1541. [Google Scholar] [CrossRef]
- Cai, Y.; Leung, S.; Warrington, J.; Pandey, S.; Shmuilovich, O.; Li, S. Direct spondylolisthesis identification and measurement in mr/ct using detectors trained by articulated parameterized spine model. In Proceedings of the Medical Imaging 2017: Image Processing, Orlando, FL, USA, 11–16 February 2017; pp. 362–369. [Google Scholar]
- Saravagi, D.; Agrawal, S.; Saravagi, M.; Rahman, M.H. Diagnosis of Lumbar Spondylolisthesis Using a Pruned CNN Model. Comput. Math. Methods Med. 2022, 2022, 2722315. [Google Scholar] [CrossRef]
- Liao, S.; Zhan, Y.; Dong, Z.; Yan, R.; Gong, L.; Zhou, X.S.; Salganicoff, M.; Fei, J. Automatic lumbar spondylolisthesis measurement in CT images. IEEE Trans. Med. Imaging 2016, 35, 1658–1669. [Google Scholar] [CrossRef]
- Trinh, G.M.; Shao, H.-C.; Hsieh, K.L.-C.; Lee, C.-Y.; Liu, H.-W.; Lai, C.-W.; Chou, S.-Y.; Tsai, P.-I.; Chen, K.-J.; Chang, F.-C. Detection of Lumbar Spondylolisthesis from X-ray Images Using Deep Learning Network. J. Clin. Med. 2022, 11, 5450. [Google Scholar] [CrossRef]
- Chu, C.; Belavy, D.L.; Armbrecht, G.; Bansmann, M.; Felsenberg, D.; Zheng, G. Annotated T2-Weighted Mr Images of the Lower Spine. Zenodo 2015. [Google Scholar] [CrossRef]
- Sekuboyina, A.; Husseini, M.E.; Bayat, A.; Löffler, M.; Liebl, H.; Li, H.; Tetteh, G.; Kukačka, J.; Payer, C.; Štern, D. VerSe: A vertebrae labelling and segmentation benchmark for multi-detector CT images. Med. Image Anal. 2021, 73, 102166. [Google Scholar] [CrossRef]
- Masood, R.F.; Hassan, T.; Raja, H.; Hassan, B.; Dias, J.; Werghi, N. A Composite Dataset of Lumbar Spine Images with Mid-Sagittal View Annotations and Clinically Significant Spinal Measurements. In Proceedings of the 2022 2nd International Conference on Digital Futures and Transformative Technologies (ICoDT2), Rawalpindi, Pakistan, 24–26 May 2022; pp. 1–5. [Google Scholar]
- Koslosky, E.; Gendelberg, D. Classification in brief: The Meyerding classification system of spondylolisthesis. Clin. Orthop. Relat. Res. 2020, 478, 1125. [Google Scholar] [CrossRef]
Disclaimer/Publisher’s Note: The statements, opinions and data contained in all publications are solely those of the individual author(s) and contributor(s) and not of MDPI and/or the editor(s). MDPI and/or the editor(s) disclaim responsibility for any injury to people or property resulting from any ideas, methods, instructions or products referred to in the content. |
© 2023 by the authors. Licensee MDPI, Basel, Switzerland. This article is an open access article distributed under the terms and conditions of the Creative Commons Attribution (CC BY) license (https://creativecommons.org/licenses/by/4.0/).