Article

Temporal and Spatial Evolution Laws of Freezing Temperature Field in the Inclined Shaft of Water-Rich Sand Layers

1
School of Civil Engineering and Architecture, Anhui University of Science and Technology, Huainan 232001, China
2
Engineering Research Center of Mine Underground Engineering Ministry of Education, Anhui University of Science and Technology, Huainan 232001, China
3
Postdoctoral Research Workstation of China Coal Mine Construction Group Co., Ltd., Hefei 230091, China
*
Author to whom correspondence should be addressed.
Appl. Sci. 2023, 13(15), 8874; https://doi.org/10.3390/app13158874
Submission received: 3 July 2023 / Revised: 28 July 2023 / Accepted: 31 July 2023 / Published: 1 August 2023
(This article belongs to the Special Issue Recent Advances in Tunneling and Underground Space Technology)

Abstract

:
This study investigated the distribution and evolution characteristics of the temperature field during the freezing and excavation of inclined shafts, with the freezing open-excavation section of Shengfu Mine’s main inclined shaft (located in Shaanxi Province) as the project background. Utilizing field-measured data and the finite element software COMSOL Multiphysics, a 3D freezing temperature-field numerical calculation model was constructed to examine the temporal and spatial evolutions of the temperature field during the construction of the inclined shaft. The findings showed that after 88 days of freezing, the average temperature of the frozen wall in the open-excavation section was below −12 °C. The frozen wall thickness in the sidewalls of different layers exceeded 4 m, and the thickness at the bottom plate exceeded 5 m, meeting the excavation design requirements. For the same freezing time, the average temperature of the frozen wall in the fine sand layer was 0.28 to 2.39 °C lower than that of the frozen wall in the medium sand layer, and its effective thickness was 0.36 to 0.59 m greater than that in the medium sand layer. When the soil was excavated, and the well side was exposed, a phenomenon known as “heat flow erosion” occurred in the soil at the well-side position, causing the well-side temperature to rise. Nevertheless, this increase was generally limited, and when continuous cooling was applied, the well side could maintain a very low negative temperature level. Consequently, there was no spalling phenomenon. The effective thickness of the frozen wall during excavation did not decrease, with the average temperature remaining below −10 °C. Consequently, there was no large-scale “softening” of the frozen wall during excavation, thus ensuring construction safety. The numerical calculation model in this paper can be used to predict the development law of the freezing temperature field of the water–rich sandy layers in Shengfu Mine and adjust the on–site cooling plan in real time according to the construction progress. This research provides valuable theoretical insights for the optimal design and safe construction of freezing inclined-shaft sinking projects.

1. Introduction

Based on the artificial ground freezing technique, advanced refrigeration methods are applied to transform water-rich geological strata into solidified, frozen earth, thereby combining the load-bearing capabilities of the ground and protecting subterranean infrastructure from groundwater infiltration. This approach represents a “green” construction method that can be applied to complex engineering conditions [1,2]. Lately, in China, the development of coal has gradually transitioned to the western region due in large part to the abundant coalfield exploitation in Western China. The region has a straightforward geological composition and shallowly embedded coal seams, making it ideal for the application of inclined-shaft freezing techniques for coal extraction [3].
Currently, despite the extensive research into shaft freezing sinking [4,5,6,7], the design principles related to the freezing sinking of inclined shafts remain unrefined. Due to the influence of the inclination angle in inclined shafts, the freezing process is more complex than that observed in vertical shafts. Therefore, directly employing vertical-shaft freezing strategies may compromise the safety and cost-efficiency of inclined-shaft freezing projects.
Hence, numerous studies have investigated freezing-sinking techniques for inclined shafts. For example, aiming at the safety problem of a shaft lining in the freezing-sinking process of an inclined shaft, through a large amount of measured data, Wang et al. [8] analyzed the temporal change in the strain of the shaft lining in the freezing section and optimized the freezing construction method of the inclined shaft. Yang et al. [9] introduced a comprehensive method for evaluating the stress and displacement interactions between an irregular frozen wall and the adjacent ground, accounting for their mutual influences in the context of irregularities in inclined shafts. The complex freezing temperature field around inclined shafts requires thorough consideration. Chen et al. [10] conducted an inclined-shaft freezing model test based on the similarity theory and examined the evolution characteristics of the freezing temperature field. Inspired by the vertical-shaft freezing theory, Zhou et al. [11] deduced a calculation model for an inclined-shaft frozen wall; they analyzed and verified the relationship between the frozen wall thickness and the inclination angle of the shaft axis under deep and shallow burial conditions through examples. Yang et al. [12] developed a more accurate numerical calculation method for inclined-shaft freezing by combining the double-model method with the enhanced overlapping element method. Wong et al. [13] devised a plane finite element calculation model that coupled the temperature and stress fields, considering shaft freezing, excavation, and thawing processes. They investigated the thermal change law of the frozen wall and the mechanical properties of the shaft wall during the defrosting process. Sun et al. [14,15] combined physical and mechanical tests, field measurements, and finite element numerical simulations to analyze the mechanical properties and temperature-field evolution of inclined-shaft frozen walls when traversing water-rich sand layers. Chen et al. [16] established a large-scale three-dimensional freezing model test bench and studied the temperature field distribution law of the frozen wall of the inclined shaft under the two freezing methods of vertical hole and inclined hole. Zhang et al. [17] performed a similarity model test in conjunction with an actual inclined-shaft project, and the evolution law of the temperature field around inclined shafts under freezing conditions was analyzed.
In summary, extensive investigations have been conducted on the freezing process of inclined shafts, primarily focusing on subterranean excavation segments. However, the freezing temperature field in the open-excavation portion of inclined shafts has rarely been analyzed. The open excavation section is the primary area of inclined shaft excavation construction, and its construction quality determines the speed and safety of the whole inclined shaft excavation construction. During the construction of an open excavation section, the influence of air convection heat disturbance is more significant, so the development law of the temperature field is more complex. At present, there is a lack of systematic and in-depth research on this problem. In this study, taking the Shengfu Mine’s primary inclined-shaft open-excavation section in Shaanxi Province as the project background, a comprehensive analysis was conducted on the freezing and excavation temperature-field evolution laws of the open-excavation section using a large amount of collected data and considering factors such as the actual layout of freezing holes, initial ground temperature, specific heat capacity, and thermal conductivities of the fine sand and medium sand layers. The temperature field during freezing and excavation was thoroughly evaluated by establishing a 3D numerical calculation model. Our study provides valuable theoretical insights for the optimal design and safe construction of inclined-shaft freezing-sinking projects.

2. Project Background

The Shengfu Mine, located in Jinjie Town within Shenmu City, Shaanxi Province, China, spans a mining area of 15.05 km2. In accordance with the topographical conditions of the well field, inclined-shaft development was employed. The main inclined well was developed from south to north. The total length of the wellbore is 800 m, featuring an inclination angle of 14°, a net width of 5.2 m, a net height of 4.3 m, and a wellhead elevation of +1222.5 m. The freezing method was utilized for the construction of the incline; its upper section was excavated using an open-excavation method. A horizontal distance of 26 m separates the freezing commencement point from the starting point of the shaft, while the inclined length of the freezing section measures 18 m, its horizontal length spans 17.5 m, and its freezing depth ranges from 12.5 to 15.5 m (exceeding the 5 m shaft floor). The lower section was excavated by underground excavation. The freezing section is 525 m long. The Inclined shaft freezing schematic diagram is shown in Figure 1.

2.1. Engineering Geology and Hydrogeology

Upon examining the boreholes, the stratigraphy of the open-excavation section, in descending order, comprises ① Quaternary Holocene aeolian sand (Q4eol): it is mainly covered on other strata in the form of fixed sand, semi-fixed sand, and flowing sand, with a thickness of 4.75 m; ② Quaternary Upper Pleistocene Salawusu Formation (Q3s): the upper portion of the lithology is characterized by gray-yellow and gray-brown clayey fine sand, with brown-yellow and bright-yellow medium sand occupying the middle and upper sections, and the lower section is dominated by gray sandy soil, measuring 25.91 m in thickness. The aquifer comprises the Aeolian sand phreatic aquifer and Salawusu Formation phreatic aquifer. With substantial permeability and an abundance of water, the aquifer has a water temperature of approximately 11 °C and is therefore classified as a cold water aquifer, with an inflow rate of 10.02 m3/h.

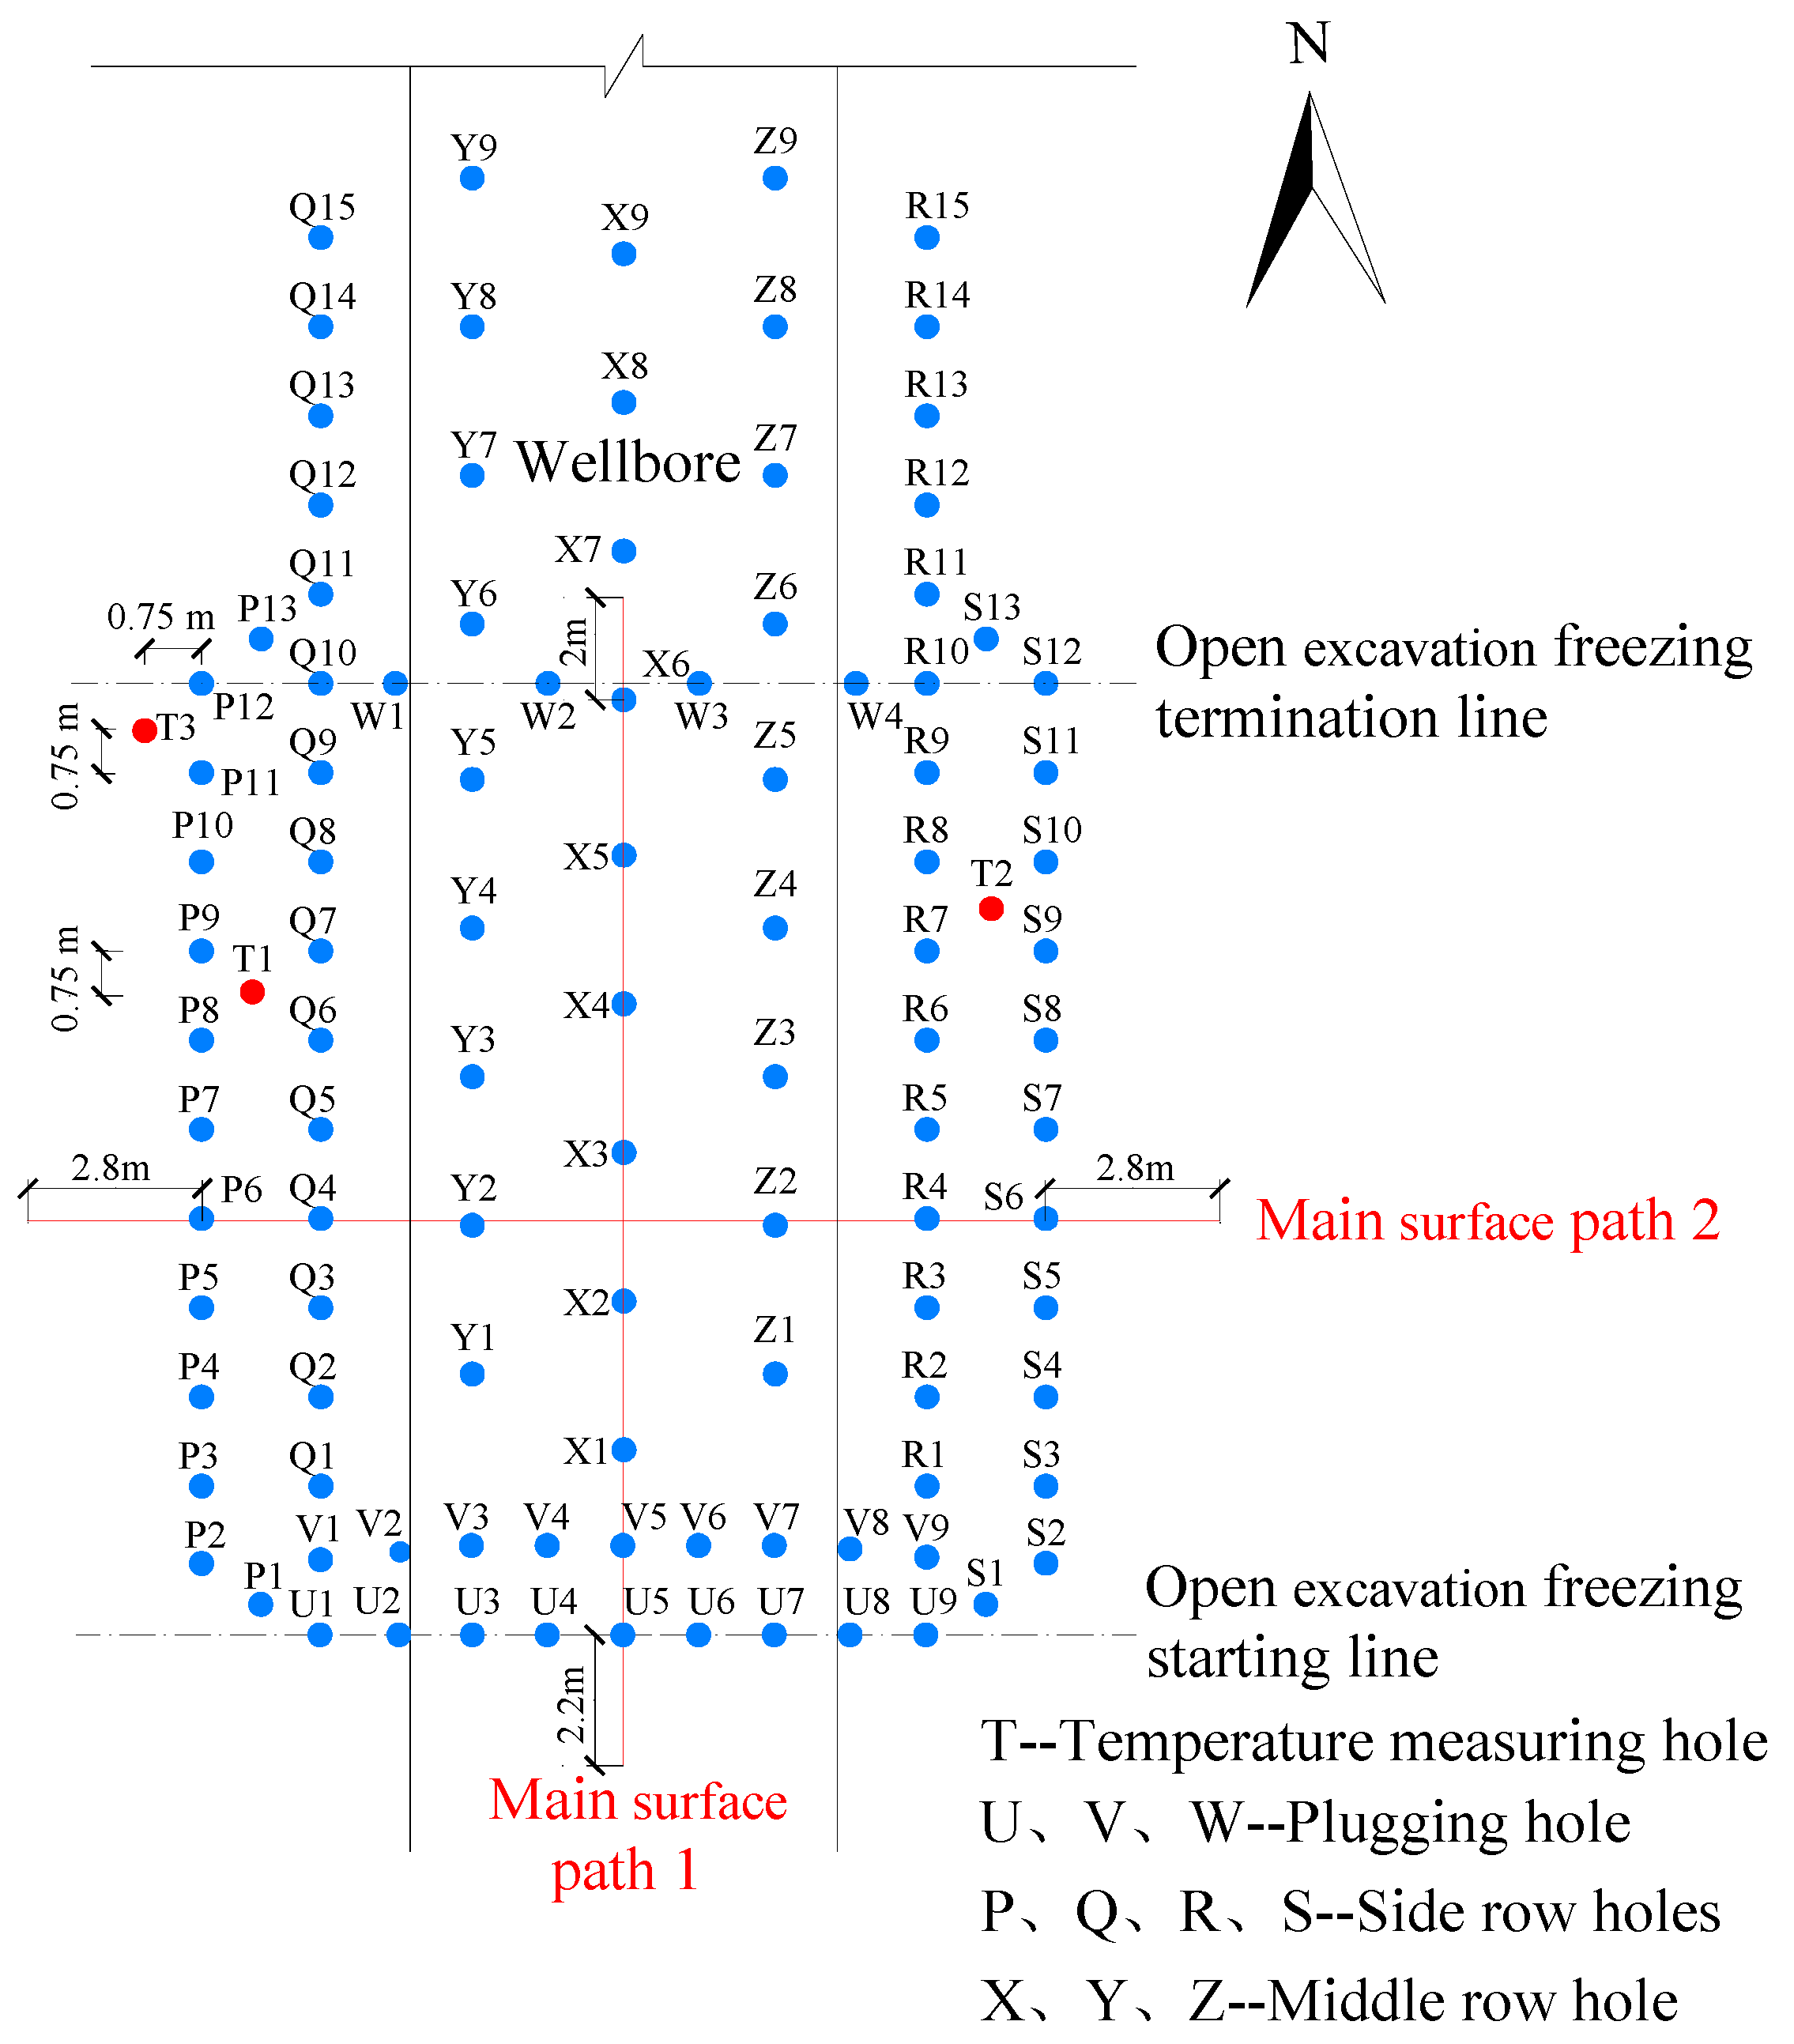
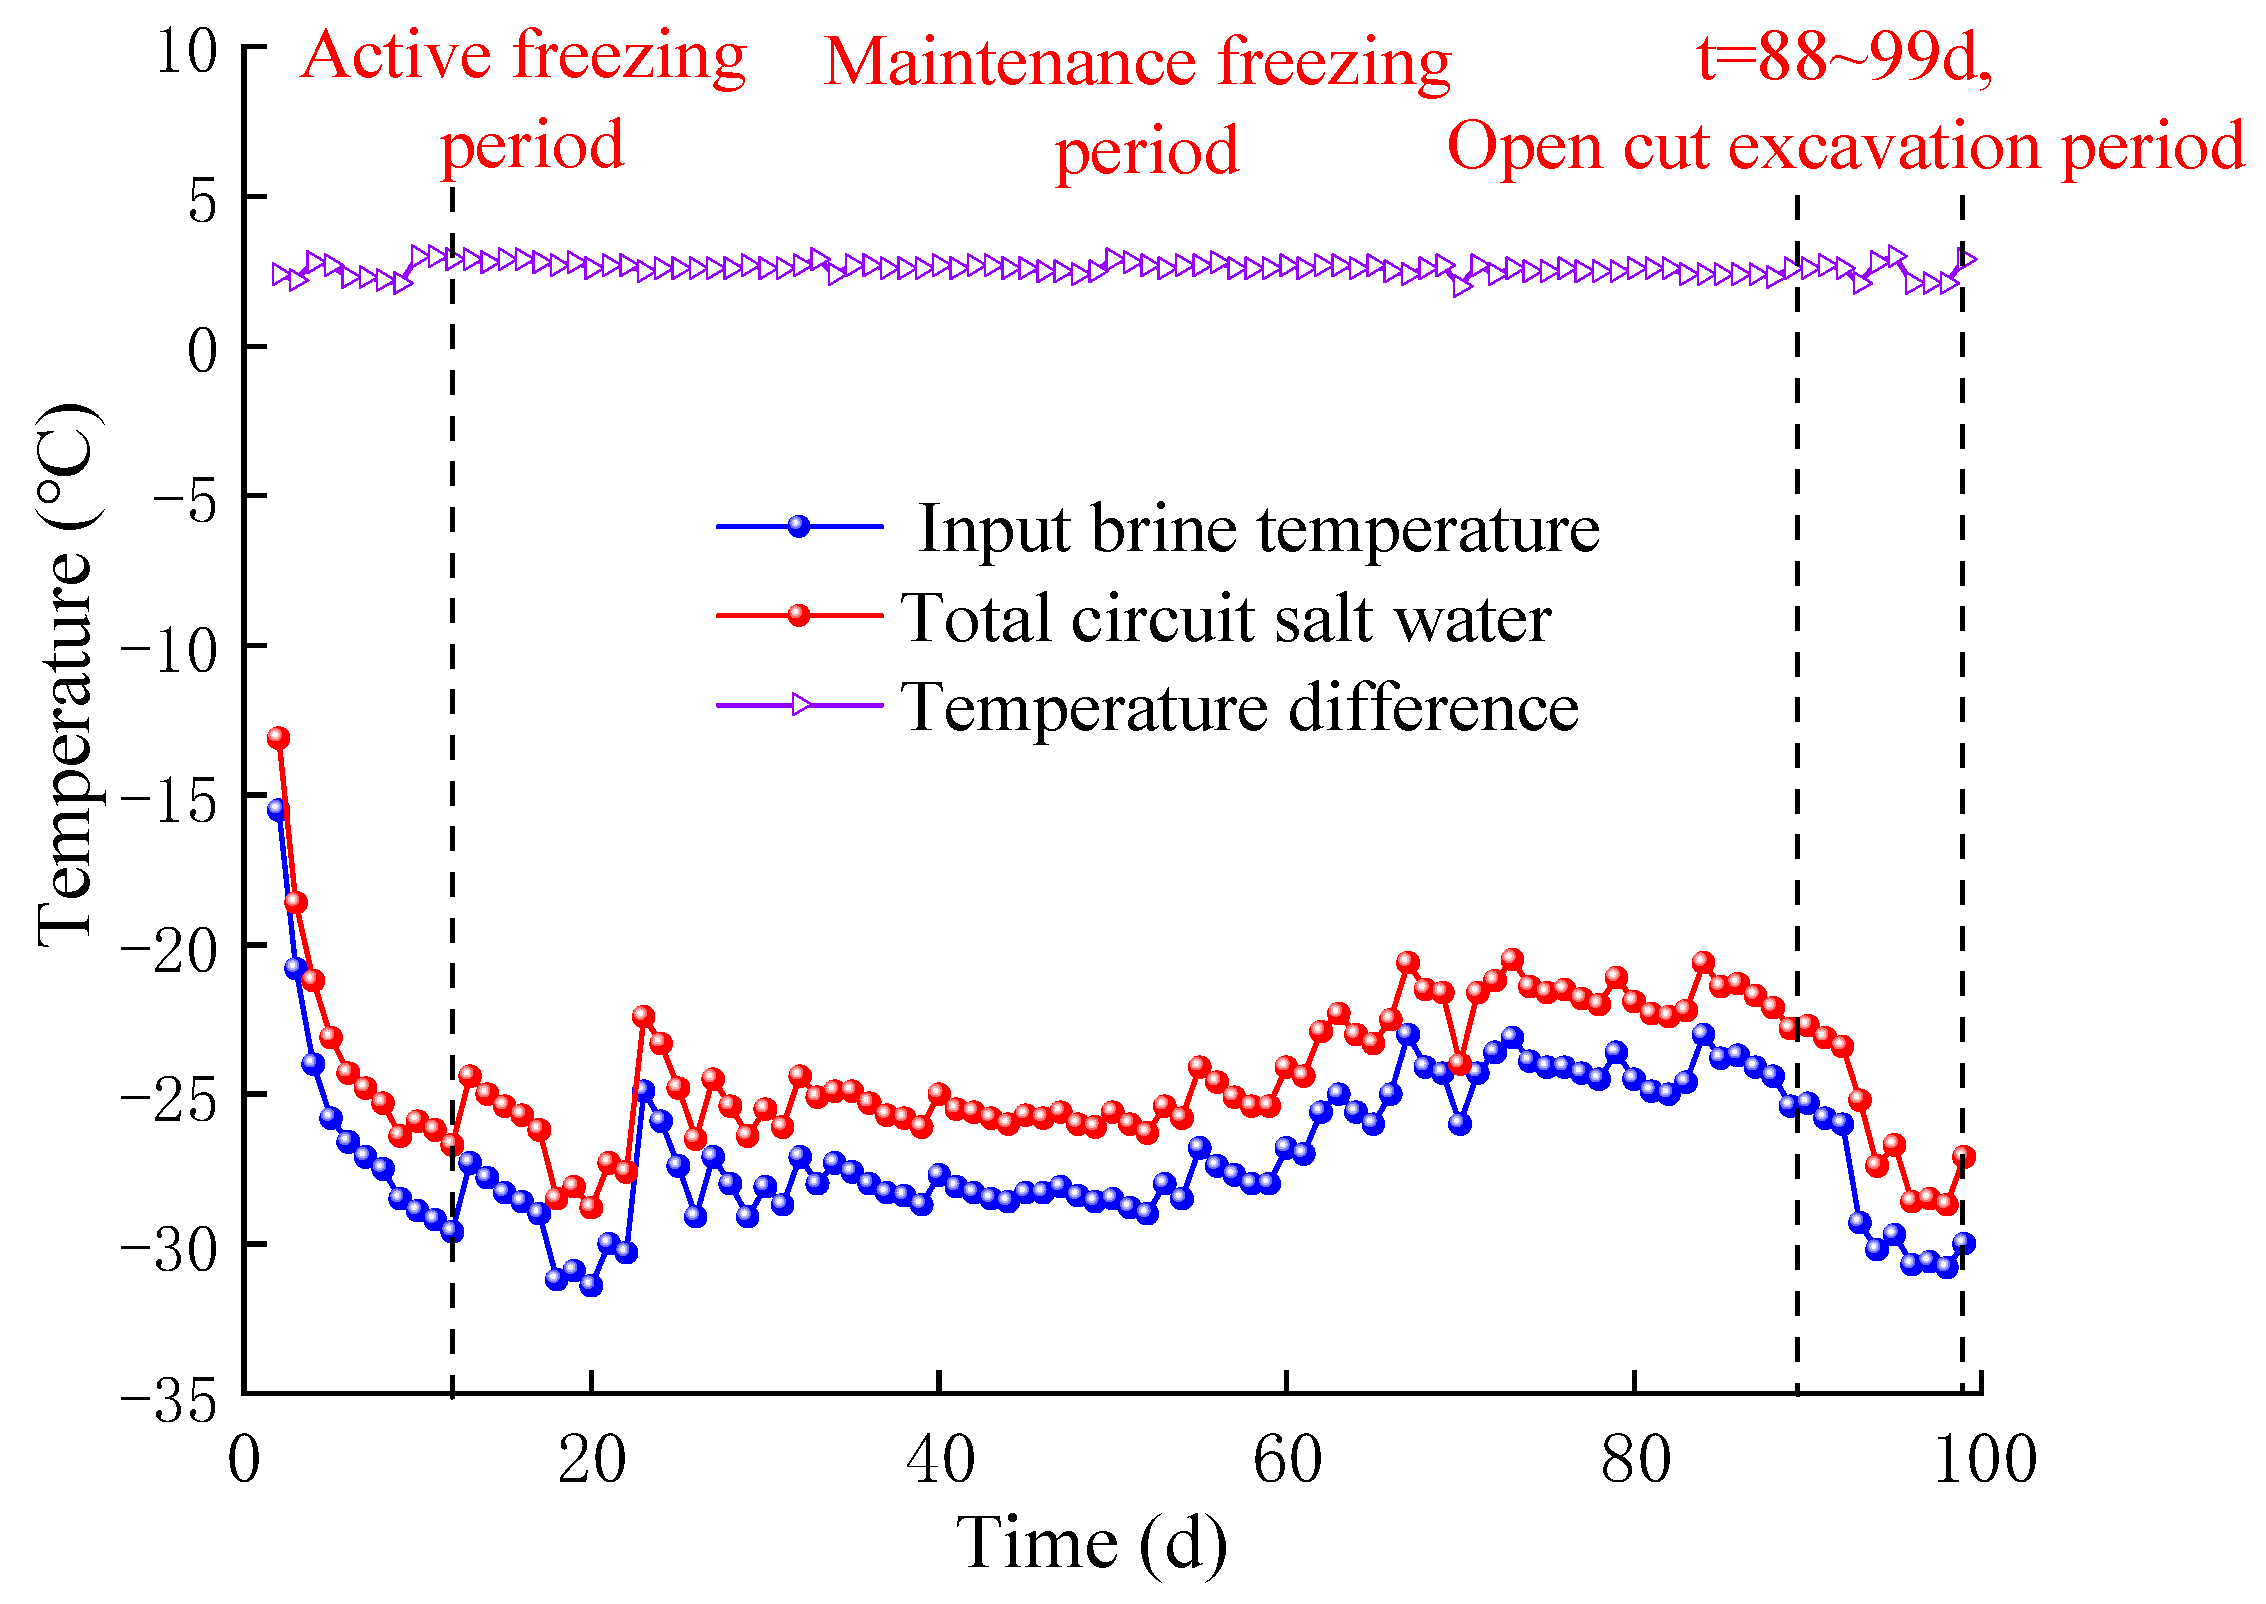
2.2. Design of Freezing and Monitoring Scheme

The freezing section of the open-excavation section features plugging holes and side-row holes arranged around it, which freeze simultaneously with the middle-row holes. A frozen wall was designed with thicknesses of 4 m and 5 m on both sides of the excavation section and the bottom plate, incorporated with three temperature-measuring holes with a depth of 17.72 m. At the start of the freezing point, two rows of plugging holes were positioned with a hole spacing of 1.27 m, while a single row of plugging holes was established at the freezing endpoint with a hole spacing of 1.4 m. The open-excavation section was arranged with three rows of middle-row holes and four rows of side-row holes. The side-row holes were located on both sides of the inclined shaft sidewall, with a hole spacing of 1.5 m. The three rows of the middle-row holes lie between the side-row holes at a row spacing of 2.54 m and a hole spacing of 2.5 m. Two primary surface pathways, namely main surfaces one and two, were determined. Main Surface one runs through the plugging holes and middle-row holes from south to north, spanning 20 m in length. Main Surface two runs through the side-row holes and middle-row holes from east to west, spanning 19.6 m in length. Figure 2 presents the arrangement of the freezing holes and the primary surface pathways. Table 1 lists the specific parameters of the freezing pipes.

3. Three-Dimensional Freezing Temperature-Field Calculation Model

3.1. Mathematical Model of 3D Freezing Temperature Field

The freezing temperature field of an inclined shaft is a 3D transient heat transfer problem with phase change [18]. Based on the heat transfer theory of the frozen soil, the control equation for the 3D freezing temperature field of inclined shafts takes the following differential form [19,20]:
C T t = x k T x + y k T y + z k T z
where T is the soil temperature, °C; t is time; C is the equivalent volumetric specific heat, J·g−1·K−1; k is the equivalent thermal conductivity, W·m−1·K−1.
Here:
C = C f T < T d C f + C u 2 + L T r T d T d T T r C u T > T r
k = k f T < T d k f + k u k f T r T d T T d T d T T r k u T > T r
where C f and k f are the volumetric specific heat and thermal conductivity of the frozen soil, respectively; J·g−1·K−1, W m−1·K−1; C u and k u are the volumetric specific heat and thermal conductivity of the unfrozen soil, respectively; J·g−1·K−1, W m−1·K−1; T d and T r are the freezing and melting temperatures of the soil, respectively, °C; L is the latent heat of the phase change per unit volume of soil, J/m3.
Before freezing, the initial condition of the equation is [21,22]:
T t = 0 = T 0
where T 0 denotes the initial temperature of the soil layer before freezing, °C.
In the calculation process, the boundary conditions of the freezing pipe can be expressed as:
T x p , y p , z p = T c ( t )
where x p , y p , z p is the coordinate of the freezing pipe; T c ( t ) is the temperature of the brine in the tube, °C.
The boundary conditions satisfy the Dirichlet boundary condition at an infinite distance from the wellbore freezing temperature field:
T ( x = , y = , z = ) = T 0
After the excavation of the soil, convective heat transfer between the soil and the air at the exposed well position is applied as the boundary condition:
q = h × ( T e x t T s )
Here, h is the convective heat transfer coefficient between the soil and air, W·m−2·K−1; T e x t is the external environment temperature, °C; T s is the soil temperature at the well-side position, °C.
The aforementioned regulation differential equations, along with their boundary conditions, make up the definite solution of the 3D temperature area in the inclined shaft during the freezing and excavation processes.

3.2. Establishment of a 3D Finite Element Numerical Model

In the model developed using the finite element software COMSOL Multiphysics 5.6, the basic assumptions of the numerical calculation model are:
(1)
Soil mass is a saturated porous medium composed of soil particles, water and ice.
(2)
All parts of soil mass are homogeneous and isotropic.
(3)
In the freezing process, convective heat transfer caused by groundwater seepage is not considered.
(4)
In the freezing process, the influence on the temperature field of frost heaving is not considered [23].
With this model, the primary aim was to investigate the evolution patterns of the freezing temperature field before and after the excavation of the open excavation section of the shaft. Accounting for the impact radius of the temperature field, the overall model was constructed in the form of a hexahedron with dimensions of 30 m × 40 m × 50 m. Based on the actual construction site conditions, plugging holes, side-row holes, and middle-row holes were established. The inclination angle of the inclined shaft was set to 14°. To ensure the calculation accuracy while conserving computational resources, four-node tetrahedral solid heat transfer units were employed in the model. The soil near the freezing holes was divided into denser grids, while sparser grids characterized areas farther from the freezing holes with minimal temperature gradients [24], totaling 3,742,752 units. Figure 3 shows the 3D finite element computational model.

3.3. Thermal Physical Parameters of Soil

Figure 2 shows that the soil layers in the open-excavation section are predominantly composed of fine sand and medium sand. Soil samples were collected from the construction site, and indoor thermal tests were conducted to determine the thermal physical properties of each soil layer, such as the thermal conductivity and specific heat capacity, under both frozen and unfrozen soil conditions. Table 2 presents the thermal physical parameters of each soil layer.

3.4. Initial Temperature and Boundary Conditions

Field measurements showed that the initial ground temperatures of the fine and medium sand layers before freezing were 8.3 °C and 12.0 °C, respectively. The field-measured brine temperature served as the thermal boundary condition for the freezing pipe during the calculation process [25]. Figure 4 shows the measured temperature change curve of the brine. Based on the measured brine temperature curve, the entire freezing process can be divided into two stages: ① Active freezing period: During this stage, the brine temperature drops rapidly between days 0 and 12, reaching approximately −27 °C; ② Maintenance freezing period: In this phase, the temperature remains relatively stable, with the brine temperature remaining below −20 °C. The difference between the temperature of the input brine and output brine is 1~3 °C, which is adequate to meet the excavation requirements of the open-excavation section.

4. Measured Data of the Temperature Field in the Open-Excavation Section

Due to the nearly symmetrical positioning of the T1 and T2 temperature measurement orifices, the alterations in temperature experienced by each are approximately equivalent. Therefore, the thermal changes at the T1 and T3 temperature measuring holes within the burial depth of the soil (2 m to 16 m) in the open-excavation section were observed for 99 days. Figure 5 shows the 3D thermal variations. Based on these thermal diagrams, the initial ground temperatures of the fine and medium sand layers were approximately 8.3 °C and 12 °C, respectively. The T1 temperature measuring holes were located between the P and Q rows, where the cooling capacities of both rows were combined, causing the temperature at these holes to decrease rapidly. During the 13th day of freezing, the temperature of the fine sand layer dropped to nearly 0 °C. When the freezing reached 20 days, the temperature of the medium sand layer decreased to approximately 0 °C. The temperature of the fine sand layer declined faster than that of the medium sand layer due to its lower initial temperature and higher thermal conductivity. Notably, the T1 temperature measuring holes were located between the P and Q rows and following the intersection between the freezing walls, an enclosed freezing wall isolated the hydraulic connection between the inner and outer regions of the soil. The water within the soil could no longer flow to the surrounding area but instead froze, releasing solidification heat during phase transition. This heat offsets the cold energy released by the freezing holes, maintaining the soil temperature at approximately 0 °C for a short phase-transition platform period. By day 27 of the freezing, this platform period was completed, and the soil temperature decreased rapidly. When the freezing reached day 50, the overall soil temperature decreased to approximately −20 °C, with the soil temperature then decreasing slowly and gradually stabilizing.
The T3 temperature measuring holes, located outside the P-row side-row holes, experienced a lower temperature drop rate compared with the T1 temperature measuring holes due to the external heat source provided by the soil. After approximately 30 days of freezing, the temperature of the fine sand layer at the T3 measuring points declined to approximately 0 °C. Later, on day 37 of the freezing, the temperature of the medium sand layer also decreased to 0 °C. As a result of the ultra-fine water pressure [26], water seepage and migration occurred within the soil, which expanded to other regions. Consequently, the heat released due to phase change was reduced, and no evident phase change platform was observed. After 60 days of freezing, the overall soil temperature dropped to approximately −8 °C, with the soil temperature gradually stabilizing as it continued to decrease gradually.

5. Analysis of Numerical Results

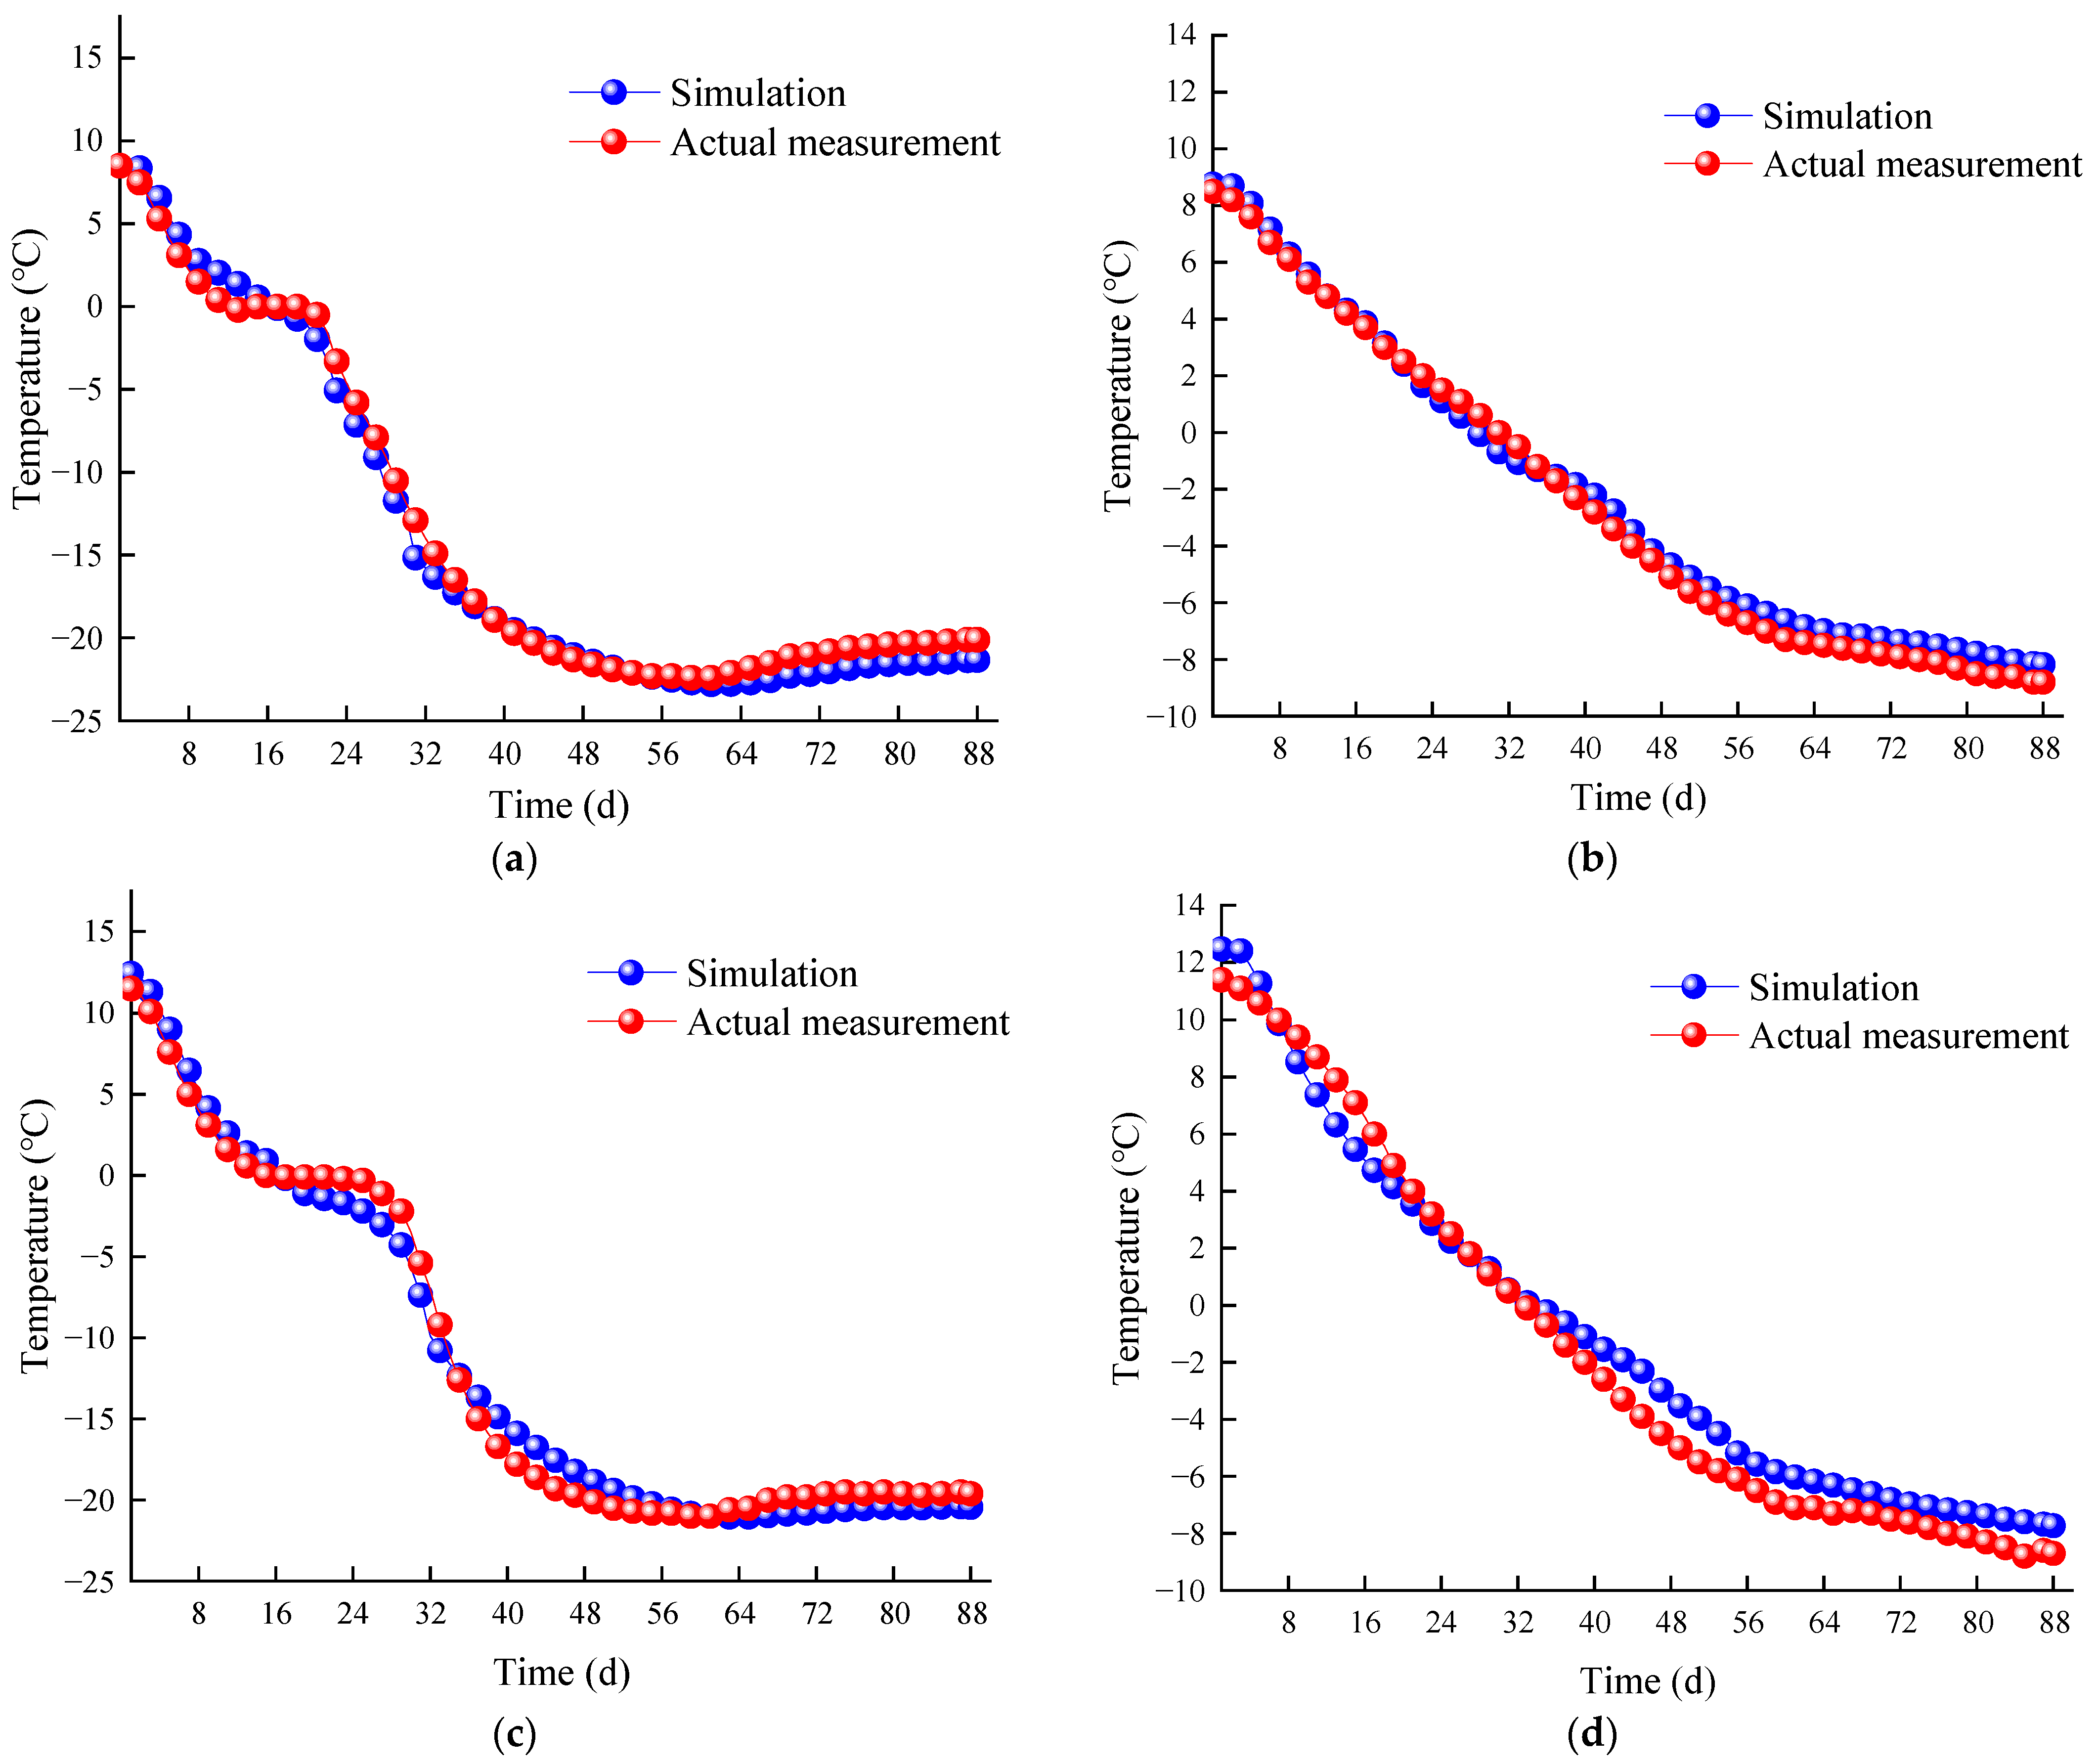
5.1. Comparison of Simulation Results

Figure 6 shows the measurements and simulations of the temperature at the temperature measurement holes, focusing on soil layers at depths of 3 m (fine sand layer) and 11 m (medium sand layer). When comparing the measurement results between the T1 and T3 temperature measurement holes with the numerical calculation results, a consistent temperature change trend could be observed, with an error of ±2 °C. Based on these findings, it is reasonable to conclude that the numerical simulation results of the temperature field were in good agreement with the field measurements. Utilizing a 3D numerical calculation model is feasible for studying the temperature-field evolution in frozen open-excavation sections of inclined shafts.

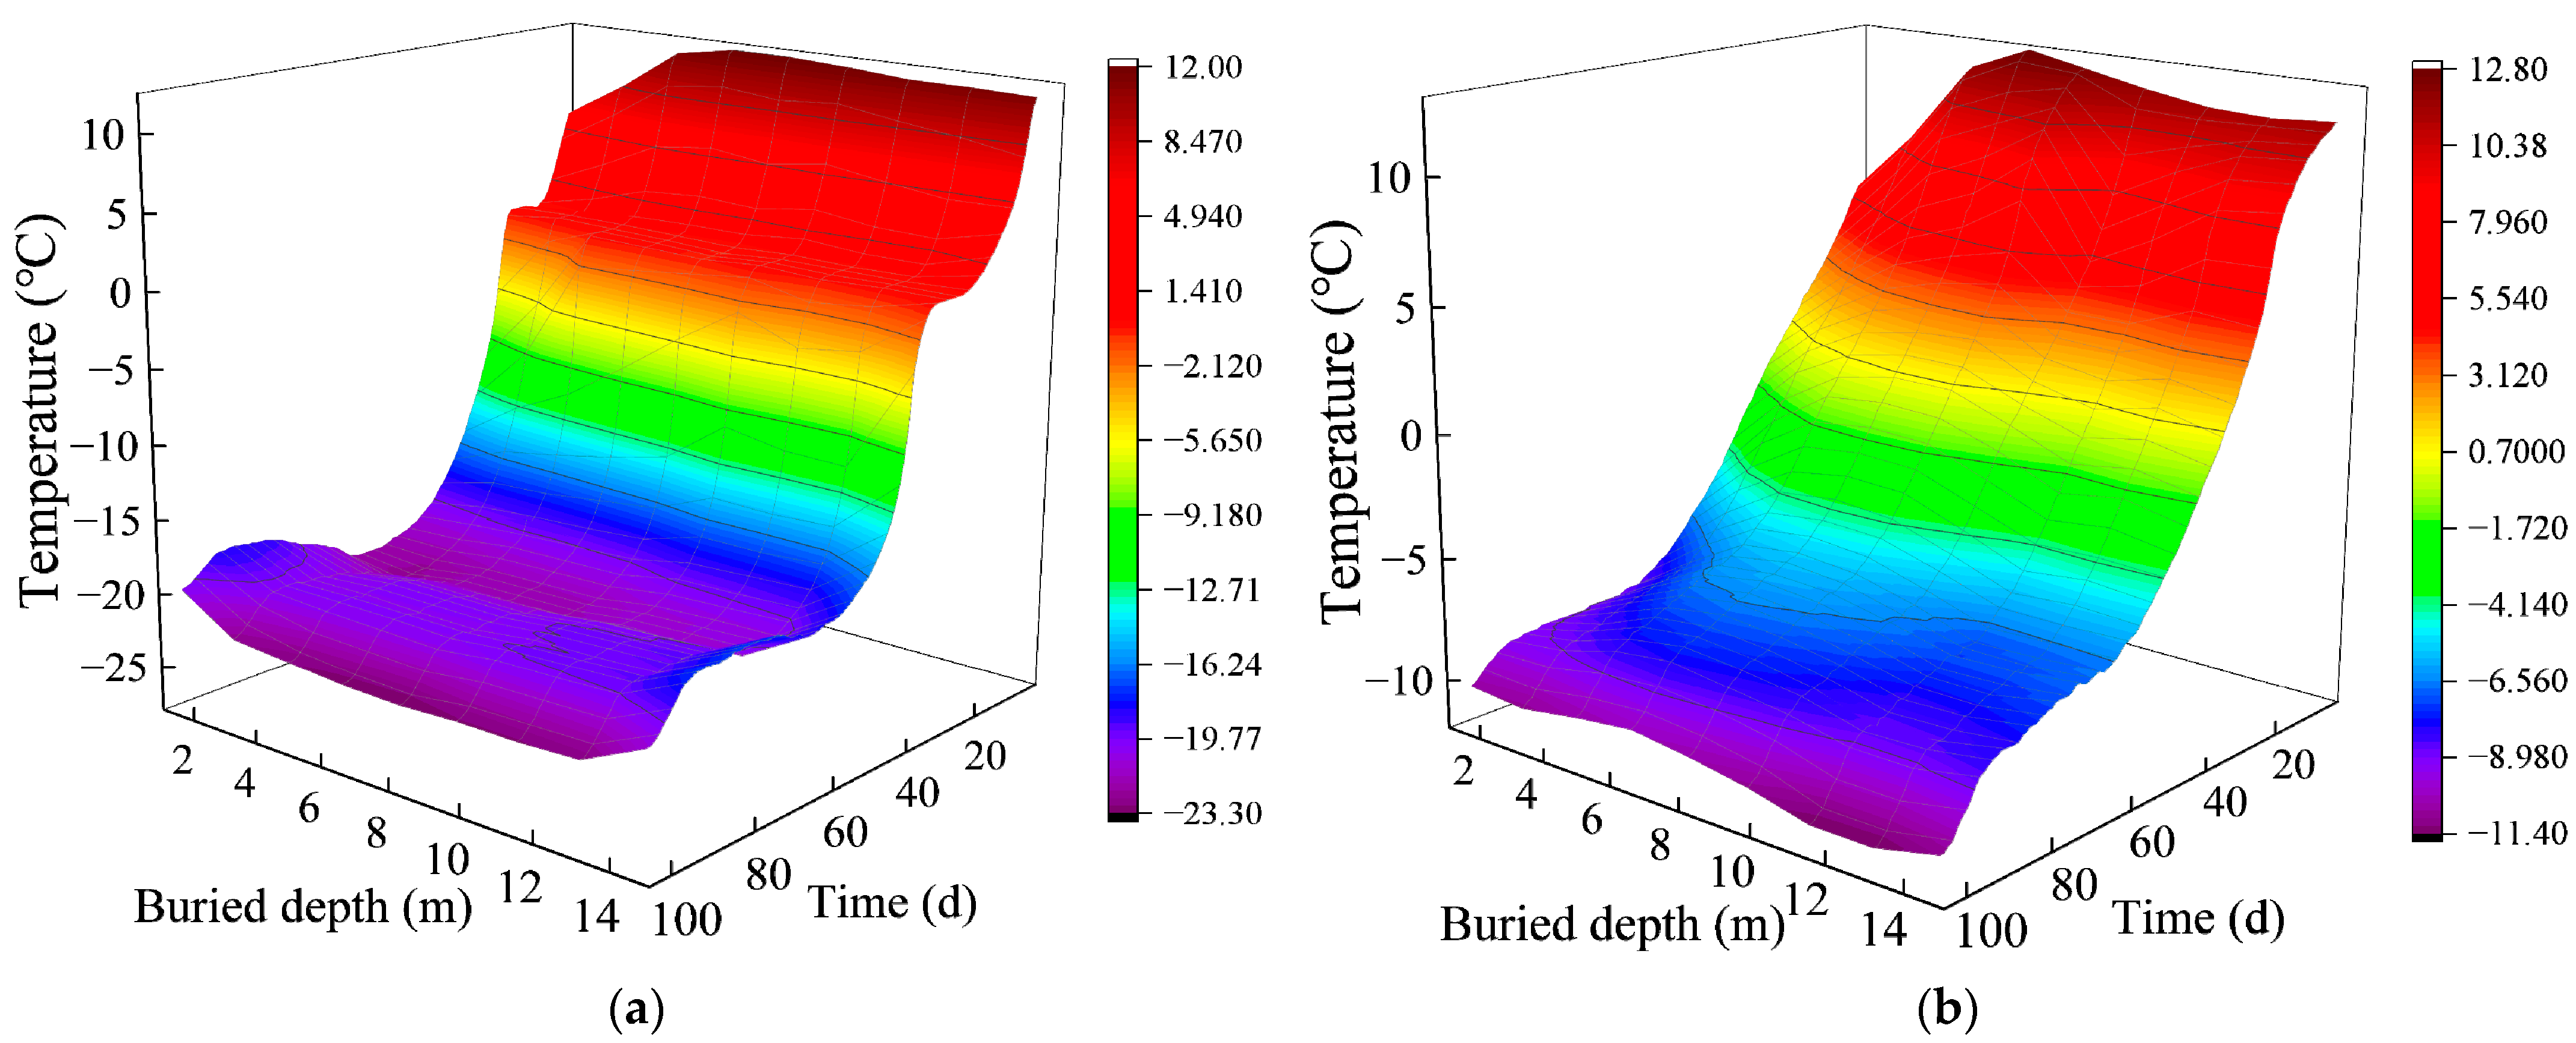
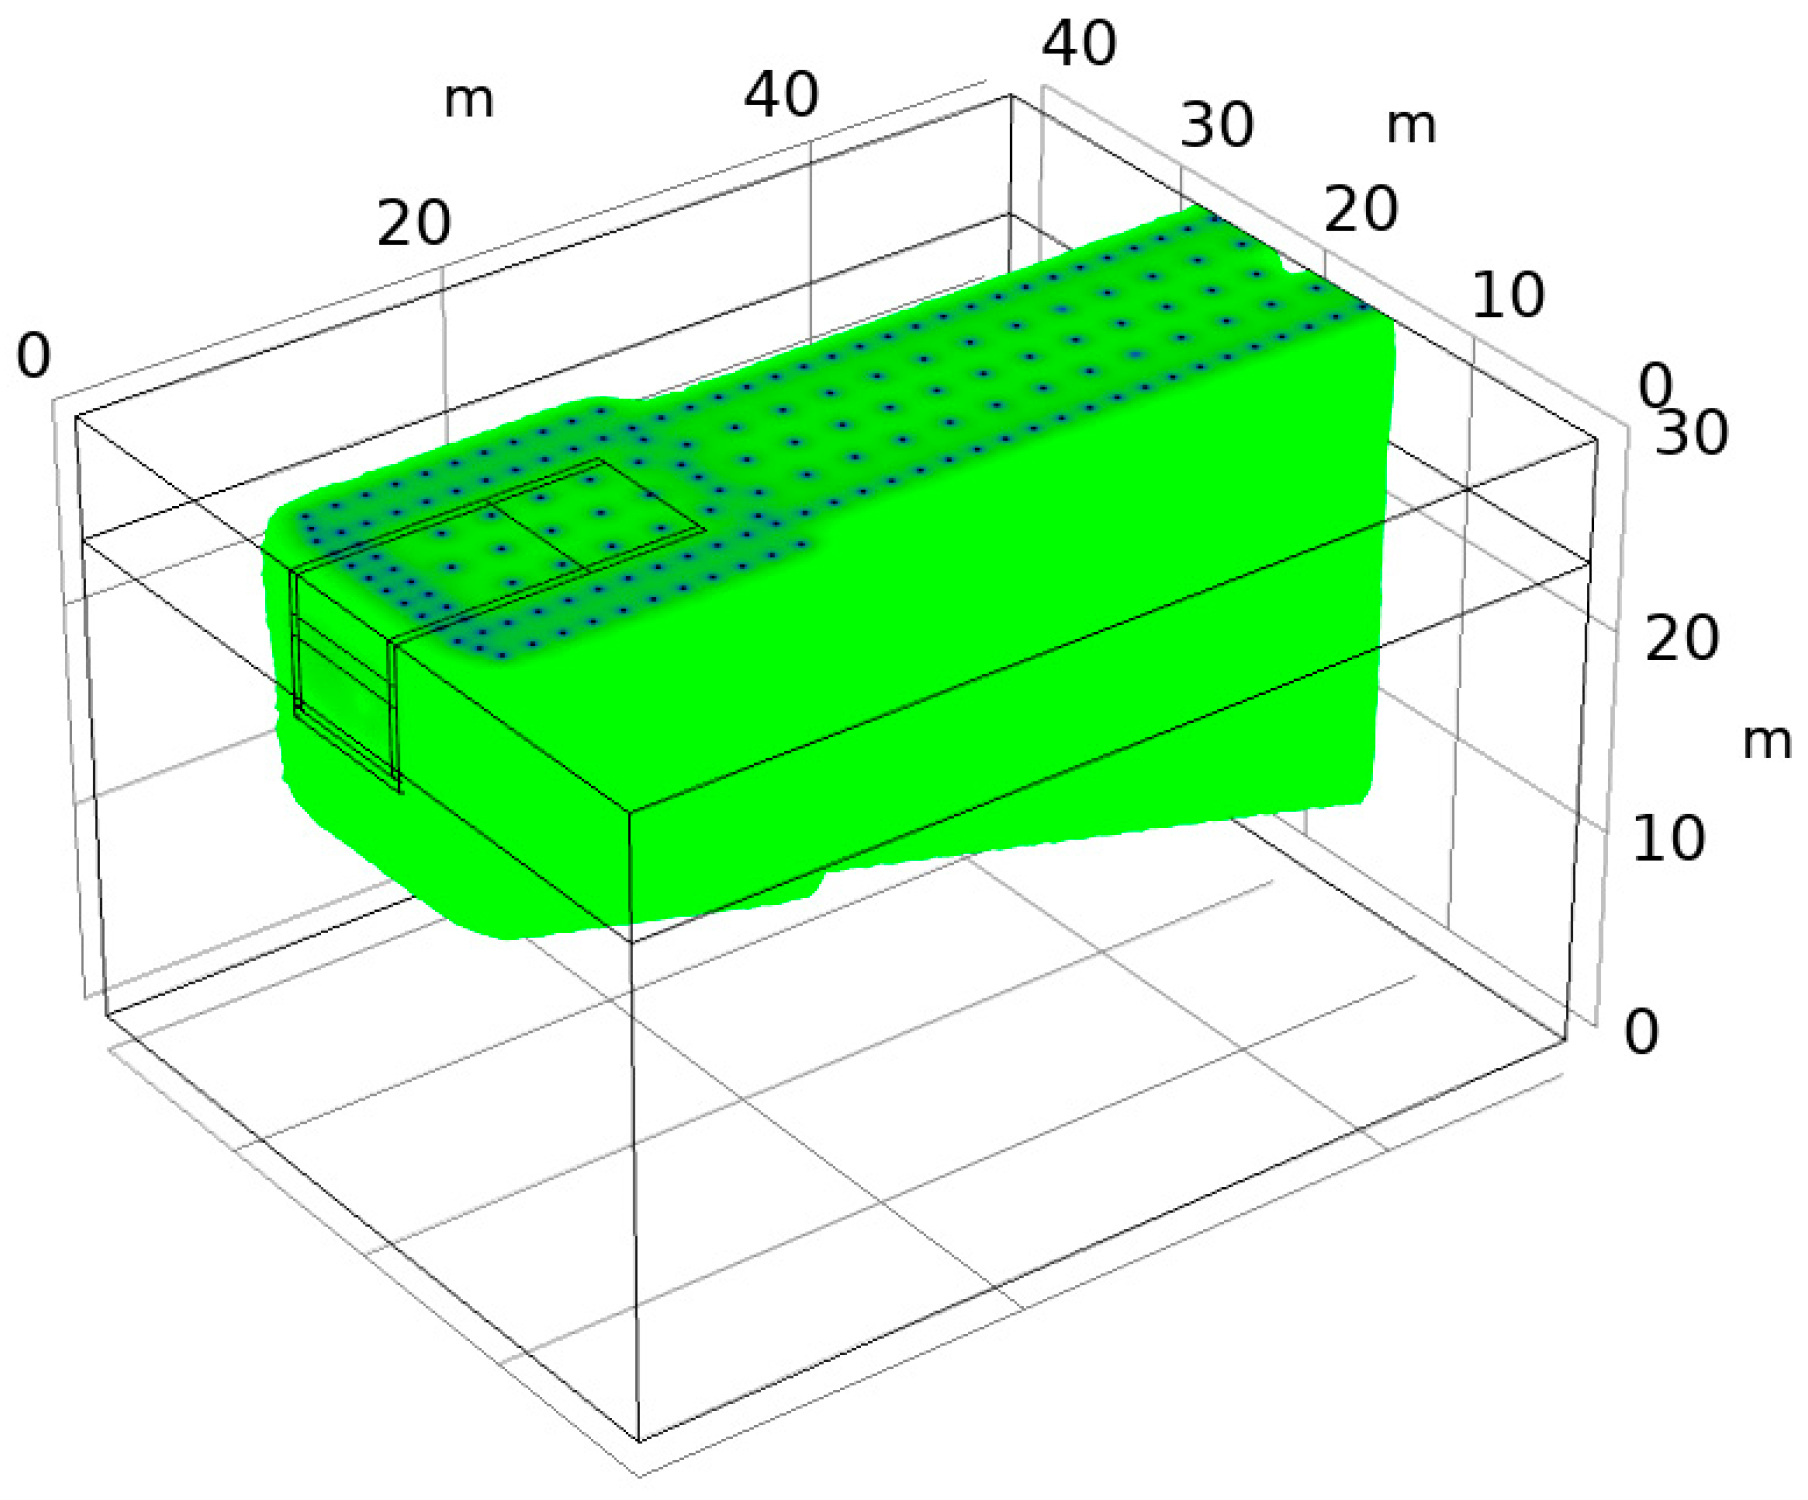
5.2. Spatiotemporal Evolution Law of the Temperature Field before Excavation

5.2.1. Overall Distribution and Development Law of the Temperature Field

Figure 7 shows the overall distribution and development diagrams of the 3D freezing temperature field in the open-excavation section before excavation. In the initial freezing stage, the low-temperature brine flowing inside the freezing pipes transferred cold energy to the surrounding areas, leading to intense heat exchange between the pipes and the nearby soil. After 30 days of freezing, the soil temperature in the freezing zone decreased rapidly. The plugging hole area saw the highest temperature drop rate, followed by the side-row holes and, lastly, the middle-row holes. After freezing for 50 days, the freezing peak surface, with the freezing pipes at its center, expanded outward with increasing freezing time, gradually reducing the unfrozen soil thickness in the middle-row hole area. The denser the freezing pipes, the quicker the freezing temperature field develops and the thicker the frozen wall. At 88 days of freezing, the small spacing between the plugging and side-row holes contributed to a well-developed freezing wall. The middle-row hole area, which was designated for later excavation, had a larger freezing hole spacing, resulting in a lower development rate of the freezing wall. This indicates that the freezing pipe layout is reasonable and that the overall freezing effect is successful.
To analyze the temperature field distribution within each soil layer before open excavation, the temperature-field nephograms of two soil layers with burial depths of 3 m (fine sand layer) and 11 m (medium sand layer) were chosen for comparison, as shown in Figure 8. In the early freezing stage, the formation rate of the frozen soil was relatively low, representing a process of cold energy storage. At 30 days of freezing, the freezing areas of the adjacent plugging holes and side-row holes in the fine sand layer began to intersect as time progressed. Meanwhile, the development rate of the frozen wall in the medium sand layer was notably lower than that of the frozen wall in the fine sand layer, and the frozen walls had not yet fully intersected. At 50 days of freezing, the freezing areas of each freezing hole gradually expanded, and the frozen walls of both the soil layers had entirely intersected to form a water-sealed curtain surrounding the open-excavation section. At 88 days of freezing, the middle-row hole area intersected, and excavation requirements were met. In summary, when the open-excavation section was frozen for 88 days, the sidewall thickness of the frozen wall could reach its corresponding design value (4 m), meeting the excavation demand for open-excavation sections.
Figure 9 shows the overall shape and distribution of the frozen wall when the open-excavation section is frozen for 88 days. From the diagram, it is evident that at different burial depths within the range of the frozen pipe, the horizontal frozen wall intersected when the excavation area was frozen for 88 days. In the proposed excavation area, the thickness of the frozen wall at the bottom plate exceeded 5 m. Moreover, as shown in the cloud map of the frozen wall at various cross-sections of the burial depth, the sidewalls of the frozen wall of different layers could reach a thickness of over 4 m at 88 days of freezing. This indicates that both the floor and side walls of the frozen wall could reach their corresponding design values when excavating the open-excavation section after 88 days of freezing. In conclusion, a construction plan in which the open-excavation section is excavated after 88 days of freezing is found to be reasonable and safe.

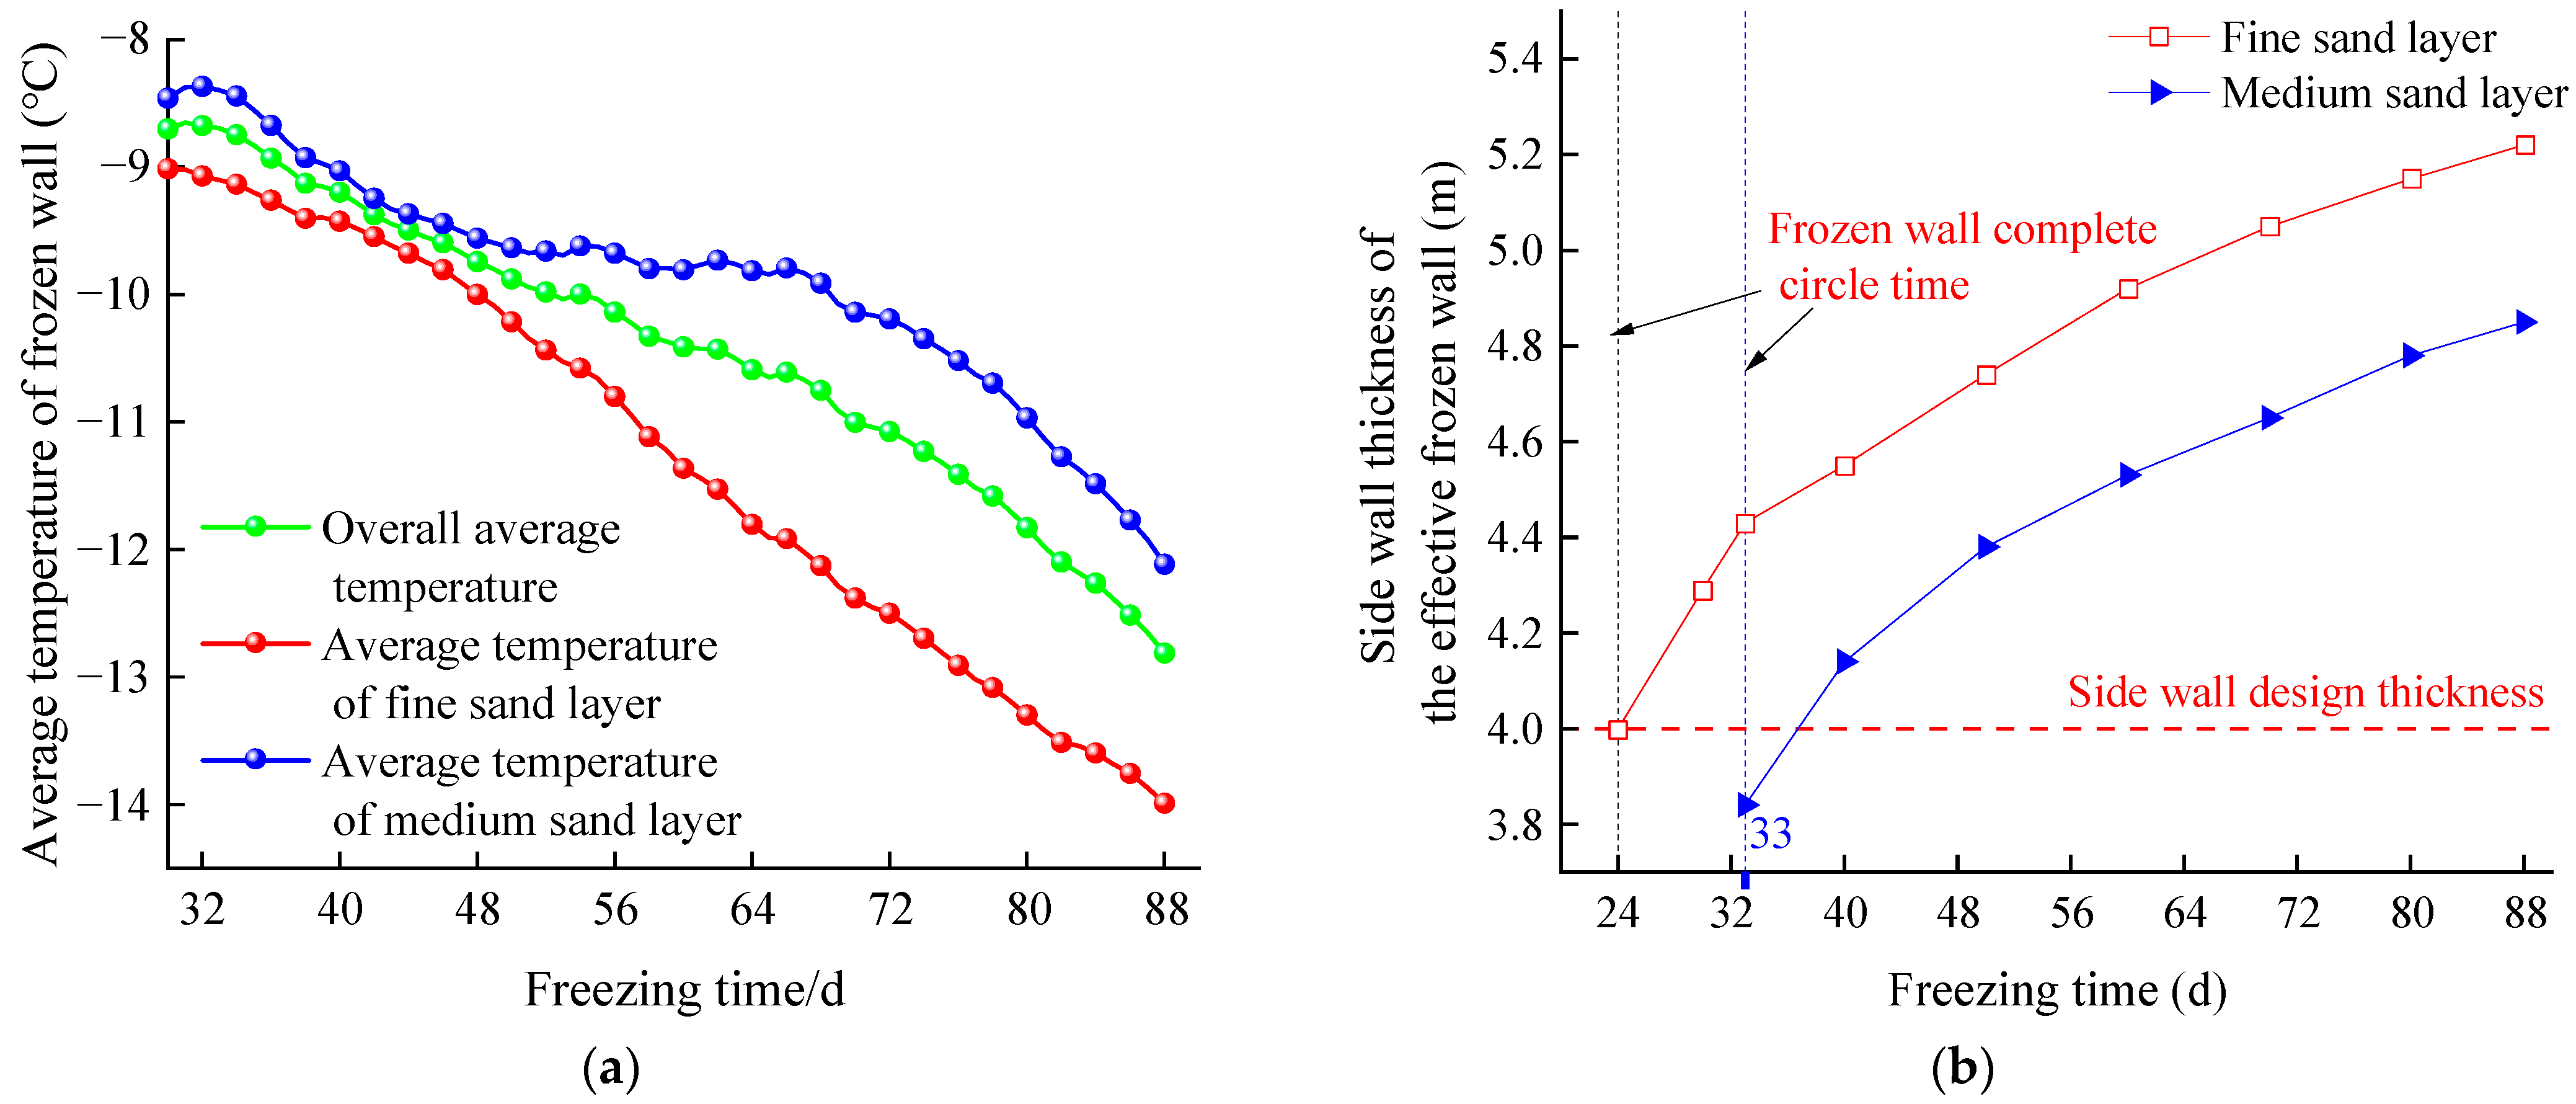
5.2.2. Average Temperature and Thickness of the Effective Freezing Wall

The effective frozen wall represents the frozen wall retained after removing a part of the frozen soil cleared by shaft excavation from the original frozen wall. The average temperature of the frozen wall is the weighted average of the soil temperature below the freezing point in its area [27,28].
As shown in Figure 10a, the average temperature of the frozen walls in both soil layers decreases significantly with the freezing time. The frozen wall of the fine sand layer maintains a lower average temperature compared with that of the medium sand layer, attributed to its lower initial ground temperature and the impact of an external heat source on the frozen wall of the medium sand layer, resulting in a higher temperature than the fine sand layer. During the freezing process, the average temperature of the frozen walls in both the soil layers decreased as time progressed, with the frozen wall of the fine sand layer showing a roughly negative linear correlation with time. The thermal trend in the medium sand layer can be broadly divided into three stages: ① During the first 50 days of freezing, the average-temperature change trends in the frozen walls of both the soil layers were nearly identical, with average-temperature decline rates of 0.0588 °C/day and 0.0601 °C/day, respectively. ② Between 50 and 68 days of freezing, the frozen wall extended to the excavation path, causing the outer frozen soil to come into contact with the surrounding soil layers. This led to a considerable amount of heat exchange between them, consuming the cold energy released by the low-temperature brine and causing the frozen wall temperature of the medium sand layer to decrease gradually. ③ After 68 days of freezing, the average temperature of the frozen wall within the medium sand layer dropped quickly at a rate of 0.1030 °C/day, while the fine sand layer experienced a reduction rate of 0.0931 °C/day. Considering the freezing speed, the average temperature reduction rate of the frozen wall in the medium sand layer during this stage was higher than that of the frozen wall in the fine sand layer. This is because the thermal conductivity of the medium sand layer was higher after freezing compared with that of the fine sand layer, leading to a more efficient heat transfer and a quicker temperature drop. After freezing for 88 days, the frozen walls of the two soil layers had average temperatures of −13.99 °C and −12.11 °C, resulting in an overall average temperature of −12.81 °C.
Figure 10b shows the relationship between the effective frozen wall thickness and freezing time. The thickness of the effective frozen wall exhibited an upward exponential trend. In the initial stages of the frozen wall closure, the thickness of both layers of the frozen wall increased rapidly, with the increase rate gradually decreasing over time. This can be explained by the fact that the frozen wall expanded to both sides simultaneously at the beginning of the closure. When it extended to the excavation path, the outer frozen soil came into contact with the surrounding soil layers, thereby decreasing the growth rate of the frozen wall thickness. Under the same freezing time conditions, the frozen wall formed by the fine sand layer was thicker than that formed by the medium sand layer. The complete intersection times of the frozen walls in the fine and medium sand layers were 24 days and 33 days, respectively. At these intersection times, the average effective frozen wall thicknesses of the two soil layers were 4 m and 3.8 m, respectively. Notably, the thickness of the frozen wall in the fine sand layer had reached the design thickness of the frozen wall of the side wall (4 m). After 88 days of freezing, the effective frozen wall thickness of the two soil layers reached 5.22 m and 4.85 m, respectively. These values were greater than the design value of the side-wall thickness of the frozen wall (4 m).

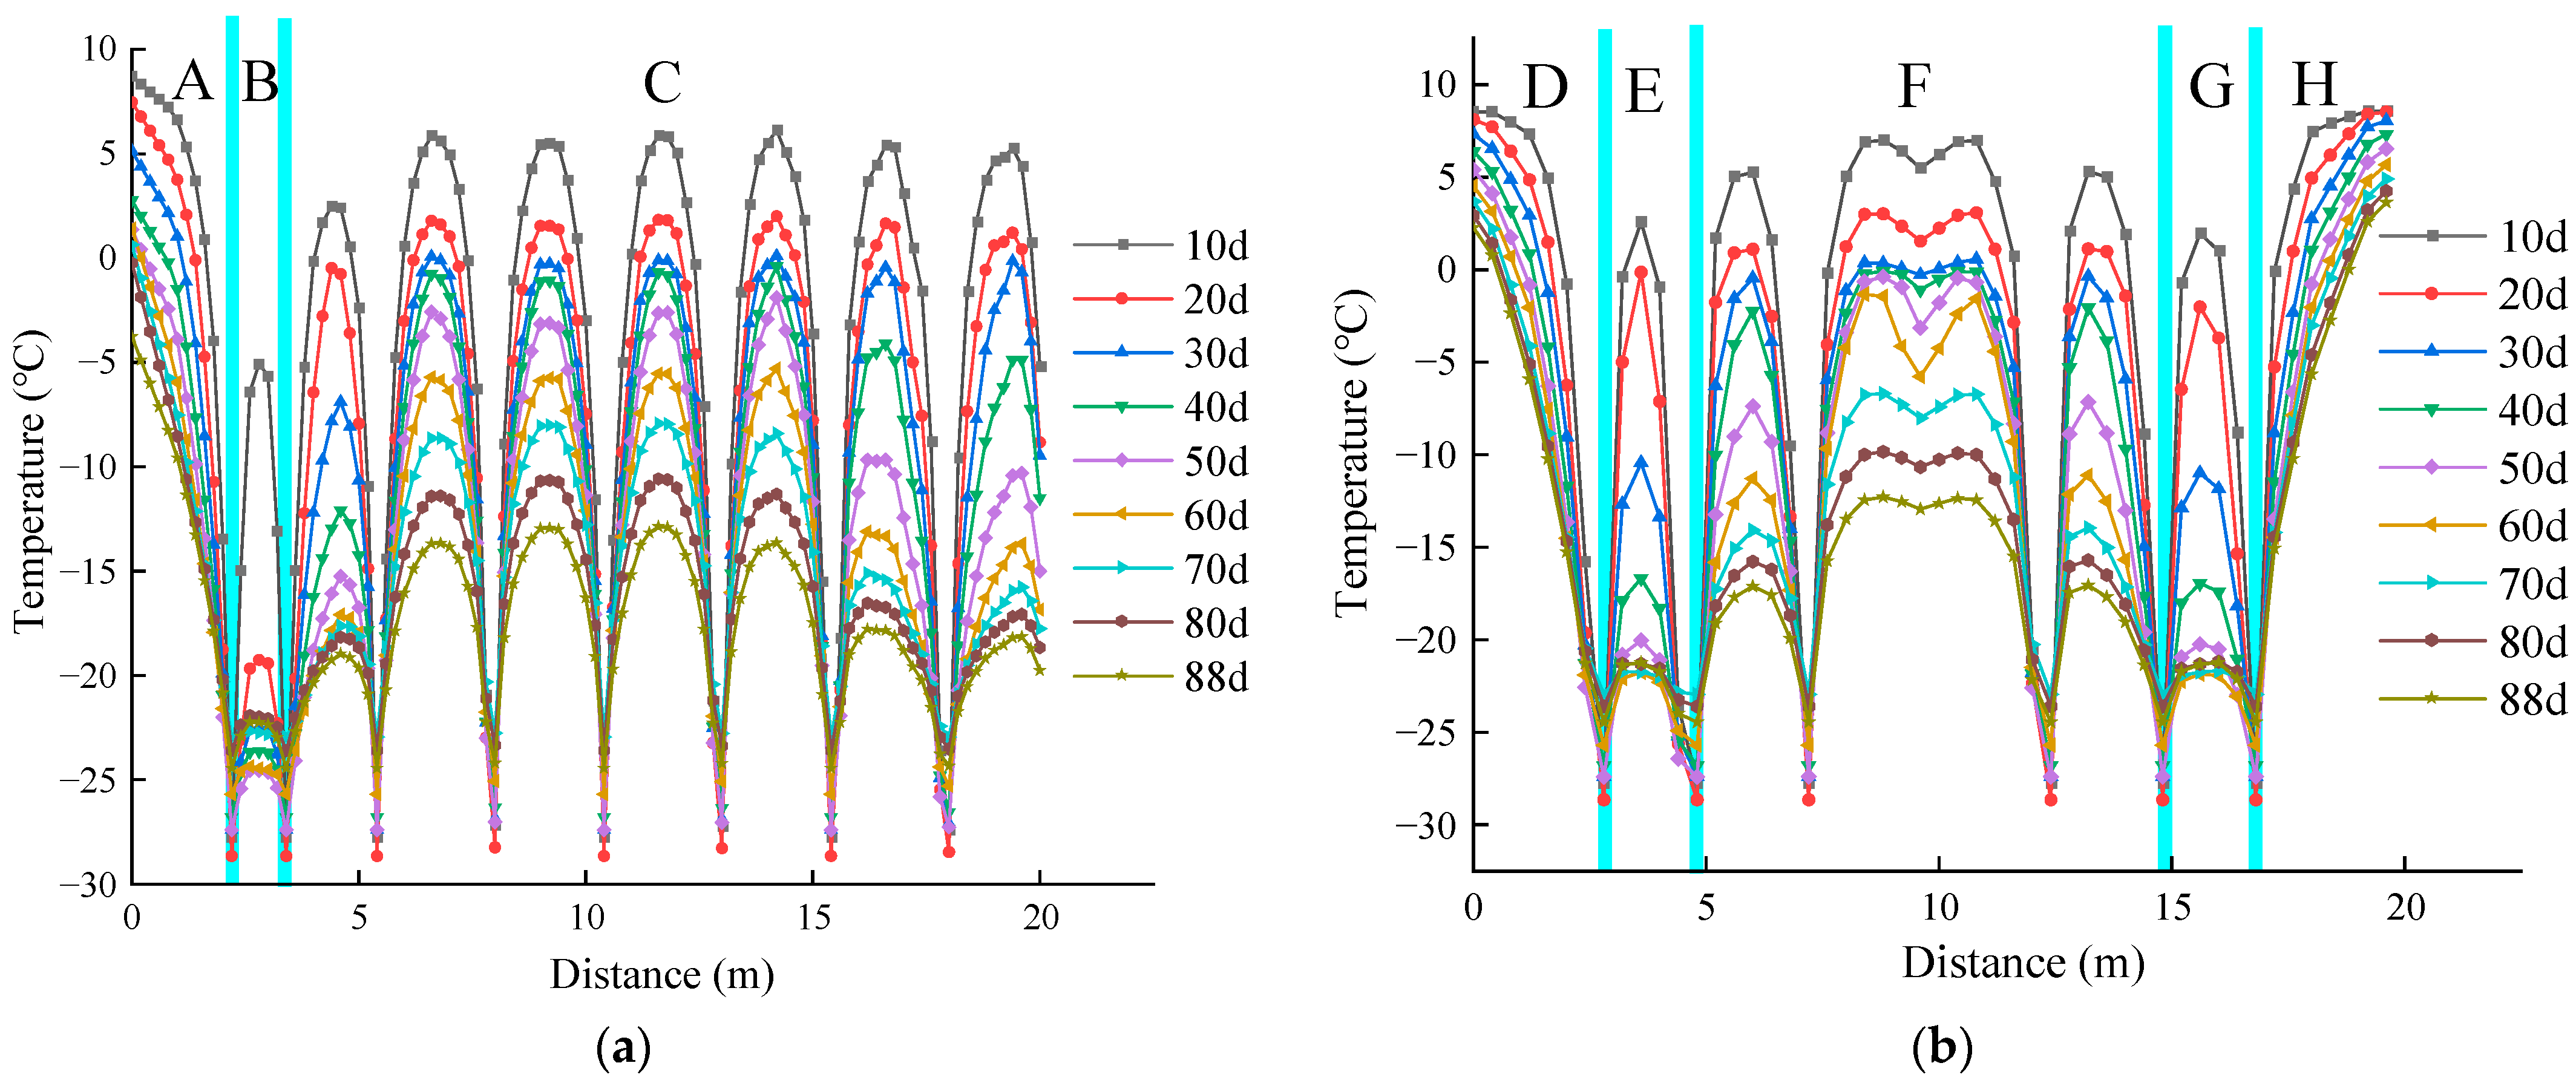
5.2.3. Temporal and Spatial Evolution Laws of the Temperature Field along Main Pathways

Figure 11 and Figure 12 show the temperature variation curves for the fine sand layer with a burial depth of 3 m and for the medium sand layer with a burial depth of 11 m. For ease of analysis, the main surface one could be divided into three zones: A, B, and C. Zone A was located outside the U-row plugging holes; Zone B was between the two rows of plugging holes U and V; and Zone C was where the middle-row holes were located. The main surface two could be divided into five zones: D, E, F, G, and H. Zones D and H were located outside the P-row and S-row, respectively, while Zone E was between the P and Q rows of the side-row holes. Zone G was between the R and S rows of the side-row holes. Zone F was located between Zones E and G. The figures show that, as the freezing progresses, the cooling capacity of the freezing pipe continues to output, and the temperature in each zone consistently decreases. When the freezing time reached 88 days, the temperature of the fine sand layer with a depth of 3 m dropped to below −12 °C, while the temperature of the medium sand layer with a depth of 11 m decreased to below −6 °C. This indicates that the arrangement of the freezing pipes was effective and that it produced a satisfactory freezing outcome. The temperature was lowest when the path passed through the freezing pipe owing to the cooling capacity of the freezing pipe diffusing around it. In this case, the temperature was approximately −25 °C.
When the freezing time was the same, in the main surface one, Zone A had the lowest freezing efficiency, followed by Zone C, while Zone B exhibited the highest freezing efficiency; the order of the freezing efficiency was B > C > A. Zone A was located outside the plugging holes, and since the external soil temperature was high, the heat was continuously transferred to Zone A, causing its freezing efficiency to be lower than that in other areas on the main surface one. Zone C, where the middle-row holes were located, had more densely arranged freezing holes, resulting in better freezing effects. After 88 days of freezing, the temperatures of the fine and medium sand layers decreased to below −12 °C and −6 °C, respectively. Zone B was located between two rows of plugging holes, and the freezing holes were the most densely arranged. Consequently, the freezing efficiency of the soil in Zone B was the highest when the cooling capacities of the two rows of plugging holes were superimposed. After 88 days of freezing, the temperature in both the soil layers dropped to below −24 °C. On the main surface two, the temperature field exhibited a symmetrical distribution. Zones E and G, which were located between the two rows of side-row holes, exhibited the highest freezing efficiency. After 88 days of freezing, the temperature of both the soil layers dropped to below −20 °C. Zone F, which was located in the middle-row hole area, had a lower freezing efficiency than Zones E and G. After 88 days of freezing, the temperatures of the fine and medium sand layers decreased to −12 °C and −6 °C, respectively. The freezing efficiency in Zones D and H, which were located outside the side-row holes, was the lowest. Furthermore, the overall temperature of the fine sand layer was lower than that of the medium sand layer. This is attributed to the lower initial ground temperature of the fine sand layer, and the freezing was more efficient in the fine sand than in the medium sand. As a result, the overall temperature of the fine sand layer was lower than that of the medium sand layer.

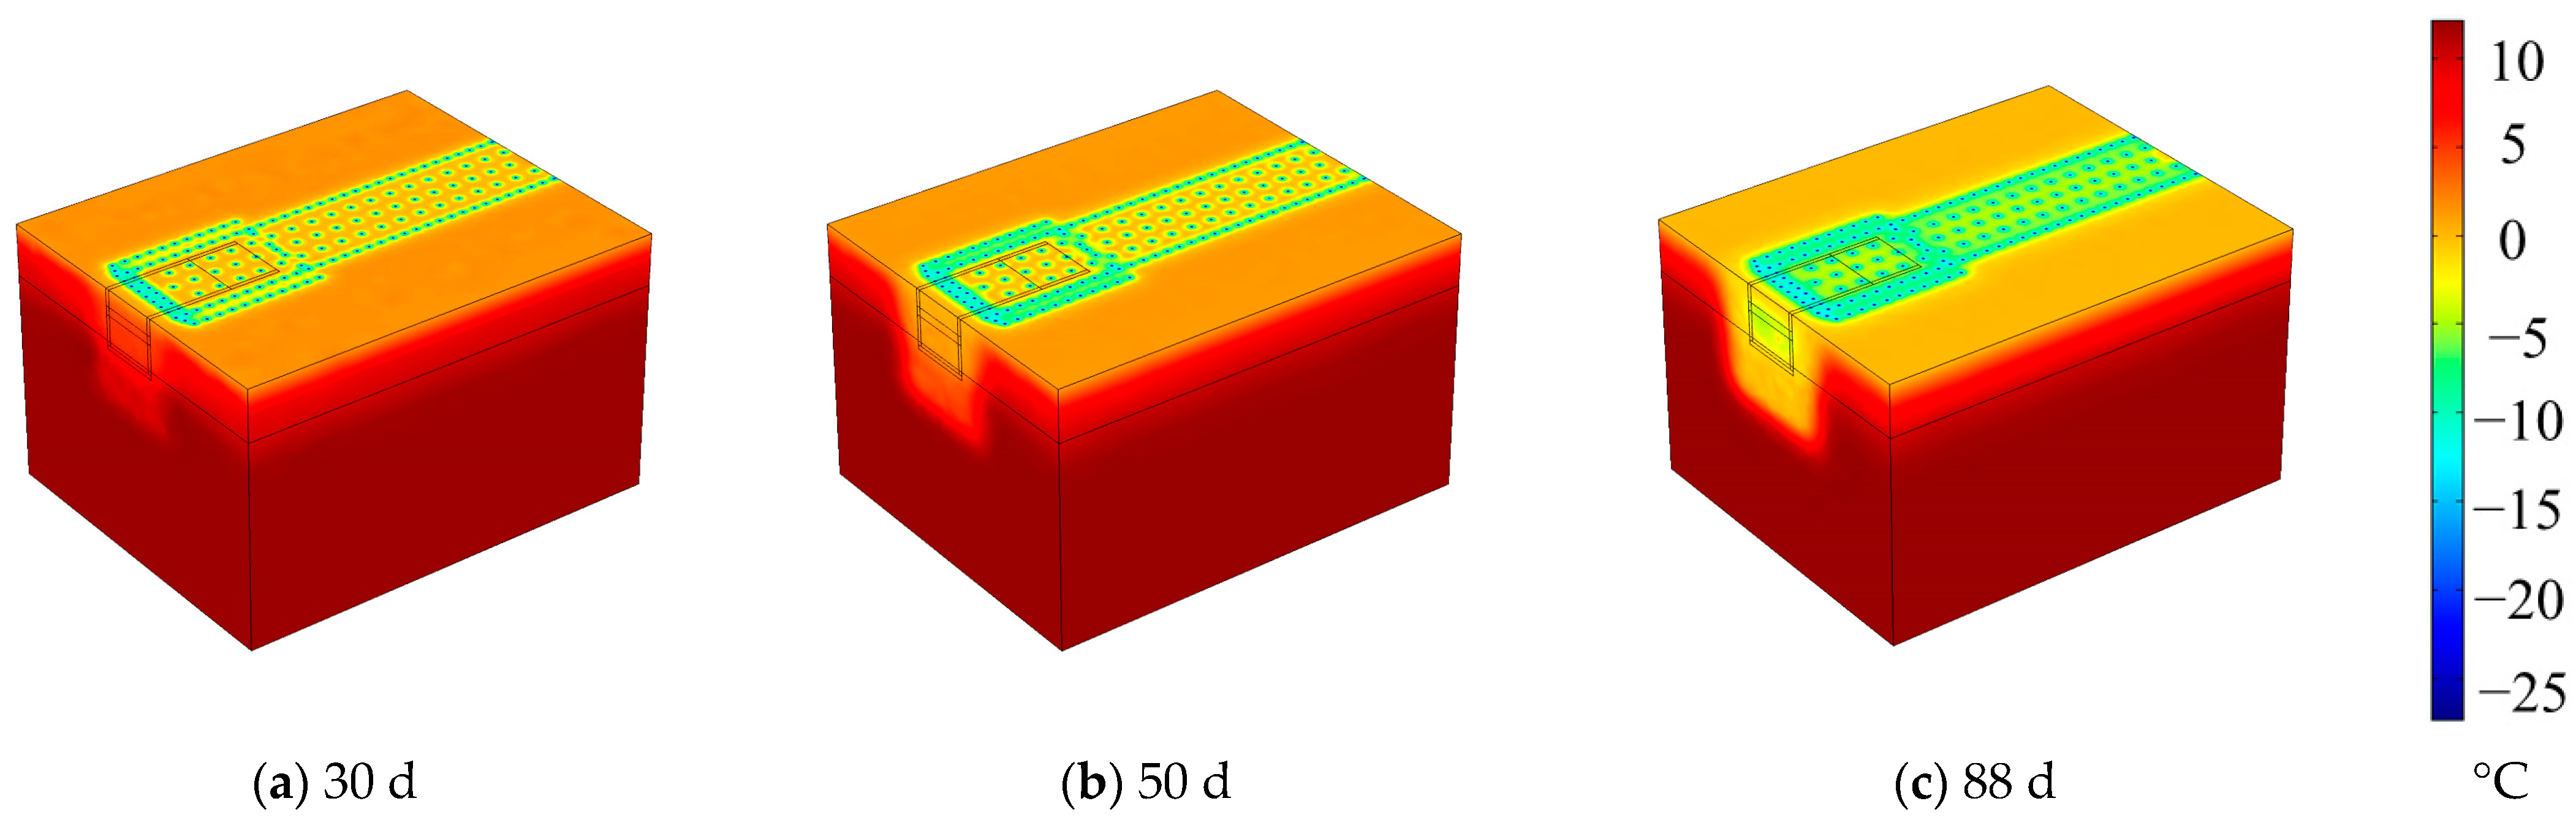
5.3. Evolution Law of the Temperature Field during Excavation Period

5.3.1. Excavation Methods

Based on the on-site excavation plan and with the aim of facilitating numerical modeling, the excavation method for the open excavation section was appropriately simplified. Figure 13 presents the proposed excavation soil for the open excavation section. Using COMSOL Multiphysics software, the proposed excavation area was divided into the open excavation section. The excavation process comprised six steps. In the first step, Zone 1 was excavated with a longitudinal distance ranging from 9.7 to 15.52 m and at a burial depth of 2 m. The second step involved the excavation of Zone 2, which had a longitudinal distance range of 0–9.7 m and a burial depth of 2 m. In the third step, Zone 3 was excavated to a depth of 3 m. The fourth step involved the simultaneous excavation of Zone 4, with a burial depth of 3 m, and Zone 5, with a burial depth of 7 m. The fifth step included the excavation of Zone 6 to a depth of 7 m. In the sixth and final step, Zone 7 was completely excavated. Finally, the entire cross-sectional baseplate was revealed, a thorough cleanup was scheduled, and the construction of the foundation cushion layer for the baseplate was commenced.

5.3.2. Analysis of the Temperature-Field Cloud Diagram during Excavation Period

The freezing design scheme for the main inclined shaft of the Shengfu Mine requires the middle-row freezing pipes and the plugging freezing pipes to be cut off as the excavation progresses. This operation process should be performed in conjunction with excavation and masonry while ensuring that the cutting process is unaffected by saltwater, freeze recovery serves its intended purpose, and smooth excavation progress is maintained. Figure 14 shows the overall distribution and evolution of the 3D freezing temperature field during the excavation period. Using COMSOL Multiphysics software, it can be seen that before the initial excavation, Zone 1 had a low negative temperature state. Once Zone 1 had been excavated, the excavation section was exposed, experiencing a “heat flow erosion” phenomenon, resulting in an increase in the temperature. Moreover, the freezing pipes on the section must be cut off during the excavation, temporarily suspending cooling at the bottom plate. Based on the excavation process and the rise in the temperature at the measuring hole on the bottom plate of the working face, the freezing device must be quickly restored for freezing. This ensures a sealed frozen wall before constructing the inner wall of the shaft and continuous and safe construction of the excavation. In these circumstances, the temperature rise in the excavation section could be limited, and the temperature of the frozen wall remained below −10 °C. Similarly, when other areas were excavated, the temperature in the excavation section increased; nevertheless, with continuous cooling, the temperature remained stable. After completing the sixth excavation step, the well side and bottom plate were fully exposed, and their temperatures could still remain stable. Consequently, the excavation process of the open-excavation section in the construction plan was considered both reasonable and safe.
During the soil excavation process, the frozen wall experienced thermal disturbances, leading to increased temperatures at the excavation border. However, as the frozen pipe rapidly re-established cooling, the frozen wall retained its effective thickness, thus ensuring that the overall average temperature remained stable. Consequently, there was no significant “softening” of the frozen wall during the excavation process. Figure 15 shows that the thickness and temperature of the frozen wall, both before and after the excavation, undergo negligible changes, maintaining an average temperature below −10 °C.

5.3.3. Well Wall Temperature during Excavation Period

Before excavation, the soil temperature remained at low negative levels. After soil removal, the well side was exposed. Due to the effects of “heat flow erosion,” the well-side temperature increased; however, this increase was limited under continuous cooling conditions. Table 3 shows the well-side temperature during the open-excavation steps. The well-side temperature was mostly below −10.5 °C, with no significant fluctuations. The well-side temperature was maintained at a low level throughout the excavation, thus preventing spalling. Consequently, the excavation method and freezing approach used in the open-excavation section were proven to be safe and reasonable.

6. Conclusions

Taking the frozen open-excavation section of the main inclined shaft of Shengfu Mine in Shaanxi Province as the engineering background, this study utilized field-measured data and the finite element software COMSOL Multiphysics to build a 3D numerical calculation model of the freezing temperature field. The spatiotemporal evolution of the temperature field during the construction of the open-excavation section of the frozen inclined shaft was evaluated. The main conclusions drawn from this study are as follows:
(1)
The field measured data revealed that the initial ground temperature of the fine sand layer was approximately 3.7 °C lower than that of the medium sand layer, resulting in a higher freezing rate for the fine sand layer compared with that of the medium sand layer. Due to the sealing effect of the frozen wall, the fine and medium sand layers at the T1 temperature measurement holes experienced freezing for 13 to 27 days, with phase change platforms appearing sequentially. However, there was no evident phase change platform in the soil at the T3 temperature measurement holes. During the 50-to-60-day freezing period, the overall temperatures of the soil on both sides of the point decreased to approximately −20 °C and −8 °C, respectively. Subsequently, the soil temperature stabilized.
(2)
Under the same freezing time, the average temperature and effective frozen wall thickness, as per the numerical simulation results, showed that freezing was more efficient in the fine sand layer than in the medium sand layer. Both the numerical calculations and field measurements showed that, after 88 days of freezing, the average temperature of the frozen wall for each soil layer was lower than −12 °C. The thickness of the frozen wall could reach over 4 m for the side walls of different layers and over 5 m for the bottom plate. Consequently, it was found to be reasonable and safe to excavate the open-excavation section after 88 days of freezing.
(3)
A partial-step excavation method was employed for the excavation area of the open-excavation section, involving six excavation steps. During soil excavation, the section was exposed, and the freezing pipes were suspended for cooling. The soil experienced “heat flow erosion,” resulting in an increase in the temperature at the well side. However, this temperature rise was limited, and the well-side temperature could still maintain a low negative level with a quick cooling recovery from the freezing pipes. This prevented spalling at the well side, and the effective thickness of the frozen wall did not decrease. The average temperature of the frozen wall remained below −10 °C. Consequently, there was no extensive “softening” of the frozen wall during the excavation process, ensuring construction safety.

Author Contributions

Methodology, C.R.; Software, W.L.; Investigation, S.Y.; Writing—original draft, J.Z.; Writing—review & editing, B.W. All authors have read and agreed to the published version of the manuscript.

Funding

This work was supported by the Anhui Province Postdoctoral Fund Project (2022B635), China Postdoctoral Fund General Project (2021M703621), Anhui Province Natural Science Fund Project (2108085QE251), Anhui University Natural Science Research Key Project (KJ2021A0425), Mine Underground Engineering Ministry of Education Engineering Research Center Open Fund Project (JYBGCZX2022103), Anhui Province Science, Technology Major Project Funding Project (202003C08020007) and College student innovation and entrepreneurship program (S202210361048).

Institutional Review Board Statement

Not applicable.

Informed Consent Statement

Not applicable.

Data Availability Statement

Not applicable.

Conflicts of Interest

The authors declare that they have no known competing financial interest or personal relationships that could have appeared to influence the work reported in this paper.

References

  1. Pimentel, E.; Papakonstantinou, S.; Anagnostou, G. Numerical interpretation of temperature distributions from three ground freezing applications in urban tunnelling. Tunn. Undergr. Space Technol. 2012, 28, 57–69. [Google Scholar] [CrossRef]
  2. Kang, Y.; Hou, C.; Li, K.; Liu, B.; Sang, H. Evolution of temperature field and frozen wall in sandy cobble stratum using LN2 freezing method. Appl. Therm. Eng. 2021, 185, 116334. [Google Scholar] [CrossRef]
  3. Yuan, Y.; Liu, Z.H.; Zhu, C.; Yuan, C.F.; Wang, S.Z. The effect of burnt rock on inclined shaft in shallow coal seam and its control technology. Energy Sci. Eng. 2019, 7, 1882–1895. [Google Scholar] [CrossRef]
  4. Hu, X.; Hong, Z.; Fang, T. Analytical solution to steady-state temperature field with typical freezing tube layout employed in freeze-sealing pipe roof method. Tunn. Undergr. Space Technol. 2018, 79, 336–345. [Google Scholar] [CrossRef]
  5. Wang, B.; Rong, C.; Cheng, H.; Cai, H. Experimental investigation on heat transfer law of multiple freezing pipes in permeable stratum with high seepage velocity. Int. J. Heat Mass Transf. 2022, 182, 121868. [Google Scholar] [CrossRef]
  6. Zhelnin, M.; Kostina, A.; Prokhorov, A.; Plekhov, O.; Semin, M.; Levin, L. Coupled thermo-hydro-mechanical modeling of frost heave and water migration during artificial freezing of soils for mineshaft sinking. J. Rock Mech. Geotech. Eng. 2022, 14, 537–559. [Google Scholar] [CrossRef]
  7. Ma, Q.; Huang, K.; Ma, D. Energy absorption characteristics and theoretical analysis of frozen clay with pre-existing cracks under uniaxial compressive impact load. Cold Reg. Sci. Technol. 2021, 182, 103206. [Google Scholar] [CrossRef]
  8. Wang, Q.; Yang, W.; Wang, Y. Study on concrete strain of inclined shaft lining in deep alluvium during freezing sinking period. J. Min. Saf. Eng. 2016, 33, 655. [Google Scholar]
  9. Yang, R.; Wang, Q.; Yang, L. Closed-form elastic solution for irregular frozen wall of inclined shaft considering the interaction with ground. Int. J. Rock Mech. Min. Sci. 2017, 100, 62–72. [Google Scholar] [CrossRef]
  10. Chen, Z.-y.; Zhang, Y.; Lu, L. Simulation Experiment Study on Freezing Temperature Field of Mine Axial Freeing Inclined Shaft. Coal Sci. Technol. 2013, 41, 46–49. [Google Scholar]
  11. Zhou, T.; Zhou, G. Calculation method of frozen soil wall thickness for inclined shaft in consideration of the shaft inclination. J. China Univ. Min. Technol. 2016, 45, 514–520. [Google Scholar]
  12. Yang, R.; Wang, Q. Method of numerical simulations for inclined shaft freezing sinking. Sci. Technol. Rev. 2015, 33, 38–43. [Google Scholar]
  13. Yong, W.; Weihao, Y. Study on mechanical law of freezing inclined shaft lining intopsoil during frozen wall thawing. Coal Sci. Technol. 2016, 44, 133–139. [Google Scholar]
  14. Sun, J.; Ren, J. Physical Simulation Test on Temperature Field Distribution of Artificial Vertical Straight Multirow Freezing Inclined Shaft. Geofluids 2021, 2021, 5574713. [Google Scholar] [CrossRef]
  15. Sun, J.; Chen, X.; Qiu, M.; Cao, X.; Chen, S. Physical Model Test of Artificial Freezing-Inclined Shaft. Adv. Civ. Eng. 2021, 2021, 6640722. [Google Scholar] [CrossRef]
  16. Chen, J.; Zhang, X.; Wang, Q.; Zhao, K. Temperature fields in inclined shaft artificial freezing model tests of two freezing modes. Coal Eng. 2022, 54, 105–110. [Google Scholar]
  17. Zhang, C.; Zhang, Y.; Yang, W.; Li, H.; Lu, Q. Study on Temperature Field Evolution and Frozen Wall Closure Judgment Criteria of Inclined Shaft under Inclined Holes Freezing Condition. Geofluids 2022, 2022, 8002667. [Google Scholar] [CrossRef]
  18. Hu, X.-d.; Han, L.; Han, Y.-g. Analytical solution to temperature distribution of frozen soil wall by multi-row-piped freezing with the boundary separation method. Appl. Therm. Eng. 2019, 149, 702–711. [Google Scholar] [CrossRef]
  19. Lai, Y.; Liu, S.; Wu, Z.; Yu, W. Approximate analytical solution for temperature fields in cold regions circular tunnels. Cold Reg. Sci. Technol. 2002, 34, 43–49. [Google Scholar] [CrossRef]
  20. Vitel, M.; Rouabhi, A.; Tijani, M.; Guérin, F. Thermo-hydraulic modeling of artificial ground freezing: Application to an underground mine in fractured sandstone. Comput. Geotech. 2016, 75, 80–92. [Google Scholar] [CrossRef]
  21. Cai, H.; Xu, L.; Yang, Y.; Li, L. Analytical solution and numerical simulation of the liquid nitrogen freezing-temperature field of a single pipe. AIP Adv. 2018, 8, 055119. [Google Scholar] [CrossRef]
  22. Chen, Z.; Guo, X.; Shao, L.; Li, S.; Gao, L. Sensitivity analysis of thermal factors affecting the nonlinear freezing process of soil. Soils Found. 2021, 61, 886–900. [Google Scholar] [CrossRef]
  23. Liang, X.; Ye, F.; Feng, H.; Han, X.; Wang, S.; Zhang, B.; Gu, B. Temperature field spatio-temporal law and frozen-depth calculation of a tunnel in a seasonally frozen region. Cold Reg. Sci. Technol. 2022, 198, 103539. [Google Scholar] [CrossRef]
  24. Zhang, C.; Li, D.; Chen, J.; Chen, G.; Yuan, C.; Wang, Z.; Ding, G.; Chen, X.; Xia, M.; Wang, S.; et al. Research on the Temperature Field and Frost Heaving Law of Massive Freezing Engineering in Coastal Strata. Adv. Mater. Sci. Eng. 2021, 2021, 5575940. [Google Scholar] [CrossRef]
  25. Fu, Y.; Hu, J.; Wu, Y. Finite element study on temperature field of subway connection aisle construction via artificial ground freezing method. Cold Reg. Sci. Technol. 2021, 189, 103327. [Google Scholar] [CrossRef]
  26. Zhang, H.; Zhang, J.; Zhang, Z.; Zhang, M.; Cao, W. Variation behavior of pore-water pressure in warm frozen soil under load and its relation to deformation. Acta Geotech. 2020, 15, 603–614. [Google Scholar] [CrossRef]
  27. Long, W.; Rong, C.; Shi, H.; Huang, S.; Wang, Z.; Duan, Y.; Ma, H. Temperature Field and Stability Analysis of the Frozen Wall Based on the Actual Position of Freezing Holes. Appl. Sci. 2022, 12, 8943. [Google Scholar] [CrossRef]
  28. Fan, W.; Yang, P. Ground temperature characteristics during artificial freezing around a subway cross passage. Transp. Geotech. 2019, 20, 100250. [Google Scholar] [CrossRef]
Figure 1. Inclined shaft freezing schematic diagram. (a) Inclined shaft freezing pipe layout. (b) Inclined shaft freezing profile.
Applsci 13 08874 g001
Figure 2. Layout of freezing holes and main plane pathways.
Applsci 13 08874 g002
Figure 3. Three-dimensional finite element calculation model. (a) Finite element calculation model. (b) Model grid division. (c) Arrangement of the soil and freezing pipes to be excavated.
Applsci 13 08874 g003
Figure 4. Measured brine temperature change diagram.
Applsci 13 08874 g004
Figure 5. Measured thermal changes at the measurement holes. (a) Three-dimensional diagram of the temperature at T1. (b) Three-dimensional diagram of the thermal change at T3.
Applsci 13 08874 g005
Figure 6. Comparison of the measured results with the numerical results. (a) T1 burial depth: 3 m. (b) T3 burial depth: 3 m. (c) T1 burial depth: 11 m. (d) T3 burial depth: 11 m.
Applsci 13 08874 g006
Figure 7. Overall distribution and development clouds of the 3D temperature field before excavation.
Applsci 13 08874 g007
Figure 8. Temperature-field cloud diagrams of the open-excavation section before excavation taken at the cross section along different burial depths.
Applsci 13 08874 g008
Figure 9. Overall shape and distribution of the frozen wall after 88 days of freezing.
Applsci 13 08874 g009
Figure 10. Relationship between the average temperature and the effective thickness of the frozen wall with time. (a) Relationship between the average temperature of the frozen wall and the freezing time. (b) Relationship between side-wall thickness of the effective frozen wall and the freezing time.
Applsci 13 08874 g010
Figure 11. Temporal and spatial variations in the temperature at a burial depth of 3 m (fine sand layer). (a) Main surface one. (b) Main surface two.
Applsci 13 08874 g011
Figure 12. Temporal and spatial variations in the temperature at a burial depth of 11 m (medium sand layer). (a) Main surface 1. (b) Main surface 2.
Applsci 13 08874 g012
Figure 13. Open-excavation section to be excavated soil.
Applsci 13 08874 g013
Figure 14. Overall distributions and development cloud maps of the 3D freezing temperature field during the excavation period.
Applsci 13 08874 g014aApplsci 13 08874 g014b
Figure 15. Temperature-field nephograms at the transverse and axial sections before and after excavation.
Applsci 13 08874 g015
Table 1. Specific parameters of the freezing pipe.
Types of Freezing HolesDepth/mDiameter of Frozen Pipes/mmNumber of Holes
Plugging holes12.5–15.5Ф14022
Middle-row holes12.5–15.5Ф108/Ф14016
Side-row holes12.5–15.5Ф14046
Table 2. Thermal physical parameters of soil.
Soil PropertiesDepth of Embedment/mSpecific Heat Capacity of Unfrozen Soil/
(J·g−1·K−1)
Specific Heat Capacity of Frozen Soil/
(J·g−1·K−1)
Thermal Conductivity of Unfrozen Soil/
(W m−1·K−1)
Coefficient of Thermal Conductivity of Frozen Soil/
(W m−1·K−1)
Fine sand0–4.751.3041.2411.3351.624
medium sand4.75–25.911.4241.1811.3051.854
Table 3. Well wall temperature during the excavation of open-excavation steps.
Excavation StepsTemperatures on the Well Side along Different Directions/°C
East RoofEast Waist LineEast FloorSouth RoofSouth Waist LineSouth FloorNorth RoofNorth Waist LineNorth Floor
Step 1 (88 d)−11.7−12.5−16.0−14.4−14.9−15.5−10.5−14.4−15.1
Step 2 (89 d) −12.1 −14.1 −14.2
Step 3 (93 d) −12.4 −13.2 −14.3
Step 4 (94 d) −12.0 −13.1 −13.1
Step 5 (96 d) −11.5 −13.0 −12.0
Step 6 (98 d) −11.1−12.0 −12.8−11.5 −11.7−10.6
Disclaimer/Publisher’s Note: The statements, opinions and data contained in all publications are solely those of the individual author(s) and contributor(s) and not of MDPI and/or the editor(s). MDPI and/or the editor(s) disclaim responsibility for any injury to people or property resulting from any ideas, methods, instructions or products referred to in the content.

