2.1. Performance of the Air-Source Heat Pump System
The performance of an air-source heat pump system can be represented by its COP. The COP can be used as a criterion to judge the thermal efficiency of an air-source heat pump system, which is the ratio of the cooling capacity of a heat pump to its power consumption, as shown in Equation (1) [
29].
where
is the coefficient of performance,
is the cooling capacity in kW,
is the power consumption in kW.
Measurements of the COP of an air-source heat pump system require measurements of the cooling capacity and power consumption. The cooling capacity refers to the amount of heat absorbed by the refrigerant from the room-side air in the evaporator of an air-source heat pump system during cooling operation. A low COP means a higher power consumption for the same cooling capacity and a lower cooling capacity for the same power consumption. Another way to calculate the COP is to use the refrigeration cycle. Using a refrigeration cycle on a pressure-enthalpy diagram, the inlet, and outlet refrigerant enthalpies of the evaporator and condenser can be obtained. Equation (2) shows the COP calculation method using the pressure-enthalpy diagram.
where
is the evaporator outlet refrigerant enthalpy in kJ/kg,
is the condenser inlet refrigerant enthalpy in kJ/kg, and
is the evaporator inlet refrigerant enthalpy in kJ/kg.
The refrigeration cycle provides information on the refrigerant pressure and enthalpy during the compression, condensation, expansion, and evaporation of an air-source heat pump system.
Figure 1 illustrates the concept of the refrigeration cycle of an air-source heat pump system on a pressure-enthalpy diagram. Points 1, 2, 3, and 4 in
Figure 1 are the evaporator outlet refrigerant point, condenser inlet refrigerant point, condenser outlet refrigerant point, and evaporator inlet refrigerant point, respectively. They represent the main points of the refrigeration cycle. The lines connecting each point represent the compression, condensation, expansion, and evaporation processes. The characteristics of each process in the refrigeration cycle are as follows.
The ideal compression process is an isentropic process that draws refrigerant vapor evaporated from an evaporator into a compressor as superheated vapor and compresses it to facilitate liquefaction at high temperatures. The enthalpy change between the inlet and outlet of the compressor is equal to the work of the compressor. In the condensation process, the refrigerant state at the inlet of the condenser is superheated vapor at a high temperature and pressure, which is cooled by the cooling fins to alter its state from gas to liquid and release the latent heat of condensation. The condensation of the refrigerant in the condenser occurs under constant pressure, which is called an isobaric process. On the pressure-enthalpy diagram, the isobaric change is represented by the horizontal line, where the enthalpy difference is equal to the calorific value of the latent heat of condensation released by the condenser. In the expansion process, the refrigerant at high pressure, which has been subcooled through the condenser, is depressurized through throttling action as it passes through the expansion valve and becomes a saturated liquid at a lower temperature. The change in state at the expansion valve is called throttling expansion, an isentropic process. The enthalpy of the refrigerant before and after the expansion valve does not change. Finally, in the evaporation process of the air-source heat pump system, the refrigerant in the saturated liquid state after passing through the expansion valve, absorbs the latent heat of evaporation of indoor air in the evaporator and changes into saturated vapor and then into superheated vapor. The evaporation of the refrigerant in the evaporator is an isothermal and isobaric process, and the difference in enthalpy is equal to the calorific value of the latent heat of evaporation absorbed by the evaporator [
30].
2.2. Refrigeration Cycle Measurement Method
There are two methods to calculate the COP: by measuring the cooling capacity and power consumption and using Equation (1), and by measuring the pressure and enthalpy of the refrigerant and using Equation (2). Both methods require information, such as the refrigerant enthalpy, pressure, and mass flow rate of the operating air-source heat pump system, but there are difficulties in installing pressure gauges and flow meters because they require processes, such as drilling and cutting refrigerant pipes. Therefore, this study proposed a method for measuring the refrigeration cycle of an air-source heat pump system using data that are easy to measure from the indoor side without using data that are difficult to measure, such as refrigerant enthalpy, pressure, mass flow rate, and power consumption. The proposed refrigeration cycle measurement method of the air-source heat pump system considers the characteristics of heat exchange between refrigerant and air during evaporation and condensation under an isobaric process, and takes the characteristics of the refrigerant changing under isentropic and isenthalpic processed into account during compression and expansion.
Figure 2 presents the conceptual diagram of developing the air-source heat pump system refrigeration cycle measurement method based on in situ data.
The refrigerant in the evaporator and condenser of an air-source heat pump system evaporates and condenses under isobaric pressure. The refrigerant passing through the compressor and expansion valve compresses and expands in an isentropic process and an isenthalpic process, respectively. During cooling operation of an air-source heat pump system, the refrigerant in the evaporator absorbs heat from the indoor air, and the refrigerant in the condenser releases the absorbed heat to the outdoor air. Heat exchange between the refrigerant and air occurs in the evaporator and condenser. When no heat loss occurs during the heat exchange of refrigerant and air, according to the first law of thermodynamics, the heat change in the refrigerant and air in the evaporator and condenser can be expressed as Equation (3). At this time, the amount of heat can be calculated using the mass flow rate, specific heat, temperature, and enthalpy change in the fluid, which can be expressed as Equation (4). In the condenser of an air-source heat pump system, only sensible heat exchange occurs when air absorbs heat from the refrigerant. In the evaporator, on the other hand, the refrigerant absorbs heat from the air. In this case, the heat in the air is absorbed as both sensible and latent heat. Therefore, when calculating the heat content of an air-source heat pump system, only sensible heat exchange is considered in the condenser and both sensible and latent heat exchange are considered in the evaporator.
where
is the heat transfer rate of the refrigerate in kW,
is the heat transfer rate of air in kW,
is the mass flow rate of air in kg/s,
is the temperature of the fluid entering the control volume in °C,
is the temperature of the fluid leaving the control volume in °C,
is the enthalpy of the fluid entering the control volume in kJ/kg,
is the enthalpy of the fluid leaving the control volume in kJ/kg.
The enthalpy of the air entering and leaving the evaporator is needed to calculate the heat content of the evaporator, where both sensible and latent heat exchange occurs. The enthalpy of the wet air can be calculated using Equation (5). The temperature and absolute humidity of the air are required to calculate the enthalpy.
where
is the enthalpy of moist air in kJ/kg,
is the specific heat of dry air at constant pressure in kJ/kg
a∙°C,
is the temperature in °C,
is the humidity ratio in kg
w/kg
a,
is the enthalpy of saturated water vapor at 0 °C in kJ/kg, and
is the specific heat of water vapor at constant pressure in kJ/kg
w∙°C.
The absolute humidity was calculated using the relative humidity, which is easy to measure, and the enthalpy of wet air was calculated. Equation (6) can be used to calculate the saturated vapor pressure as a function of temperature. Equation (7) can be used to calculate absolute humidity from the relative humidity.
where
is the pressure of saturation vapor in kPa,
is the relative humidity in %,
is the standard atmospheric pressure in kPa.
The mass flow rate of air is required to calculate the air calorific value of the evaporator and condenser. The airflow rate can be calculated using Equation (8), which can be obtained by measuring the air velocity or airflow rate.
where
is the airflow rate in m
3/s,
is the specific weight of air in kg/m
3.
The enthalpy change in the refrigerant in and out of the evaporator and condenser is required to measure the refrigeration cycle of an air-source heat pump system. The refrigeration cycle can be determined without measuring the existing enthalpy of refrigerant input and output by calculating the enthalpy change in air input and output of the evaporator and condenser. Using the discharge air volume and air enthalpy of the evaporator and condenser, the enthalpy change in the refrigerant input and output of the evaporator and condenser can be expressed, as shown in Equation (9).
where
is the enthalpy change in refrigerant in kJ/kg,
is the enthalpy change in air in kJ/kg,
is the mass flow rate of refrigerant in kg/s.
The refrigerant in the evaporator and condenser of an air-source heat pump system evaporates and condenses in an isobaric process, and the refrigerant flowing through the compressor and expansion valve compresses and expands in an isentropic process and an isenthalpic process, respectively. The refrigeration cycle measurement method using these characteristics can be categorized into five steps, as shown in
Figure 3.
Step1. Check the refrigerant used by the air source heat pump system. Different refrigerants have different physical properties, resulting in different pressure-enthalpy diagrams. Specifically, it is important to know that the saturated liquid line and saturated vapor line are different for different refrigerants. Generally, air source heat pump systems use R401A refrigerant. In this study, a refrigeration cycle measurement method was developed and evaluated based on an air-source heat pump system using R410A refrigerant.
Step 2. Show the evaporation process on a pressure-enthalpy diagram. In an air source heat pump system, the evaporation is an isobaric process. Measure the surface temperature of the refrigerant pipe on the evaporator side and mark the evaporator discharge refrigerant point (point 1) that is above the saturated vapor line. Calculate the enthalpy change in the evaporator-side refrigerant using Equation (9) using the measurement data on the air side of the evaporator. The point of evaporator suction refrigerant (point 4) is found by subtracting the calculated enthalpy change from the enthalpy at point 1. The evaporation process of an air source heat pump system can be shown on a pressure-enthalpy diagram by connecting points 4 and 1.
Step 3. Show the isenthalpy and isentropy lines on the pressure-enthalpy diagram. The point 4 found in Step 2 is the suction point of the evaporator and the discharge point of the expansion valve. The expansion process of the air source heat pump system is an isenthalpy process, so the isenthalpy line is taken through point 4. The point 1 is the discharge point of the evaporator and the suction point of the compressor. The compression process of the air source heat pump system is an isentropic process, so the isentropy line is taken through point 1.
Step 4. Show the condensation process on a pressure-enthalpy diagram. The condensation process in an air source heat pump system is isobaric, the same as the evaporation process. The discharge point of the condenser is the same as the suction point of the expansion valve, and the suction point of the condenser is the same as the discharge point of the compressor. Therefore, the condensation process must cross both the isenthalpy line and the isentropy line in Step 3. In addition, it must be parallel to the evaporation process. Calculate the enthalpy change in the condenser side refrigerant using Equation (9) using the measurement data on the air side of the condenser. Show the discharge point (point 3) and suction point (point 2) of the condenser where the calculated enthalpy change fulfills the above conditions. The condensation process of the air source heat pump system can be shown on the pressure-enthalpy diagram by connecting points 3 and 2.
Step 5. Show the expansion and compression processes on the pressure-enthalpy diagram. The expansion process of the air source heat pump system can be shown on the pressure-enthalpy diagram by connecting points 3 and 4. Moreover, the compression process of the air source heat pump system can be shown on the pressure-enthalpy diagram by connecting points 1 and 2. Finally, the air-side measurement data can be used to measure the refrigeration cycle of the air source heat pump system.
Figure 3.
Process of the refrigeration cycle measurement method: Step 1 (a), Step 2 (b), Step 3 (c), Step 4 (d), Step 5 (e).
Figure 3.
Process of the refrigeration cycle measurement method: Step 1 (a), Step 2 (b), Step 3 (c), Step 4 (d), Step 5 (e).
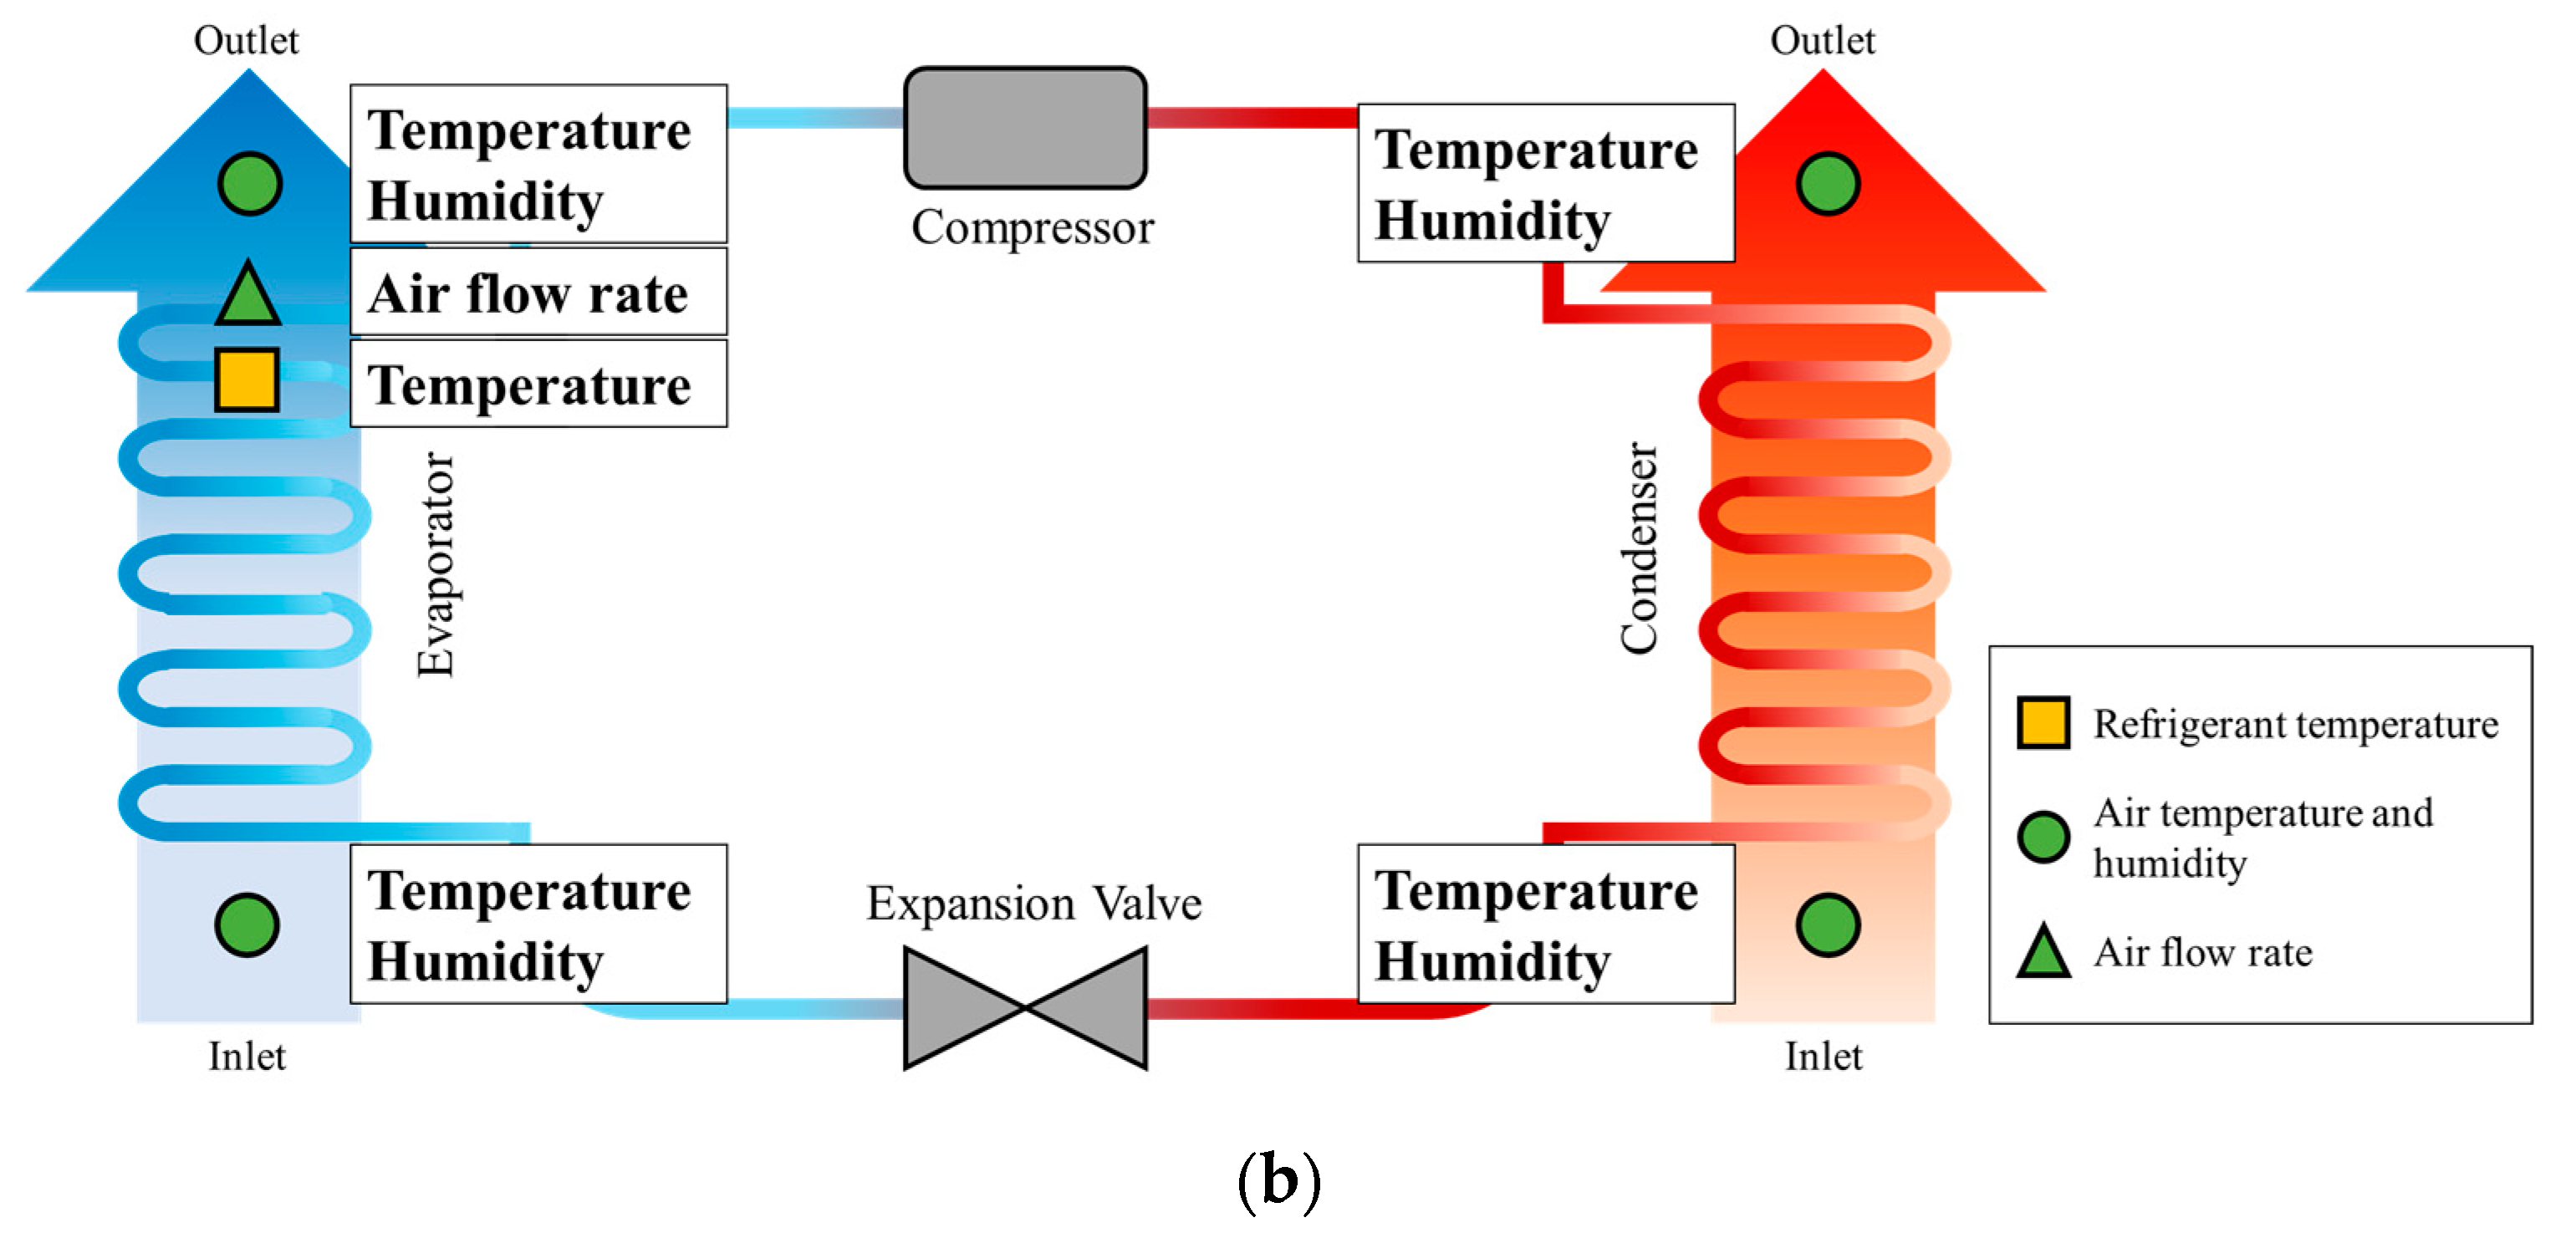
The measurement variables and design data were selected to estimate the air-side enthalpy change in the air-source heat pump system. For the refrigeration cycle measurement method, air-side measured data, evaporator air intake temperature and humidity, discharge temperature and humidity, discharge airflow rate, refrigerant temperature, and condenser-side air intake temperature and discharge temperature were selected as measured variables. Generally, the condenser-side airflow in air-source heat pump systems is controlled at constant airflow, so design data were used rather than measurements. A refrigeration cycle measurement method using design data was developed for the refrigerant flow rate required to calculate the enthalpy change on the refrigerant side.
Table 1 lists the input and measurement variables of the measurement method, and
Figure 4 shows a conceptual diagram of the measurement points of the input and measurement variables. The inlet and outlet air temperature, humidity, and airflow were measured with twenty-five node, T-type thermocouple grids and thermopile. Evaporator refrigerant temperature was collected by measuring the refrigerant surface temperature.
The difference between the measurement method for air-source heat pump systems proposed in this study and existing methods is the input and measurement variables. The existing method measures the refrigeration cycle by measuring the pressure and enthalpy of the refrigerant. If it is difficult to measure the enthalpy of a refrigerant, the enthalpy can be estimated by measuring the temperature and pressure of the refrigerant. The proposed measurement method uses the temperature and humidity of the inlet and outlet air of the evaporator and condenser, the supply airflow rate, and the evaporator refrigerant temperature, as the measurement variables. The evaporator refrigerant temperature is measured by the surface temperature of the refrigerant pipe of the evaporator.
Figure 5 presents a schematic diagram of the difference between the existing and proposed methods.
The proposed refrigeration cycle measurement method was used to predict the COP and power consumption, which are the key operating data of the air-source heat pump system. The power consumption predicted by the refrigeration cycle method is the enthalpy change in the evaporator and condenser and can be expressed as Equation (10). The COP predicted using the refrigeration cycle is the enthalpy change in the evaporator and condenser, expressed as Equation (11).
where
is the enthalpy change in air in a condenser in kJ/kg,
is the enthalpy change in air in an evaporator in kJ/kg.
2.3. Accuracy Analysis
The proposed refrigeration cycle measurement method was evaluated by measuring the difference between pressure and enthalpy according to the measured data. In addition, the reliability of the proposed refrigeration cycle measurement method was checked by comparing the difference between the two points and the maximum error range of the pressure and enthalpy measured values. The pressure of the refrigeration cycle in the pressure-enthalpy diagram was approximately 0 to 4 MPa, and the enthalpy was approximately 150 to 450 kJ/kg. Preprocessing was performed to evaluate the comparative analysis of pressure and enthalpy between the two points. The data were preprocessed using normalization. Normalization converts the data intervals into a range of 0 to 1, so the variables in different ranges have the same importance. The formula for data normalization is shown in Equation (12).
where
is the normalized values,
is the measurement values,
is the minimum of measurement values,
is the maximum of measurement values.
The statistics, data mining, and machine learning commonly use distance functions to quantify the similarity between data. The most common distance function is the Euclidean distance function. The closer the value of the distance function is to zero, the more similar the data used in the analysis are to each other, and it can be defined as Equation (13).
where
is the distance between two points
and
,
is the enthalpy of refrigeration cycle in kJ/kg, and
is the pressure of refrigeration cycle in Pa.
The evaluation was performed using the Mean Bias Error (
MBE) and the Coefficient of variation of root-mean-square error (
Cv(RMSE)) proposed by ASHRAE Guideline 14.
MBE and
Cv(RMSE) can be calculated using Equations (14)–(16) [
31].
where
is the predicted values,
is the measurement values,
is the number of data,
is the average of measurements.
Standard uncertainty and synthetic standard uncertainty analyses were performed to verify the reliability of the experimental data and computational results. When a measurement result is obtained from several different inputs, the standard uncertainty of this measurement result is called the synthetic standard uncertainty, and the synthesis is obtained using the law of propagation of uncertainty Equation (17) [
32].
where
is the combined standard uncertainty,
is the function,
is the measured temperature,
is the: measured relative humidity,
is the measured airflow rate,
is the Uncertainty of the measured temperature,
is the Uncertainty of the measured relative humidity,
is the Uncertainty of the measured airflow rate.


