Article

Validation Analysis of Drought Monitoring Based on FY-4 Satellite

1
School of Software Engineering, Chengdu University of Information Technology, Chengdu 610225, China
2
Sichuan Province Engineering Technology Research Centre of Support Software of Informatization Application, Chengdu 610225, China
3
Operational System Development and Maintenance Division, National Climate Center, Haidian District, Beijing 100081, China
4
China Meteorological Administration Key Open Laboratory of Transforming Climate Resources to Economy, Chongqing Climate Center, Chongqing 401147, China
5
School of Automation, University of Electronic Science and Technology of China, Chengdu 611731, China
*
Author to whom correspondence should be addressed.
Appl. Sci. 2023, 13(16), 9122; https://doi.org/10.3390/app13169122
Submission received: 20 June 2023 / Revised: 22 July 2023 / Accepted: 31 July 2023 / Published: 10 August 2023
(This article belongs to the Special Issue Geospatial AI in Earth Observation, Remote Sensing and GIScience)

Abstract

:
Droughts are natural disasters that have significant implications for agricultural production and human livelihood. Under climate change, the drought process is accelerating, such as the intensification of flash droughts. The efficient and quick monitoring of droughts has increasingly become a crucial measure in responding to extreme drought events. We utilized multi-imagery data from the geostationary meteorological satellite FY-4A within one day; implemented the daily Maximum Value Composite (MVC) method to minimize interference from the clouds, atmosphere, and anomalies; and developed a method for calculating the daily-scale Temperature Vegetation Drought Index (TVDI), which is a dryness index. Three representative drought events (Yunnan Province, Guangdong Province, and the Huanghuai region) from 2021 to 2022 were selected for validation, respectively. We evaluated the spatial and temporal effects of the TVDI with the Soil Relative Humidity Index (SRHI) and the Meteorological Drought Composite Index (MCI). The results show that the TVDI has stronger negative correlations with the MCI and SRHI in moderate and severe drought events. Meanwhile, the TVDI and SRHI exhibited similar trends. The trends of drought areas identified by the TVDI, SRHI, and MCI were consistent, while the drought area identified by the TVDI was slightly higher than the SRHI. Yunnan Province has the most concentrated distribution, which is mostly between 16.93 and 25.22%. The spatial distribution of the TVDI by FY-4A and MODIS is generally consistent, and the differences in severe drought areas may be attributed to disparities in the NDVI. Furthermore, the TVDI based on FY-4A provides a higher number of valid pixels (437 more pixels in the Huanghuai region) than that based on MODIS, yielding better overall drought detection. The spatial distribution of the TVDI between FY-4A and Landsat-8 is also consistent. FY-4A has the advantage of acquiring a complete image on a daily basis, and lower computational cost in regional drought monitoring. The results indicate the effectiveness of the FY-4A TVDI in achieving daily-scale drought monitoring, with a larger number of valid pixels and better spatial consistency with station indices. This study provides a new solution for drought monitoring using a geostationary meteorological satellite from different spatial–temporal perspectives to facilitate comprehensive drought monitoring.

1. Introduction

Droughts are complex and multifaceted natural disasters that can lead to a decline in agricultural productivity [1], land desertification [2,3], and forest degradation [4,5,6]. Compared with other natural disasters, such as floods and earthquakes, droughts have a wider impact, longer duration, and cause more damage [7,8,9]. Therefore, it has become increasingly important to effectively monitor droughts as a means to deal with extreme drought events [10]. Currently, drought monitoring is typically based on ground-based meteorological stations and remote sensing data [11]. Although the data observed by ground-based meteorological stations are relatively more accurate, they have the drawbacks of a high cost, small coverage, and spatially variable distribution [12]. In contrast, remote sensing data have wider coverage, higher spatial resolution, and greater timeliness [13]. So, remote sensing has been applied for drought monitoring on a regional scale [14].
Drought indices play a crucial role in monitoring drought events, and many drought indices have been developed [15,16]. The most common meteorological drought indices are the Standardized Precipitation Index (SPI) [17], the Palmer Drought Severity Index (PDSI) [18], and the Standardized Precipitation Evapotranspiration Index (SPEI) [19], which have been extensively validated in numerous studies [20,21,22]. Remote sensing-based drought indices are usually classified into vegetation indices, such as the Normalized Vegetation Index (NDVI) [23] and the Vegetation Condition Index (VCI) [24]; vegetation temperature indices, such as the Vegetation Temperature Conditional Index (VTCI) [25] and the Temperature Vegetation Drought Index (TVDI) [26]; and soil moisture indices, such as the Soil-adjusted Vegetation Index (SAVI) [27] and the Soil Moisture Monitoring Index (SMMI) [28]. Vegetation drought indices have exhibited a time lag in drought monitoring, but adding surface temperature as a moisture stress factor to construct a drought index model can improve timeliness [29,30]. In particular, the TVDI is a simplified land surface dryness index [31], which was proven to be effective in simulating soil moisture changes and has been widely applied in drought monitoring [32,33].
The drought indices have usually been calculated by MODIS, Landsat 8, and Sentinel-2, etc., and were well validated in studies of different scales [34,35,36]. However, these remote sensing data of earth observation satellites exhibit limitations in terms of revisiting frequency [37,38,39]. The rapid dynamics of meteorological processes, such as flash droughts and heavy rainfall, might be ignored [40]. For example, MODIS generally achieves global coverage in a minimum of one day (but mostly two or more days), but flash droughts that have higher temporal and spatial variability are not fully captured [41]. With the advantages of a wide observation range, high sampling frequency, and high spatial resolution, geostationary meteorological satellites are widely used for monitoring rapid processes such as forest fires, dust storms, and air pollution [42]. Research on drought monitoring using geostationary meteorological satellites is seldom reported. Hu et al. [43] utilized brightness temperature data from Himawari-8 to calculate the Temperature Rise Index (TRI) and demonstrated its efficacy in drought warnings. Humberto et al. [44] used daily rainfall data from weather stations and daily Meteosat Second Generation (MSG) geostationary meteorological satellite NDVI data to examine the growth status of vegetation under drought conditions. Li et al. [45] calculated the Perpendicular Drought Index (PDI) based on FY-4 AGRI and Himawari-8 AHI data and verified the effectiveness of FY-4A in drought monitoring. However, they selected a single image with the smallest cloud cover within one day in this paper, ignoring the high sampling frequency characteristic of FY-4A.
As remote sensing science and technology have progressed and the utilization of remote sensing data has become more prevalent, the acquisition of thematic information on surface parameters from multi-source and multi-temporal remote sensing data has become feasible [46]. The indices calculated via multiple remote sensing sources enable the monitoring of drought events from different perspectives and accomplish the completion of multi-source datasets [47]. The FY-4 series satellite, which is the latest generation of geostationary meteorological satellites in China, enables unprecedented three-dimensional atmospheric monitoring in the geostationary orbit. Minimal research is dedicated to harnessing the potential of FY-4 for drought monitoring purposes [48]. We introduced a novel methodology for computing the daily TVDI using hourly FY-4A satellite data. The daily drought monitoring capabilities of FY-4A TVDI were validated using the Soil Relative Humidity Index (SRHI) and Meteorological Drought Composite Index (MCI). To illustrate the need for geostationary meteorological satellite-based drought monitoring, we compare the FY-4A TVDI with the TVDI by earth observation satellite (Landsat-8 and MODIS). The diversity of satellites enables data acquisition from different spatial–temporal perspectives, facilitating a more comprehensive characterization of drought monitoring.
In conclusion, the method suggested in this study improves the frequency and timeliness of drought monitoring in addition to introducing innovative data sources for multi-source data. It enables early detection and warning of drought for government and agricultural sectors during rapid drought processes. It contributes to safeguarding agricultural production, maintaining water resource supply, and reducing the economic and societal losses caused by drought. Additionally, it provides critical data, information, and scientific support, making significant contributions to manage drought, make decisions, and mitigate disaster, all of which promote sustainable development and social well-being.

2. Materials and Methods

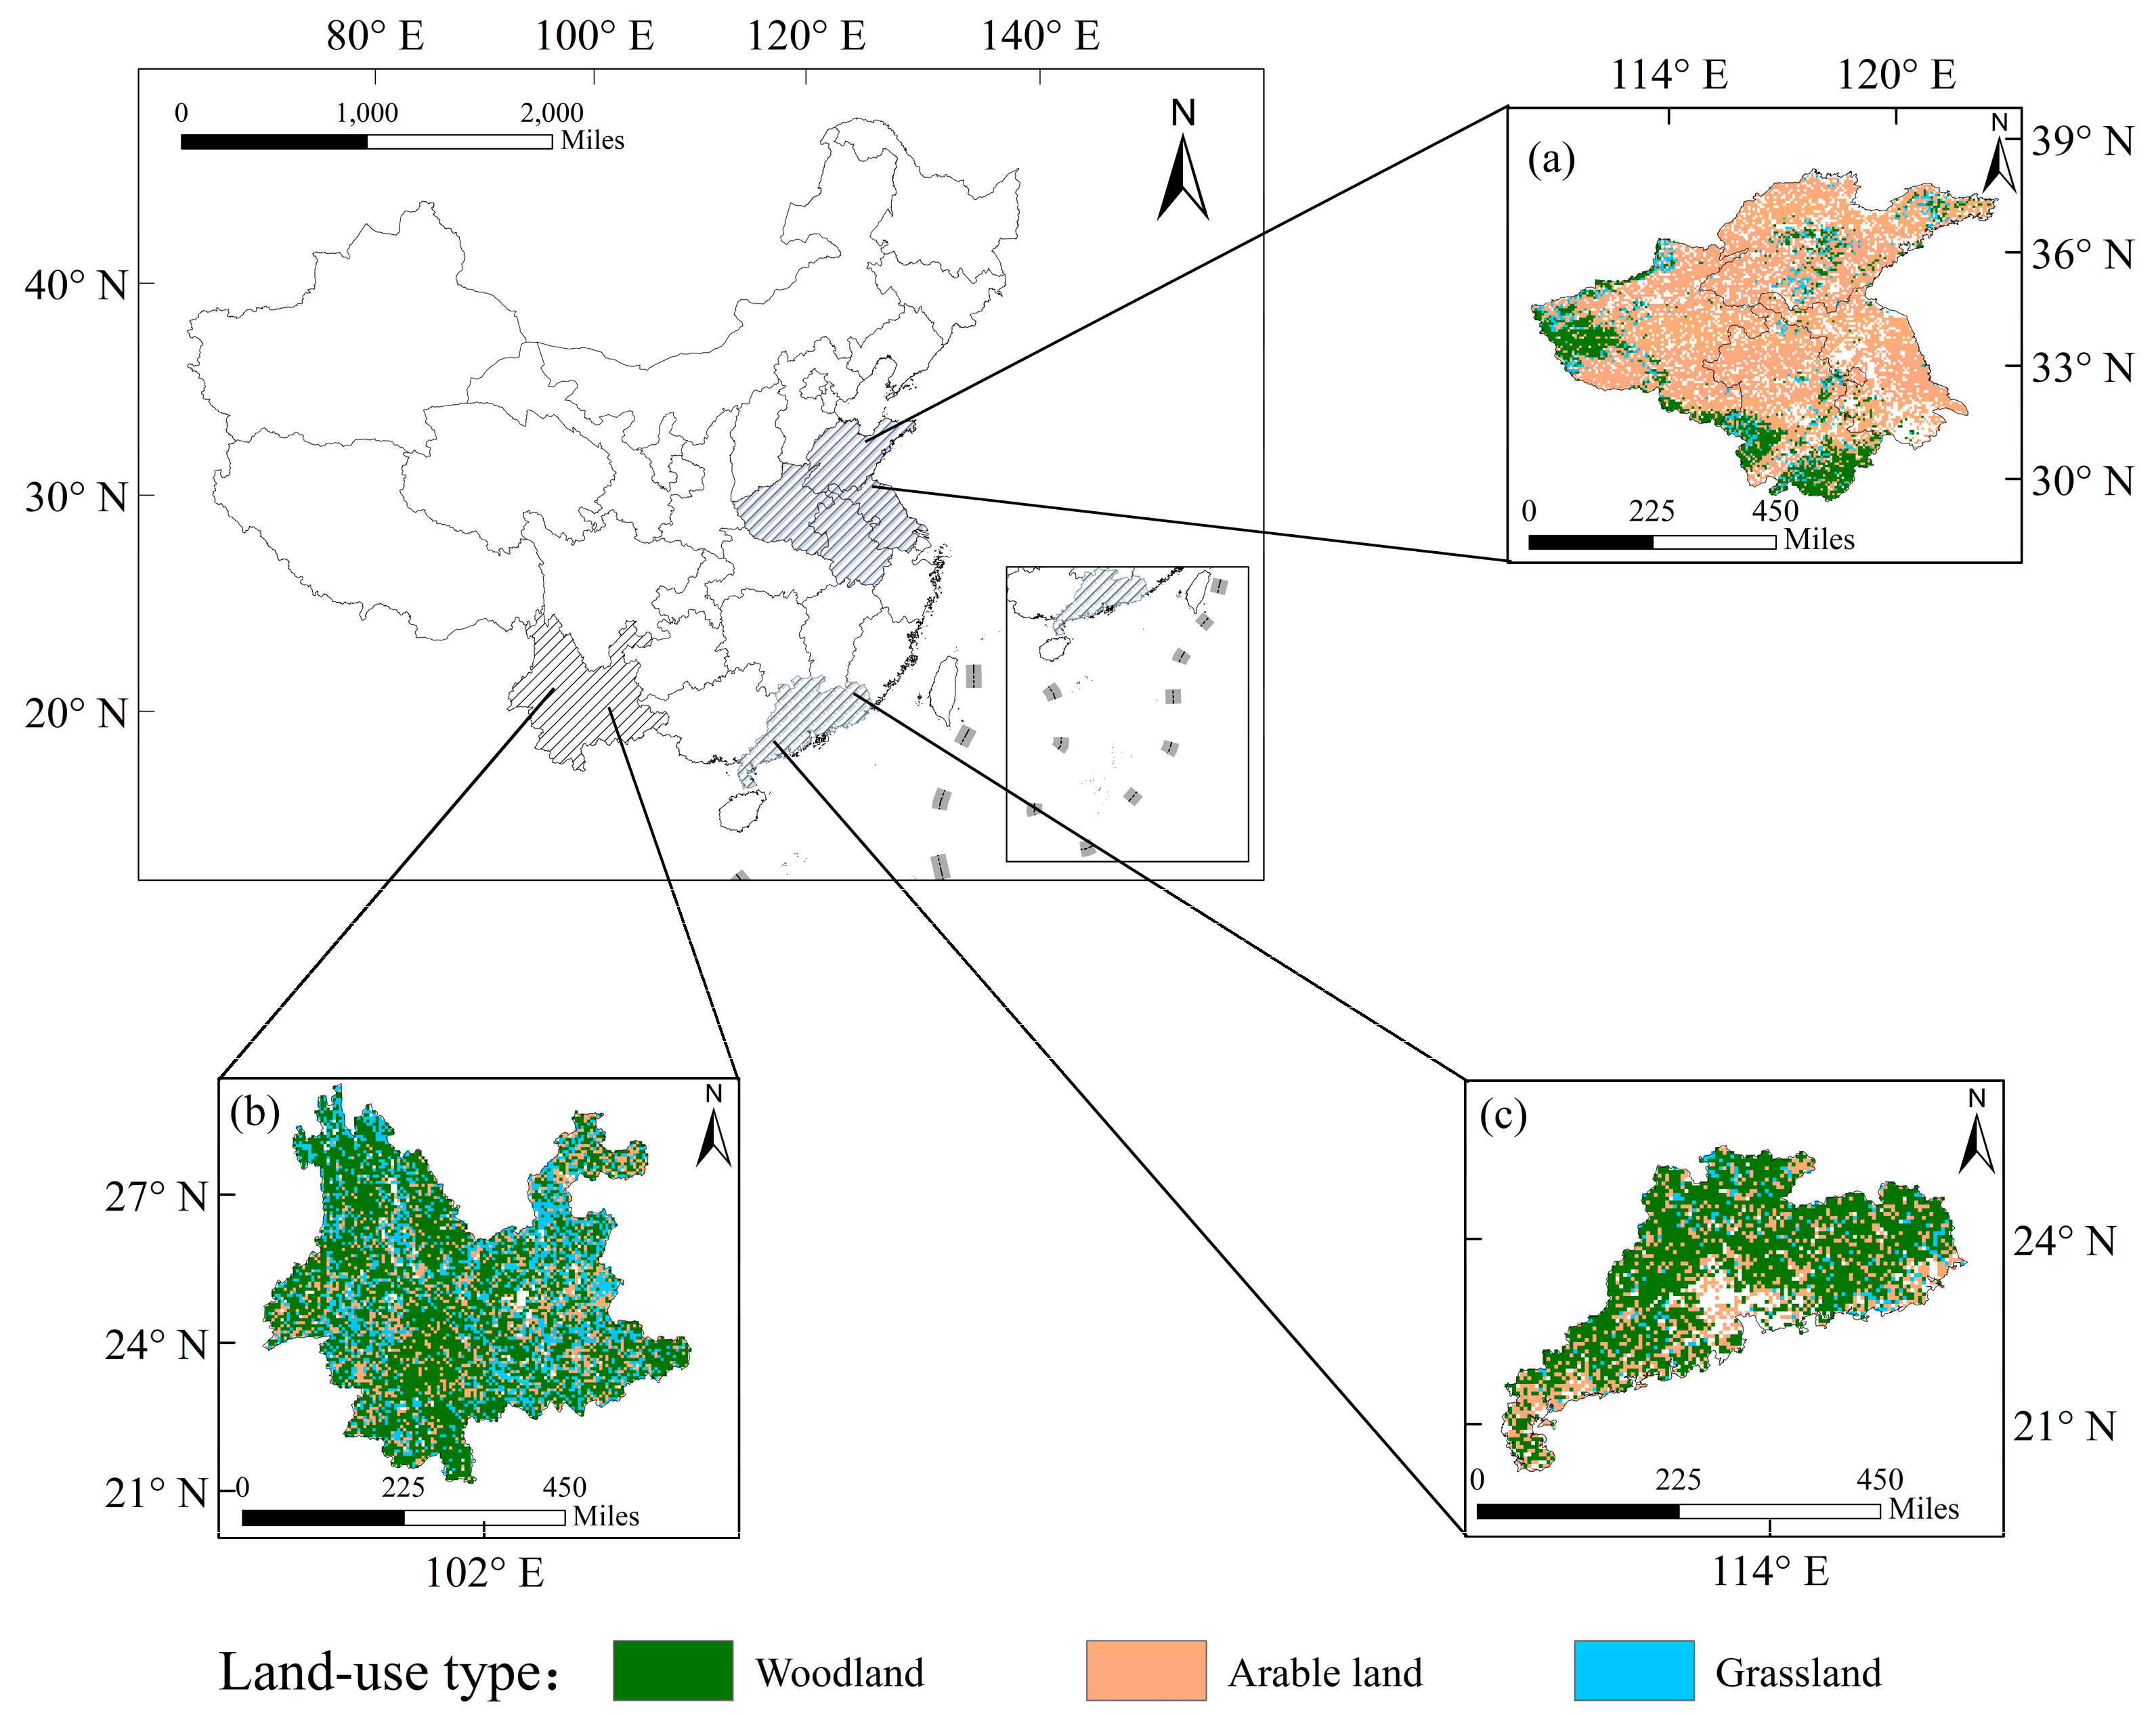
2.1. Typical Drought Events

Focused on the effectiveness of TVDI based on FY-4A for drought monitoring in China, three typical drought events in 2021–2022 were selected for validation. The first drought event was from May to June 2022, located in the Huanghuai region, including Shandong, Henan, Anhui, and Jiangsu Provinces (Figure 1a). The second and third drought events were from January to March 2021, located in Yunnan Province (Figure 1b) and Guangdong Province (Figure 1c). These drought events were across China, in different climatic, topographical, and geographical regions. Yunnan Province is situated in the southwest plateau region, dominated by woodlands and grasslands. The climate includes subtropical and tropical monsoon types and the highland mountainous type. Guangdong Province is located on the southeastern coast, including the mid-subtropical, south-subtropical, and tropical climate types, mainly dominated by woodland. The Huanghuai region belongs to the temperate monsoon region, and the main land use type is arable land.

2.2. Data

FY-4A satellite China region data are provided by the National Meteorological Administration with 4 km spatial resolution and 15 min time interval, including FY-4A AGRI L1-level products, Cloud Detection Products (CLM), and Land Surface Temperature products (LST). FY-4B satellite full-disk products are the same as FY-4A, in 4 km spatial resolution and 15 min time resolution (http://satellite.nsmc.org.cn/portalsite/default.aspx, accessed on 1 July 2022). The data of SRHI (depth 0–10 cm) are provided by the Real-time Product Datasets of the China Meteorological Administration Land Data Assimilation System (CLDAS-V2.0) with a spatial resolution of 0.0625° × 0.0625° (http://data.cma.cn/, accessed on 6 July 2022). The station data of MCI are obtained from the National Meteorological Administration. MODIS data used the 16-day synthetic MOD13A2 Version 6 NDVI products and 8-day synthetic MOD11A2 Version 6 LST products, both at a spatial resolution of 1 km (km) and obtained from the NASA website (https://www.nasa.gov/, accessed on 22 July 2022). The Landsat-8 data were obtained from the Earth Explorer official website, covering the period from 16 to 23 May 2022 with a spatial resolution of 30 m (https://earthexplorer.usgs.gov/, accessed on 15 July 2023).

2.3. Methods

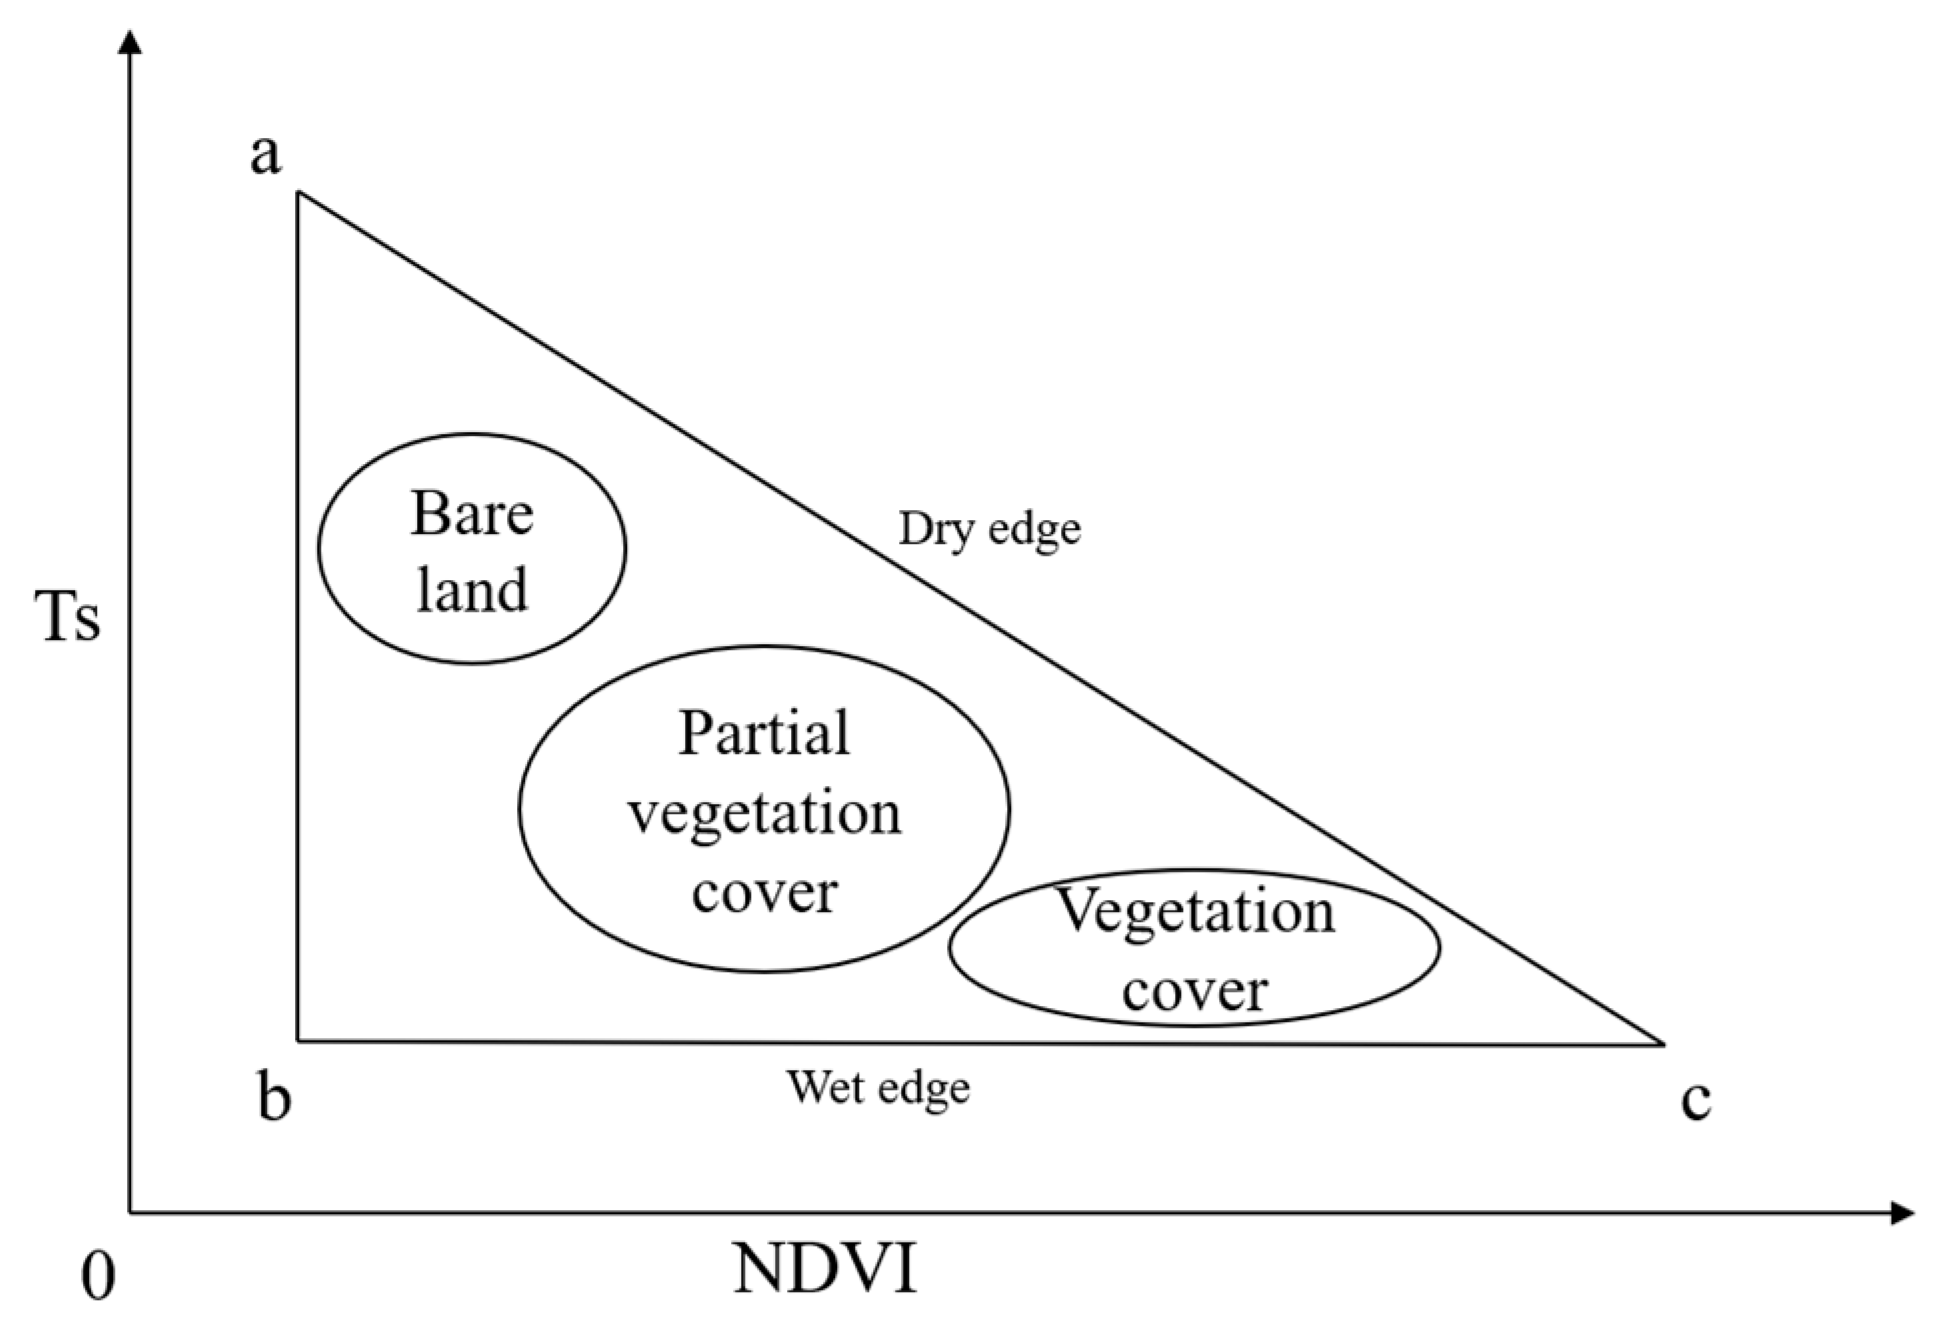
2.3.1. Drought Indicator

TVDI is calculated by dry and wet edge feature space constructed with LST and NDVI:
TVDI = T S T S min T S max T S min
TS is the land surface temperature; TSmax is the highest land surface temperature based on the dry-edge equation; TSmin is the lowest land surface temperature based on the wet-edge equation.
The wet- and dry-edge equations can be expressed as Equations (2) and (3), respectively:
T S max = a + b × NDVI
T S min = c + d × NDVI
where a and b denote the coefficients of the fitted equation for the maximum value of land surface temperature corresponding to any given NDVI on the dry edge. c and d denote the coefficients of the fitted equation for the minimum value of land surface temperature corresponding to any given NDVI on the wet edge (Figure 2).
Landsat lacks NDVI and LST products. Therefore, we employed a thermal infrared atmospheric correction algorithm, utilizing bands 4, 5, and 10, to retrieve the land surface temperature and calculated NDVI using bands 4 and 5.
In order to verify the drought monitoring effect of TVDI, two drought indices MCI and SRHI representing meteorological and soil water classification were selected for comparative analysis. MCI is a drought index constructed by considering the effects of precipitation and evapotranspiration on the current drought in different time periods in the previous period [49]. SRHI is an indicator calculated by measuring the water content of different depths in the soil to measure the moisture status of the soil [50]. Such three indices were divided into different dry grades with reference to meteorological drought grade, agricultural drought grade, and TVDI drought grade (Table 1) [51,52,53]. Considering the limitation of drought levels in TVDI, for the purpose of facilitating statistics, the extreme drought of SRHI and MCI were grouped into the severe drought category to achieve consistency with TVDI.

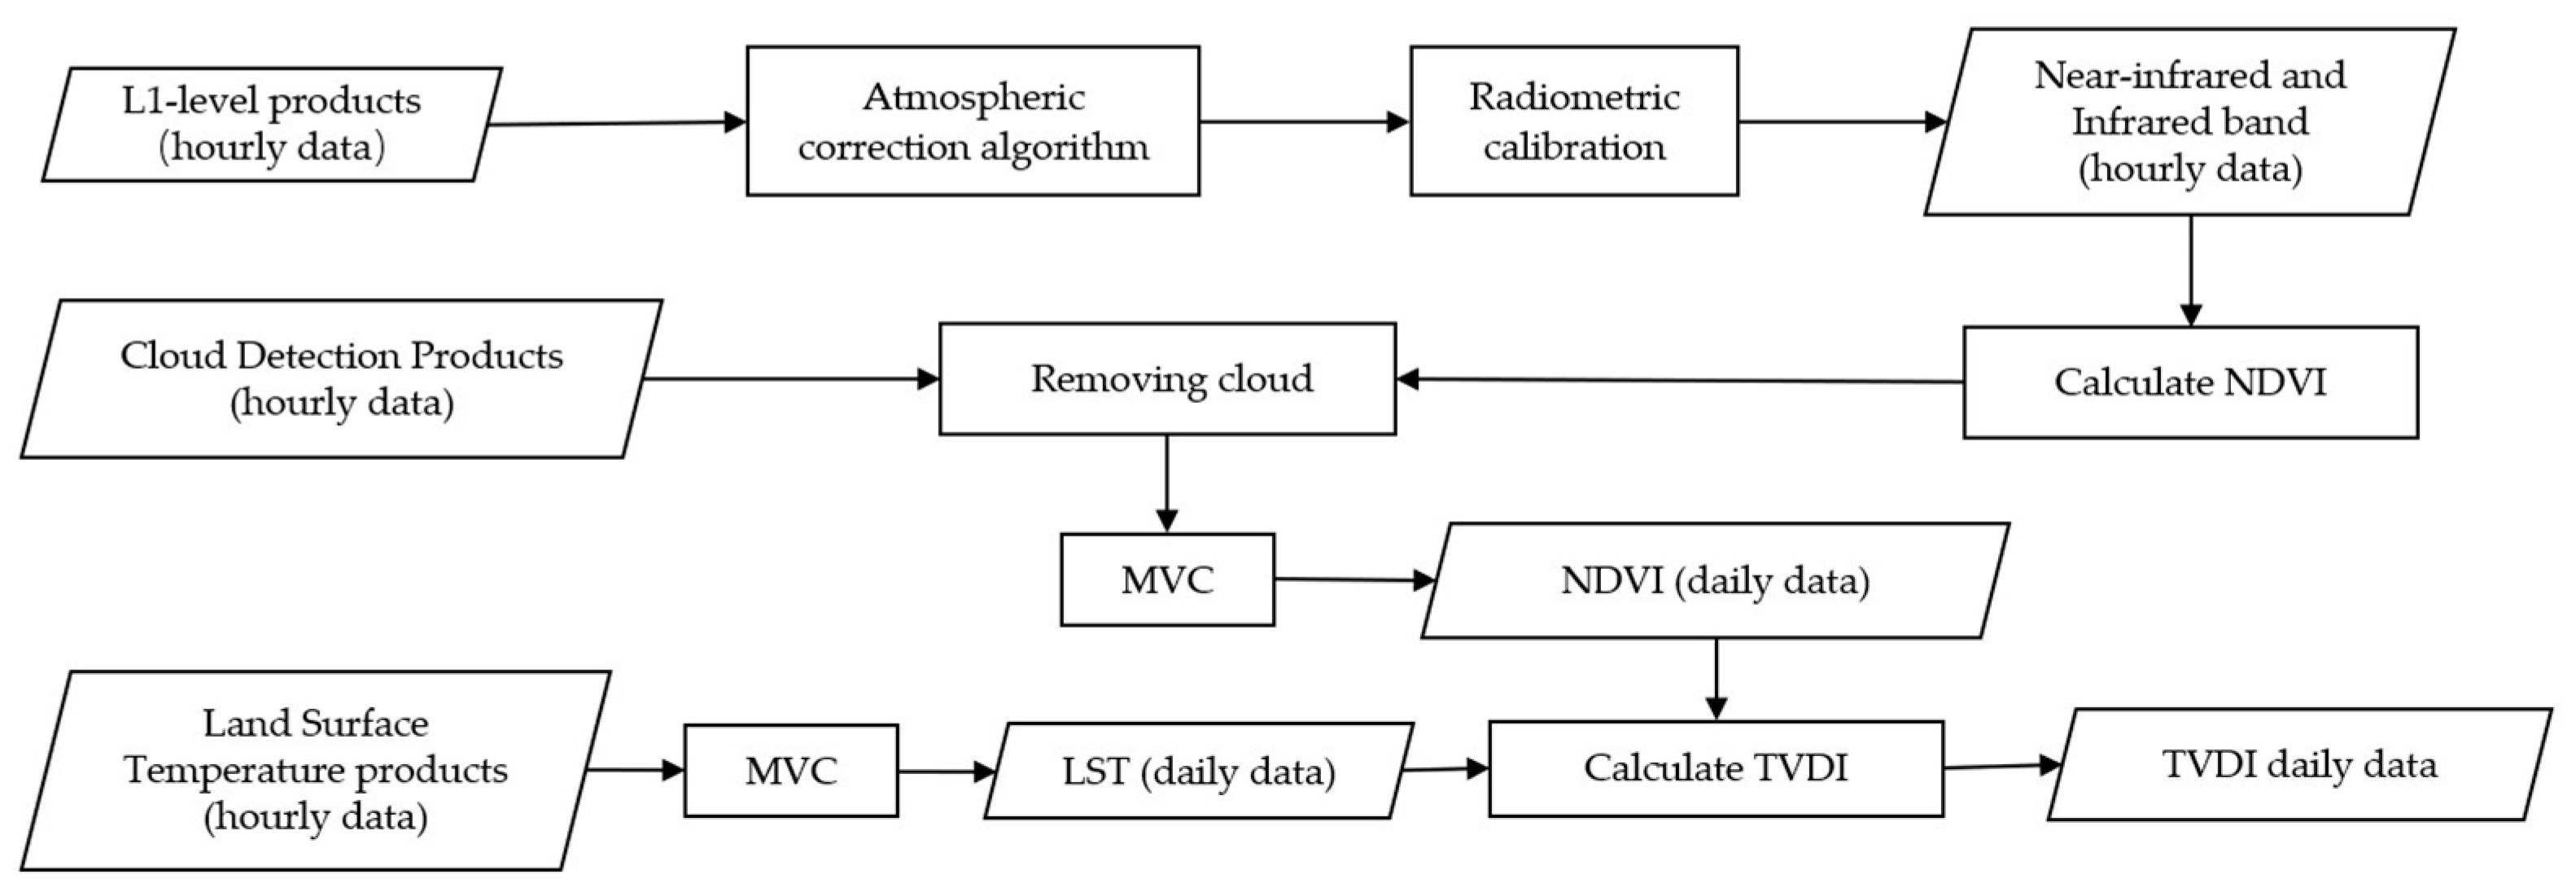
2.3.2. Data Processing

L1-level products of FY-4A ARGI from 8:00 a.m. to 4:00 p.m. are selected in this research. The darkest pixel atmospheric correction algorithm is used for atmospheric correction after radiometric and geometric corrections. NDVI is calculated combined with CLM products to remove the cloud-covered effects. Daily NDVI and LST were obtained by MVC and hourly data. Finally, we acquired the daily TVDI (Figure 3).

2.3.3. Correlation Analysis

The MCI site data and SHRI raster data were correlated with TVDI by the Pearson coefficient. The calculation formula is:
x = i = 1 n ( x i x ¯ ) ( y i y ¯ ) i = 1 n ( x i x ¯ ) 2 i = 1 n ( y i y ¯ ) 2 .

2.3.4. Trend Analysis

The Theil–Sen Median trend analysis is a common trend analysis method in the field of hydrology and meteorology, which has no specific requirements for data distribution, reducing the influence of missing values and outliers in the calculation process, with the following equation [54,55].
β = Median ( x j x i j i )
where i and j are time series serial numbers, and X is the variable for which the trendiness needs to be calculated. β is the trend value of Sen. When β > 0, the values show an increasing trend, meaning drought strengthening in TVDI and drought reduction in SRHI. On the contrary, the values show a decreasing trend, meaning drought mitigation in TVDI and drought intensification in SHRI.

3. Results

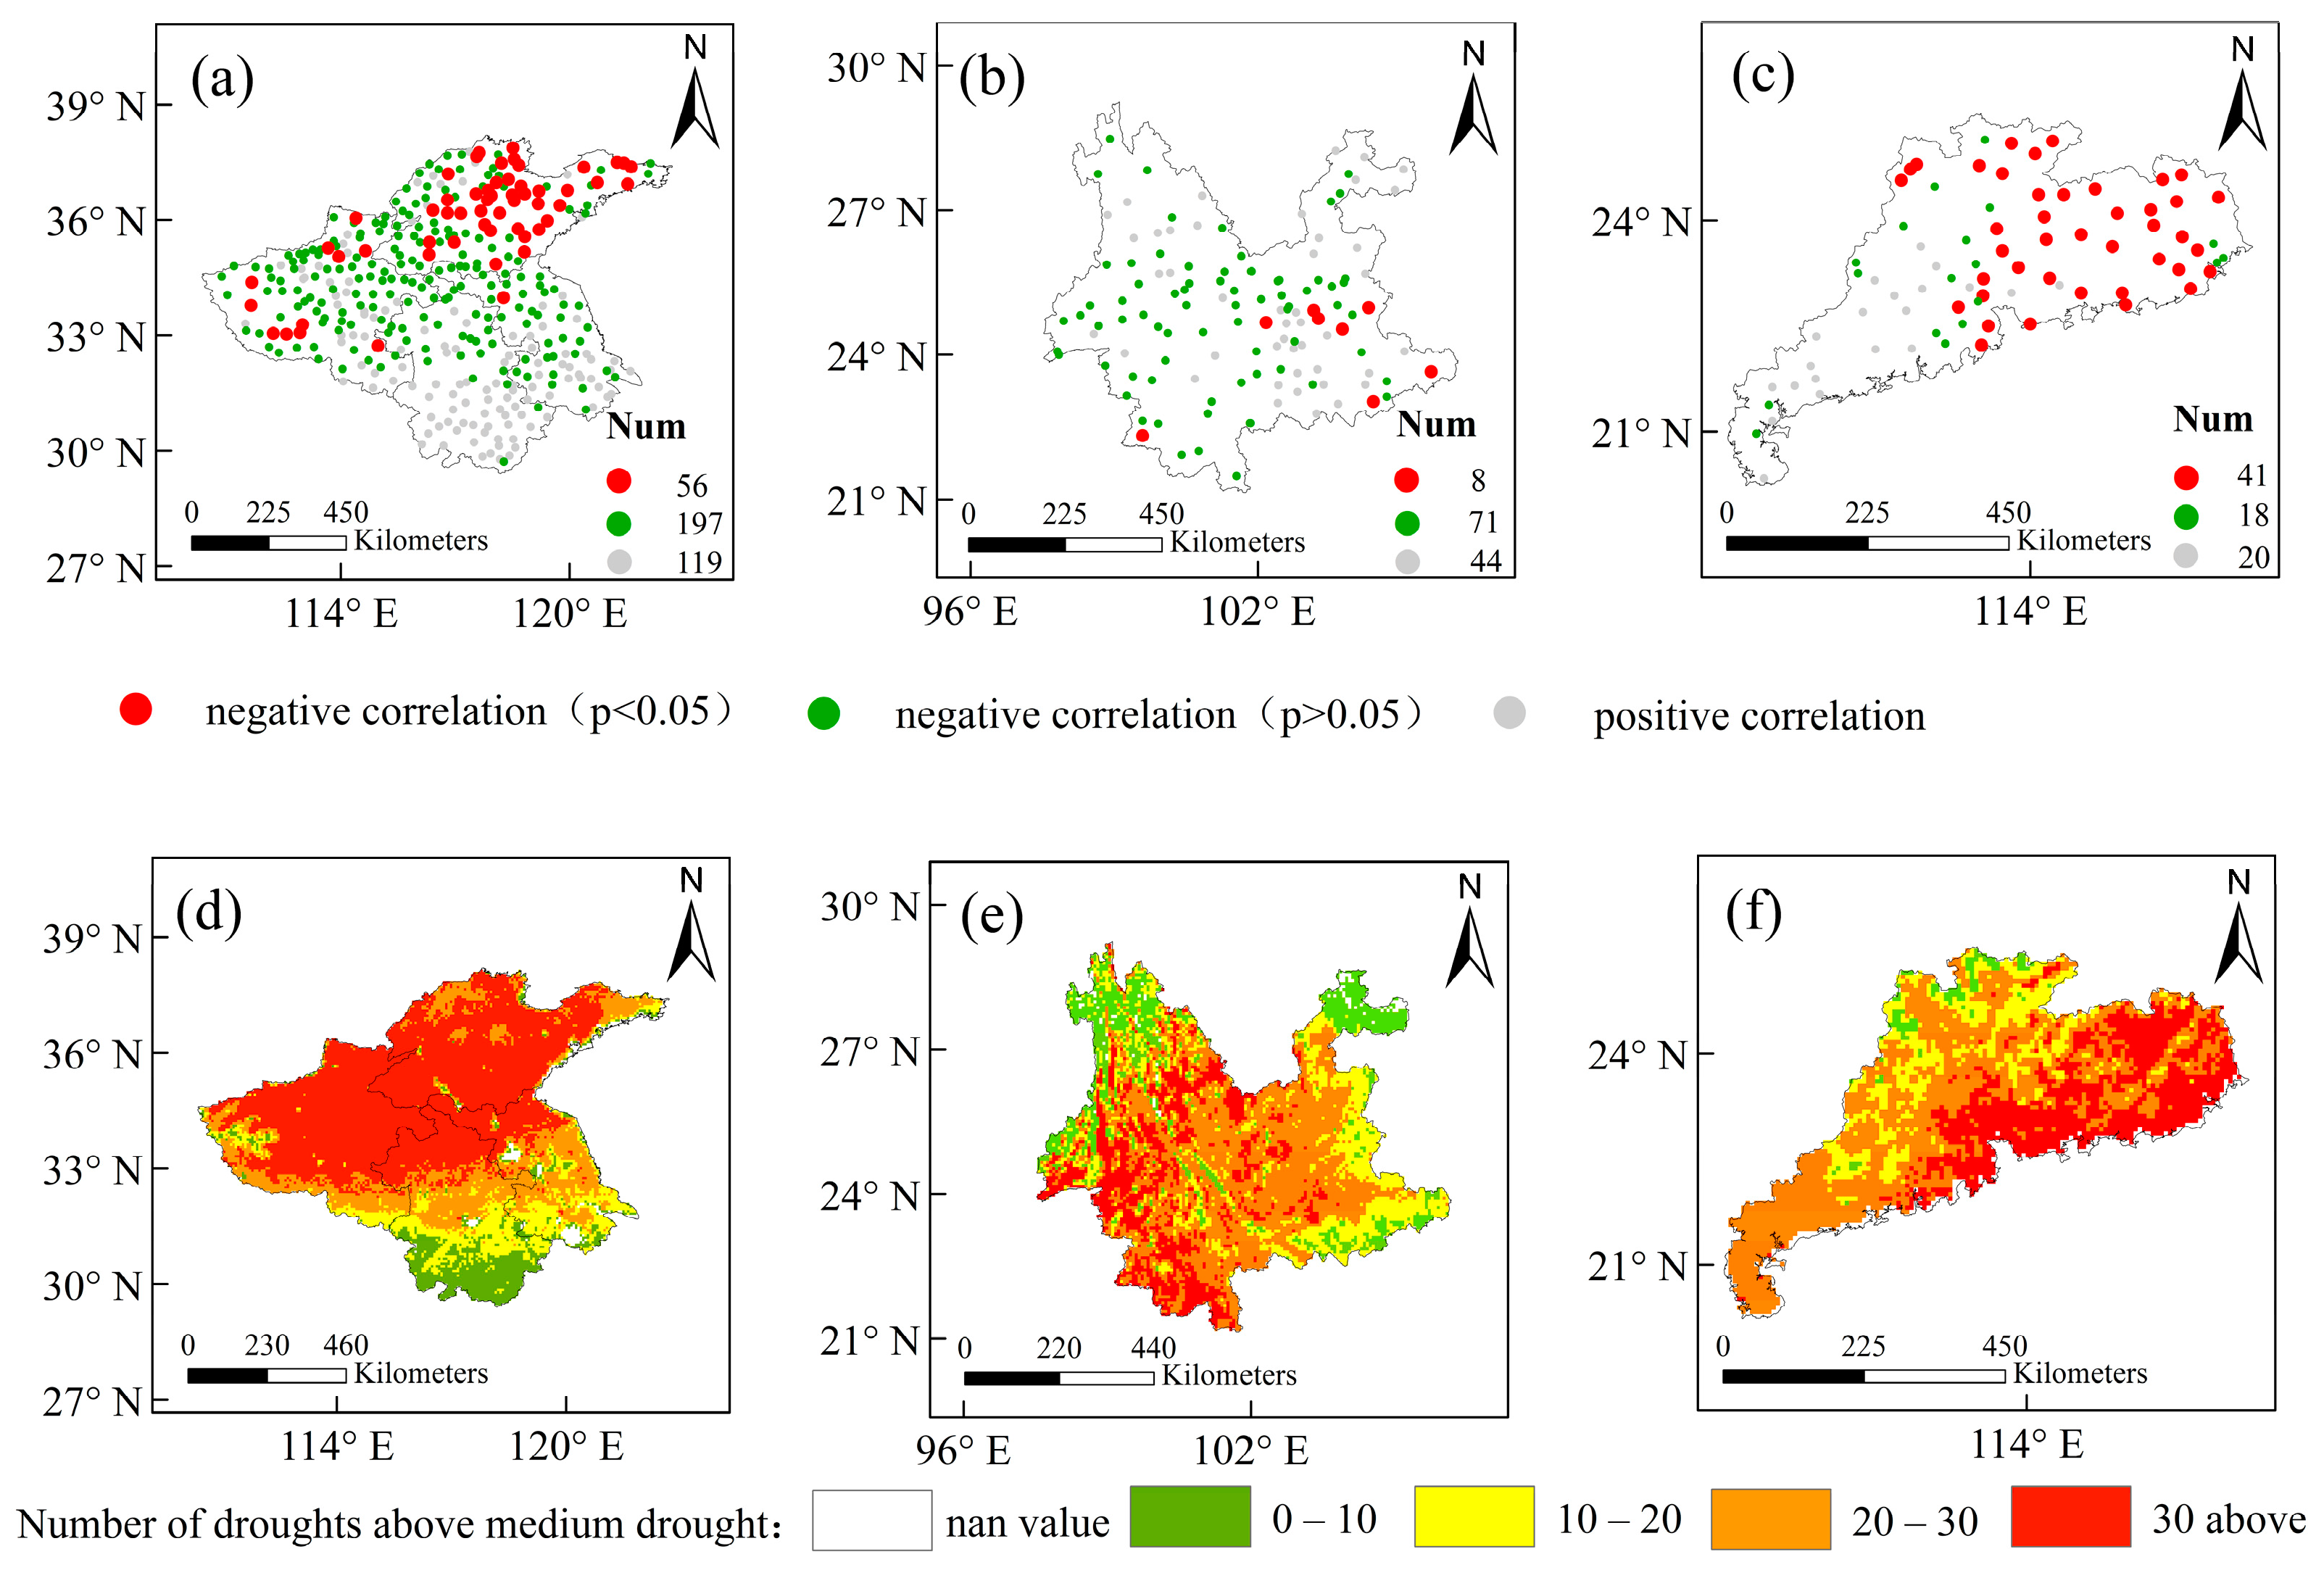
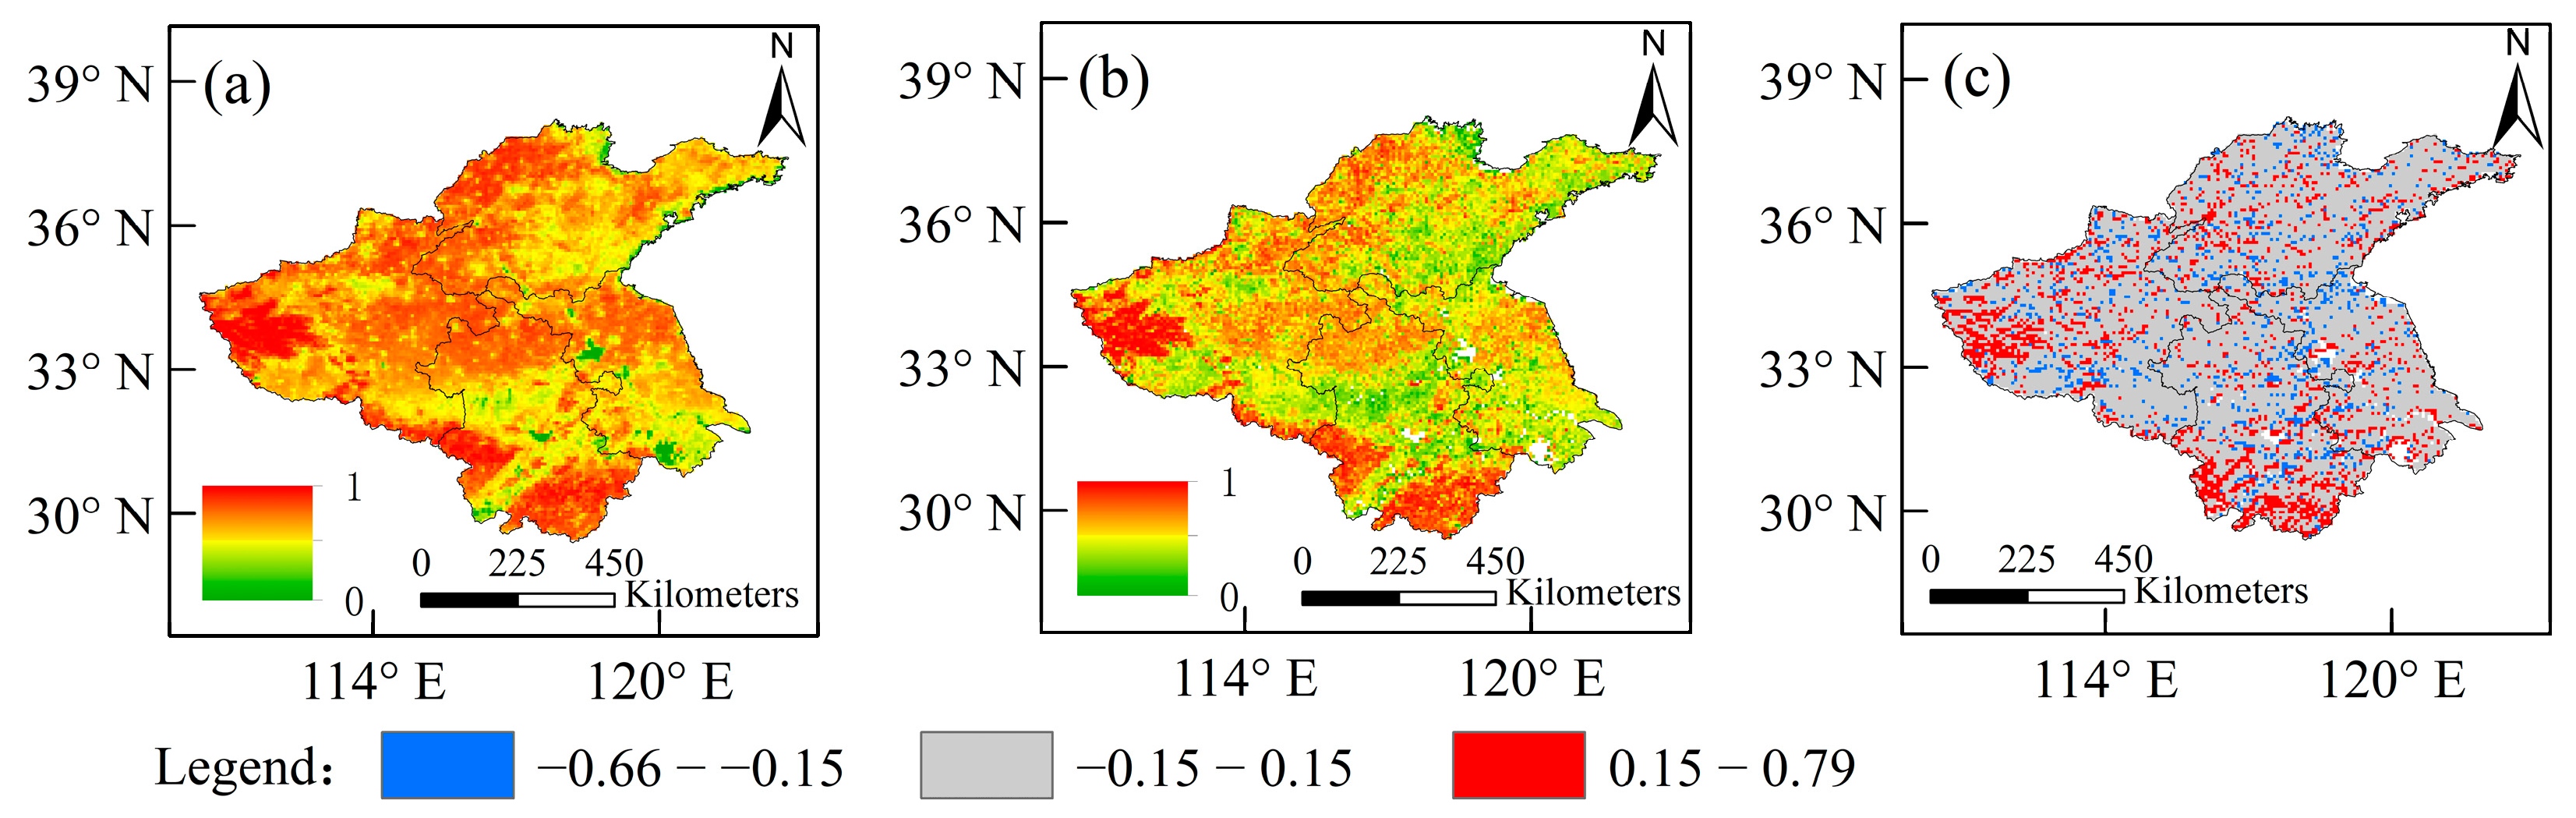
3.1. Analysis of Spatial and Temporal Correlations

The spatial distribution of the correlation between site MCI and TVDI is shown in Figure 4. In the Huanghuai region, 119 (32%) sites show a positive correlation, 253 sites (68%) show a negative correlation, with 15.1% (p < 0.05), and mainly distributed in Shandong and Henan Provinces (Figure 4a). In Yunnan Province, 44 (35.8%) sites show a positive correlation and 79 sites show a negative correlation with 6.5% (p <0.05), mainly in the central part of Yunnan Province. In Guangdong Province, 20 (25.3%) sites show a positive correlation and 59 stations show a negative correlation with 51.9% (p <0.05), mainly in the eastern and northern Guangdong Province.
During these drought events, the sites of significantly negative correlation were 50 (13.4%), 5 (4.1%), and 40 (50.6%) in the Huanghuai region, Yunnan Province, and Guangdong Province, respectively. These sites were mainly concentrated in moderate and severe drought areas (drought with more than 30 occurrences), and the negative correlation is not significant in the areas with less severe drought (Figure 4d–f). The results indicate that TVDI has a better monitoring effect in the moderate and severe droughts area (TVDI above moderate drought).
The spatial distribution of the correlation between SRHI and TVDI on pixels is shown in Figure 5. The percentage of significantly negative correlations was 24.8%, 28.7%, and 40.7% in the Huanghuai region, Yunnan Province, and Guangdong Province, while the insignificant pixels accounted for 75.2%, 71.3%, and 59.3%, respectively. The pixels in the gray show no significantly negative correlation between TVDI and SRHI (p > 0.05) because there are too many null-value pixels due to the cloud. Additionally, the pixels passing the significance test (p < 0.05) in the three regions are distributed in the area of severe drought, the same with the site MCI and TVDI.

3.2. Analysis of Trend

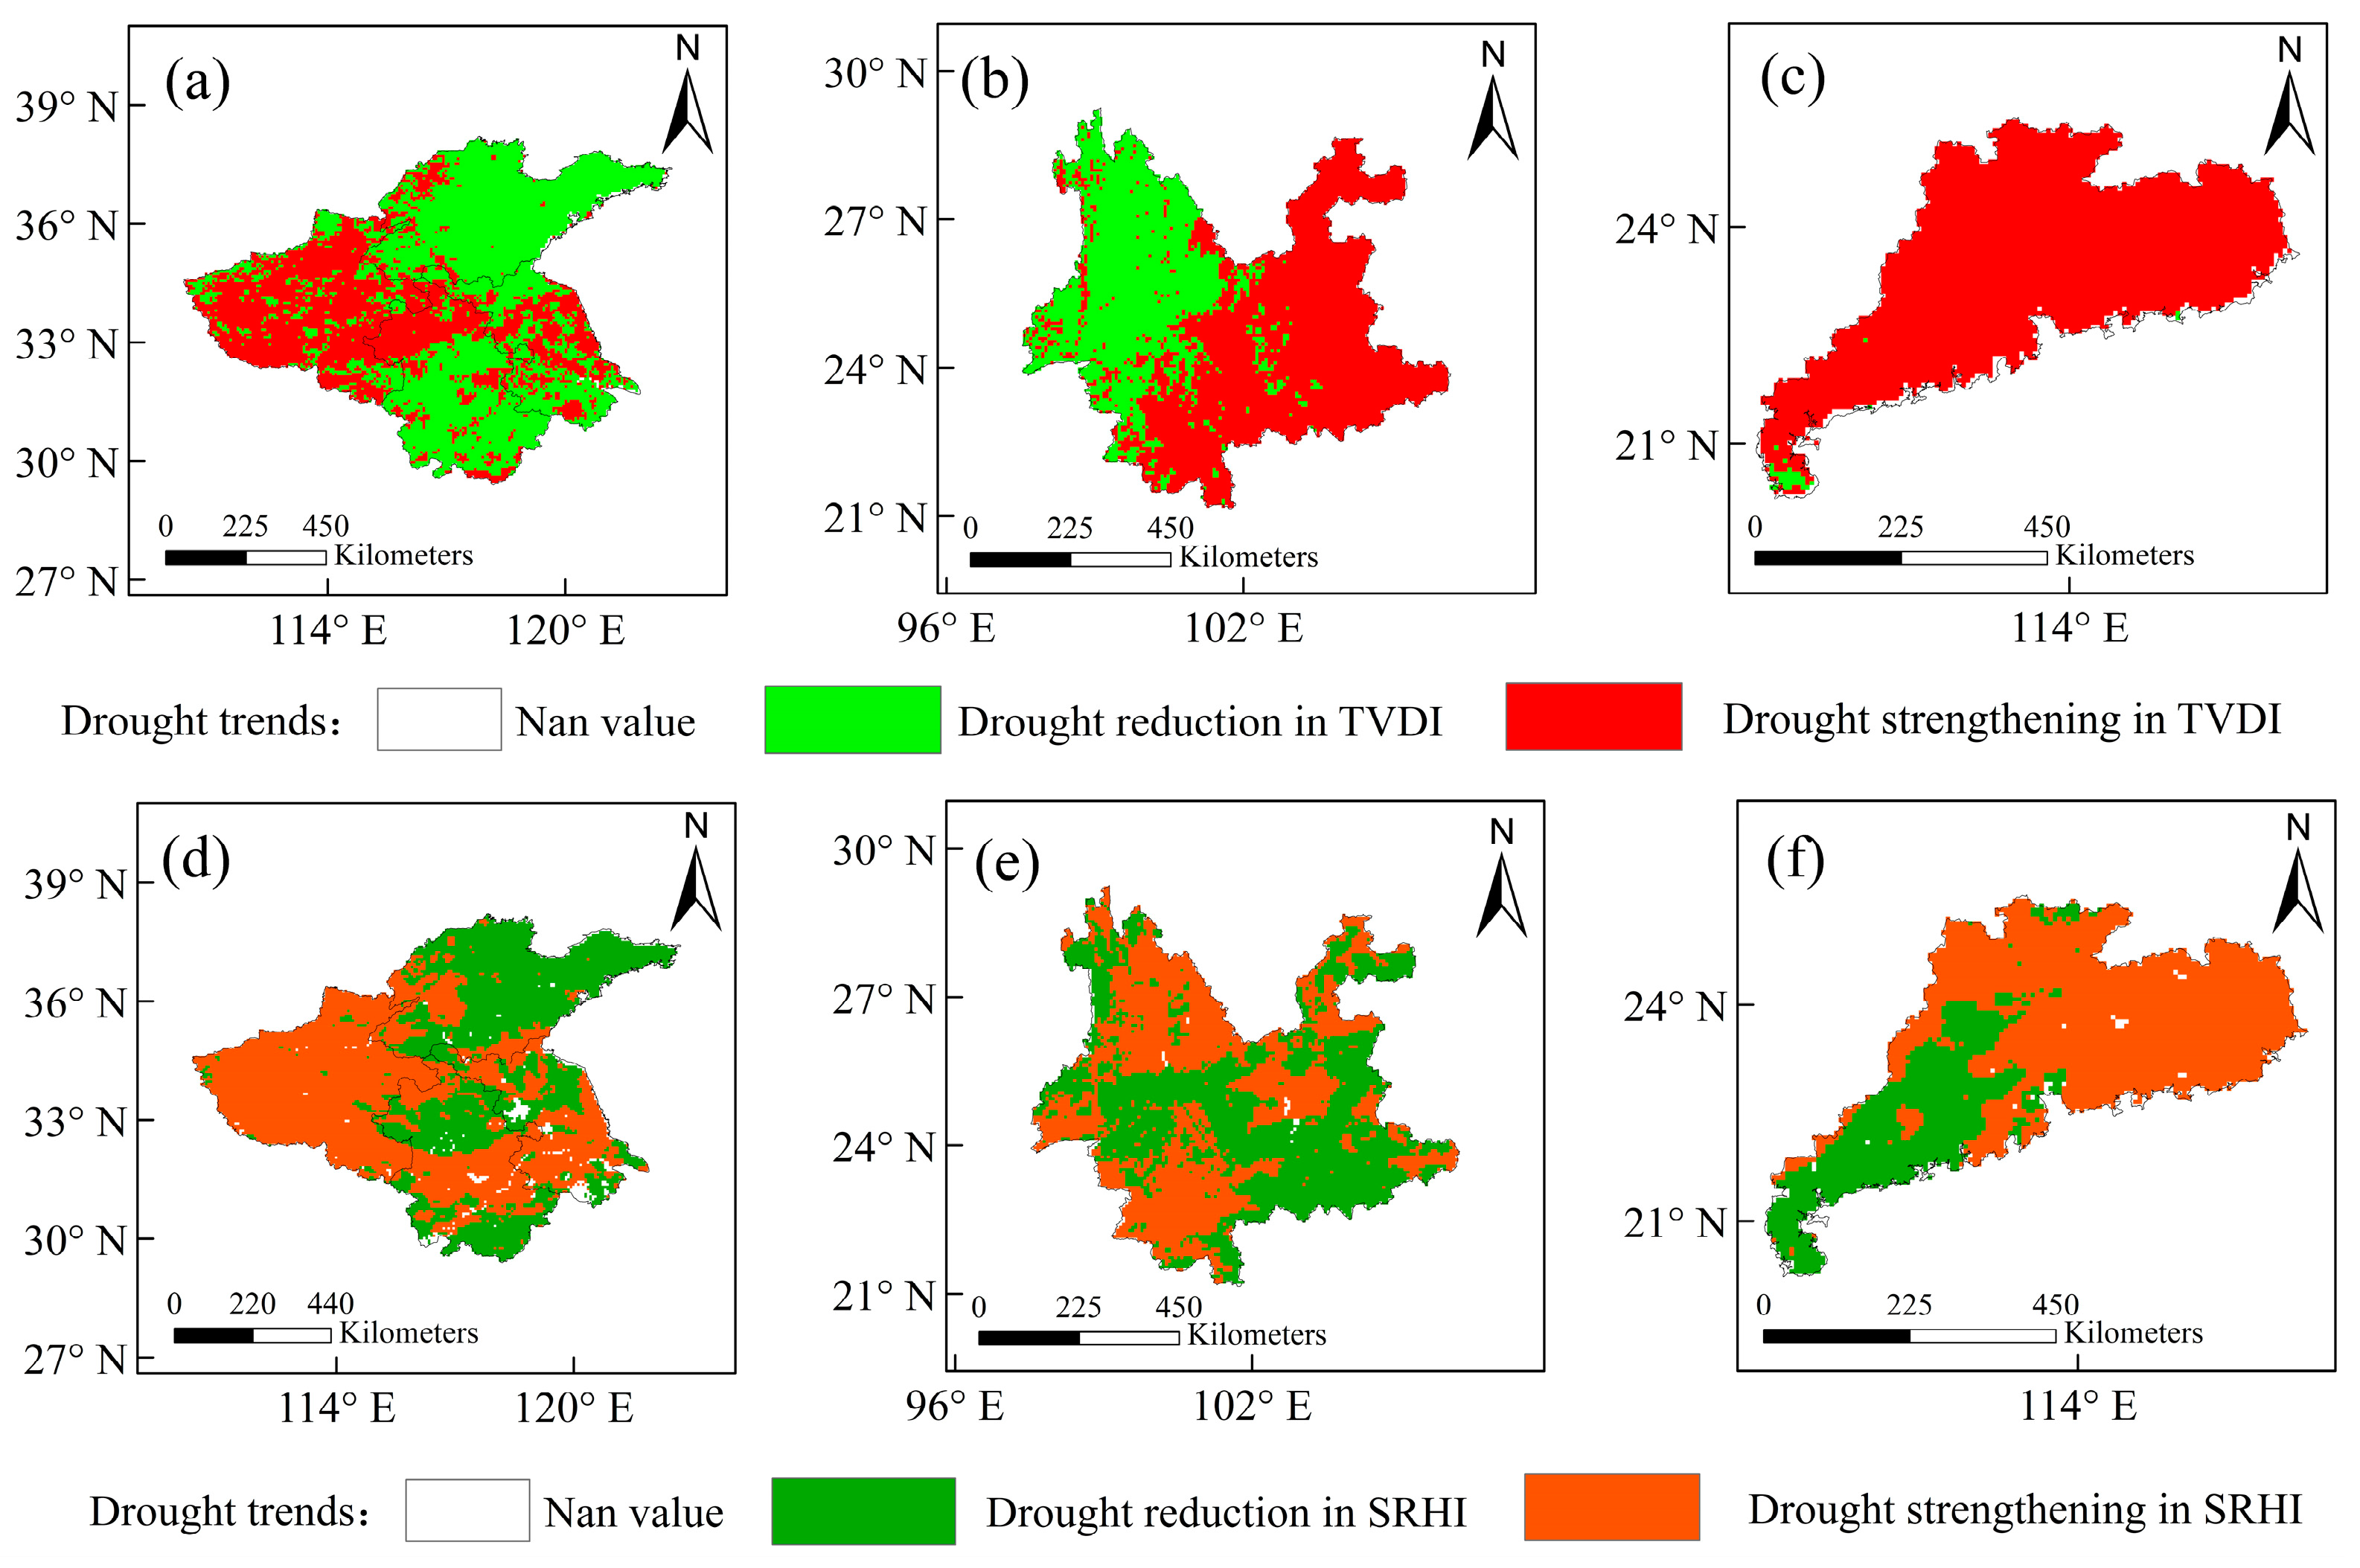
3.2.1. Trend of Drought Indices

The Theil–Sen Median method is used to quantitatively analyze the overall trend of SHRI and TVDI during the drought (Figure 6). The pixels of drought strengthening in TVDI and SHRI are 41.8% and 55.3% in the Huanghuai region, respectively. The drought strengthening in TVDI pixels accounts for an eastern Yunnan Province (60.4%), while the drought strengthening in SHRI pixels is more scattered (47.6%). The drought strengthening in TVDI pixels and SHRI pixels in Guangdong Province is 96.1% and 68% in the east, respectively. The pixels of the same drought trends were 61.7%, 42.4%, and 65.6% in the Huanghuai region, Yunnan Province, and Guangdong Province, respectively. Yunnan Province observed the largest difference in the distribution of drought trends among the three drought events, but some regions are still experiencing the same drought process. Overall, TVDI and SHRI trends are consistent.

3.2.2. Trend of Drought Area

The trends of proportion in drought areas on TVDI, MCI, and SHRI during the drought process are shown in Figure 7. In the Huanghuai region (Figure 7A) before 15 May 2022, the area of light drought on TVDI increased, and the rest level of drought rapidly decreased. Then, heavy drought intensified, and the area of light and medium drought decreased. After 4 June, the region affected by medium and heavy drought shrank, and light drought exhibited an upward trend, indicating relief from the drought. Yunnan Province (Figure 7B) was dominated by light drought before 22 January 2021, and the area of medium and heavy drought decreased. After 22 January, medium and heavy drought gradually increased, and light drought decreased. At the turning point of February 6th, the proportion of medium and heavy drought areas decreased rapidly. It showed a sharp decrease in the area of the drought before 12 January 2021 in Guangdong Province (Figure 7C). The area of heavy drought increased, while light and medium drought continued to decrease. Finally, the area of heavy drought disappeared after 6 February. The trend of drought areas on TVDI is consistent with the results on MCI and SHRI.

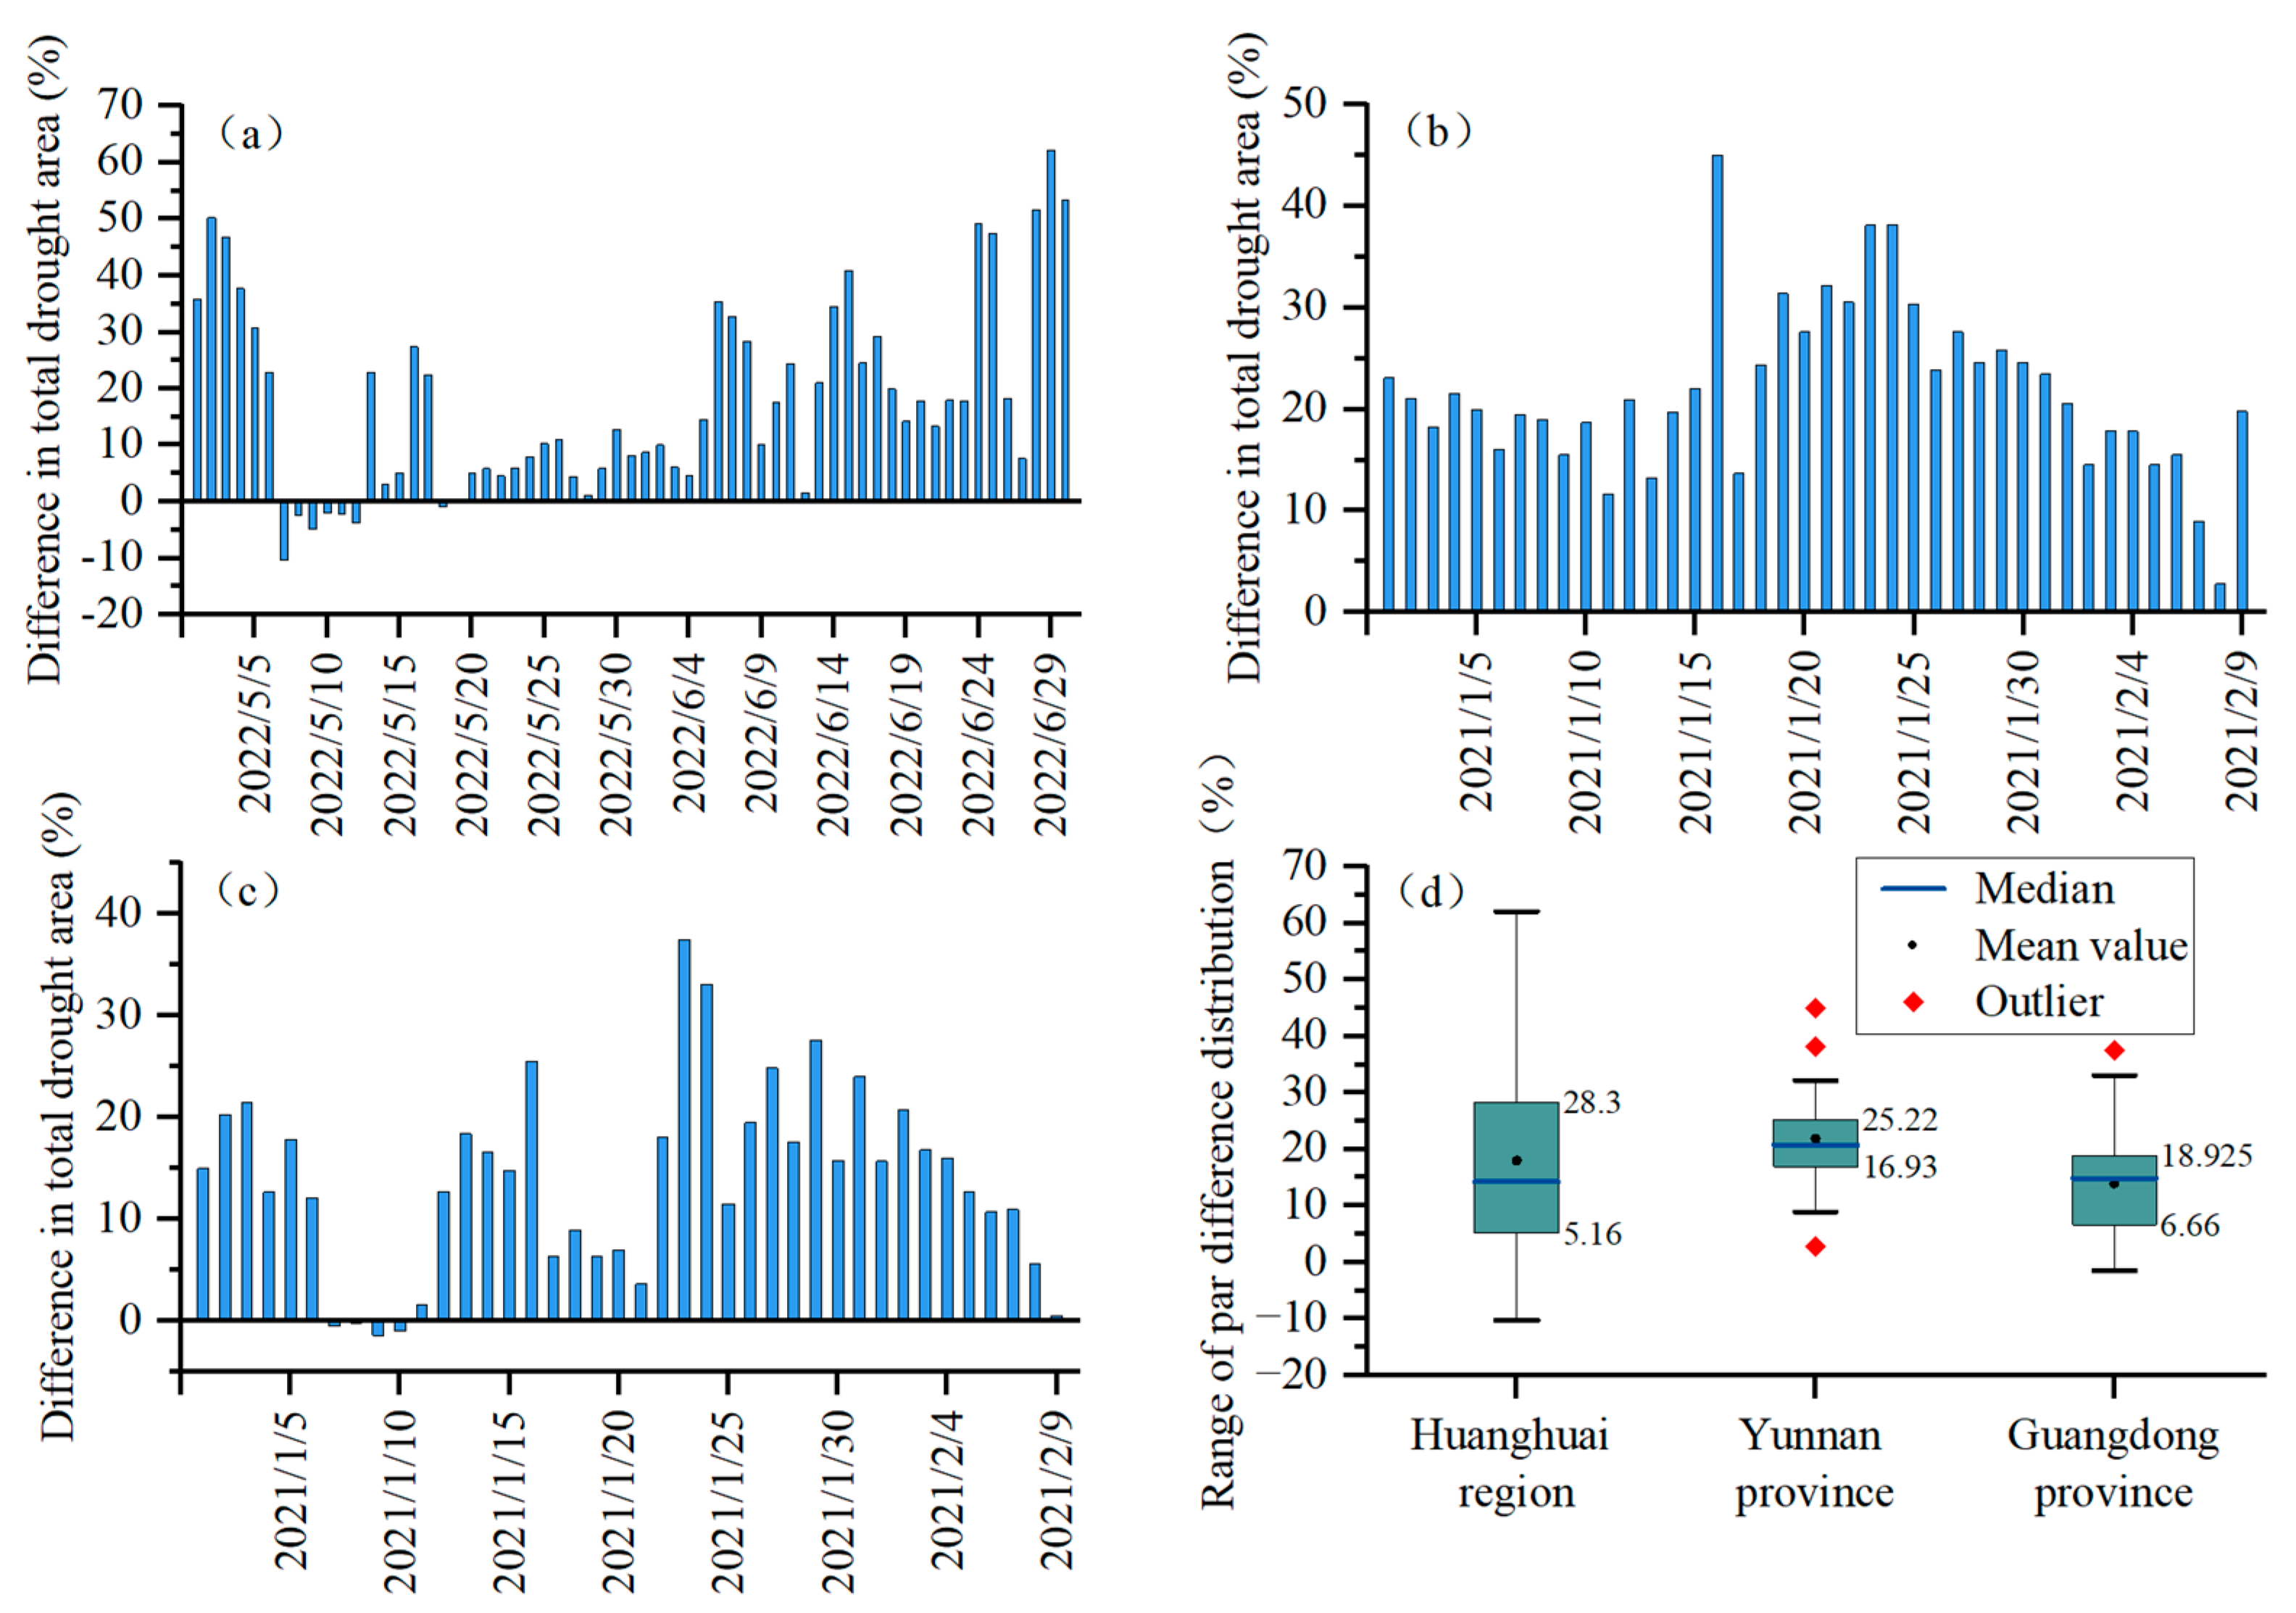
3.2.3. Difference in Drought Area

The differences between the proportion of drought area on TVDI and SRHI are calculated (Figure 8). In the Huanghuai region, the difference between the drought area on TVDI and SRHI, reaches a maximum (62.03%) on 29 June 2022, and minimum (−10.21%) on 7 May 2022, mainly in [5.16–28.3%]. The differences in Yunnan Province peaked at 44.96%, mainly [16.93–25.22%]. The differences in Guangdong Province peaked on 7–10 January 2021, with the difference mainly distributed in [6.66–18.93%]. The proportion of drought area on TVDI was greater than the proportion on SHRI, with the most concentrated distribution of the difference in Yunnan and the most dispersed distribution in the Huanghuai region.

3.3. Comparison with Other Satellites

3.3.1. Comparison with Earth Observation Satellites

  • Comparison with MODIS
Compared with the infrared (IR) and near-infrared (NIR) bands of FY-4A and MODIS (Figure 9), the band values of MODIS are slightly lower than those of FY-4A. The significantly positive correlation between the value of FY-4A and MODIS could be found in randomly 7 days of data (0.45 in NIR band pixels, 0.41 in IR band pixels, and 0.74 in NDVI pixels).
The high-value of NDVI pixels on FY-4A and MODIS are mainly distributed in the southwest of the Huanghuai region (Figure 10), which is consistent with the location of the woodland area (Figure 1a). The differences in NDVI between FY-4A and MODIS in the Huanghuai area (Figure 10c) are mainly concentrated in [−0.15, 0.15], accounting for 76.7%. The pixels with a difference less than −0.15 (7.7%) are more scattered, while those with a difference greater than 0.15 (15.6%) are mainly located in the high-value area of NDVI.
The maps of different intensity drought identified by FY-4A TVDI, MODIS TVDI, and MCI on day 16 are shown in Figure 11. The severe drought of FY-4A TVDI is distributed in the north of the Huanghuai region, consistent with MCI, while those of MODIS TVDI are scattered in Shandong and Henan. In addition, the FY-4A TVDI has more valid pixels compared to the MODIS TVDI, with 14,149 pixels and 13,712 pixels, respectively. The proportion of severe drought is 60.32%, 19.62%, and 54.08% for FY-4A TVDI, MODIS TVDI, and MCI, respectively. The severe drought areas identified by FY-4A TVDI are similar to that of MCI (Figure 11). It can be attributed to the fact that FY-4A is a geostationary meteorological satellite with a higher observation frequency (every 30 min to 10 min over the full disk of the Asia–Oceania region), while MODIS is an earth observation satellite with 1–2 days observation frequency. As a result, FY-4A can provide more comprehensive and frequent monitoring of drought conditions.
2.
Comparison with Landsat-8
The maps of different intensity droughts identified by FY-4A TVDI and Landsat TVDI in a week are shown in Figure 12. The TVDI images in the Huanghuai region of Landsat-8 (Figure 12a–d) were composed by assembling a total of 6, 3, 5, and 6 individual images, respectively. On 16 May, both FY-4A and Landsat-8 detected severe drought conditions in the Shandong Peninsula. On 19 May, severe drought was observed in the northwestern region of Henan Province. On 21 May, Landsat-8 identified a larger area affected by severe drought compared to FY-4A. On May 23rd, TVDI from both satellites showed widespread moderate drought and some areas of severe drought in the central Huanghuai region. Due to the inability of Landsat-8 to acquire complete image data of the entire Huanghuai region within a single day, a comparison was conducted using the available data for that region during a week to calculate TVDI. Except for 21 May, the spatial distribution of FY-4A and Landsat-8 was consistent in the remaining three days.
The statistical results of bands, products, and TVDI among the three satellites are shown in Table 2 and Table 3. The root mean square error (RMSE) for MODIS TVDI, Landsat-8 TVDI, and FY-4A TVDI are 0.26 and 0.13, respectively. The standard deviations of TVDI for MODIS, Landsat, and FY-4A are 0.15, 0.35, and 0.26, with value ranges of [0.13–0.97], [0.08, 0.93], and [0.02, 0.98], respectively. The computation time required for calculating TVDI over the entire Huanghuai region, FY-4A, MODIS, and Landsat-8 take 3.15 min, 5.56 min, and 17.31 min, respectively. FY-4A, MODIS, and Landsat-8 acquire images in the Huanghuai region at a frequency of 165 scenes per day, 2 scenes every 2 days, and 35 scenes every 16 days, respectively (Table 3). Moreover, FY-4A exhibits a wider NIR (0.15) and IR (0.2) band compared to the other two datasets (Table 2).

3.3.2. Comparison with FY-4B

FY-4A and FY-4B belong to the same second generation of geostationary meteorological satellites in China. The differences of LST and NDVI between the two satellites was shown in Figure 13. Both LST and NDVI showed noticeable differences. The LST’s differences were mainly concentrated in [−10, 15], with the median around 3. The NDVI’s differences were concentrated in [−0.05, 0.27], with the median around 0.15.
The drought area is notably varied due to the different TVDI values between FY-4A and FY-4B. The different grade drought area of FY-4A and FY-4B TVDI was calculated from 1 to 15 June 2022 (Figure 14). The area of the light drought of FY-4A exceeds that of FY-4B by a maximum of 4.88%. The area of medium drought was in a small difference, from −3.69% to 4.27%. The area of a heavy drought in FY-4B was significantly greater than that of FY-4A. The value of FY-4A TVDI was less than that of FY-4B, and the areas of drought were close.

4. Discussion

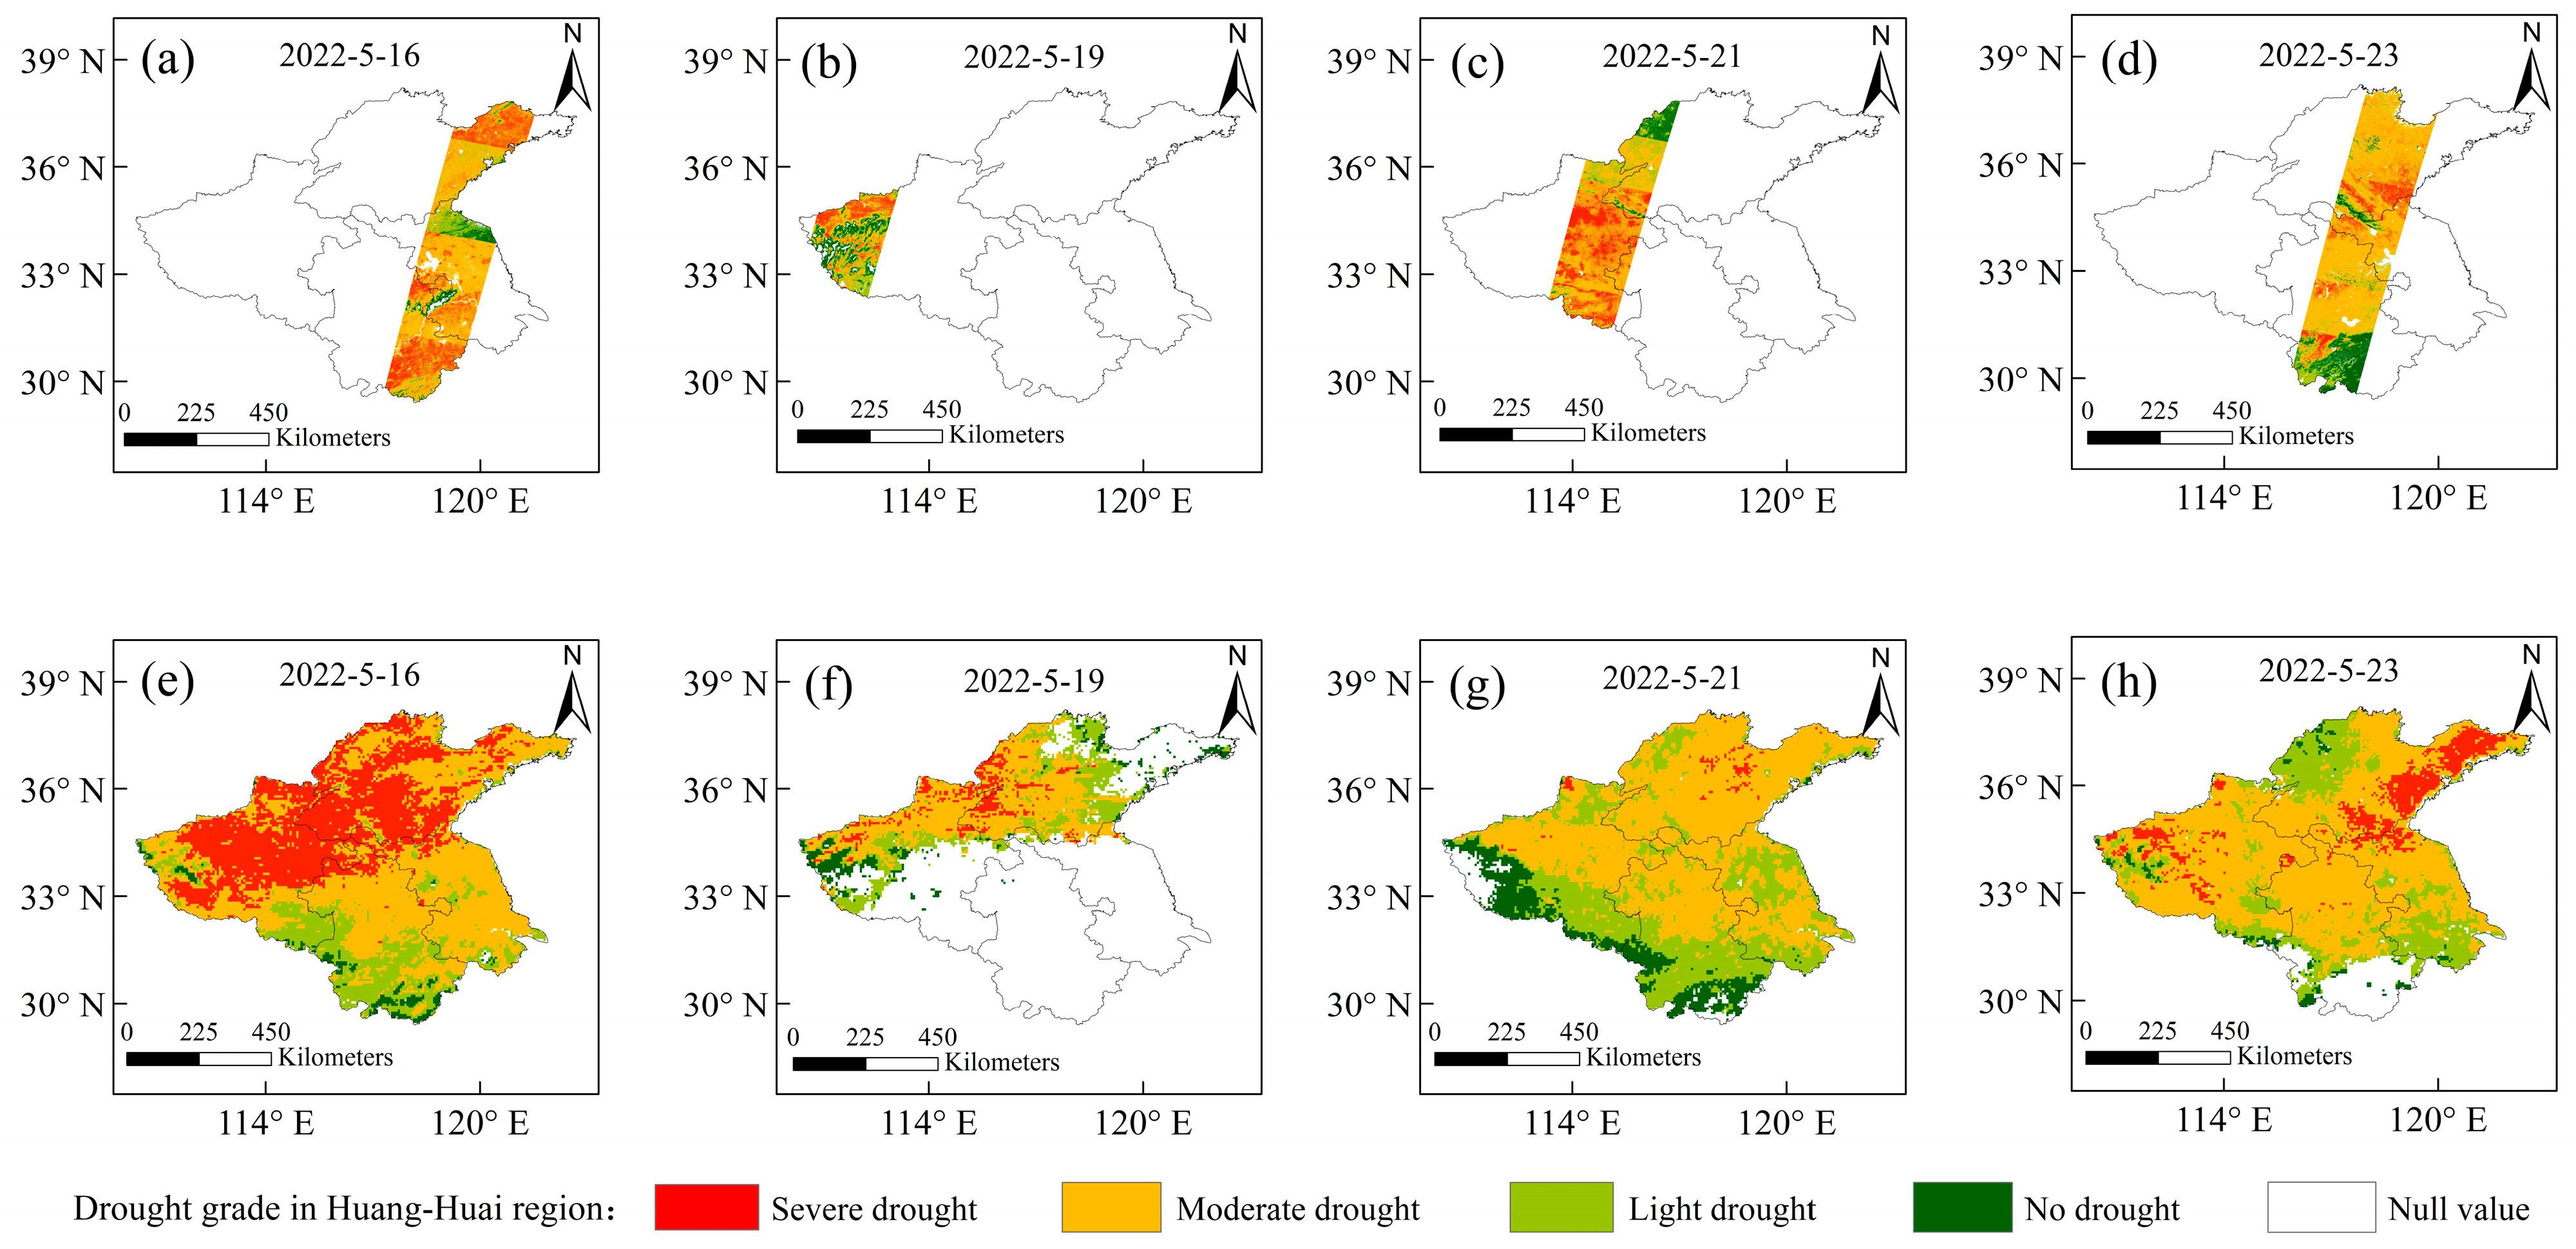
4.1. Impact of Cloud Cover on Drought Monitoring

In the spatiotemporal analysis of TVDI, MCI, and SHRI, numerous stations and pixels exhibited negative correlation, but failed the significance test. In the trend analysis, the drought area shows a cliff-like decline. Comparing the results of cloud identification and local TVDI, it is found that the null pixels and the breakpoints were caused by the cloud cover.
Because the values of the cloud in the NIR band and IR band are close [56], the ratio of the NIR band and IR band in the cloud area is close to 1. Comparison of the NIR band, IR band, true color image, NDVI, and cloud mask products from FY-4A in the Shandong Peninsula (Figure 15) revealed that there were obvious high-value areas in the red boxes of the NIR band (Figure 15a) and IR band (Figure 15b). The red box of the true color image might be a cloud cover (Figure 15c). The red area is the ratio value close to 1 (Figure 15d). The red area of NDVI was suspected to be a cloud pixel (Figure 15e). According to the above inference and the cloud mask image overlap (Figure 15f), it is concluded that CLM cloud detection is missing.
Therefore, high-precision cloud detection results can significantly improve TVDI’s ability to monitor drought events. Yan et al. [57] used machine learning algorithms to construct a cloud detection model to improve the accuracy of FY-4A AGRI cloud mask products. Furthermore, many researchers focused on the reconstruction of missing values by clouds [58,59,60], which could help to expand the scope of remote sensing drought monitoring, and enhance the temporal continuity of values [61].

4.2. Variability of Different Drought Indices

Meteorological drought is the main cause of all types of drought and a precursor of other drought types [62]. MCI is a typical meteorological drought index. According to the drought transfer process of “atmosphere–soil–vegetation” by Qu et al. [63], a change in vegetation growth conditions is transferred to the drought monitoring of TVDI, as a result of soil moisture content decreased. In the drought monitoring by TVDI, MCI, and SHRI, TVDI showed a lag, resulting in fewer pixels and stations in negative correlation and passing the significance test.
The drought area on TVDI was generally greater than SHRI. There are two main reasons. On the one hand, the SHRI is a grid data calculated by assimilating through site data and remote sensing satellite data. And they are different in spatial resolution. The error is easy to occur during the unified resolution procedure. On the other hand, the equal interval method was used for drought grade division on TVDI. Therefore, the subsequent research can correspond the values of the two indices to the corresponding drought grades respectively, and apply statistical methods to analyze the TVDI threshold for each grade.

4.3. Differences between FY-4A and Other Satellites

4.3.1. Differences with Earth Observation Satellite

It was observed that FY-4A TVDI detected a larger area of severe drought than MODIS TVDI. In the northwestern Huanghuai region, FY-4A NDVI values are lower than MODIS, resulting in higher TVDI values computed by FY-4A. The FY-4A IR channel has a bandwidth of 0.2, while the NIR channel has a bandwidth of 0.15. In contrast, MODIS demonstrates narrower bandwidths with its IR channel at 0.05 and NIR channel at 0.035 [64]. Therefore, the differences in bands between the two satellites result in distinct NDVI values in this area, leading to FY-4A TVDI detecting a larger extent of severe drought areas.
It is found that the overall spatial distribution of FY-4A TVDI is generally consistent with Landsat-8 TVDI. However, the spatial distribution of the TVDI drought on 21 May 2022, was different. This is due to the presence of thin cloud cover in Landsat-8, which results in lower NDVI values. However, FY-4A has effectively reduced the impact of clouds through the MVC method.
Comparing the bands, products, and TVDI of FY-4A, MODIS, and Landsat-8, it is observed that FY-4A TVDI exhibits a spatial distribution more similar to Landsat-8. The value ranges for FY-4A and Landsat-8 are closer, [0.02, 0.98] and [0.08, 0.93], respectively, with standard deviations of 0.26 and 0.35. FY-4A retains the data variability which could be a better expression of spatial heterogeneity. Moreover, due to the high sampling frequency of FY-4A, drought monitoring of FY-4A TVDI on a regional daily scale has lower computational costs.

4.3.2. Differences in FY Series Geostationary Meteorological Satellites

FY-4B is new generations satellites after FY-4A. They share the same band lengths in the NIR and IR spectra. However, due to their different positions in space (FY-4A at 104.7° E and FY-4B at 133° E), variations in viewing angles and sampling frequencies can result in different values. As a result, the area of drought detected by FY-4A may be larger than that detected by FY-4B, but the spatial distribution patterns remain consistent. The overall differences between these two satellite products are controllable but require further discussion.
The FY-4 satellite series offers a greater number of channels compared to its predecessor, the FY-2 satellite series. The earlier FY-2 satellites have only one visible light band. The deployment of a sole visible light channel in FY-2 imposes constraints on the computation of the NDVI and restricts the monitoring of land-based ecosystems [65]. In contrast, the multi-band advantage of FY-4A enables it to capture and monitor aerosols, snow cover, and drought conditions effectively. Moreover, FY-4A exhibits the capability to differentiate various cloud phases and detect high and mid-level atmospheric water vapor with enhanced clarity. The FY-4 satellites exhibit higher spatial resolution and observation frequency compared to the FY-2 satellites. This enables them to capture more detailed and frequent data, enhancing their capabilities for various applications, including drought monitoring.

5. Conclusions

The FY-4A satellite is the second generation of geostationary meteorological satellites in China. We proposed a novel method for calculating daily TVDI using FY-4A geostationary meteorological satellites and conducted a verification analysis. The main findings include as follows:
(1)
The strong negative correlation between TVDI and site MCI was 15% in the Huanghuai region, 6.5% in Yunnan Province, and 51.9% in Guangdong Province. The percentage of negative correlation between TVDI and pixel SHRI were 24.8%, 28.7%, and 40.7% in the Huanghuai region, Yunnan Province, and Guangdong Province. TVDI had a strong negative correlation with MCI and SHRI in the severe drought area.
(2)
The trends of TVDI, MCI, and SHRI were similar. The pixel difference between increased TVDI and decreased SHRI is −13.5% in the Huanghuai region, 12.8% in Yunnan Province, and 28.1% in Guangdong Province. The trends of proportion in drought areas on TVDI and SHRI during the drought process were consistent.
(3)
The drought area on TVDI was generally greater than the area of SHRI. The pixels difference between TVDI and SHRI are mainly in the Huanghuai region, Yunnan Province, and Guangdong Province, which are [5.16–28.3%], [16.93–25.22%], and [6.66–18.93%].
(4)
Comparing FY-4A TVDI and MODIS TVDI, the spatial distribution is consistent, but there are differences in the severe drought areas, and the monitored severe drought area was larger than MODIS, similar to MCI. FY-4A yielded a higher number of valid values, with 14,149 and 13,712 pixels, respectively. Similarly, we observed consistent spatial distribution of TVDI between Landsat-8 and FY-4A. FY-4A TVDI shows similar numerical distributions with Landsat-8 TVDI.
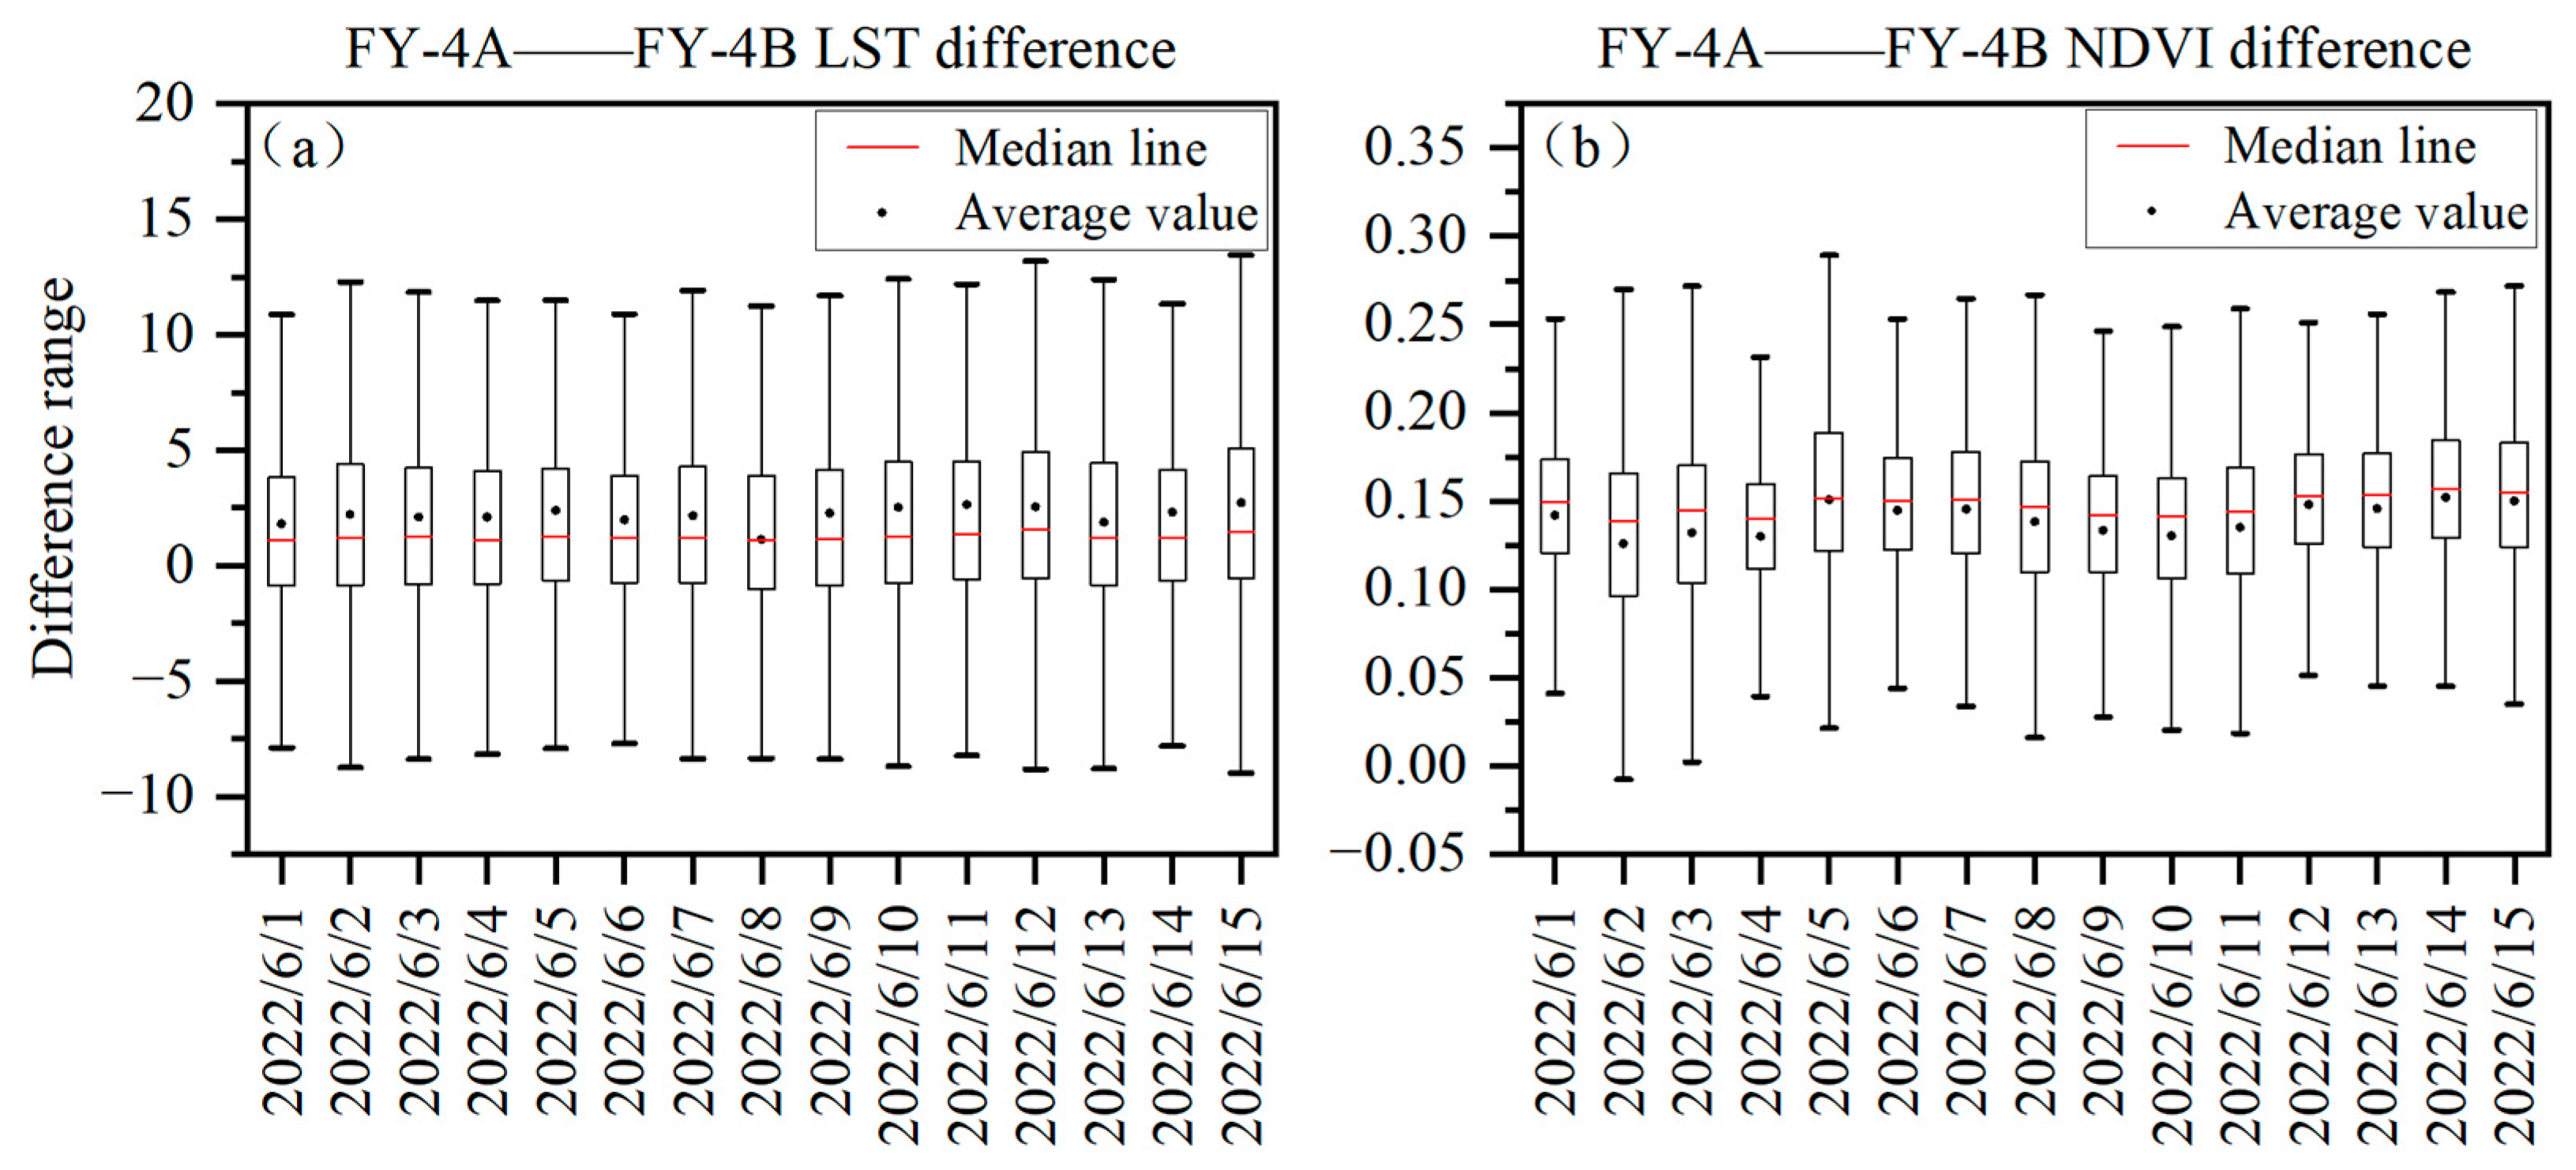
(5)
In a comparative analysis of TVDI calculations by FY-4A and FY-4B, the LST’s differences were mainly concentrated in [−10, 15], with the median around 3. The NDVI’s differences were concentrated in [−0.05, 0.27], with the median around 0.15.
This study is based on a geostationary meteorological satellite and accomplishes the data fusion of multi-imagery within one day, enabling the implementation of the daily-scale TVDI calculation. Through a comparative analysis of different drought indices (MCI and SRHI) and TVDI based on earth observation satellites data (MODIS and Landsat-8), the dynamic drought monitoring capability of FY-4A has been validated. Furthermore, FY-4A TVDI has demonstrated the ability to provide higher-frequency drought monitoring compared to earth observation satellites, ensuring the timeliness and accuracy of drought monitoring. It can provide high-frequency drought monitoring for the national meteorological department, enabling timely drought warnings for rapidly occurring droughts in agricultural production. It aids in reducing agricultural losses, safeguarding food security, and mitigating socio-economic losses. High-frequency drought monitoring can help to get accurate assessments of drought duration, frequency, and phases, and make appropriate decisions by policymakers. In this study, TVDI exhibits a lag compared to meteorological drought indices, and its accuracy in drought monitoring is compromised by cloud cover. These factors introduce disturbances to the precision of drought monitoring. Therefore, in future research, it is worth exploring the other types of drought indices by FY-4 series satellite and investigating combined applications between FY-4A and FY-4B. Additionally, the impact of cloud cover on drought indices might be addressed by improving cloud detection accuracy and utilizing intelligent algorithms to reconstruct data in cloud-covered areas.

Author Contributions

Conceptualization, H.L. and L.H.; methodology, Z.M.; software, Z.M.; validation, Y.L. (Yonghua Li), H.W. and B.L.; formal analysis, H.L.; investigation, Y.L. (Yuxia Li); resources, H.W.; data curation, B.L.; writing—original draft preparation, Z.M.; writing—review and editing, H.L. and L.H.; visualization, Y.L. (Yonghua Li); supervision, Y.L. (Yuxia Li); project administration, L.H. and H.L.; funding acquisition, H.W. All authors have read and agreed to the published version of the manuscript.

Funding

This research was funded by the National Key R&D Program of China (2022ZD0119505); Fengyun Satellite Application Advance Program of China Meteorological Administration, No. FY-APP-2021.0304; and the China Meteorological Administration Innovation and Development Project (CXFZ2022J031), Science and Technology Plan Project of Sichuan Province, No. 2023YFS0366.

Institutional Review Board Statement

Not applicable.

Informed Consent Statement

Not applicable.

Data Availability Statement

The data presented in this study are available from the corresponding author.

Acknowledgments

We would like to thank the National Climate Center for supporting the data acquisition of this experiment.

Conflicts of Interest

The author declares no conflict of interest.

References

  1. Xie, X.Y.; Li, A.N. Development of a topographic-corrected temperature and greenness model (TG) for improving GPP estimation over mountainous areas. Agric. For. Meteorol. 2020, 295, 108193–108205. [Google Scholar] [CrossRef]
  2. Karamesouti, M.; Panagos, P.; Kosmas, C. Model-based spatio-temporal analysis of land desertification risk in Greece. Catena 2018, 167, 266–275. [Google Scholar] [CrossRef]
  3. Zhu, X.; Xu, Z.; Liu, Z.; Liu, M.; Yin, Z.; Yin, L.; Zheng, W. Impact of dam construction on precipitation: A regional perspective. Mar. Freshw. Res. 2022, 74, 877–890. [Google Scholar] [CrossRef]
  4. Li, J.; Wang, Z.; Lai, C. Severe drought events inducing large decrease of net primary productivity in China’s mainland during 1982–2015. Sci. Total Environ. 2020, 703, 135541. [Google Scholar] [CrossRef] [PubMed]
  5. Li, Q.; He, P.; He, Y.; Han, X.; Zeng, T.; Lu, G.; Wang, H. Investigation to the relation between meteorological drought and hydrological drought in the upper Shaying River Basin using wavelet analysis. Atmos. Res. 2020, 234, 104743. [Google Scholar] [CrossRef]
  6. Xie, X.Y.; Li, A.N. An Adjusted Two-Leaf Light Use Efficiency Model for Improving GPP Simulations Over Mountainous Areas. J. Geophys. Res. Atmos. 2020, 125, e2019JD031702. [Google Scholar] [CrossRef]
  7. Vicente-Serrano, S.M.; López-Moreno, J.I. Hydrological response to different time scales of climatological drought: An evaluation of the Standardized Precipitation Index in a mountainous Mediterranean basin. Hydrol. Earth Syst. Sci. 2005, 9, 523–533. [Google Scholar] [CrossRef] [Green Version]
  8. Wei, K.; Ouyang, C.; Duan, H.; Li, Y.; Chen, M.; Ma, J.; An, H.; Zhou, S. Reflections on the Catastrophic 2020 Yangtze River Basin Flooding in Southern China. Innovation 2020, 1, 100038. [Google Scholar] [CrossRef]
  9. Chen, Z.; Liu, Z.; Yin, L.; Zheng, W. Statistical analysis of regional air temperature characteristics before and after dam construction. Urban Clim. 2022, 41, 101085. [Google Scholar] [CrossRef]
  10. Liu, Z.; Xu, J.; Liu, M.; Yin, Z.; Liu, X.; Yin, L.; Zheng, W. Remote sensing and geostatistics in urban water-resource monitoring: A review. Mar. Freshw. Res. 2023, 74, 747–765. [Google Scholar] [CrossRef]
  11. Li, Y.; Si, Y.; Tong, Z.; He, L.; Zhang, J.; Luo, S.; Gong, Y. MQANet: Multi-Task Quadruple Attention Network of Multi-Object Semantic Segmentation from Remote Sensing Images. Remote Sens. 2022, 14, 6256–6280. [Google Scholar] [CrossRef]
  12. Rhee, J.; Im, J.; Carbone, G.J. Monitoring agricultural drought for arid and humid regions using multi-sensor remote sensing data. Remote Sens. Environ. 2010, 114, 2875–2887. [Google Scholar] [CrossRef]
  13. He, L.; Peng, B.; Tang, D.; Li, Y. Road Extraction Based on Improved Convolutional Neural Networks with Satellite Images. Appl. Sci. 2022, 12, 10800–10811. [Google Scholar] [CrossRef]
  14. Anderson, M.; Kustas, W. Thermal Remote Sensing of Drought and Evapotranspiration. Eos Trans. Am. Geophys. Union 2008, 89, 233–240. [Google Scholar] [CrossRef]
  15. Mishra, A.K.; Singh, V.P. A review of drought concepts. J. Hydrol. 2010, 391, 202–216. [Google Scholar] [CrossRef]
  16. Xia, L.; Zhao, F.; Mao, K.B.; Yuan, Z.J.; Zuo, Z.Y.; Xu, T.R. SPI-Based Analyses of Drought Changes over the Past 60 Years in China’s Major Crop-Growing Areas. Remote Sens. 2018, 10, 171–186. [Google Scholar] [CrossRef] [Green Version]
  17. Mckee, T.B.; Doesken, N.J.; Kleist, J. The Relationship of Drought Frequency and Duration to Time Scales. In Proceedings of the Eighth Conference on Applied Climatology, Anaheim, CA, USA, 12–22 January 1993. [Google Scholar]
  18. Zhang, J.; Sun, F.; Lai, W.; Lim, W.H.; Liu, W.; Wang, T.; Wang, P. Attributing changes in future extreme droughts based on PDSI in China. J. Hydrol. 2019, 573, 607–615. [Google Scholar] [CrossRef]
  19. Vicente-Serrano, S.M.; Beguería, S.; López-Moreno, J.I. A Multiscalar Drought Index Sensitive to Global Warming: The Standardized Precipitation Evapotranspiration Index. J. Clim. 2010, 23, 1696–1718. [Google Scholar] [CrossRef] [Green Version]
  20. Won, J.; Choi, J.; Lee, O.; Kim, S. Copula-based Joint Drought Index using SPI and EDDI and its application to climate change. Sci. Total Environ. 2020, 744, 140701. [Google Scholar] [CrossRef] [PubMed]
  21. Peng, Y.; Li, F.D.; Xu, N.; Rashid, K.; Gao, K.C.; Wang, G.Q.; Zhang, Y.Y.; Qiao, Y.F.; Li, Y.H.; Yang, H.; et al. Spatial-temporal variations in drought conditions and their climatic oscillations in Central Asian from 1990 to 2019. Chin. J. Eco-Agric. 2021, 29, 312–324. [Google Scholar]
  22. Wu, B.F.; Ma, Z.H.; Yan, N. Agricultural drought mitigating indices derived from the changes in drought characteristics. Remote Sens. Environ. 2020, 244, 111813–111830. [Google Scholar] [CrossRef]
  23. Rouse, J.W.; Haas, R.H.; Schell, J.A.; Deering, D.W. Monitoring Vegetation Systems in the Great Plains with Erts. NASA Spec. Publ. 1974, 351, 309. [Google Scholar]
  24. Kogan, F.; Sullivan, J. Development of global drought-watch system using NOAA/AVHRR data. Adv. Space Res. 1993, 13, 219–222. [Google Scholar] [CrossRef]
  25. Wang, P.X.; Ya, G.J.; Li, X.W.; Wang, J.D. Advances in Drought Monitoring by Using Remotely Sensed Normalized Difference Vegetation Index and Land Surface Temperature Products. Adv. Earth Sci. 2003, 18, 527–533. [Google Scholar]
  26. Kang, Y.; Guo, E.L.; Wang, Y.F.; Bao, Y.L.; Bao, Y.H.; Na, R. Application of temperature vegetation dryness index for drought monitoring in Mongolian Plateau. J. Appl. Ecol. 2021, 32, 2534–2544. [Google Scholar]
  27. Huete, A.R. A soil-adjusted vegetation index (SAVI). Remote Sens. Environ. 1988, 25, 295–309. [Google Scholar] [CrossRef]
  28. Liu, Y.; Wu, L.X.; Ma, B.D. Remote sensing monitoring of soil Moisture on the basis of TM/ETM+ spectral space. J. China Univ. Min. Technol. 2013, 42, 296–301. [Google Scholar]
  29. Phillips, C.G. An Evaluation of Ecosystem Management and Its Application to the National Environmental Policy Act: The Case of the U.S. Forest Service. Agric. Syst. 1997, 108, 84–93. [Google Scholar]
  30. He, L.; Cheng, Y.; Li, Y.; Li, F.; Fan, K.; Li, Y. An Improved Method for Soil Moisture Monitoring With Ensemble Learning Methods Over the Tibetan Plateau. IEEE J. Sel. Top. Appl. Earth Obs. Remote Sens. 2021, 14, 2833–2844. [Google Scholar] [CrossRef]
  31. Sandholt, I.; Rasmussen, K.; Andersen, J. A simple interpretation of the surface temperature/vegetation index spacefor assessment of surface moisture status. Remote Sens. Environ. 2002, 79, 1710–1721. [Google Scholar] [CrossRef]
  32. Chen, Z.; Huang, W.; Shi, L.Y.; Qi, X.H. Analysis of differences in agricultural drought monitoring based on different TVDI indices in Fujian Province in 2018. J. Nat. Disasters 2021, 30, 233–243. [Google Scholar]
  33. Sha, S.; Wang, Y.; Wang, L.J.; Hu, D. Research of Application of Land Use Data to TVDI Method on Drought Monitoring in the Eastern Region of Gansu. Res. Soil Water Conserv. 2017, 24, 375–381. [Google Scholar]
  34. Xu, L.; Abbaszadeh, P.; Moradkhani, H.; Chen, N.; Zhang, X. Continental drought monitoring using satellite soil moisture, data assimilation and an integrated drought index. Remote Sens. Environ. 2020, 250, 112028–112044. [Google Scholar] [CrossRef]
  35. Yu, H.Z.; Li, L.J.; Li, J.Y. Establishment of comprehensive drought monitoring model based on downscaling TRMM and MODIS data. J. Nat. Resour. 2020, 35, 2553–2568. [Google Scholar] [CrossRef]
  36. Urban, M.; Berger, C.; Mudau, T.E.; Heckel, K.; Truckenbrodt, J.; Odipo, V.O.; Smit, I.P.J.; Schmullius, C. Surface Moisture and Vegetation Cover Analysis for Drought Monitoring in the Southern Kruger National Park Using Sentinel-1, Sentinel-2, and Landsat-8. Remote Sens. 2018, 10, 1482–1491. [Google Scholar] [CrossRef] [Green Version]
  37. Chen, X.; Liu, M.; Li, D.; Jia, J.; Yang, A.; Zheng, W.; Yin, L. Conv-trans dual network for landslide detection of multi-channel optical remote sensing images. Front. Earth Sci. 2023, 11, 1182145. [Google Scholar] [CrossRef]
  38. Yin, L.; Wang, L.; Keim, B.D.; Konsoer, K.; Zheng, W. Wavelet Analysis of Dam Injection and Discharge in Three Gorges Dam and Reservoir with Precipitation and River Discharge. Water 2022, 14, 567. [Google Scholar] [CrossRef]
  39. Goodarzi, M.R.; Pooladi, R.; Niazkar, M. Evaluation of Satellite-Based and Reanalysis Precipitation Datasets with Gauge-Observed Data over Haraz-Gharehsoo Basin, Iran. Sustainability 2022, 14, 13051. [Google Scholar] [CrossRef]
  40. Goodarzi, M.R.; Sabaghzadeh, M.; Niazkar, M. Evaluation of Snowmelt Impacts on Flood Flows Based on Remote Sensing Using SRM Model. Water 2023, 15, 1650. [Google Scholar] [CrossRef]
  41. Dubovik, O.; Schuster, G.L.; Xu, F.; Hu, Y.; Bösch, H.; Landgraf, J.; Li, Z. Grand Challenges in Satellite Remote Sensing. Front. Remote Sens. 2021, 2, 619818. [Google Scholar] [CrossRef]
  42. Wang, G.Q.; Shen, X. The FY-4 radiometer imager and the application of its data in satellite meteorology. Chin. J. Nat. 2018, 40, 1–11. [Google Scholar]
  43. Hu, T.; van Dijk, A.I.J.M.; Renzullo, L.J.; Xu, Z.; He, J.; Tian, S.; Zhou, J.; Li, H. On agricultural drought monitoring in Australia using Himawari-8 geostationary thermal infrared observations. Int. J. Appl. Earth Obs. Geoinf. 2020, 91, 102153–102165. [Google Scholar] [CrossRef]
  44. Barbosa, H.A.; Lakshmi Kumar, T.V.; Paredes, F.; Elliott, S.; Ayuga, J.G. Assessment of Caatinga response to drought using Meteosat-SEVIRI Normalized Difference Vegetation Index (2008–2016). ISPRS J. Photogramm. Remote Sens. 2019, 148, 235–252. [Google Scholar] [CrossRef]
  45. Li, Y.N.; Yu, W.J.; Xie, T.; Zhou, H.Z. Drought Disaster Monitoring and Drought Analysis Based on FY-4 AGRI and Himawari-8 AHI—A Case Study of the autumn drought in Hebei Province in 2018. J. Catastrophol. 2019, 34, 228–234. [Google Scholar]
  46. Aihua, L.; Yanchen, B. Comparison of Multi source Remote Sensing Thematic Information: Progresses, Problems and Prospects. Adv. Earth Sci. 2011, 26, 741. [Google Scholar]
  47. Zhao, Q.; Yu, L.; Du, Z.; Peng, D.; Hao, P.; Zhang, Y.; Gong, P. An Overview of the Applications of Earth Observation Satellite Data: Impacts and Future Trends. Remote Sens. 2022, 14, 1863. [Google Scholar] [CrossRef]
  48. Goodarzi, M.; Fatehifar, A.; Avazpoor, F. Bivariate Analysis of the Impact of Climate Change on Drought with SPEI Index and Coppola Functions (Case Study: Dugonbadan). Iran-Water Resour. Res. 2020, 15, 352–365. [Google Scholar]
  49. Zhang, C.; Wang, S.; Song, Y.; Cai, W. Research of Drought Risk Assessment for Winter Wheat in Northern China. J. Arid. Meteorol. 2014, 32, 883–893. [Google Scholar]
  50. Wang, S.; Zhang, C.; Song, L.; Li, Y.; Feng, J.; Wang, J. Relationship Between Soil Relative Humidity and the Multiscale Meteorological Drought Ilndexes. J. Glaciol. Geocryol. 2013, 35, 865–873. [Google Scholar]
  51. Qi, S.H.; Wang, C.Y.; Niu, Z. Evaluting Soil Moisture Status in China Using the Temperature/vegetation Dryness Index (TVDI). Natl. Remote Sens. Bull. 2003, 30, 420–427+436. [Google Scholar]
  52. GB/T 32136-2015; Grade of Agricultural Drought. National Standards of People’s Republic of China: Beijing, China, 2015; p. 20.
  53. GB/T 20481-2017; Grades of Meteorological Drought. National Standards of People’s Republic of China: Beijing, China, 2017; p. 32.
  54. Bofeng, C.; Rong, Y. Advance and evaluation in the long time series vegetation trends research based on remote sensing. Natl. Remote Sens. Bull. 2009, 13, 1170–1186. [Google Scholar]
  55. Goodarzi, M.R.; Sabaghzadeh, M.; Mokhtari, M.H. Impacts of aspect on snow characteristics using remote sensing from 2000 to 2020 in Ajichai-Iran. Cold Reg. Sci. Technol. 2022, 204, 103682. [Google Scholar] [CrossRef]
  56. Shang, H.Z.; Hussletu; Li, M.; Tao, J.H.; Chen, L.F. Remote Sensing of Cloud Properties Based on Visible-to-Ifrared Channel Observations from Passive Remote Sensing Satellites. Acta Opt. Sin. 2022, 42, 37–52. [Google Scholar]
  57. Yang, J.; Guo, X.; Qu, J.; Han, M. An FY-4A/AGRI cloud detection model based on the naive Bayes algorithm. Remote Sens. Nat. Resour. 2022, 34, 33–42. [Google Scholar]
  58. Zhang, D.; Yang, S.; Wang, Y.; Sun, L.; Gao, Y.; Zhu, H.; Ye, Q.Y. Assessing drought conditions over cloudy regions based on FY3C/VIRR LST. J. Nat. Resour. 2021, 36, 1047–1061. [Google Scholar] [CrossRef]
  59. Lu, Z.; Lei, G.P.; Ma, Q.L.; Guo, J.P.; Wang, J.W. Regional Drought Monitoring Based on Reconstructed Landsat 8 Data and Temperature Vegetation Index. Res. Soil Water Conserv. 2018, 25, 271–277+384. [Google Scholar]
  60. Wang, Z.D.; Guo, P.; Wan, H.; Yang, G. Analysis of Drought Monitoring in Shandong Province from 2014 to 2016 Based on MODIS Data. Res. Soil Water Conserv. 2019, 26, 330–336. [Google Scholar]
  61. Li, Y.; Peng, B.; He, L.; Fan, K.; Tong, L. Road segmentation of unmanned aerial vehicle remote sensing images using adversarial network with multiscale context aggregation. IEEE J. Sel. Top. Appl. Earth Obs. Remote Sens. 2019, 12, 2279–2287. [Google Scholar] [CrossRef]
  62. Xue, H.Z.; Li, Y.Y.; Dong, G.T. Analysis of Spatial-temporal Variation Characteristics of Meteorological Drought in the Hexi Corridor Based on SPEI index. Chin. J. Agrometeorol. 2022, 43, 923–934. [Google Scholar]
  63. Qu, X.B.; Wu, H.; Yue, K.; Liu, P.T.; Li, X.R. Comparison of 4 Remote Sensing Drought Indexes for Drought Monitoring in Eastern Inner Mongolia. J. Ecol. Rural. Environ. 2020, 36, 81–88. [Google Scholar]
  64. Wei, W.; Wenbin, W.; Qingbo, Z.; Mingwei, Z. Analysis and Calibration of Spectral Response Difference Effects on Measured NDVI with Separate Satellite Sensors. Remote Sens. Inf. 2015, 30, 91–98. [Google Scholar]
  65. Zhang, P.; Zhu, L.; Tang, S.; Gao, L.; Chen, L.; Zheng, W.; Han, X.; Chen, J.; Shao, J. General Comparison of FY-4A/AGRI with Other GEO/LEO Instruments and Its Potential and Challenges in Non-meteorological Applications. Front. Earth Sci. 2019, 6, 224. [Google Scholar] [CrossRef] [Green Version]
Figure 1. Land use type of three regions and the location of each region in China: (a) Huanghuai region, (b) Yunnan Province, (c) Guangdong Province.
Applsci 13 09122 g001
Figure 2. Illustration of Ts-NDVI feature space (a, b, and c are three vertices).
Applsci 13 09122 g002
Figure 3. The flowchart of TVDI calculation based on FY-4.
Applsci 13 09122 g003
Figure 4. TVDI and MCI site correlation and drought count statistics on TVDI pixels ((a,d) Huanghuai region; (b,e) Yunnan Province; (c,f) Guangdong Province).
Applsci 13 09122 g004
Figure 5. Correlation between TVDI and SHRI in (a)the Huanghuai region, (b) Yunnan Province, (c) and Guangdong Province.
Applsci 13 09122 g005
Figure 6. Sen-trend of TVDI ((a) Huanghuai region, (b) Yunnan, (c) Guangdong) and SRHI ((d) Huanghuai, (e) Yunnan, (f) Guangdong) in the study area.
Applsci 13 09122 g006
Figure 7. Trends of drought area in different drought intensities (Column (A): Huanghuai region; Column (B): Yunnan Province; Column (C): Guangdong Province region).
Applsci 13 09122 g007
Figure 8. Map of drought area difference: (a) Huanghuai region, (b) Yunnan Province, (c) Guangdong Province, (d) distribution of area difference among regions).
Applsci 13 09122 g008
Figure 9. The value of FY-4A and MODIS band: (a) NIR band; (b) IR band; (c) NDVI value.
Applsci 13 09122 g009
Figure 10. NDVI in the Huanghuai region: (a) FY-4A; (b) MODIS; (c) NDVI difference between MODIS and FY-4A.
Applsci 13 09122 g010
Figure 11. Comparison of droughts in the Huanghuai region: (a) FY-4A, (b) MODIS, (c) MCI.
Applsci 13 09122 g011
Figure 12. TVDI drought classification map calculated by FY-4A and Landsat-8 in Huanghuai region: FY-4A (eh); Landsat-8 (ad).
Applsci 13 09122 g012
Figure 13. Difference between LST (a) and NDVI (b) for FY-4A and FY-4B.
Applsci 13 09122 g013
Figure 14. The proportion of area on FY-4 and FY-4B TVDI.
Applsci 13 09122 g014
Figure 15. (a) NIR band before cloud detection, (b) IR band before cloud detection, (c) true color image of FY-4A, (d) NIR to IR ratio, (e) NDVI map, (f) CLM cloud detection product (the red square might be clouded).
Applsci 13 09122 g015
Table 1. Classification criteria for TVDI, MCI, and SRHI.
Drought TypeTVDIMCISRHI (%)
Drought free[0, 0.4](−0.5, +∞)[60, 100]
Light drought(0.4, 0.6](−1, −0.5][50, 60)
Moderate drought(0.6, 0.8](−1.5, −1][40, 50)
Severe drought(0.8, 1](−2, −1.5][30, 40)
Extreme drought-(−∞, −2][0, 30)
Table 2. Summary of the bands and products for FY-4A, MODIS, and Landsat-8.
DatasetsBand (Products)Temporal ResolutionSpatial ResolutionWavelength Band (µm)
MODISRed1, 8, 16 days250 m0.620–0.670
NIR250 m0.841–0.876
LST8 days1000 m-
Landsat-8Red16 days30 m0.64–0.67
NIR30 m0.85–0.88
TIRS 130 m10.6–11.19
FY-4ARed15 min500 m0.55–0.75
NIR1000 m0.75–0.90
LST4000 m-
Table 3. Statistical results of the TVDI produced by FY-4A, MODIS, and Landsat-8.
DatasetsNum of ImagesStandard DeviationRMSE (with FY-4A)Value RangeProcessing Time (min)
MODIS4/2 days0.150.26[0.13, 0.97]5.56
Landsat-835/16 days0.350.13[0.08, 0.93]17.31
FY-4A4/h
165/day
0.26-[0.02, 0.98]3.15
Disclaimer/Publisher’s Note: The statements, opinions and data contained in all publications are solely those of the individual author(s) and contributor(s) and not of MDPI and/or the editor(s). MDPI and/or the editor(s) disclaim responsibility for any injury to people or property resulting from any ideas, methods, instructions or products referred to in the content.

