Communication

Modeling Dynamic Hysteresis Curves in Amorphous Magnetic Ribbons

1
Faculty of Electrical Engineering, Częstochowa University of Technology, 42-201 Częstochowa, Poland
2
Faculty of Technical Sciences Čačak, University of Kragujevac, 32102 Čačak, Serbia
*
Authors to whom correspondence should be addressed.
Appl. Sci. 2023, 13(16), 9134; https://doi.org/10.3390/app13169134
Submission received: 14 July 2023 / Revised: 9 August 2023 / Accepted: 9 August 2023 / Published: 10 August 2023
(This article belongs to the Special Issue Magnetic Materials: Characterization and Sensing Application)

Abstract

:
A description of magnetic hysteresis is important for the prediction of losses in soft magnetic materials. In this paper, a viscosity-type equation is used to describe dynamic hysteresis loops in an amorphous ring core for symmetric excitation, as prescribed by international standards. The value of the exponent appearing in the viscosity-based equation can be assumed to be constant if the maximum induction is away from the saturation value. The viscosity-type equation is used to describe the shape variation of magnetization curves due to eddy currents in different time and space scales. Modeling is carried out for various excitation frequencies and induction amplitudes. The discrepancies between the experimental and modeled curves (and also losses) are acceptable in the wide range of the frequency and maximum induction. The paper indicates that the viscosity-type effects, mostly due to eddy currents generated in the conductive material, play an important role in energy dissipation at increased excitation frequencies. The modeling results might be interesting to the designers of magnetic circuits.

1. Introduction

The present paper is a follow up of previous research devoted to modeling hysteresis curves under an increased excitation frequency [1]. The aim of the paper is to demonstrate the usefulness of a viscous-type equation, considered previously by Zirka et al. [2], as a means to describe the so-called excess field component. Previously, the equation was applied to describe hysteresis loops of non-oriented electrical steel sheets with a different thickness. In the present paper, the approach is applied to another soft magnetic material, namely the amorphous material Metglas, which has not been considered in the existing literature.
Amorphous magnetic materials are alloys of either Co, Fe, or Ni metals or their combinations—around 80%—and other chemical elements (B, C, Ge, P, or Si). They are non-crystalline, and exhibit a glass-like structure [3,4]. Depending on chemical composition, these alloys exhibit different magnetic properties:
-
materials with a high iron (Fe) content achieve high values of saturation polarization and low values of coercive field strength (Js = 1.3 T, Hc = 10 A/m);
-
those that include both iron and nickel (Ni) attain high values of initial and maximum permeabilities (μi = 15 × 103, μmax = 200–400 × 103);
-
cobalt (Co)-based alloys have extremely high values of initial and maximum permeabilities (μi = 100 × 103, μmax = 200–600 × 103), and a very low magnetostriction coefficient (λS < 0.2 × 10⁻⁶).
Amorphous magnetic ribbons are produced in the quenching process, and the molten metal is driven onto the surface of a rotating copper drum and subject to cooling [4]. The complex morphology of quenched amorphous materials results in their unique magnetic properties. This issue has been addressed in a number of publications for example in the classical textbooks [5] and review papers [6,7]. In the present communication, we do not go into the details of processing technologies and underlying physics, instead focusing on macroscopic properties of ready-made ribbon cores available commercially, as their users.
An example of a commercial magnetic material with an amorphous structure is the alloy with the nominal composition Fe-Si-B, produced by the American company Allied Signal under the brand-name Metglas (abbreviation from “metallic glass”). This alloy exhibits saturation induction around 1.3–1.5 T, a coercive field strength of Hc < 5 A/m, and a maximum permeability of μmax = 120.000.
The application scope for amorphous magnetic alloys is quite wide, ranging from energy-saving distribution transformers [4,8,9,10,11] to sensors of different physical quantities [12,13,14,15]. In the latter case, the sensor output response may become affected by eddy currents induced in the conductive core material. A similar situation occurs during the magnetization of cylinder-shaped (commonly referred to as “toroid”) magnetic cores, as examined in the present communication. The objective of the paper is to examine whether it is possible to describe the widening of hysteresis loops in a relatively simple way.

2. Measurements

Measurements of hysteresis curves and related quantities (e.g., coercive field strength and power losses) for a cylinder-shaped commercial Metglas sample (dimensions: inner diameter, d = 40 mm; outer diameter, D = 48 mm; height, h = 10 mm; mass, m = 24 g; density, ρ = 7180 kg/m3; and number of windings, 100/100 for the excitation/measurement circuit) were carried out in accordance with the international standard IEC 60404-6 [16]. In particular, the form factor of the secondary voltage was kept within the prescribed value 1.111 ± 1%. Figure 1 depicts a general overview of the measurement setup used.
The measured signals are the voltage drop u ( t ) on the resistor R in the magnetizing circuit of the sample and the electromotive force e ( t ) induced in the measurement winding z p of the sample. The relationship between instant values of voltage u ( t ) and magnetic field strength H ( t ) is determined from Ampère’s law.
u ( t ) = l   H ( t )   R z m
where l is the magnetic path length in the sample and z m is the number of windings in the magnetizing coil, whereas R is the value of resistance. The relationship between instant values of induced electromotive force e ( t ) and induction B ( t ) follows from the law of electromagnetic induction and is given as
e ( t ) = z p   S   d B d t
where z p is the number of windings in the measurement coil, and S is the cross-section area of the measured sample. The measured signals allow one to determine the quantities and the parameters that characterize magnetic properties of the examined sample. During processing, they are forwarded to input amplifiers, which adjust the levels of analogue input signals to levels required by digital circuits. After adjustment, the signals are subject to sampling in Sample and Hold (S/H) converters; subsequently, they are quantized in the Analogue/Digital (A/D) converter switched to successive measurement channels by the multiplexer. The time dependencies of the measured signals in the digital form are subject to post-processing and, after some computations, the parameters of individual quantities are determined. This is the so-called method of signal representation. The system operates in the on-line mode, which is supervised using a digital computer, which additionally carries out necessary computations and controls the setting of a prescribed magnetization level, the presentation and archiving of the results, etc. In the system, all signal processing operations are carried out in the digital form. Pre-magnetization to a prescribed level is carried out using the block of signal generation with the digital synthesis method. More details (capabilities, uncertainties, etc.) on the measurement setup used in measurements may be found from the producer’s website [17]. The main features are a peak magnetic flux density of more than 2 T; peak magnetic field strength of several kA/m (depending on the core dimensions); maximal frequency of 2000 Hz; preservation of the sinusoidal shape of B ( t ) ; and high stability, resolution, and accuracy of measured signals for a wide range of input excitations.
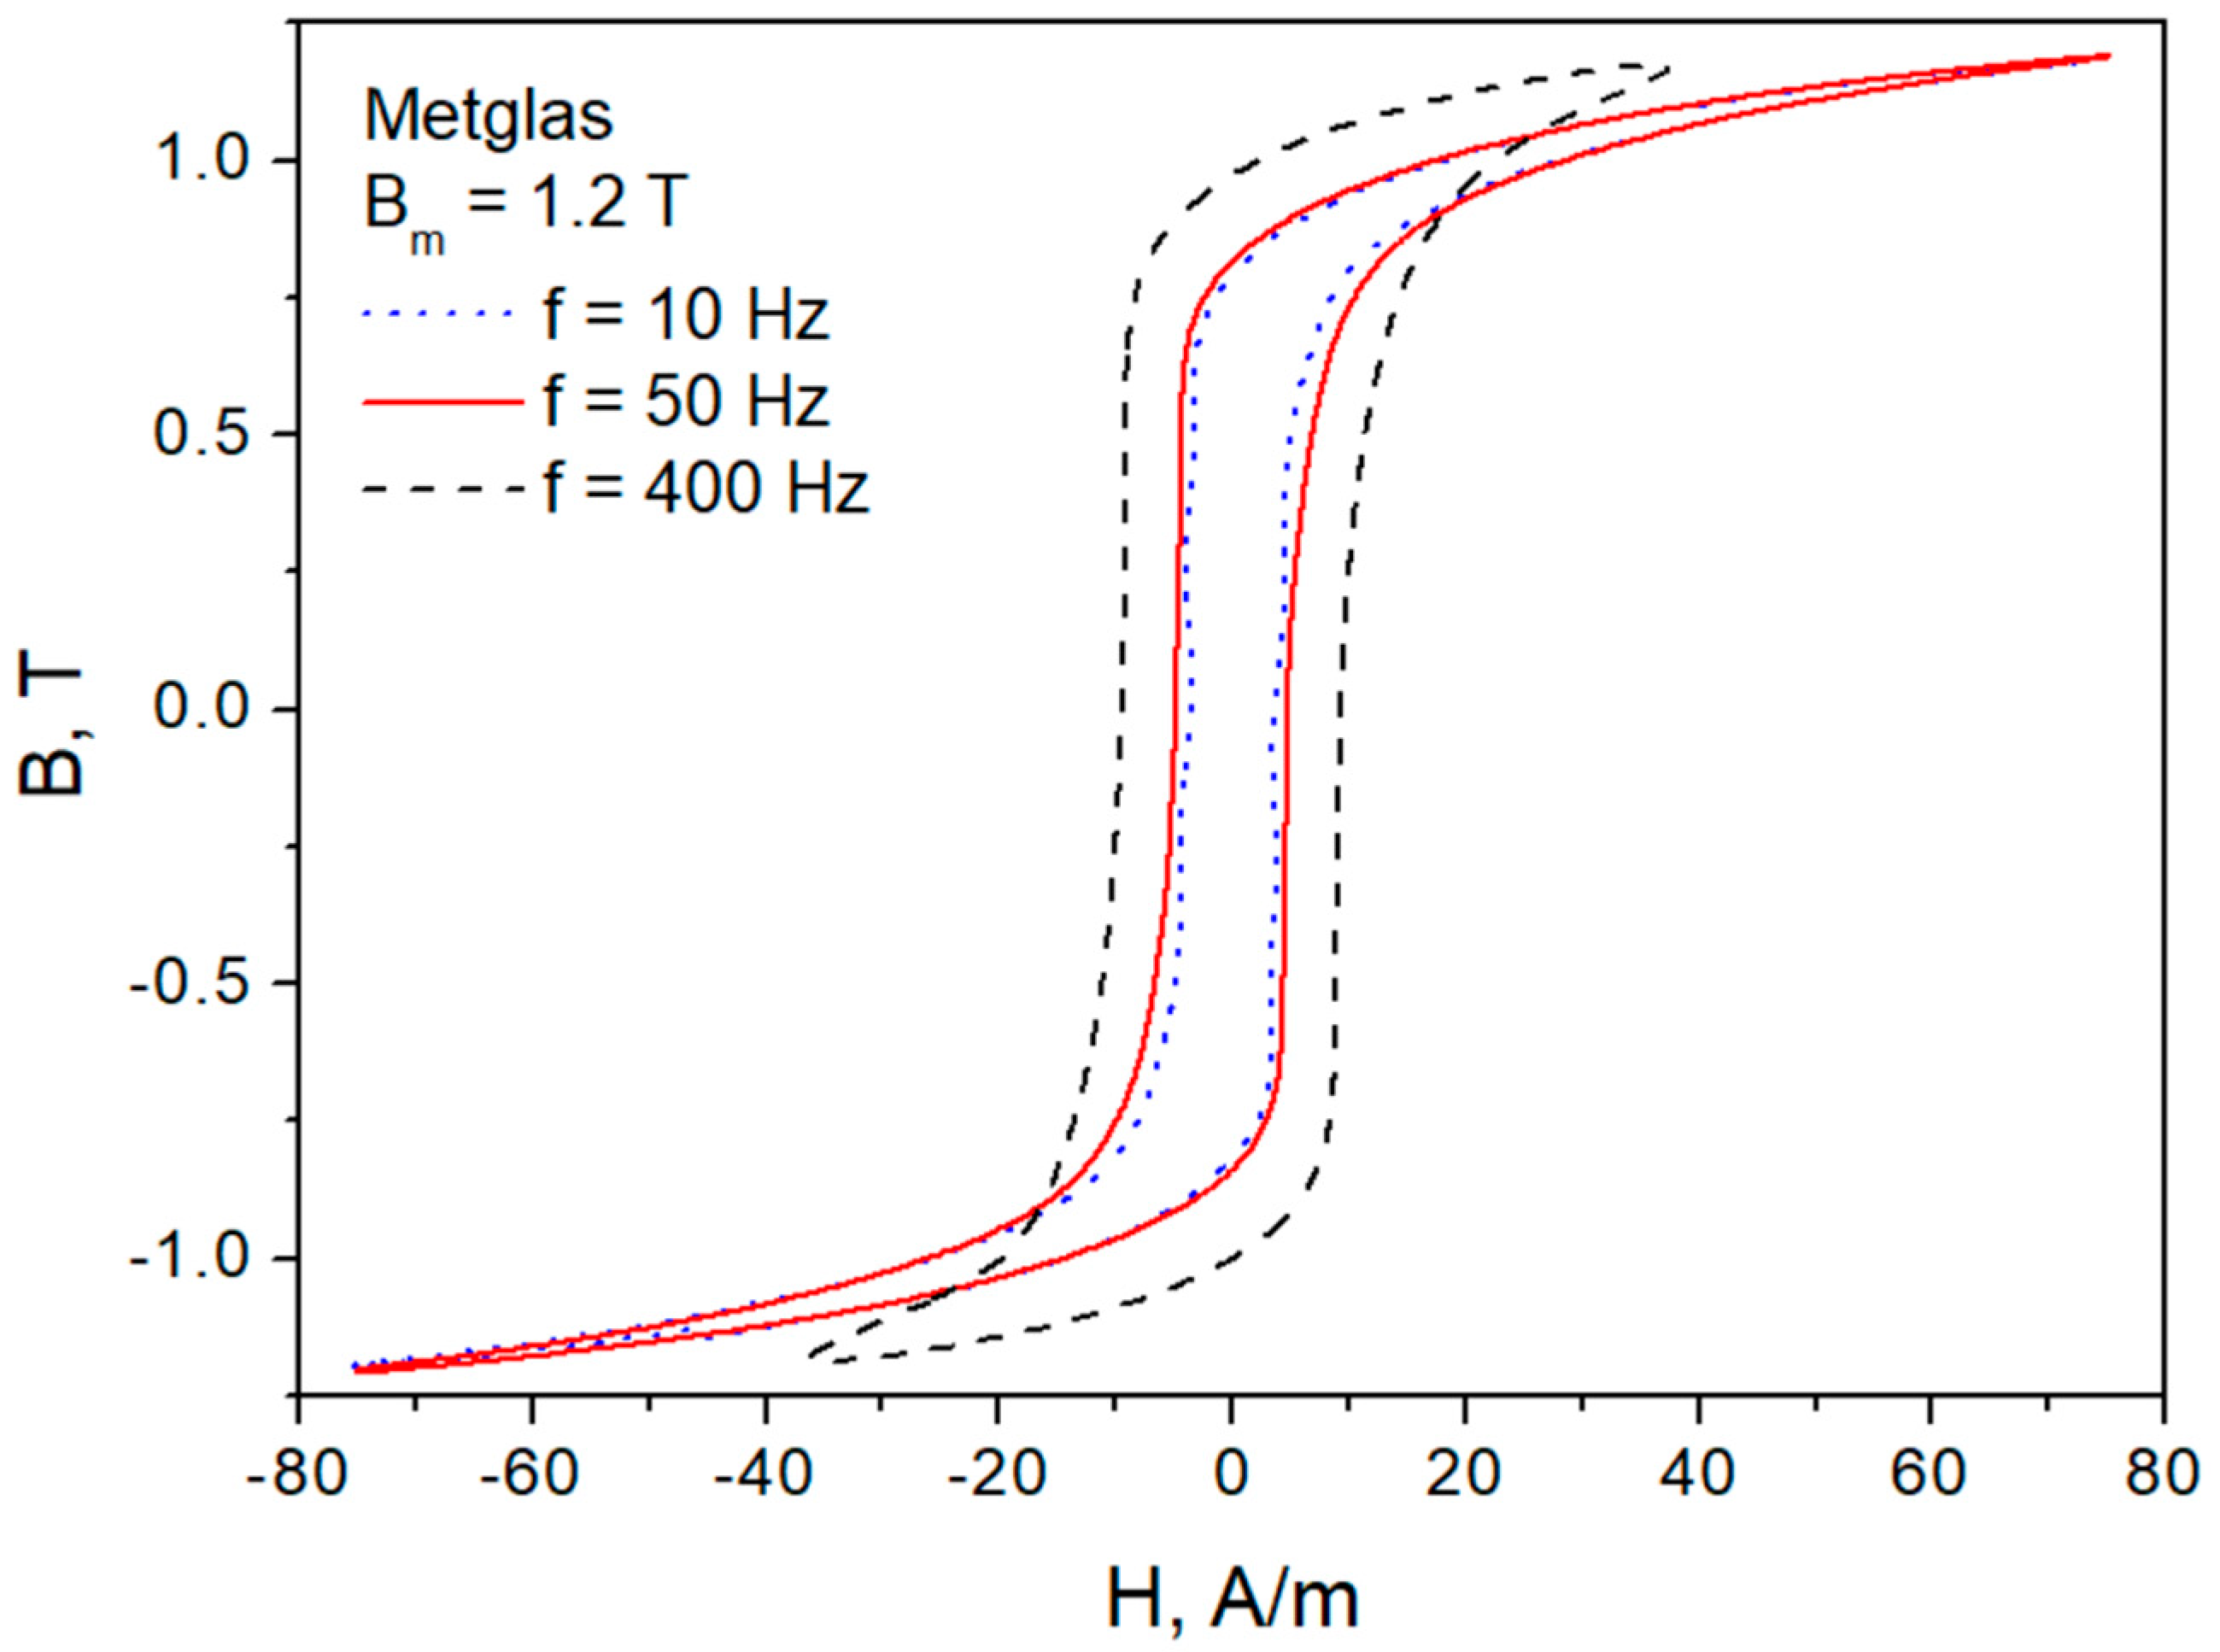
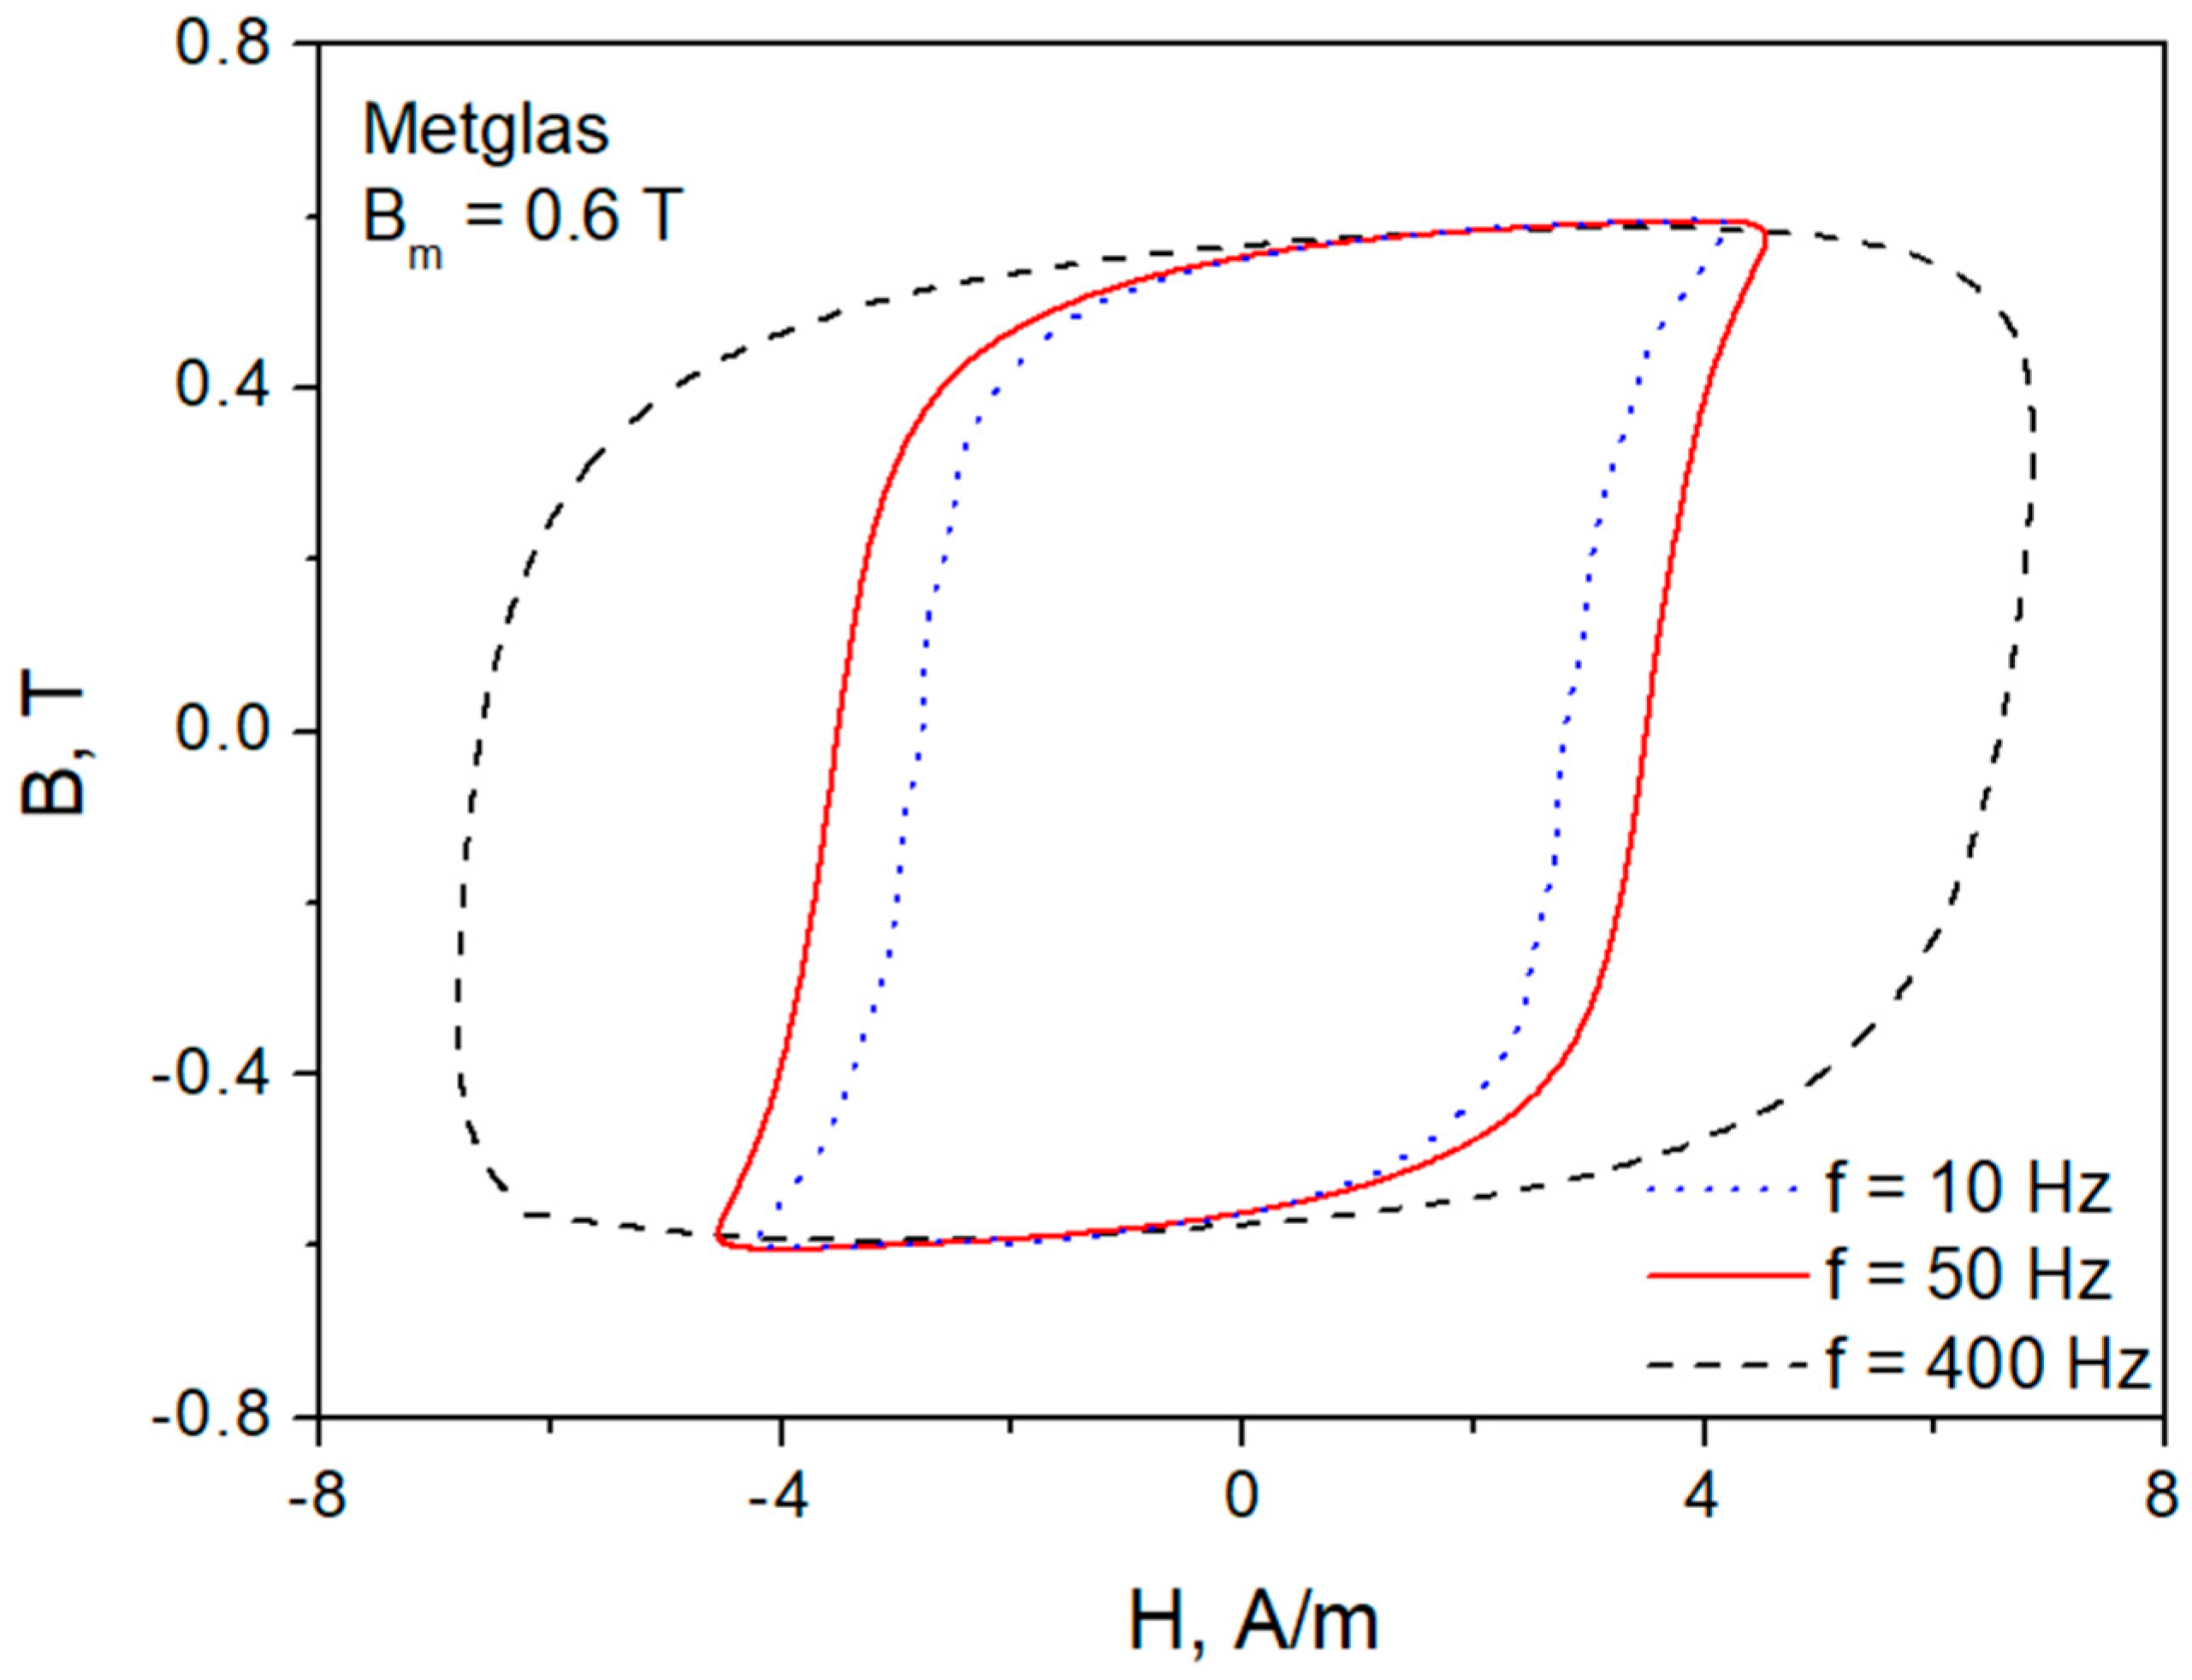
Figure 2 and Figure 3 depict hysteresis curves for two levels of an induction amplitude ( B m = 1.2 T corresponds, approximately, to technical saturation) and for three excitation frequencies. A frequency of f = 10 Hz is chosen to mimic quasi-static excitation conditions, and f = 50 Hz is the working frequency in most countries worldwide, excluding the Americas; thus, it is of practical importance, whereas f = 400 Hz is the highest excitation frequency in the measurement setup for which the form factor could be preserved within the prescribed limits for the examined sample and the sample could be driven up to conditions approaching technical saturation. The significant difference in loop shapes at lower and higher frequencies (particularly the increase in coercive field strength) is due mostly to the effect of eddy currents, which, according to the Lenz rule, induce their own magnetic field (the so-called “reaction” field) in the material, thus affecting the outcome profile of the magnetic field.

3. The Viscous-Type Equation

The issue of loss separation in soft magnetic materials may be tackled from different perspectives, and a recent review on the subject can be found in [1]. Here, we follow the so-called two-term separation scheme, in which field strength at an increased excitation frequency is computed from
H ( t ) = H stat ( B ) + [ 1 r ( B ) d B d t ] 1 / ν
in which H stat ( B ) corresponds to the material response under slow driving (quasi-static excitation); the exponent 1 / ν is fractional, and it accounts for viscous effects mostly due to eddy currents in different time and spatial scales in the conductive material, whereas r ( B ) = K [ 1 ( B / J sat ) 2 ] , where J sat is the saturation polarization and the proportionality coefficient K is found to vary both on induction and its rate, K = K ( B , d B / d t ) [1].
We chose the two-component loss separation scheme as the preferred one, since it is naturally rooted in Maxwell equations [18,19,20,21]. As noticed by Young [22], it is a common practice to neglect displacement currents in the calculation of eddy currents in conducting media. Thus, from the Poynting theorem (which considers energy dissipated in a unit volume of a ferromagnetic material), it follows that there would be just two components, which we interpret as related to two distinct physical phenomena, namely hysteresis and eddy currents generated in the conductive material in different time and spatial scales [19]. This interpretation is in the spirit of the statement found in the classical paper by Graham, Jr.: “The physical origin of losses in conducting ferromagnetic materials is Joule heating caused by the flow of eddy currents around moving domain walls” [23].
It should be remarked that more than 40 years ago, in Japan, there were successful attempts to describe dynamic losses in amorphous materials under an increased excitation frequency using fractional-type relationships [24,25]. The consideration of both loss terms related to eddy currents flowing in bulk (macroscale) and around moving domain walls (the so-called excess or abnormal losses) as a single quantity in which the dependence on excitation frequency is given as a fractional allows one to avoid a number of interpretational problems, particularly as far as the quasi-static regime is considered [19,26,27]. Fractional power laws related to anomalous diffusion in ferromagnets have recently been the subject of considerable research, and [28,29,30] can be mentioned as representative examples.
As indicated in the previous study [1], the starting point for the analysis is the dependence of coercive field strength vs. frequency. Figure 4 depicts the experimental dependence H c = H c ( f ) for the examined Metglas core.
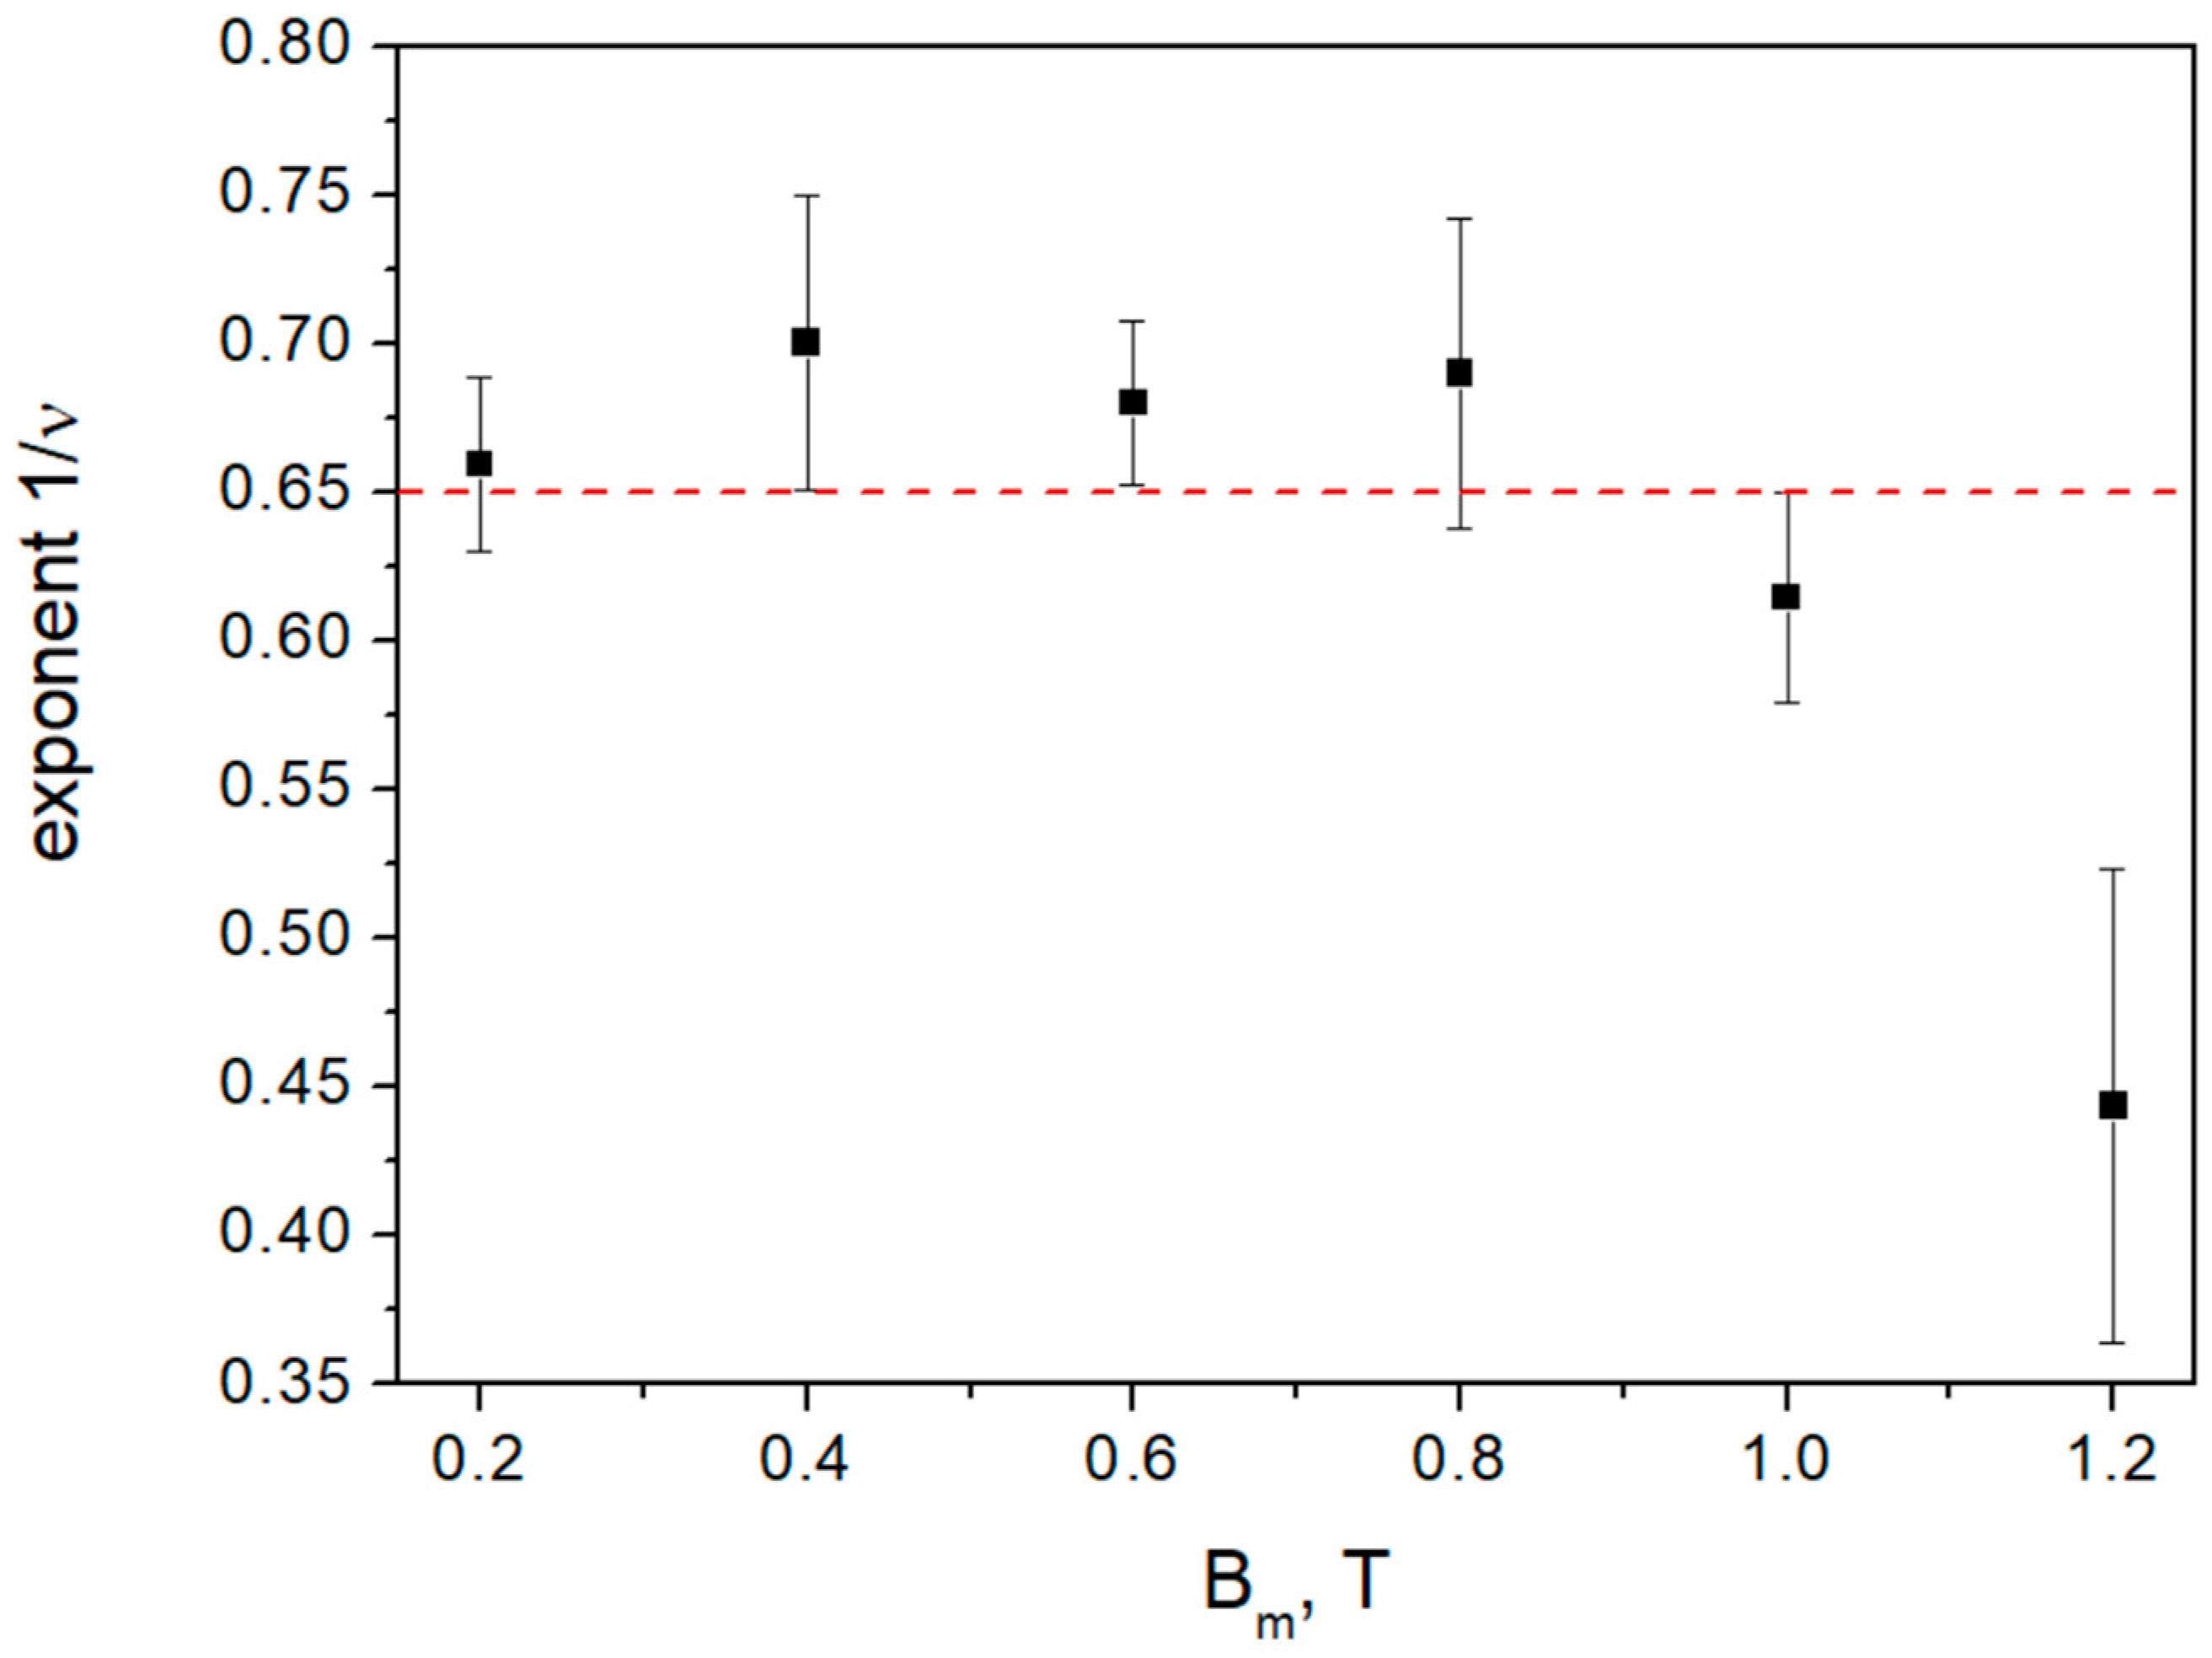
The dependencies H c = H c ( f ) were fitted to a relationship, power law + free term, and thus H c = H c 0 + c   f 1 / ν . It was found that the value of exponent 1 / ν varied depending on induction amplitude; however, in a quite wide range of induction amplitude, it could be set and fixed to 1 / ν = 0.65 (apart from the technical saturation region). A different (significantly smaller) value of exponent 1 / ν for B m = 1.2 T may suggest the onset of some other dissipation mechanism observed for high induction levels. The dependence of the 1 / ν value vs. induction amplitude is depicted in Figure 5.
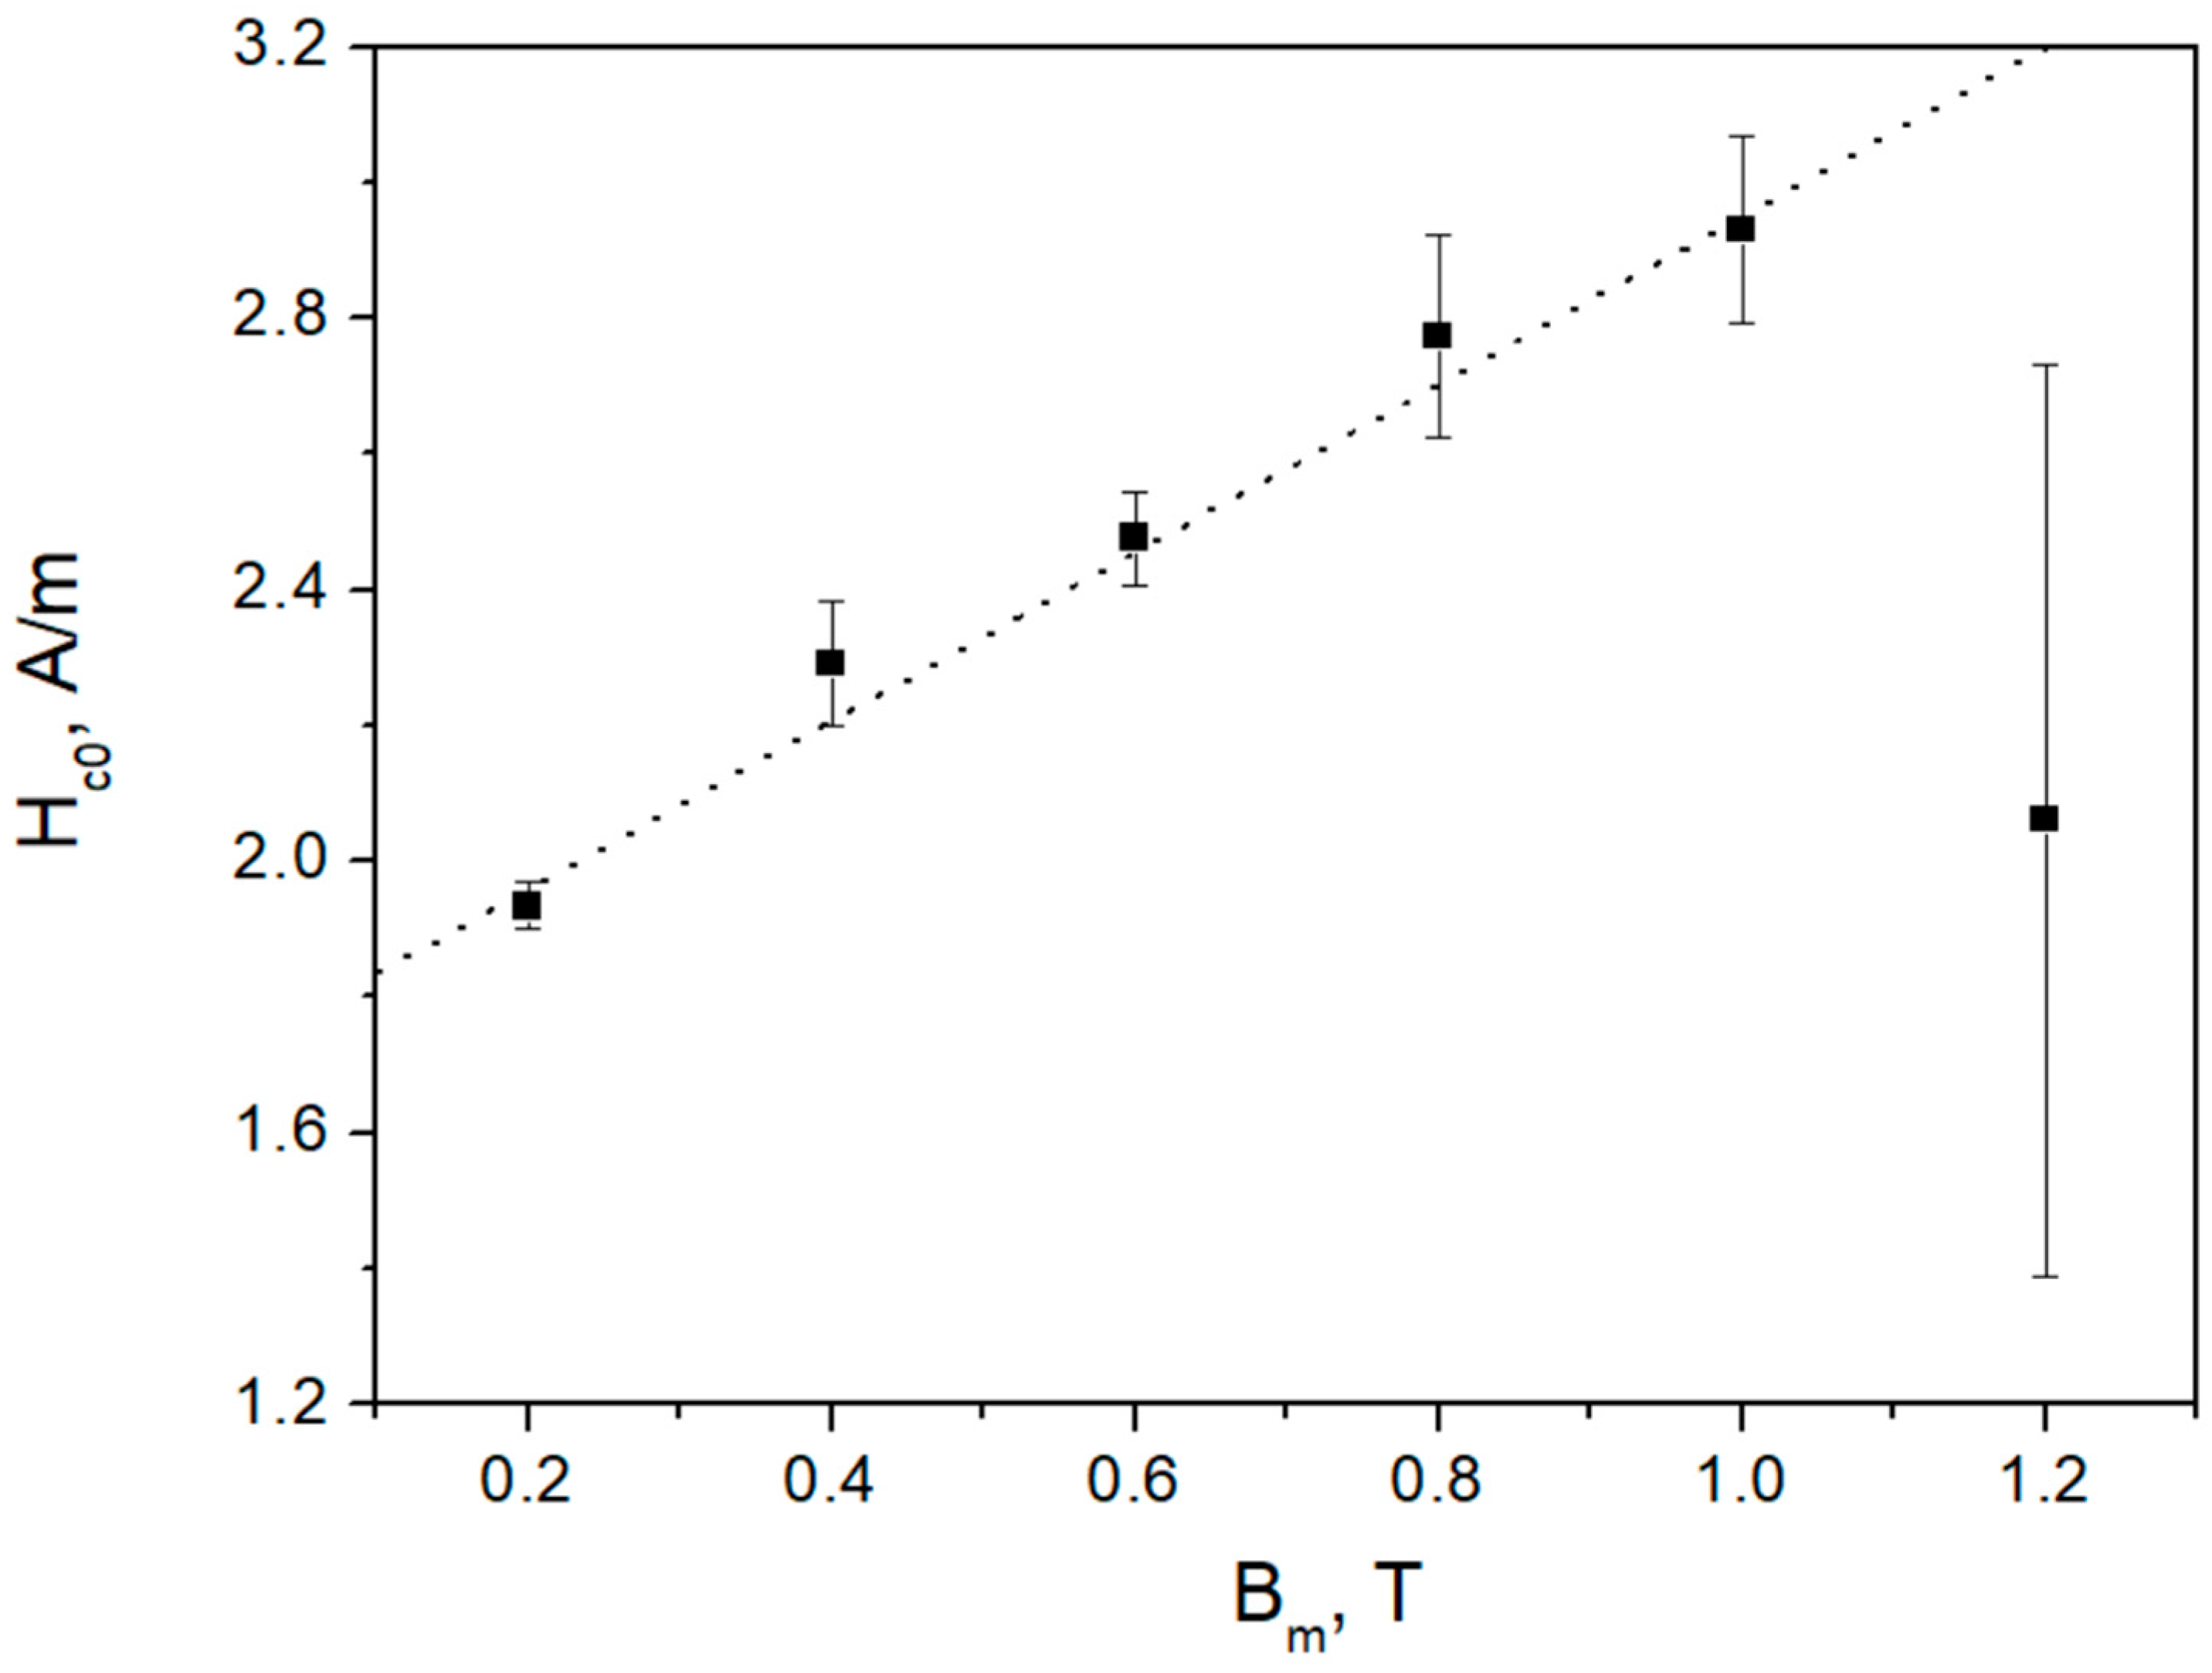
Figure 6 depicts the dependence of the free term H c 0 vs. induction amplitude. It can be noticed that in a wide range of induction values, this dependence may be described with a straight line. The dashed line represents the relationship H c 0 = 1.71 + 1.24 B m . The non-zero residual value of the coercive field may be related to residual stress introduced in the ribbon during core assembly.
It is evident from the inspection of Figure 2 and Figure 3 that hysteresis loops in quasi-static magnetization conditions for the considered core are regular and may be easily described, e.g., using the phenomenological description based on the arctangent function [31,32] or another convenient model [33,34]. However, in the present paper, we follow the approach outlined in [1] and take the experimentally determined H = H ( B ) curves as a reference in order to avoid additional errors inevitably introduced by the representations of quasi-static hysteresis curves.

4. Modeling Results

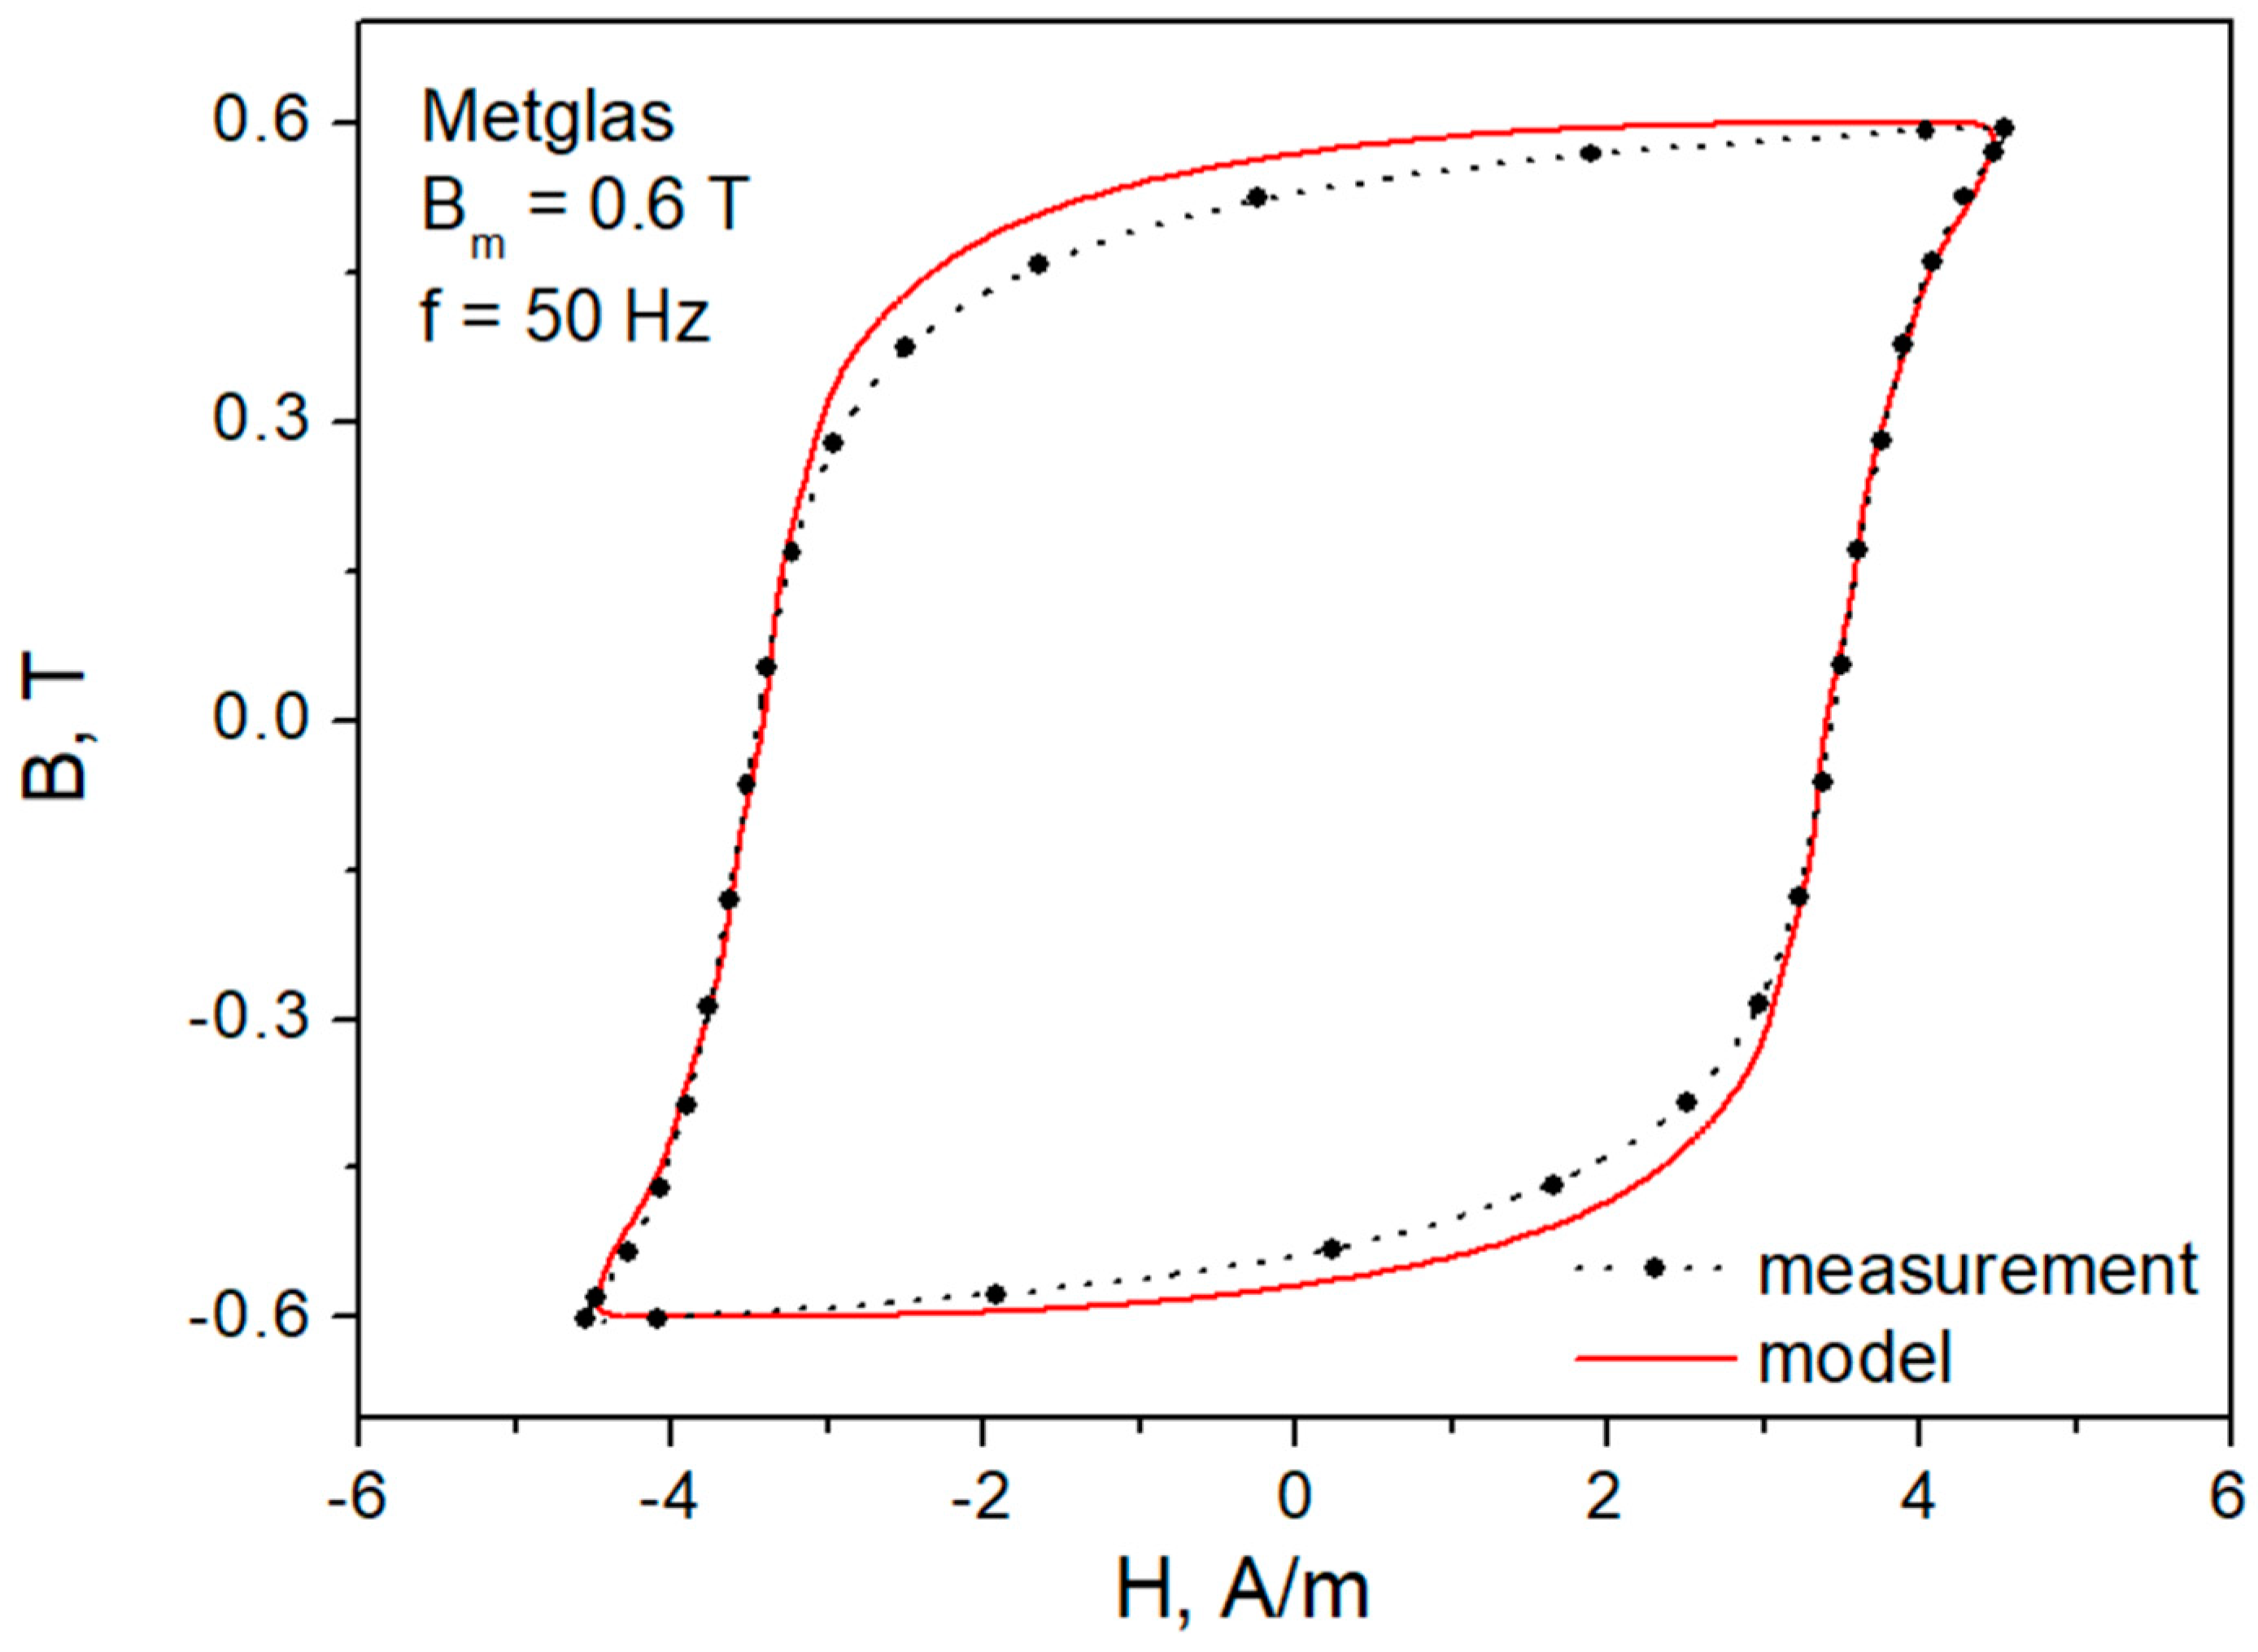
Figure 7 depicts a visual comparison between the measured (also shown in Figure 4) and the modeled minor loop for B m = 0.6 T and f = 50 Hz. It can be stated that the shape of the measured hysteresis loop is very well reproduced. The value of the normalization constant K was equal to 0.0025 in this case.
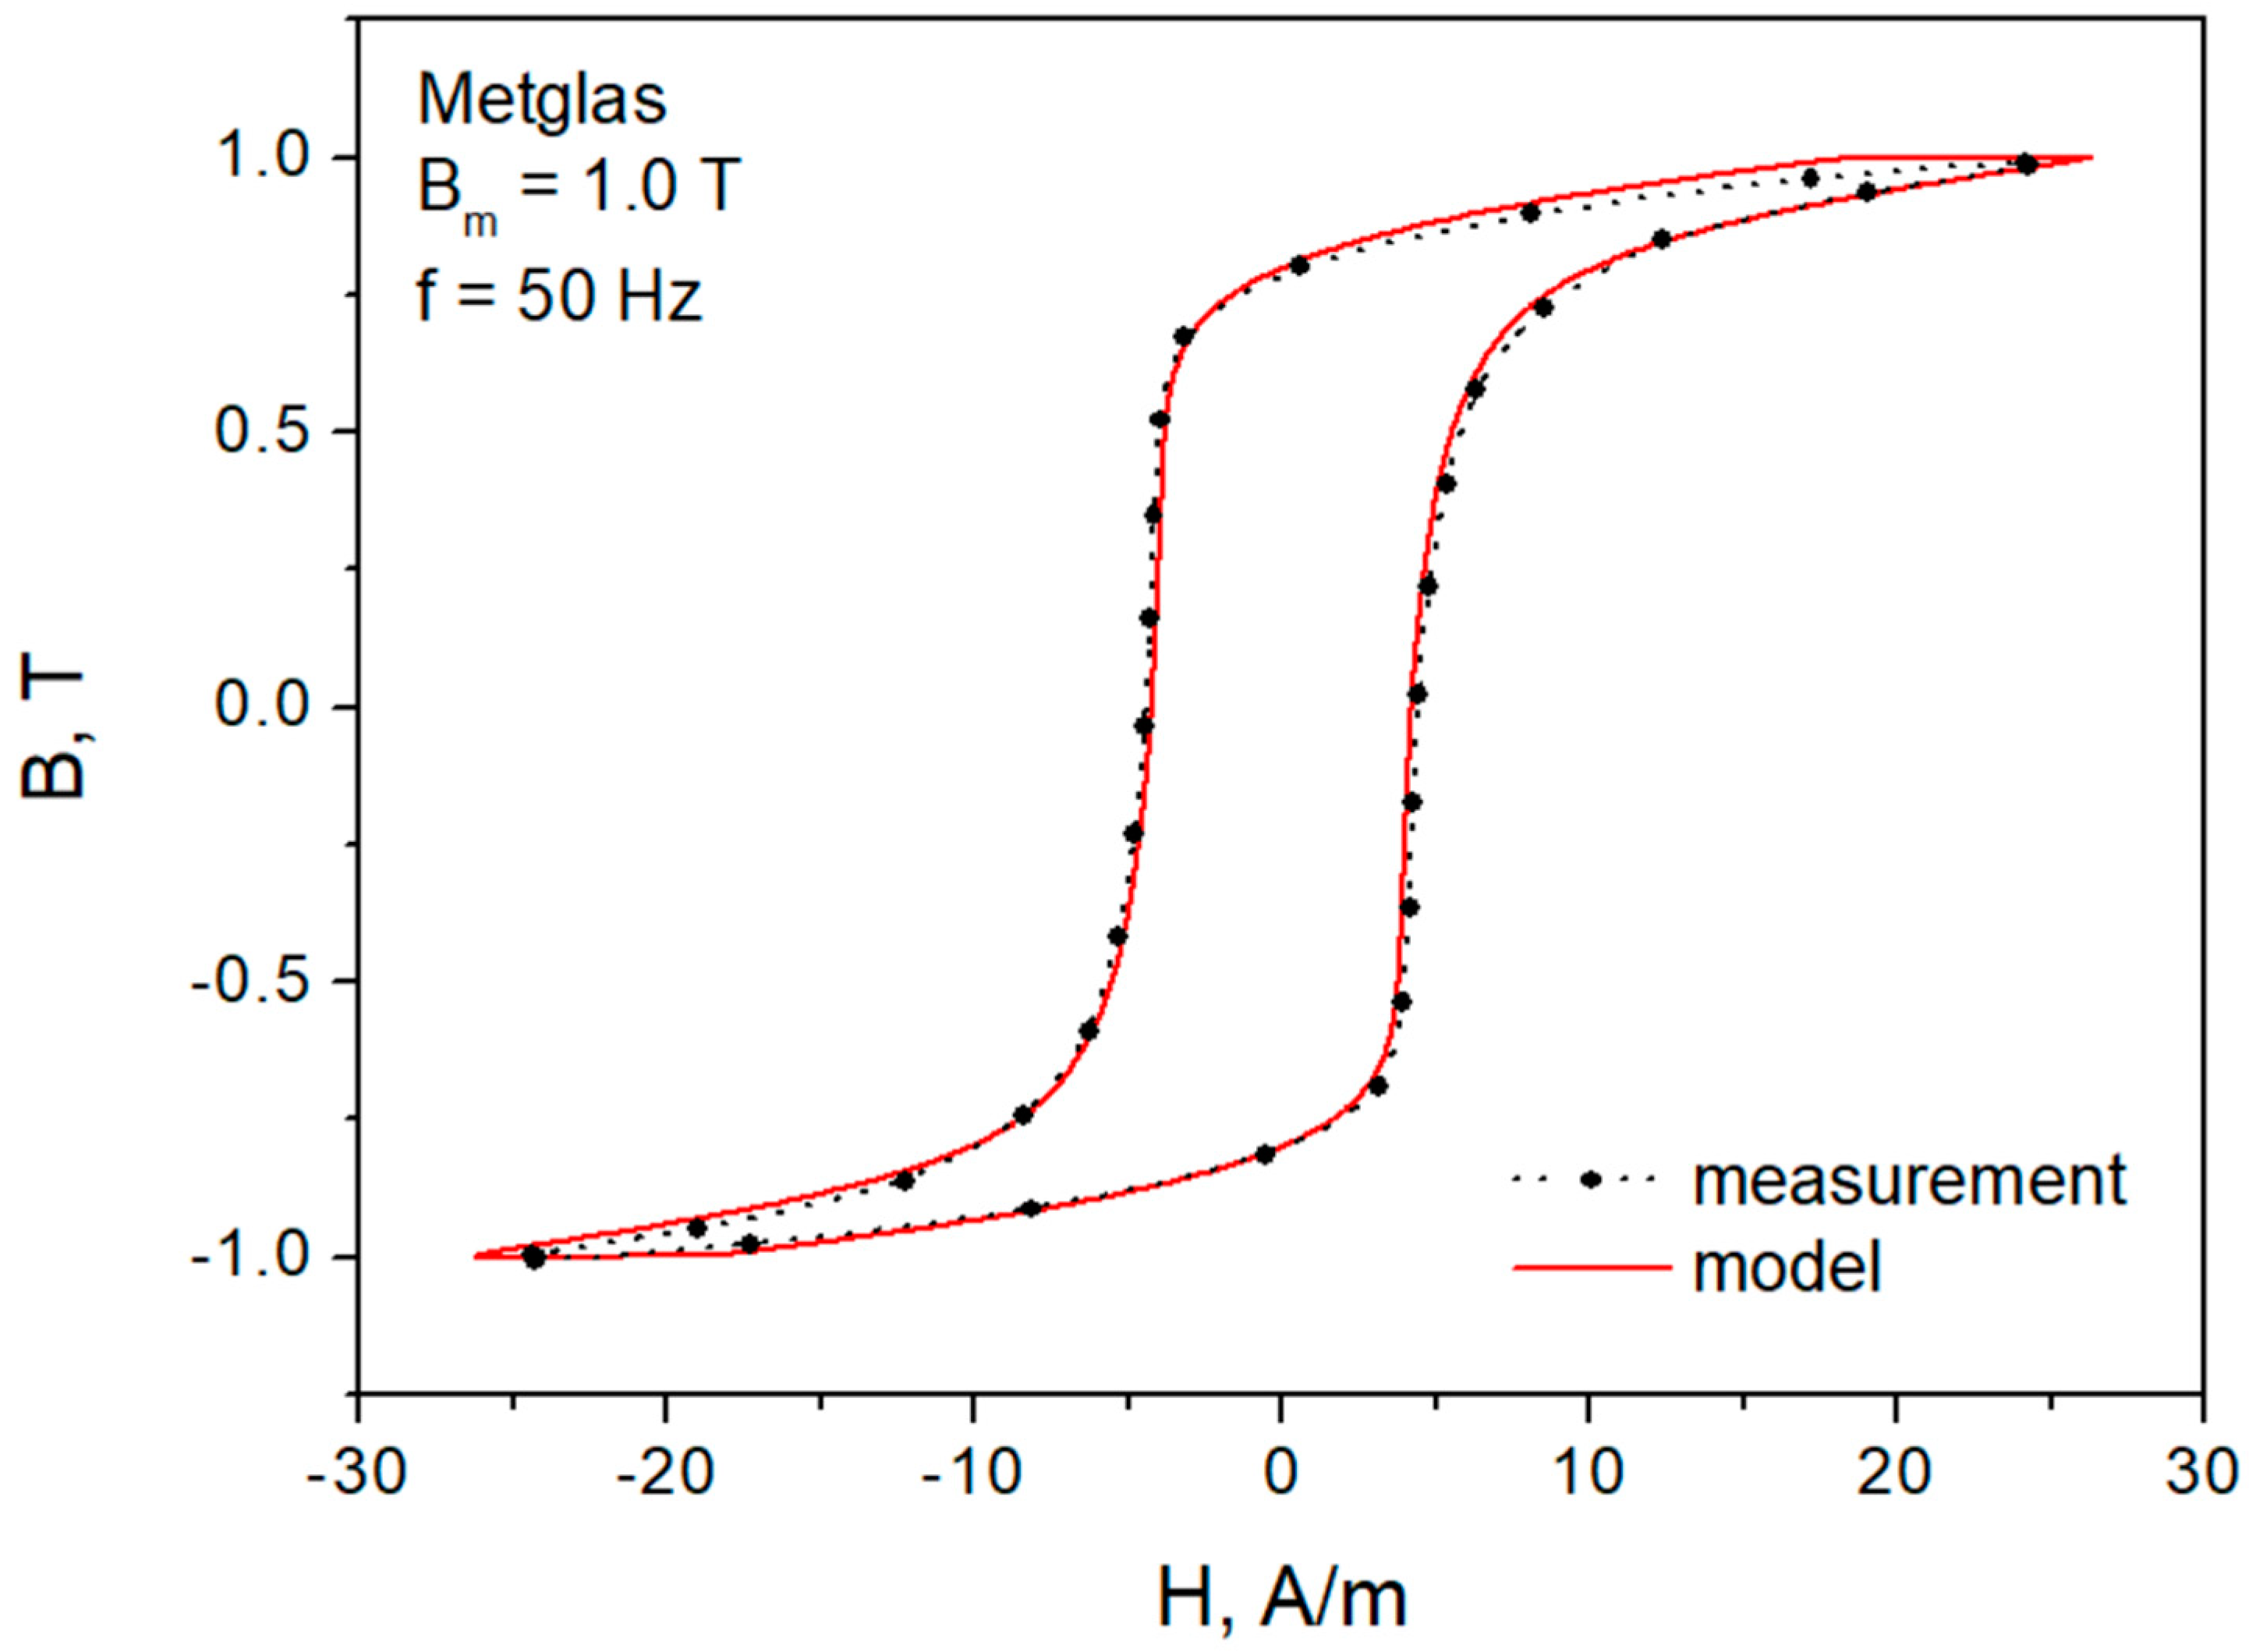
Figure 8 depicts a visual comparison between the measured (also shown in Figure 3) and the modeled minor loop for B m = 1.0 T and f = 400 Hz. The value of the normalization constant K was equal to 0.214 in this case. The experimental hysteresis loop is quite well reproduced using the model.
Figure 9 depicts a visual comparison between the measured (also shown in Figure 3) and the modeled minor loop for B m = 1.2 T and f = 400 Hz. It can be stated that the shape of the measured hysteresis loop is qualitatively reproduced using the model, which underestimates the value of the dynamic coercive field strength and reaches higher values of field strength at loop tips. The value of the normalization constant K was equal to 757.6 in this case. The model underestimates power loss density, computed from the numerical integration of the hysteresis loop area by 24.4% (the modeled value is 2.01 W/kg, whereas the measured one is 2.66 W/kg). The discrepancies may be due to fixing the exponent value 1 / ν to 0.65 and may be the result of model simplification.

5. Conclusions

In this communication, we applied the viscosity-based equation to the description of dynamic hysteresis loops of a Metglas cylinder-shaped core. Previously, the approach was applied to describe dynamic hysteresis loops of NO steel. Despite some discrepancies between the measured and the modeled loops being noticeable (cf. Figure 9), we believe that the simplicity of the considered approach makes it an interesting alternative to approaches based on three-term separation schemes.
It can be stated that the introduction of the viscous-type equation given as Equation (3) in the present communication is, in most cases, a sufficient means to describe the variation of the hysteresis loop shape under an increased excitation frequency. The results may be interesting to the designers of magnetic circuits and to physicists alike.

Author Contributions

Conceptualization, S.D., M.R., B.K. and K.C.; methodology, B.K. and K.C.; software, S.D. and M.R.; validation, P.J., M.N. and T.S.; formal analysis, D.K.; investigation, S.D. and B.K.; resources, M.N. and K.C.; data curation, T.S. and D.K.; writing—original draft preparation, K.C., S.D. and B.K.; writing—review and editing, P.J. and M.N.; visualization, T.S. and D.K.; supervision, B.K.; project administration, M.R.; funding acquisition, M.N., B.K. and K.C. All authors have read and agreed to the published version of the manuscript.

Funding

The authors are grateful to Marek Lis, the Dean of the Faculty of Electrical Engineering, Częstochowa University of Technology for partial financial support to cover the APC from statutory funds for research carried out at the Faculty of Electrical Engineering, CUT, BS/PB-3-300-301/11/20/P.

Institutional Review Board Statement

Not applicable.

Informed Consent Statement

Not applicable.

Data Availability Statement

Data are available from the corresponding author upon request.

Acknowledgments

The Project was supported within the framework of Program No. 020/RID/2018/19 “Regional Initiative of Excellence” granted by the Minister of Science and High Education in the years 2019–2023 (the amount of funding: PLN 12,000,000). From the Program, the costs of mutual visits of B.K., M.R., P.J., M.N., T.S., D.K. and K.C. to Częstochowa/Čačak, respectively, were covered, leading to fruitful discussions that stimulated the joint cooperation. This study was supported by the Ministry of Science, Technological Development and Innovation of the Republic of Serbia, and these results are part of Grant No. 451-03-47/2023-01/200132 with the University of Kragujevac, Faculty of Technical Sciences Čačak.

Conflicts of Interest

The authors declare no conflict of interest.

References

  1. Chwastek, K. The effects of sheet thickness and excitation frequency on hysteresis loops of non-oriented electrical steel. Sensors 2022, 22, 7873. [Google Scholar] [CrossRef] [PubMed]
  2. Zirka, S.; Moroz, Y.; Marketos, P.; Moses, A. Dynamic hysteresis modeling. Phys. B Condens. Matter 2004, 343, 90–95. [Google Scholar] [CrossRef]
  3. Boll, R. Weichmagnetische Werkstoffe: Einführung in den Magnetismus. VAC-Werkstoffe und ihre Anwendung (Soft Magnetic Materials: Introduction into Magnetism. VAC Products and their Applications); Publicis Corporate Auflage: Hanau, Germany, 1990. (In German) [Google Scholar]
  4. Najgebauer, M. Advances in contemporary soft magnetic materials—A review. In Proceedings of the 10th International Conference on Electrical, Electronics and Computer Engineering (IcETRAN), East Sarajevo, Bosnia and Herzegovina, 5–8 June 2023. [Google Scholar]
  5. Zallen, R. The Physics of Amorphous Solids. A Wiley-Interscience Publication; John Wiley & Sons, Inc.: New York, NY, USA, 1998. [Google Scholar]
  6. McHenry, M.E.; Willard, M.A.; Laughin, D.E. Amorphous and nanocrystalline materials for applications as soft magnets. Prog. Mat. Sci. 1999, 44, 291–433. [Google Scholar] [CrossRef]
  7. Davies, H.A.; Gibbs, M.R.J. Amorphous alloys. In Handbook of Magnetism and Advanced Magnetic Materials; Kronmüller, H., Parkin, S., Eds.; John Wiley & Sons, Inc.: New York, NY, USA, 2007. [Google Scholar]
  8. Najgebauer, M.; Chwastek, K.; Szczygłowski, J. Modern soft magnetic materials in „environment-friendly” transformer cores. Prz. Elektrotechniczn. 2003, 79, 930–932. [Google Scholar]
  9. Hasegawa, R.; Azuma, D. Impacts of amorphous metal-based transformers on energy efficiency and environment. J. Magn. Magn. Mater. 2008, 20, 2451–2456. [Google Scholar] [CrossRef]
  10. Najgebauer, M.; Chwastek, K.; Szczygłowski, J. Energy efficient distribution transformers. Prz. Elektrotechniczn. 2011, 87, 111–114. [Google Scholar]
  11. Daichi, A.; Naoki, I.; Motoki, O. Recent progress in Fe-based amorphous and nanocrystalline soft magnetic materials. J. Magn. Magn. Mater. 2020, 501, 166373. [Google Scholar]
  12. Wang, Y.; Li, J.; Viehland, D. Magnetoelectrics for magnetic sensor applications: Status, challenges and perspectives. Mater. Today 2014, 17, 269–275. [Google Scholar]
  13. Reis, S.; Silva, M.P.; Castro, N.; Correia, V.; Martins, P.; Lasheras, A.; Gutierrez, J.; Barandiarán, J.M.; Rocha, J.G.; Lanceros-Mendez, S. Characterization of Metglas/poly (vinylidene fluoride)/Metglas magnetoelectric laminates for AC/DC magnetic sensor applications. Mater. Des. 2016, 92, 906–910. [Google Scholar]
  14. Salach, J.; Szewczyk, R.; Bieńkowski, A.; Jackiewicz, D. Analysis and computer modeling of magnetoelastic characteristics of FeNi-based amorphous ring-shaped core under uniform compressive and tensile stresses. Theor. Appl. Inform. 2013, 25, 29–40. [Google Scholar]
  15. Caposciutti, G.; Spaletta, A.; Maracci, M.; Tellini, B.; Trigona, C.; Baglio, S. Force sensing utilizing a CoFeSiB microwire: A preliminary study. In Proceedings of the 2023 IEEE International Instrumentation and Measurement Technology Conference (12MTC), Kuala Lumpur, Malaysia, 22–25 May 2023. [Google Scholar] [CrossRef]
  16. IEC 60404-6:2018; Magnetic Materials—Part 6: Methods of Measurement of the Magnetic Properties of Magnetically Soft Metallic and Powder Materials at Frequencies in the Range 20 Hz to 100 Khz by the Use of Ring Specimens. International Electrotechnical Commission: Geneva, Switzerland. Available online: https://webstore.iec.ch/publication/27825 (accessed on 22 July 2023).
  17. Available online: https://rjmeasurement.com.pl/index.php/en/offer/measuring-devices-for-magnetically-soft-materials (accessed on 22 July 2023).
  18. Barranger, J. Hysteresis and Eddy-Current Losses of a Transformer Lamination Viewed as an Application of the Poynting Theorem; NASA Technical Note TN D-3114; National Aeronautics and Space Administration: Washington, DC, USA, 1965; Available online: https://core.ac.uk/download/pdf/80676116.pdf (accessed on 30 June 2023).
  19. Chwastek, K. AC loss density component in electrical steel sheets. Philos. Mag. Lett. 2010, 90, 809–817. [Google Scholar] [CrossRef]
  20. de Leon, F.; Qaseer, L.; Cohen, J. AC power from Poynting Theorem: Identification of the power components of magnetic saturating and hysteretic circuits. IEEE Trans. Power Deliv. 2012, 27, 1548–1556. [Google Scholar]
  21. Jabłoński, P.; Najgebauer, M.; Bereźnicki, M. An Improved Approach to Calculate Eddy Current Loss in Soft Magnetic Materials Based on Measured Hysteresis Loops. Energies 2022, 15, 2869. [Google Scholar] [CrossRef]
  22. Young, F.J. On the Validity of Characterizing Eddy Current Phenomena by Parabolic Partial Differential Equations. IEEE Trans. Magn. 1978, 14, 1185–1186. [Google Scholar] [CrossRef]
  23. Graham, C.D., Jr. Physical origin of losses in conducting ferromagnetic materials (invited). J. Appl. Phys. 1982, 53, 8276–8280. [Google Scholar] [CrossRef]
  24. Sakaki, Y.; Imagi, S.-I. Eddy current losses in polycrystalline and amorphous soft magnetic materials. Trans. Inst. Electr. Eng. Japan. A 1981, 101, 575–581. [Google Scholar]
  25. Sakaki, Y.; Imagi, S.-I. Relationship between eddy current losses and equivalent number of domain walls in polycrystalline and amorphous soft magnetic materials and its application to minor loop loss estimation. IEEE Trans. Magn. 1982, 18, 1840–1842. [Google Scholar]
  26. De Wulf, M.; Dupré, L.; Melkebeek, J. Quasistatic measurements for hysteresis modeling. J. Appl. Phys. 2000, 87, 5239–5241. [Google Scholar] [CrossRef]
  27. De Wulf, M.; Makaveev, D.; Dupré, L.; Permiakov, V.; Melkebeek, J. Comparison of methods for the determination of dc-magnetic properties of laminated SiFe alloys. J. Appl. Phys. 2003, 93, 8543–8545. [Google Scholar] [CrossRef]
  28. Ducharne, B.; Sebald, G.; Guyomar, S.; Litak, G. Fractional model of magnetic field penetration into a toroidal soft ferromagnetic sample. Int. J. Dyn. Control 2018, 6, 89–96. [Google Scholar] [CrossRef] [Green Version]
  29. Ducharne, B.; Tsafack, Y.A.; Tene Deffo, A.; Zhang, B.; Sebald, G. Fractional operators for the magnetic dynamic behavior of ferromagnetic specimens: An overview. AIP Adv. 2021, 11, 035309. [Google Scholar] [CrossRef]
  30. Ducharne, B.; Tsafack, Y.A.; Tene Deffo, A.; Zhang, B.; Sebald, G. Anomalous fractional magnetic field diffusion through cross-section of a massive toroidal ferromagnetic core. Commun. Nonlin. Sci. Numer. Simul. 2021, 92, 105450. [Google Scholar]
  31. Milovanović, A.; Koprivica, B. Mathematical Model of Major Hysteresis Loop and Transient Magnetizations. Electromagnetics 2015, 35, 155–166. [Google Scholar] [CrossRef]
  32. Koprivica, B.; Milovanović, A.; Mitrović, N. Mathematical modelling of frequency-dependent hysteresis and energy loss of FeSiB amorphous alloy. J. Magn. Magn. Mater. 2017, 422, 37–42. [Google Scholar] [CrossRef]
  33. De Santis, V.; Di Francesco, A.; D’Aloia, A.G. A numerical comparison between Preisach, J-A and D-D-D hysteresis models in computational electromagnetics. Appl. Sci. 2023, 13, 5181. [Google Scholar]
  34. Mörée, G.; Leijon, M. Review of hysteresis models for magnetic materials. Energies 2023, 16, 3980. [Google Scholar]
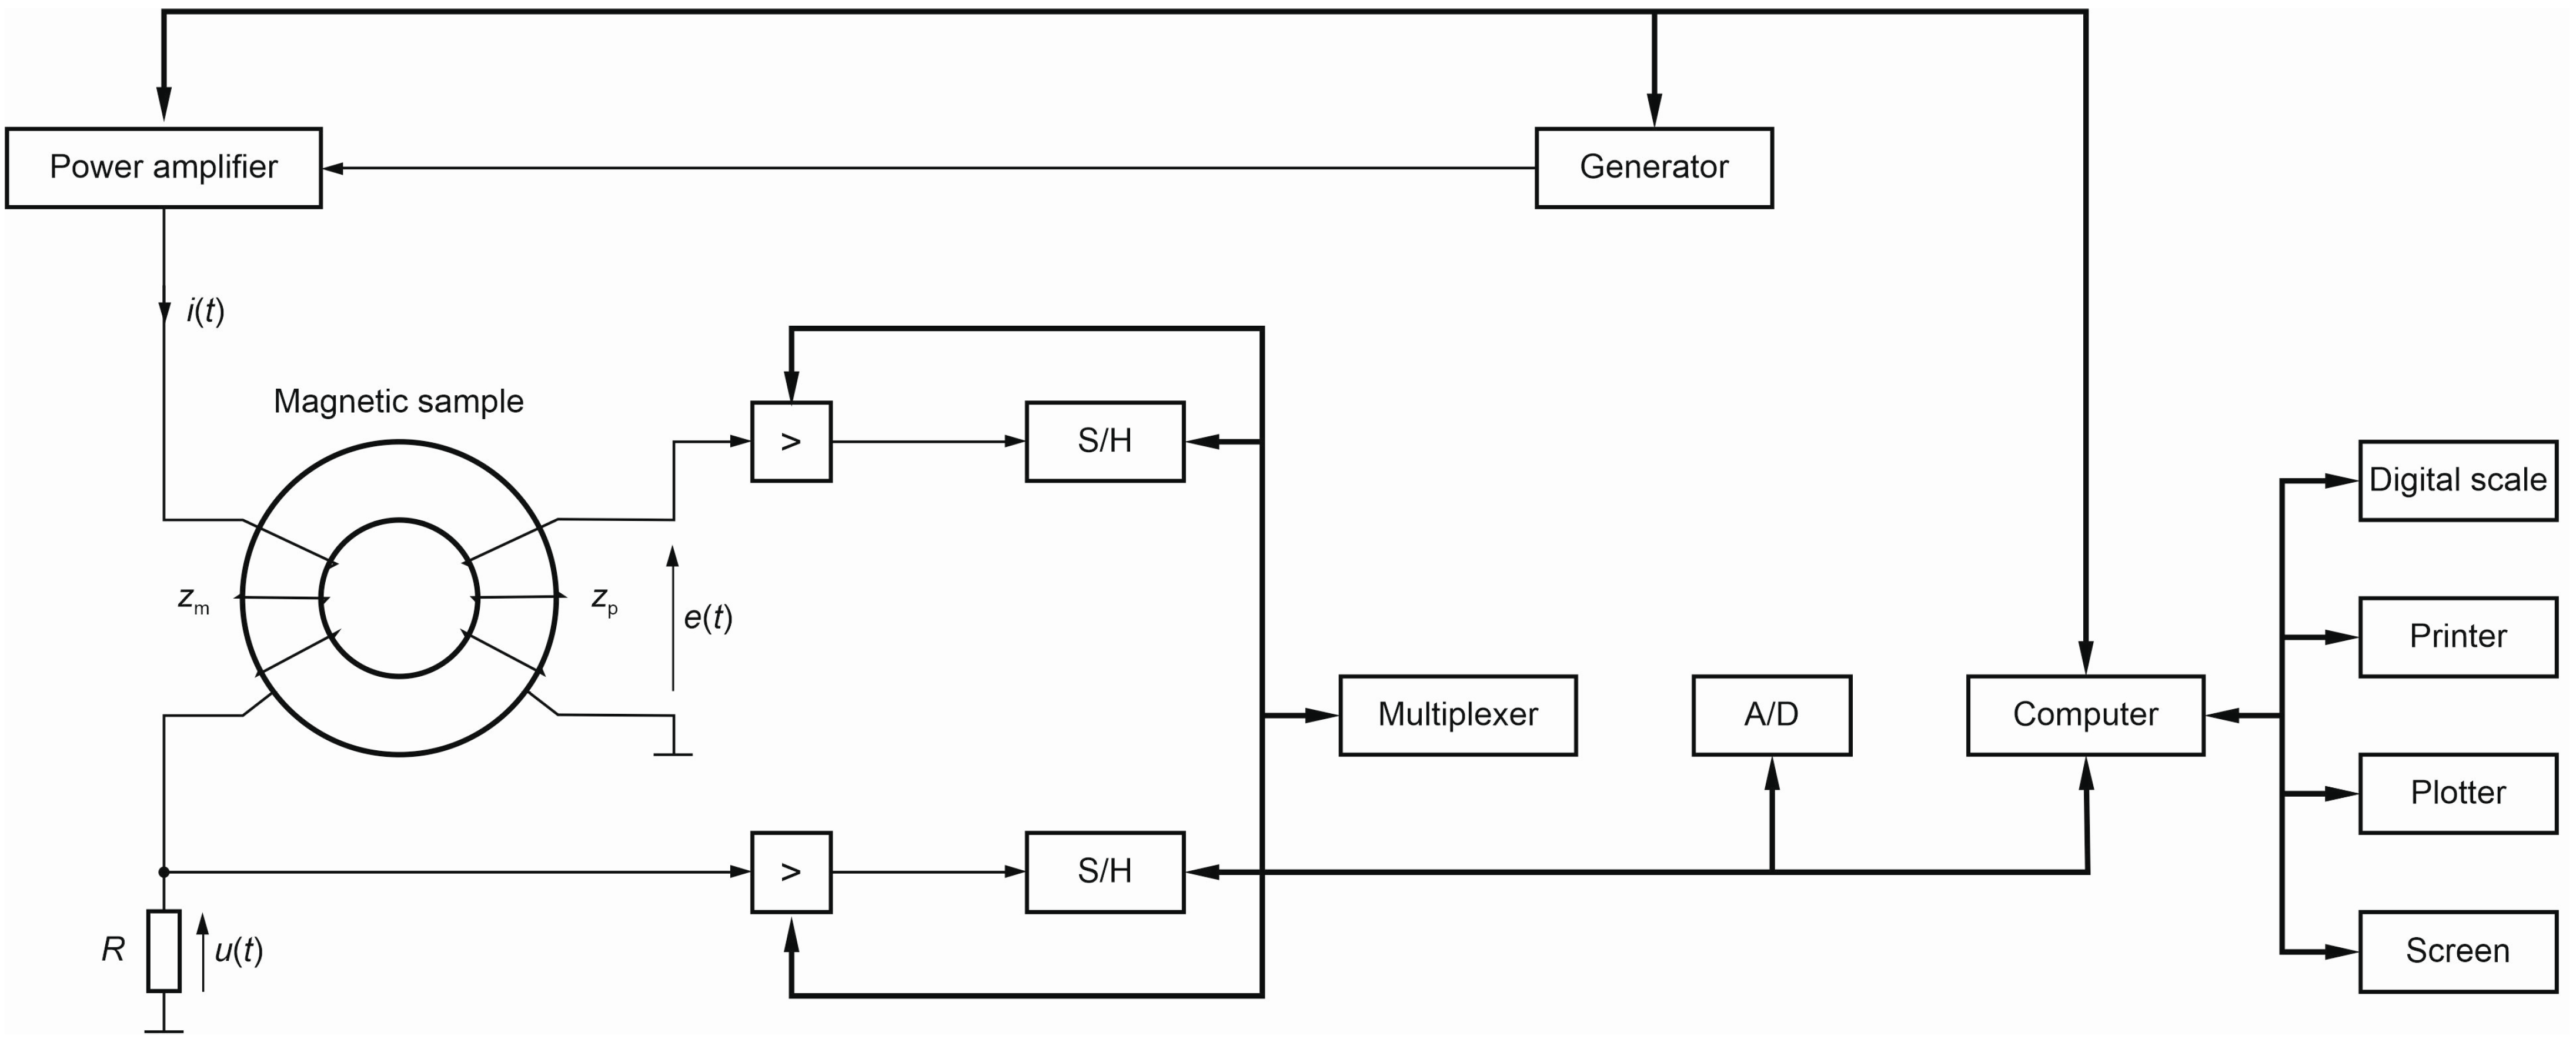
Figure 1. A general view of the measurement setup.
Applsci 13 09134 g001
Figure 2. A family of measured hysteresis loops approaching saturation at different excitation frequencies for the Metglas sample.
Applsci 13 09134 g002
Figure 3. A family of measured minor hysteresis loops at different excitation frequencies for the Metglas sample.
Applsci 13 09134 g003
Figure 4. A family of measured dependencies (coercive field vs. frequency) at different excitation amplitudes for the Metglas sample.
Applsci 13 09134 g004
Figure 5. The dependence of the value of exponent 1 / ν vs. induction.
Applsci 13 09134 g005
Figure 6. The dependence of the free term H c 0 = H c 0 ( B m ) .
Applsci 13 09134 g006
Figure 7. A comparison of measured and modeled hysteresis loops at B m = 0.6 T and f = 50 Hz.
Applsci 13 09134 g007
Figure 8. A comparison of measured and modeled hysteresis loops at B m = 1.0 T and f = 50 Hz.
Applsci 13 09134 g008
Figure 9. A comparison of measured and modeled hysteresis loops at B m = 1.2 T and f = 400 Hz.
Applsci 13 09134 g009
Disclaimer/Publisher’s Note: The statements, opinions and data contained in all publications are solely those of the individual author(s) and contributor(s) and not of MDPI and/or the editor(s). MDPI and/or the editor(s) disclaim responsibility for any injury to people or property resulting from any ideas, methods, instructions or products referred to in the content.