Article

Approximate Entropy and Velocity of Center of Pressure to Determine Postural Stability: A Pilot Study

1
School of Engineering, Grand Valley State University, Grand Rapids, MI 49504, USA
2
Department of Physical Therapy & Athletic Training, Grand Valley State University, Grand Rapids, MI 49503, USA
*
Author to whom correspondence should be addressed.
Appl. Sci. 2023, 13(16), 9259; https://doi.org/10.3390/app13169259
Submission received: 25 May 2023 / Revised: 18 July 2023 / Accepted: 13 August 2023 / Published: 15 August 2023

Abstract

:

Featured Application

The key finding of this project suggests approximate entropy and velocity of the center of pressure may be useful metrics for detecting small changes in quiet standing stability.

Abstract

The body’s postural control system is responsible for responding to perturbations of balance and keeping the body upright. During quiet standing, the center of pressure oscillates about the center of mass, counteracting imbalances. These oscillations can be analyzed to determine the degree of stability, which could be helpful in quantifying the effects of brain injuries. In this research, the center of pressure was recorded for stances with feet together and feet tandem, with eyes opened and eyes closed, in neurotypical participants. These signals were analyzed using indices of approximate entropy and velocity to determine how sensitive the measures were in tracking changes to stability levels. One-way ANOVA test results showed increased approximate entropy in anterior/posterior and medial/lateral directions (p = 1.21 × 10⁻¹¹, 3 × 10⁻¹⁴) and increased velocity in both directions (p = 2.87 × 10⁻⁶, 4.87 × 10⁻⁷) during conditions with decreased stability. Dunnett’s post hoc testing indicated that approximate entropy was significantly greater in all the less stable feet tandem trials in comparison to the most stable eyes open, feet together condition with p < 0.001 in nearly every participant and that velocity was significantly greater in the least stable eyes closed, feet tandem trials in comparison to the most stable condition with p < 0.01 in nearly every participant.

1. Introduction

The physiological processes involved with keeping a human upright are complex and dynamic. Postural control is the act of maintaining balance, which is where the sum of all forces acting on an object is zero, during all activities [1]. Neural inputs for the stabilization of the body come from the sensory mechanics in skeletal muscles, visual cues, and the vestibular system. These inputs are processed to maintain the center of pressure (COP) in relation to the center of mass (COM) of the body and determine when and how intrinsic stiffness is activated and muscles need to act in order to counteract extrinsic and intrinsic forces that impede balance [1,2,3].
The COP is a metric that is indicative of stability. This is the point location of the resultant ground reaction force where the body contacts the ground. It is located in the position of the weighted average of all the pressures that are being exerted on the body by the ground, where the sum of the moments of each individual pressure is equal to the moment of the resultant ground reaction force vector acting at the COP [4]. On the other hand, the COM is the point location on the body that is representative of all of its mass, where the moment of the COM is equivalent to the sum of the moments of the weight acting at every point on the body [4]. If the COM moves too far beyond the COP, balance may be lost without the implementation of adaptations such as stepping or movement of the arms [5].
Many studies have analyzed the methods of postural control in humans during quiet standing for the purpose of understanding the way that the body maintains balance [2,4,6,7,8,9,10,11,12,13,14,15,16,17,18,19,20]. One main takeaway is the general oscillatory pattern that the COM and COP can be expected to follow under typical neurologic function. For example, if the COM of a person in a quiet standing position with their feet together moves posteriorly, a person would fall backward without intervention. As the COM moves farther from the COP, angular acceleration and velocity increase, causing the body to fall more quickly. To stop this motion and an eventual fall, the body pivots about the ankle, causing a posterior angular velocity and acceleration of the body. This moves the COP back and toward the COM due to the moment resulting from the weight acting downward at the COM and the ground reaction force acting upward at the COP. While the body sways backward, the COP and COM line up and the person is no longer at risk of falling backward. This pattern continues indefinitely as the body sways back and forth [4]. The inverted pendulum model, as described by Winter [4], is the basis of human oscillation. In this model, the ankles are the pivot point of the body, which acts as the pendulum. Although some studies have shown that postural control involves compensation at the knee and hip, as well, and is not exclusive to the ankle [21,22,23,24,25,26], other studies have demonstrated that the single inverted pendulum model, which only considers the ankle, is functionally acceptable for the experimental description of COP oscillations [27,28].
The understanding of COP oscillations above allows for studies to explore how behavior changes under varying neurological conditions, such as concussion. People suffering from brain injuries like concussion have sustained damage to their central nervous system, both locally and diffusely, which results in symptoms of dizziness and balance impairment [29]. This damage is reflected in the COP due to the alteration of the central and peripheral control response mechanisms, leading to changes in the way the body responds to perturbations of balance. If not provided sufficient time to heal, the brain can be further damaged, particularly in athletes who return to play too soon. A number of studies have been conducted to analyze the postural control mechanism in participants suffering from a concussion while completing trials that involved walking, adjusting the standing environment such as standing surface and wall angle, and cognitive testing such as answering questions [7,10,30,31,32]. Although the information obtained from these studies is important, the methodologies would be difficult to apply outside of a lab environment as multiple permanent force plates are required to ensure uniform data recording for a moving participant, and cognitive testing and variable standing environments add complexity to data collection and minimize exact repeatability. Since it appears that no previous research has examined ApEn and the velocity of the COP in quiet standing postures, utilizing only tandem stances and closed eyes to introduce instability, additional work remains. Thus, identifying objective metrics from the COP with this methodology could inform work that could lead to better outcomes when screening for concussive damage.
There are many analyses that can aid in learning more about the patterns of the dynamic COP and COM signals as they relate to stability. As the COP of a person with typical neurological functionality can be expected to follow a relatively regular pattern, approximate entropy (ApEn), a measure that quantifies the regularity of a signal [33], can be useful in identifying changes due to loss of stability. ApEn has been used in past studies to detect changes to postural stability in nonlinear, biological signals [34,35,36]. Additionally, the velocity of the COP can give information about how quickly a person sways back and forth in an attempt to maintain balance, potentially indicating changes in stability as well. Comparing the changing ApEn and velocity of COP between trials of different stability conditions may help identify useful indices for quantifying loss of postural control, independent of the cause, i.e., due to postural changes or neurological changes.
The purpose of this study was to describe the center of pressure approximate entropy and velocity in healthy individuals under quiet standing positions and determine if they are sensitive enough to distinguish small changes to stability. Further, the methodology for data collection was designed specifically to be simple and able to be completed in various settings, not requiring a permanent lab setup. As patterns and behaviors are understood from this work, the knowledge of how these methods of COP look for a healthy individual can be compared to how they look for an individual under suspicion of abnormal neurological functioning, such as a concussion, in future work. Based on previous research, it was hypothesized that decreased stability would increase both the approximate entropy and velocity of COP.

2. Materials and Methods

2.1. Participants

This study included data from healthy adults of varying levels of physical activity with no history of neurological or muscular disorders or injuries. Two males and four females (24.8 ± 3.3 years; 171 ± 10.5 cm; 71.0 ± 13.5 kg) voluntarily provided their signed informed consent prior to participation in this study. This data collection was approved by the Institutional Review Board at Grand Valley State University (18-246-H) for previous research. The approval was extended to allow for further analysis of the data in this study.

2.2. Procedure

Prior to data collection, the participants underwent a brief medical history screening to verify eligibility and physical examination measurements were recorded for body anthropometrics. Five 30 s trials of six different balance conditions were completed with each participant as shown in Table 1. The eyes open, feet together (EOFT) condition was completed first and considered to be the most stable configuration and a baseline condition to compare data from other balance conditions. The participants progressed through increasingly unstable balance conditions. Between each trial, a 30 s break was allowed, with a longer 2 min break between each balance condition. Conditions were completed in the order listed in the table for all participants.
The self-reported foot dominance, defined as the foot one would kick a ball with, was used for each participant to satisfy the description of relevant conditions. Balance tasks were performed barefoot with the arms positioned with the index finger pointed towards the shoulder on the same side of the body, the elbows pulled in, and knees extended (Figure 1). Participants were asked to stand upright and maintain even weight distribution between feet.
The participant was asked to hold the quiet standing position for the full thirty seconds without stepping out of position. If significant foot movement occurred, trials were repeated so that data used for analysis originated from trials with only minor bodily movements induced to maintain balance.

2.3. Data Acquisition

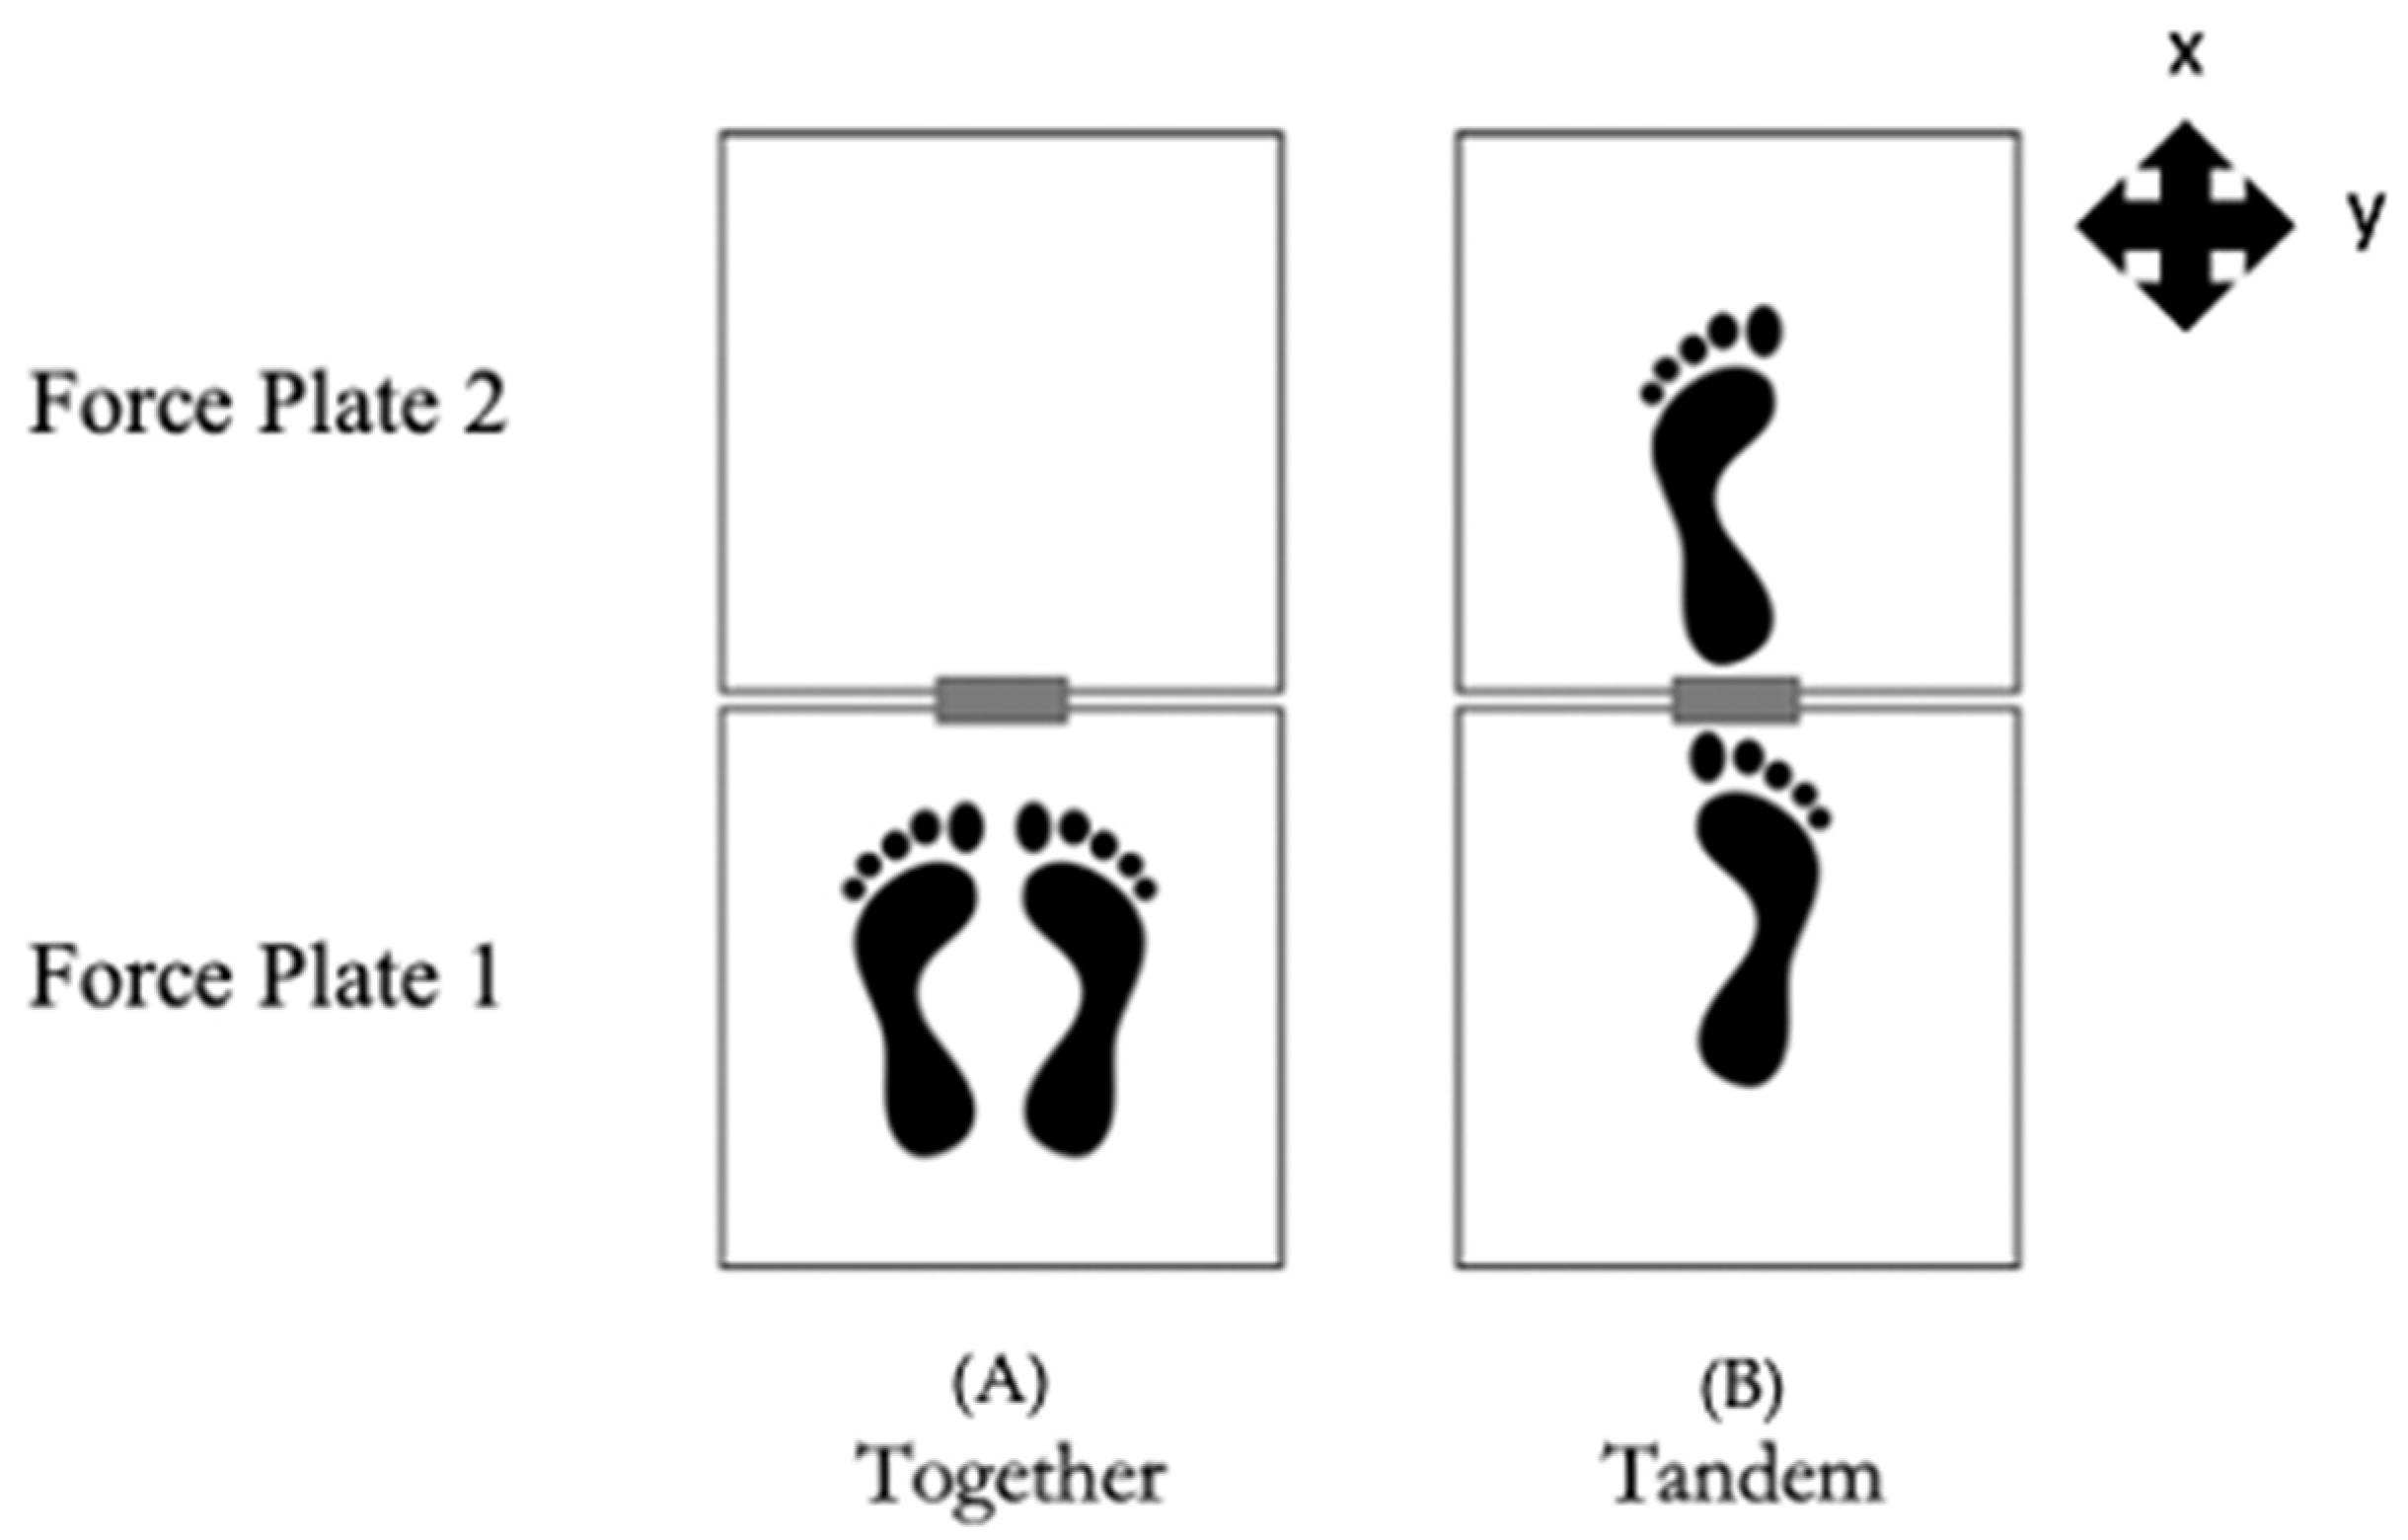
Two floor-embedded AMTI (Advanced Mechanical Technology Inc., Watertown, MA, USA) force plates were utilized for the collection of ground reaction forces during quiet standing balance tasks. These collected data at a sampling frequency of 1200 Hz. They were oriented one directly in front of the other. For feet together tasks, both feet were placed on one force plate. The second force plate was implemented to measure separate ground reaction forces when the feet were positioned in a tandem stance (Figure 2). This data collection resulted in a COP signal for each force plate used, for each trial, in the x-, y-, and z-axes. Of those signals, the x- and y-axis data were used for analysis, as they represent the anterior/posterior (AP) and medial/lateral (ML) directions for the participant, respectively.
Although not utilized for this study, movement trajectories of a modified full-body Plug-in Gait (PiG) model were collected concurrently with ground reaction forces using 16 Vicon MX cameras, sampling at 120 Hz (Oxford Metrics, Oxford, UK). Vicon Nexus motion capture software v2.8 calculated the COM from the output of the motion capture cameras using Dempster’s anthropometric data to compute segmental centers of mass and inertial properties to compute joint kinetics as described by Winter [37].

2.4. Data Analysis

The COP was analyzed with univariate measures in the time domain with custom-written code using Python 3.7.6. As all people have a slightly different postural control system, each participant was analyzed separately to not have data skewed by differences in magnitude or behavior of data from one participant to the next.

2.4.1. Signal Preprocessing

A fourth-order, zero-lag, low-pass Butterworth filter was applied to the COP signals with a cutoff frequency of 6 Hz via Nexus motion capture software v2.8 to eliminate any noise present in the signal that could not be attributed to each participant’s postural control mechanism. This cutoff frequency was chosen because numerous studies on the frequency content of postural sway have shown that its signal content exists at or below 5 Hz [38,39,40,41].
As feet together trials were completed using only one force plate, and feet tandem trials were completed using two, the feet together data resulted in only one COP signal, whereas the feet tandem data resulted in two COP signals. In order to compare the two condition types, the two COP signals for the feet tandem trials were combined into one resultant COP for the entire body as follows [4,42,43]:
C O P n e t = C O P L F z L F z L + F z R + C O P R F z R F z L + F z R
where C O P L and C O P R are the values of the COP signal from the left and right foot, respectively, and F z L and F z R are the vertical forces exerted on the force plates under the left and right foot, respectively.

2.4.2. Approximate Entropy

Approximate entropy (ApEn) quantifies the regularity of a time-series signal by determining the likelihood that a pattern of similar data points within a tolerable range of one another, r, will continue to be similar for a chosen number of observations, m [33,35]. It is well suited for small datasets, which nicely frames the measure to be used on small windows of a larger dataset to obtain a moving representation of the regularity of a signal. ApEn is defined as follows [33]:
A p E n = Φ m + 1 ( r ) Φ m ( r )
where m and r are fixed values, m being the length of compared runs, r serving as a filter value, and Φ m ( r ) is defined as:
Φ m ( r ) = ( N m + 1 ) 1 i = 1 N m + 1 ln [ C i m ( r ) ]
where N is the total number of data points and C i m ( r ) is defined as:
C i m ( r ) = n u m b e r   o f   j   ( N m + 1 )   s u c h   t h a t   d [ x ( i ) ,   x ( j ) ] r N m + 1
where d [ x ( i ) ,   x ( j ) ] is the maximum distance between the respective scalar components of vectors x(i) and x(j).
The value m is a positive integer that represents a window of data to be compared. A value of two is very commonly used in various applications of ApEn and is what was used in this study [33]. The value to use for r, however, is much less agreed upon. It is a filter value that must be a real positive number. A general rule that is loosely advised is to use 0.2 times the standard deviation of the time-series data, with the understanding that different applications of ApEn will require different filter levels. In this research, a large variety of r-values were tested, including various proportions of the standard deviation as well as constant values. The r-value that was chosen was the one that highlighted the largest difference in COP ApEn between the most stable and the least stable quiet standing positions, which was a value of 10. This value effectively filtered the redundant data associated with the collection frequency of 1200 Hz by allowing for successive data points to be further from one another and in a larger window of possible values while still being considered a part of a pattern. Since COP oscillates regularly in highly stable conditions, ApEn calculations need to account for the sway with a larger r-value than is typically suggested.
Moving approximate entropy was calculated for all COP trials, in both ML and AP directions, using windows of size 1800, or 1.5 s intervals, with a 50 percent overlap to create 39 segments. This allowed for a visual understanding of how the approximate entropy changed over time; however, these 39 values were averaged to obtain a single approximate entropy value for further calculations. This was conducted as numerous studies have shown postural sway to be a stationary signal in durations greater than 15 s [19,44,45].

2.4.3. Velocity

The first derivative, velocity, provides information about how quickly the position of the COP moves during postural control. This was estimated using the following equation:
V ( i ) = x ( i + 1 ) x ( i ) t ( i + 1 ) t ( i )
where x is the COP signal, t is the time vector, and i is the index with a maximum equal to the length of the signal. This slope equation gives the rate of change in the COP, providing knowledge about how quickly the body is swaying while maintaining balance.
Velocity was calculated for all COP signals between every two points in both ML and AP directions. This created a new signal with a length equal to the original COP signal. The magnitudes of the data in the velocity signal were averaged together to create a single value representing the average velocity for each trial, respectively.

2.4.4. Statistical Analysis

Each participant was considered independent from one another due to the assumption of unique postural control mechanisms. Furthermore, trials and stability conditions were considered independent of one another due to the breaks given between each of them. The participant’s ability to rest and then reset allows for this assumption. Additionally, data were determined to be of a normal distribution based on results from the QQ plot method. These factors permitted a one-way analysis of variance (ANOVA) test to be completed for each participant in both the AP and ML directions for ApEn and velocity, separately. An alpha value of 0.05 was used to determine statistical significance.
The ANOVA testing resulted in information about whether there were significant differences between any of the stability conditions for each of the analyses. If ANOVA determined that there were significant differences between conditions, a two-sided Dunnett’s post hoc test was completed to determine which conditions varied significantly from one another by comparing the baseline EOFT condition to every other, less stable, condition. Once again, tests were performed with an alpha value of 0.05.

3. Results

There are clear differences in the appearance of COP data in very stable conditions versus less-stable conditions (Figure 3). However, though less-stable conditions appear more “noisy”, there is no easy way to distinguish between each condition where the degree of stability differs only slightly. This is where further analyses can be utilized.

3.1. Approximate Entropy

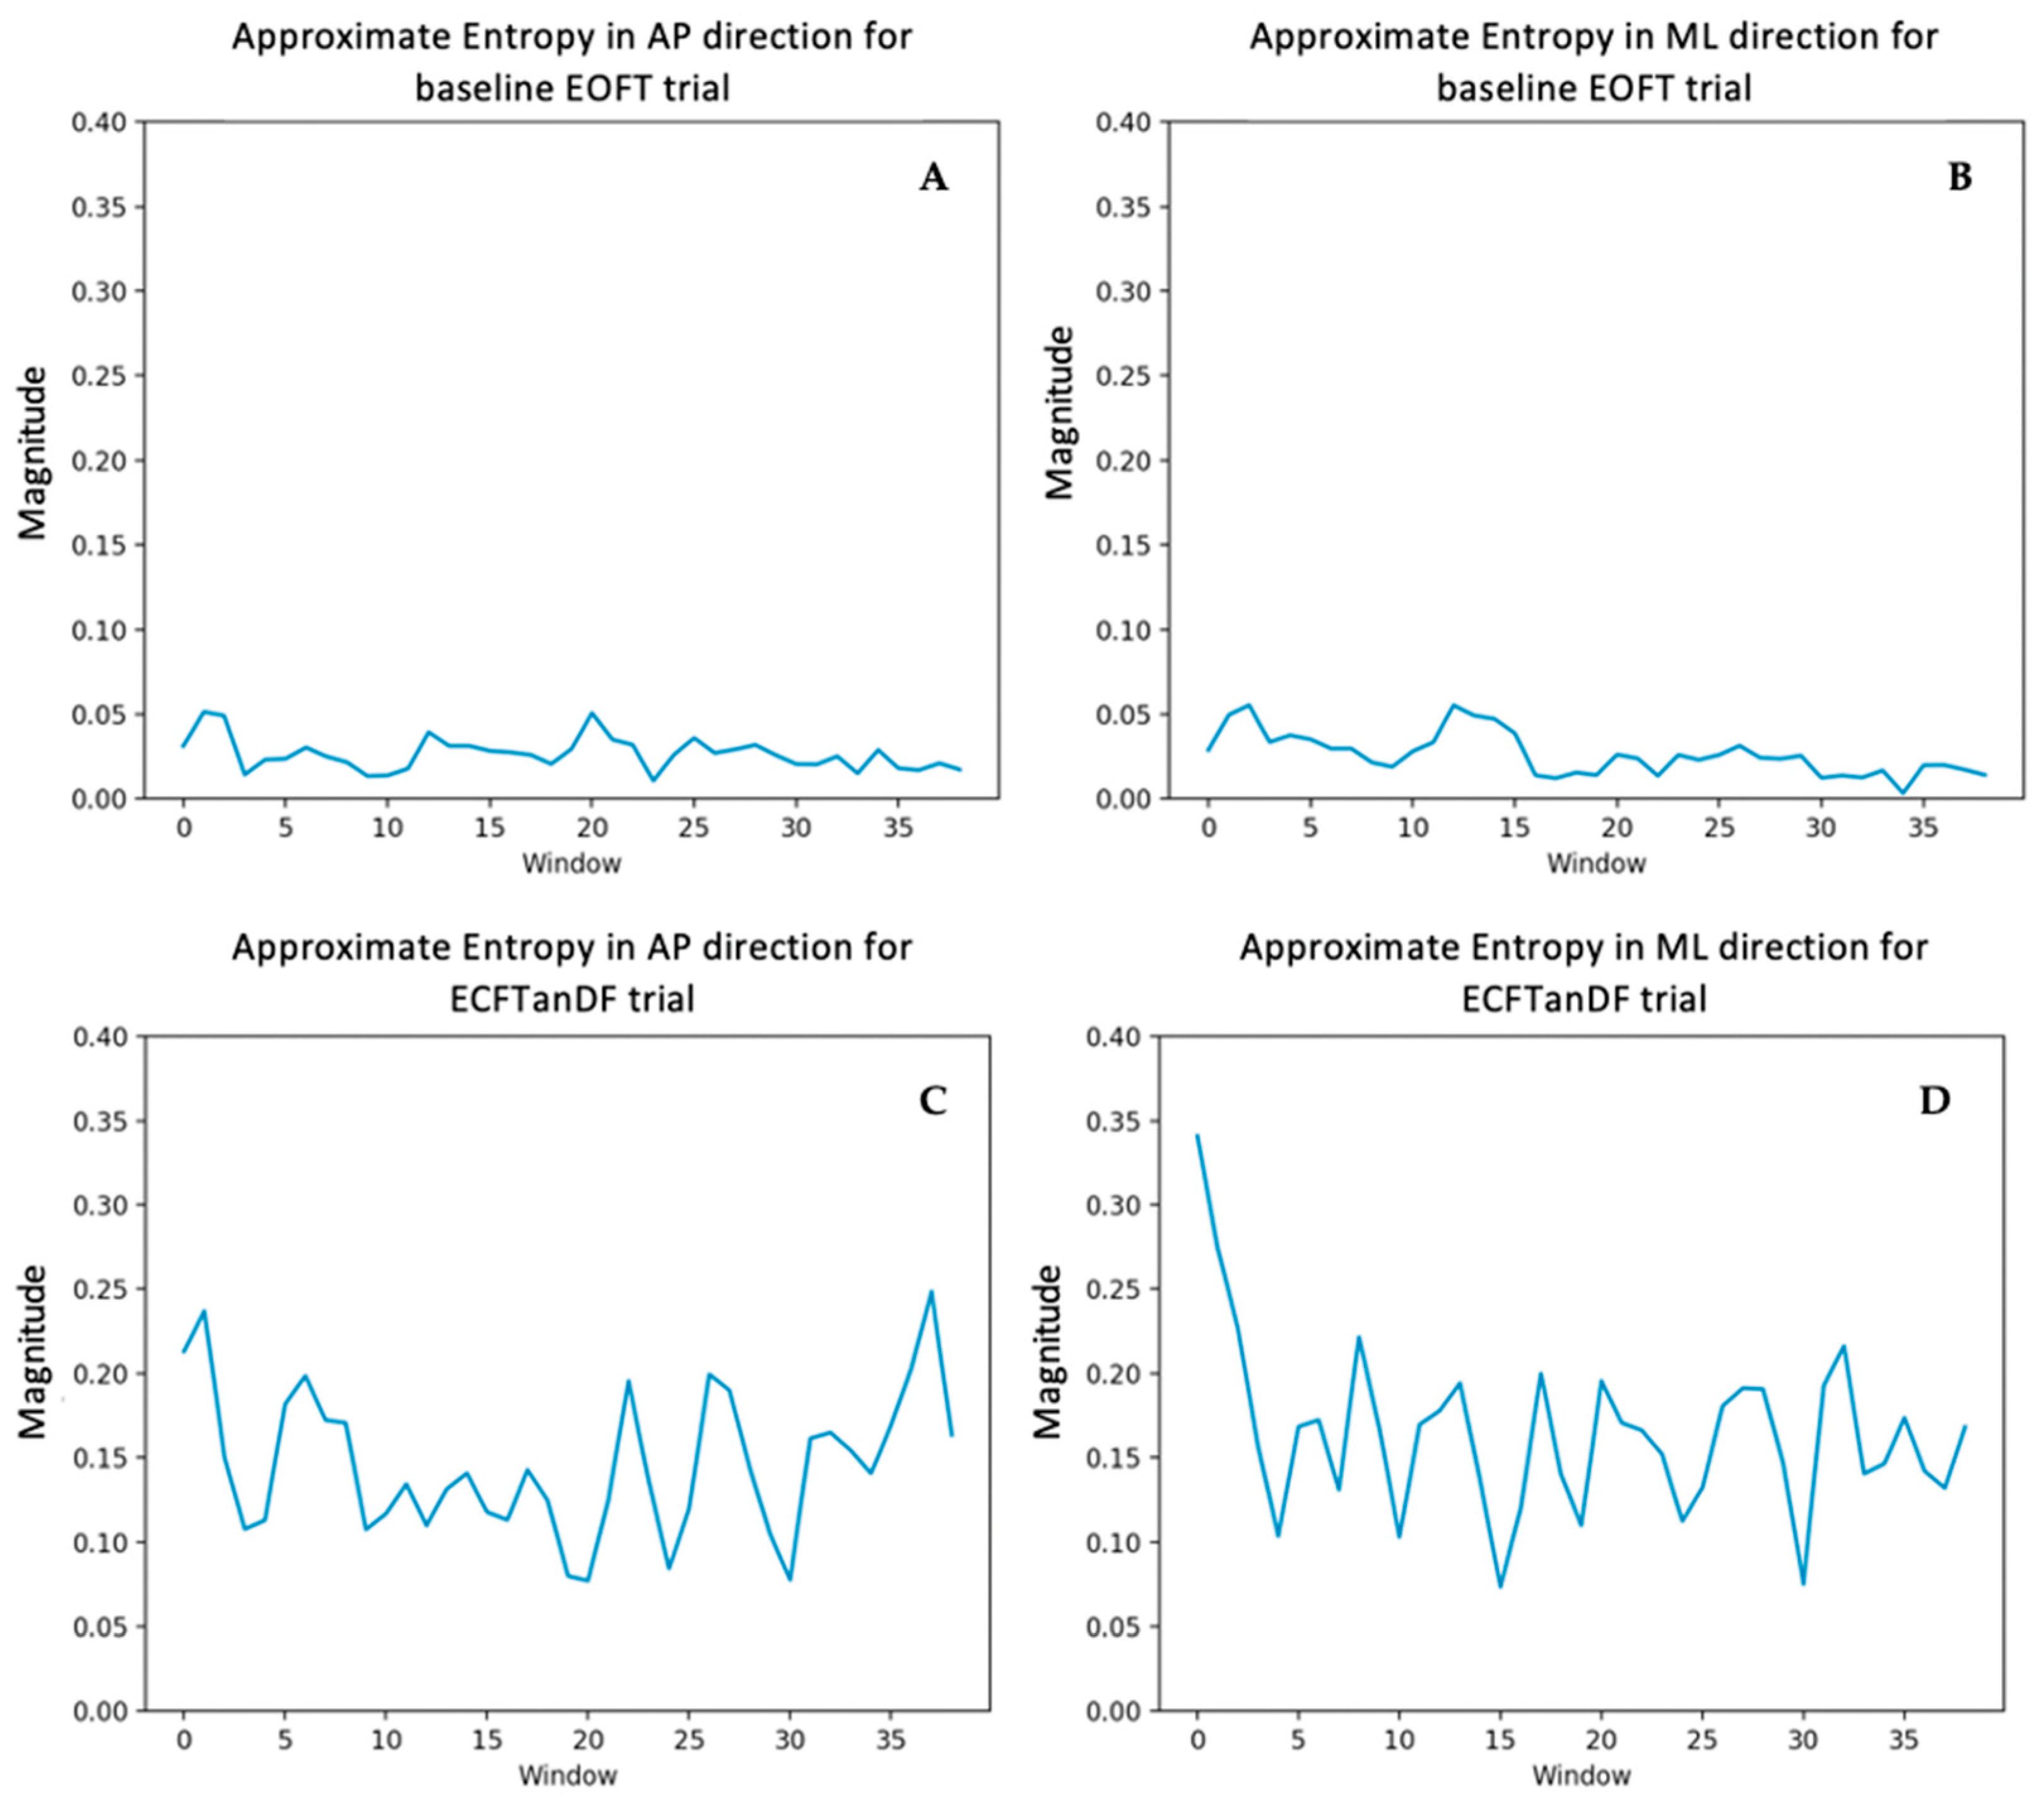
Approximate entropy was analyzed for all COP data. Less stable conditions resulted in a maximum ApEn magnitude that was much greater than the stable, baseline condition (Figure 4).
As the conditions became less stable, the signals became more irregular and ApEn increased in both AP and ML directions (Figure 5). In five out of six participants, the ECFTan trials showed the highest approximate entropy of all the conditions and an ANOVA test indicated a significant difference between conditions with a p-value of 1.21 × 10⁻¹¹ in the AP direction and 3 × 10⁻¹⁴ in the ML direction. Large variability between trials was present in the one participant for which that did not apply.
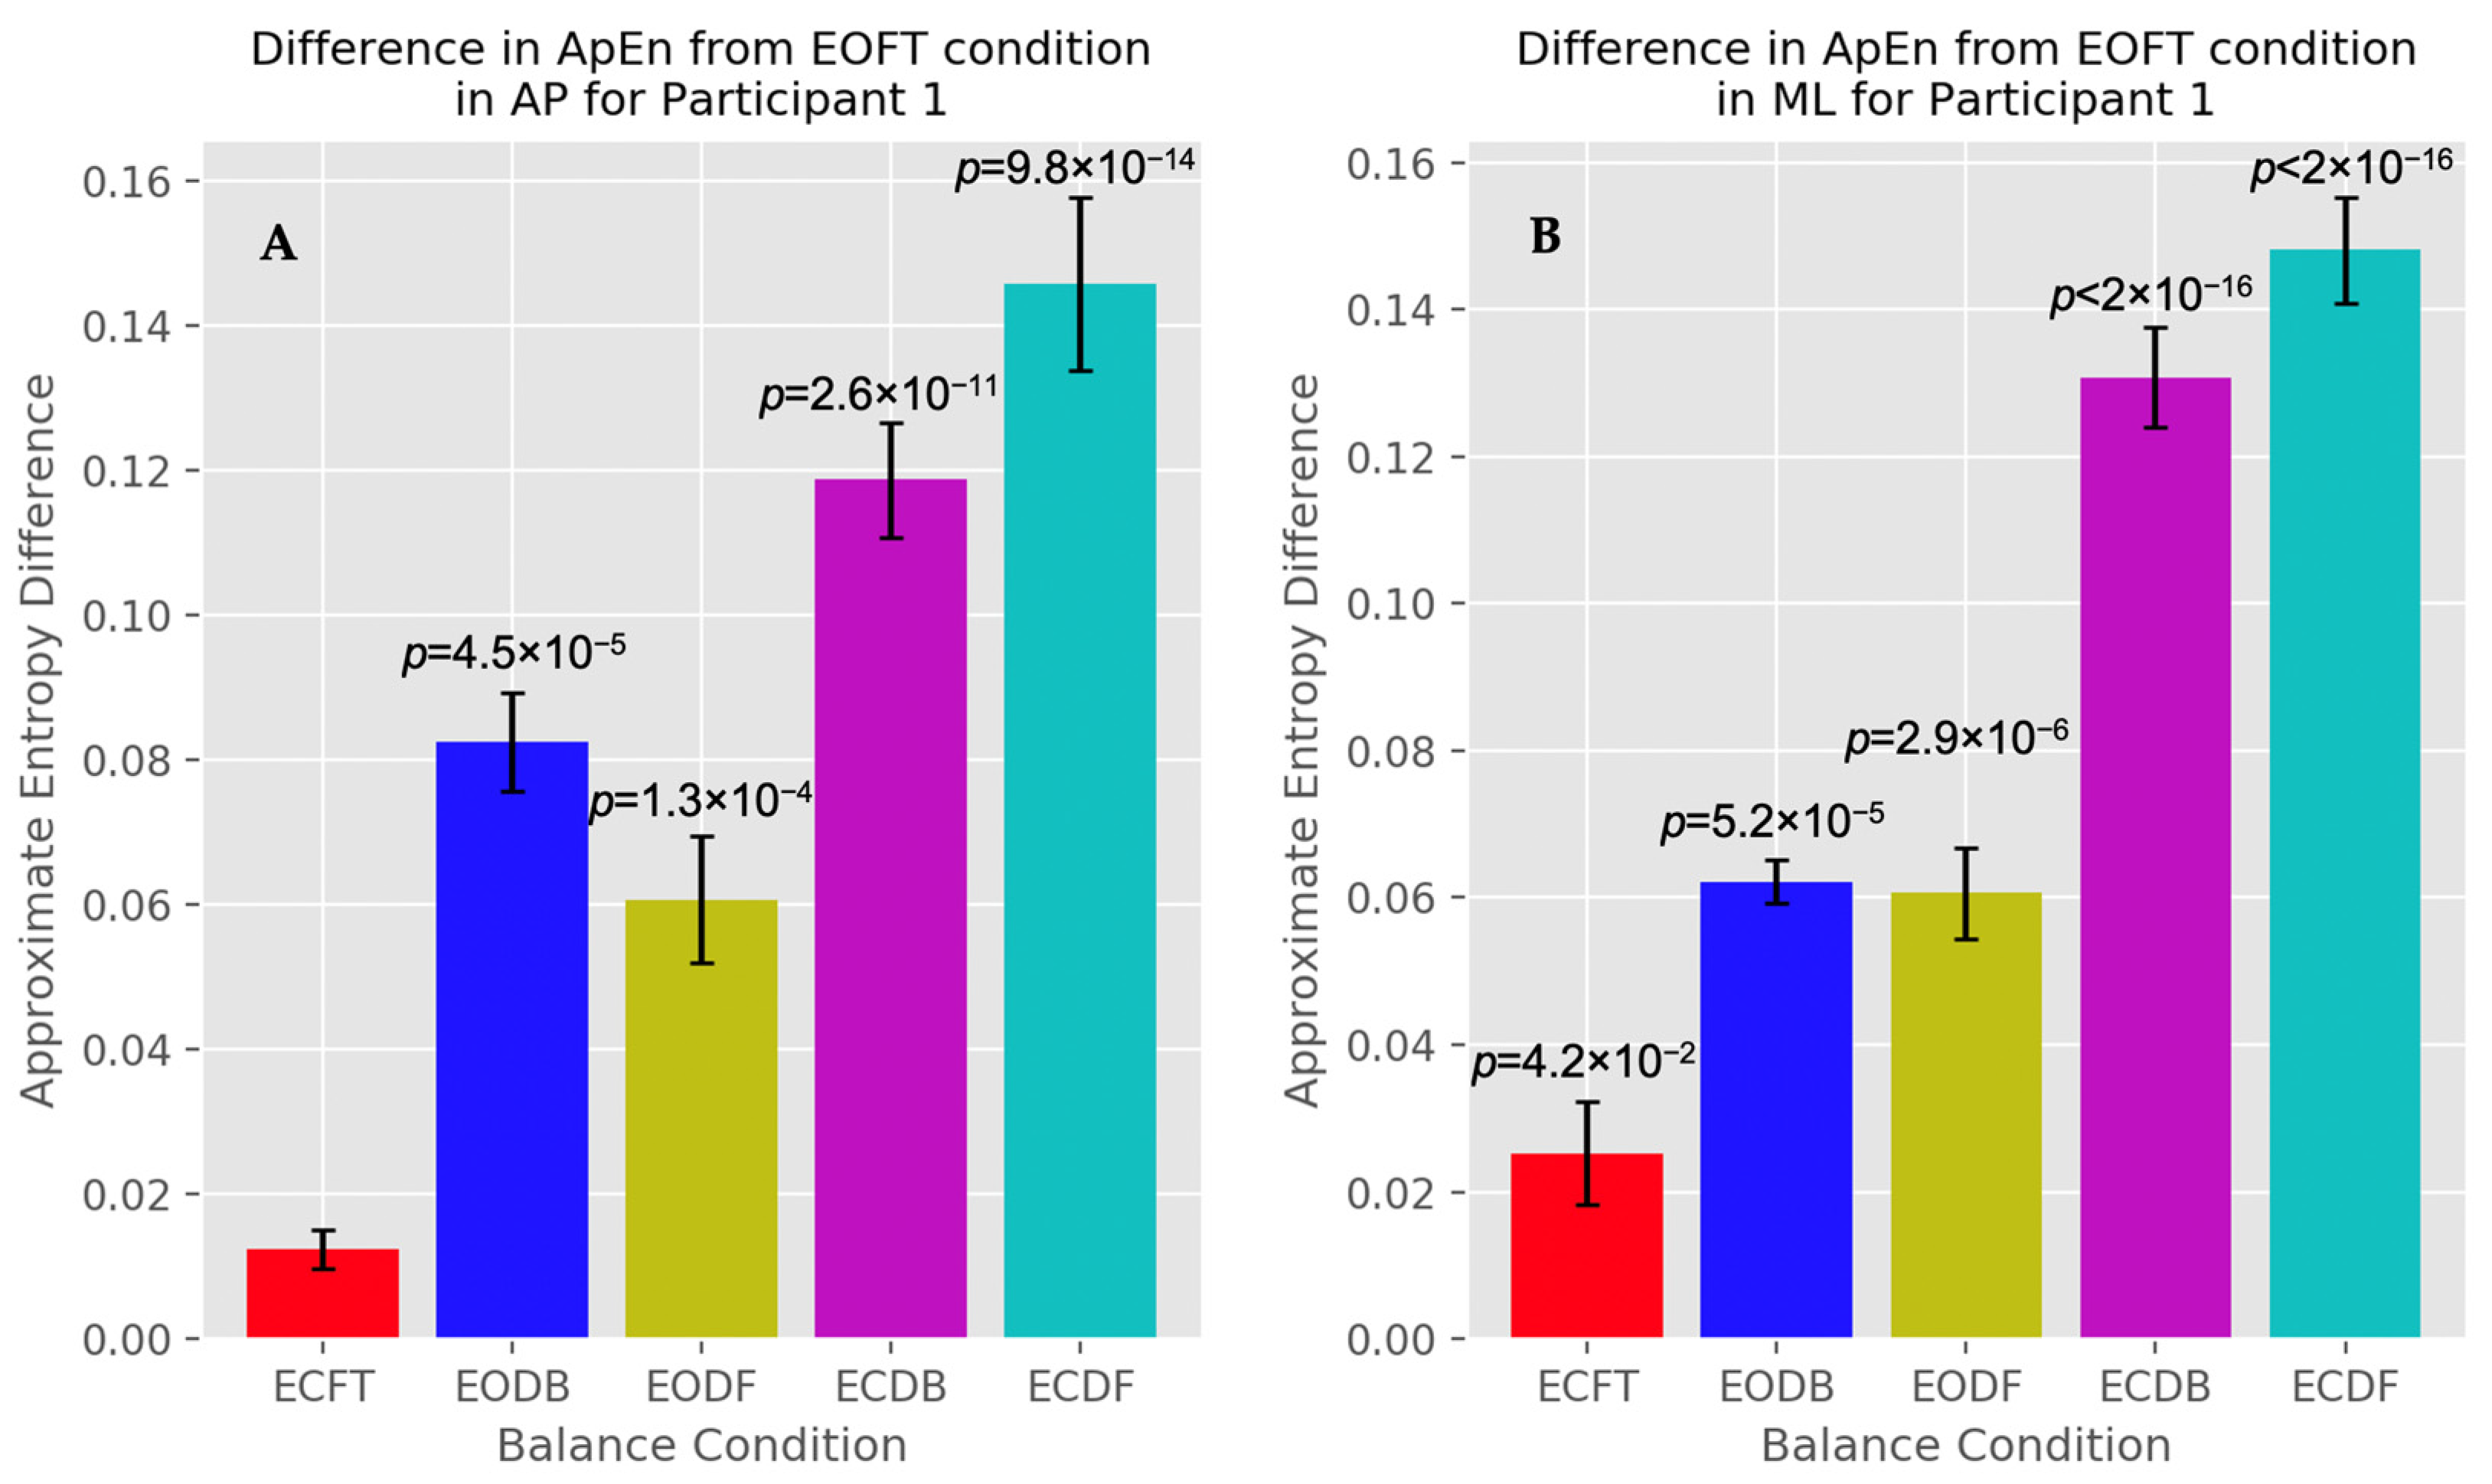
Post hoc analysis indicated that there was a significant difference from the baseline EOFT condition for all stability conditions aside from the ECFT condition, in both directions and in all participants who displayed significance in the ANOVA test. A significant difference between the EOFT and ECFT conditions was seen in half of the participants (Figure 6).

3.2. Velocity

The magnitude of velocity was analyzed for all COP data. The less stable conditions displayed a maximum mean velocity over 30 s that was greater than the stable, baseline condition. Additionally, for both higher and lower stability conditions, the velocity in the ML direction demonstrated a maximum magnitude that was higher than the AP direction (Figure 7).
The magnitude of velocity was observed to be greater as stability decreased, and in most participants, the ECFTan trials showed the highest velocity of all conditions (Figure 8). ANOVA testing indicated that five out of six participants displayed significant differences between conditions with a p-value of 2.7 × 10⁻⁶ in the AP direction and 4.78 × 10⁻⁷ in the ML direction. Whether having the dominant foot forward or backward resulted in more instability varied by participant.
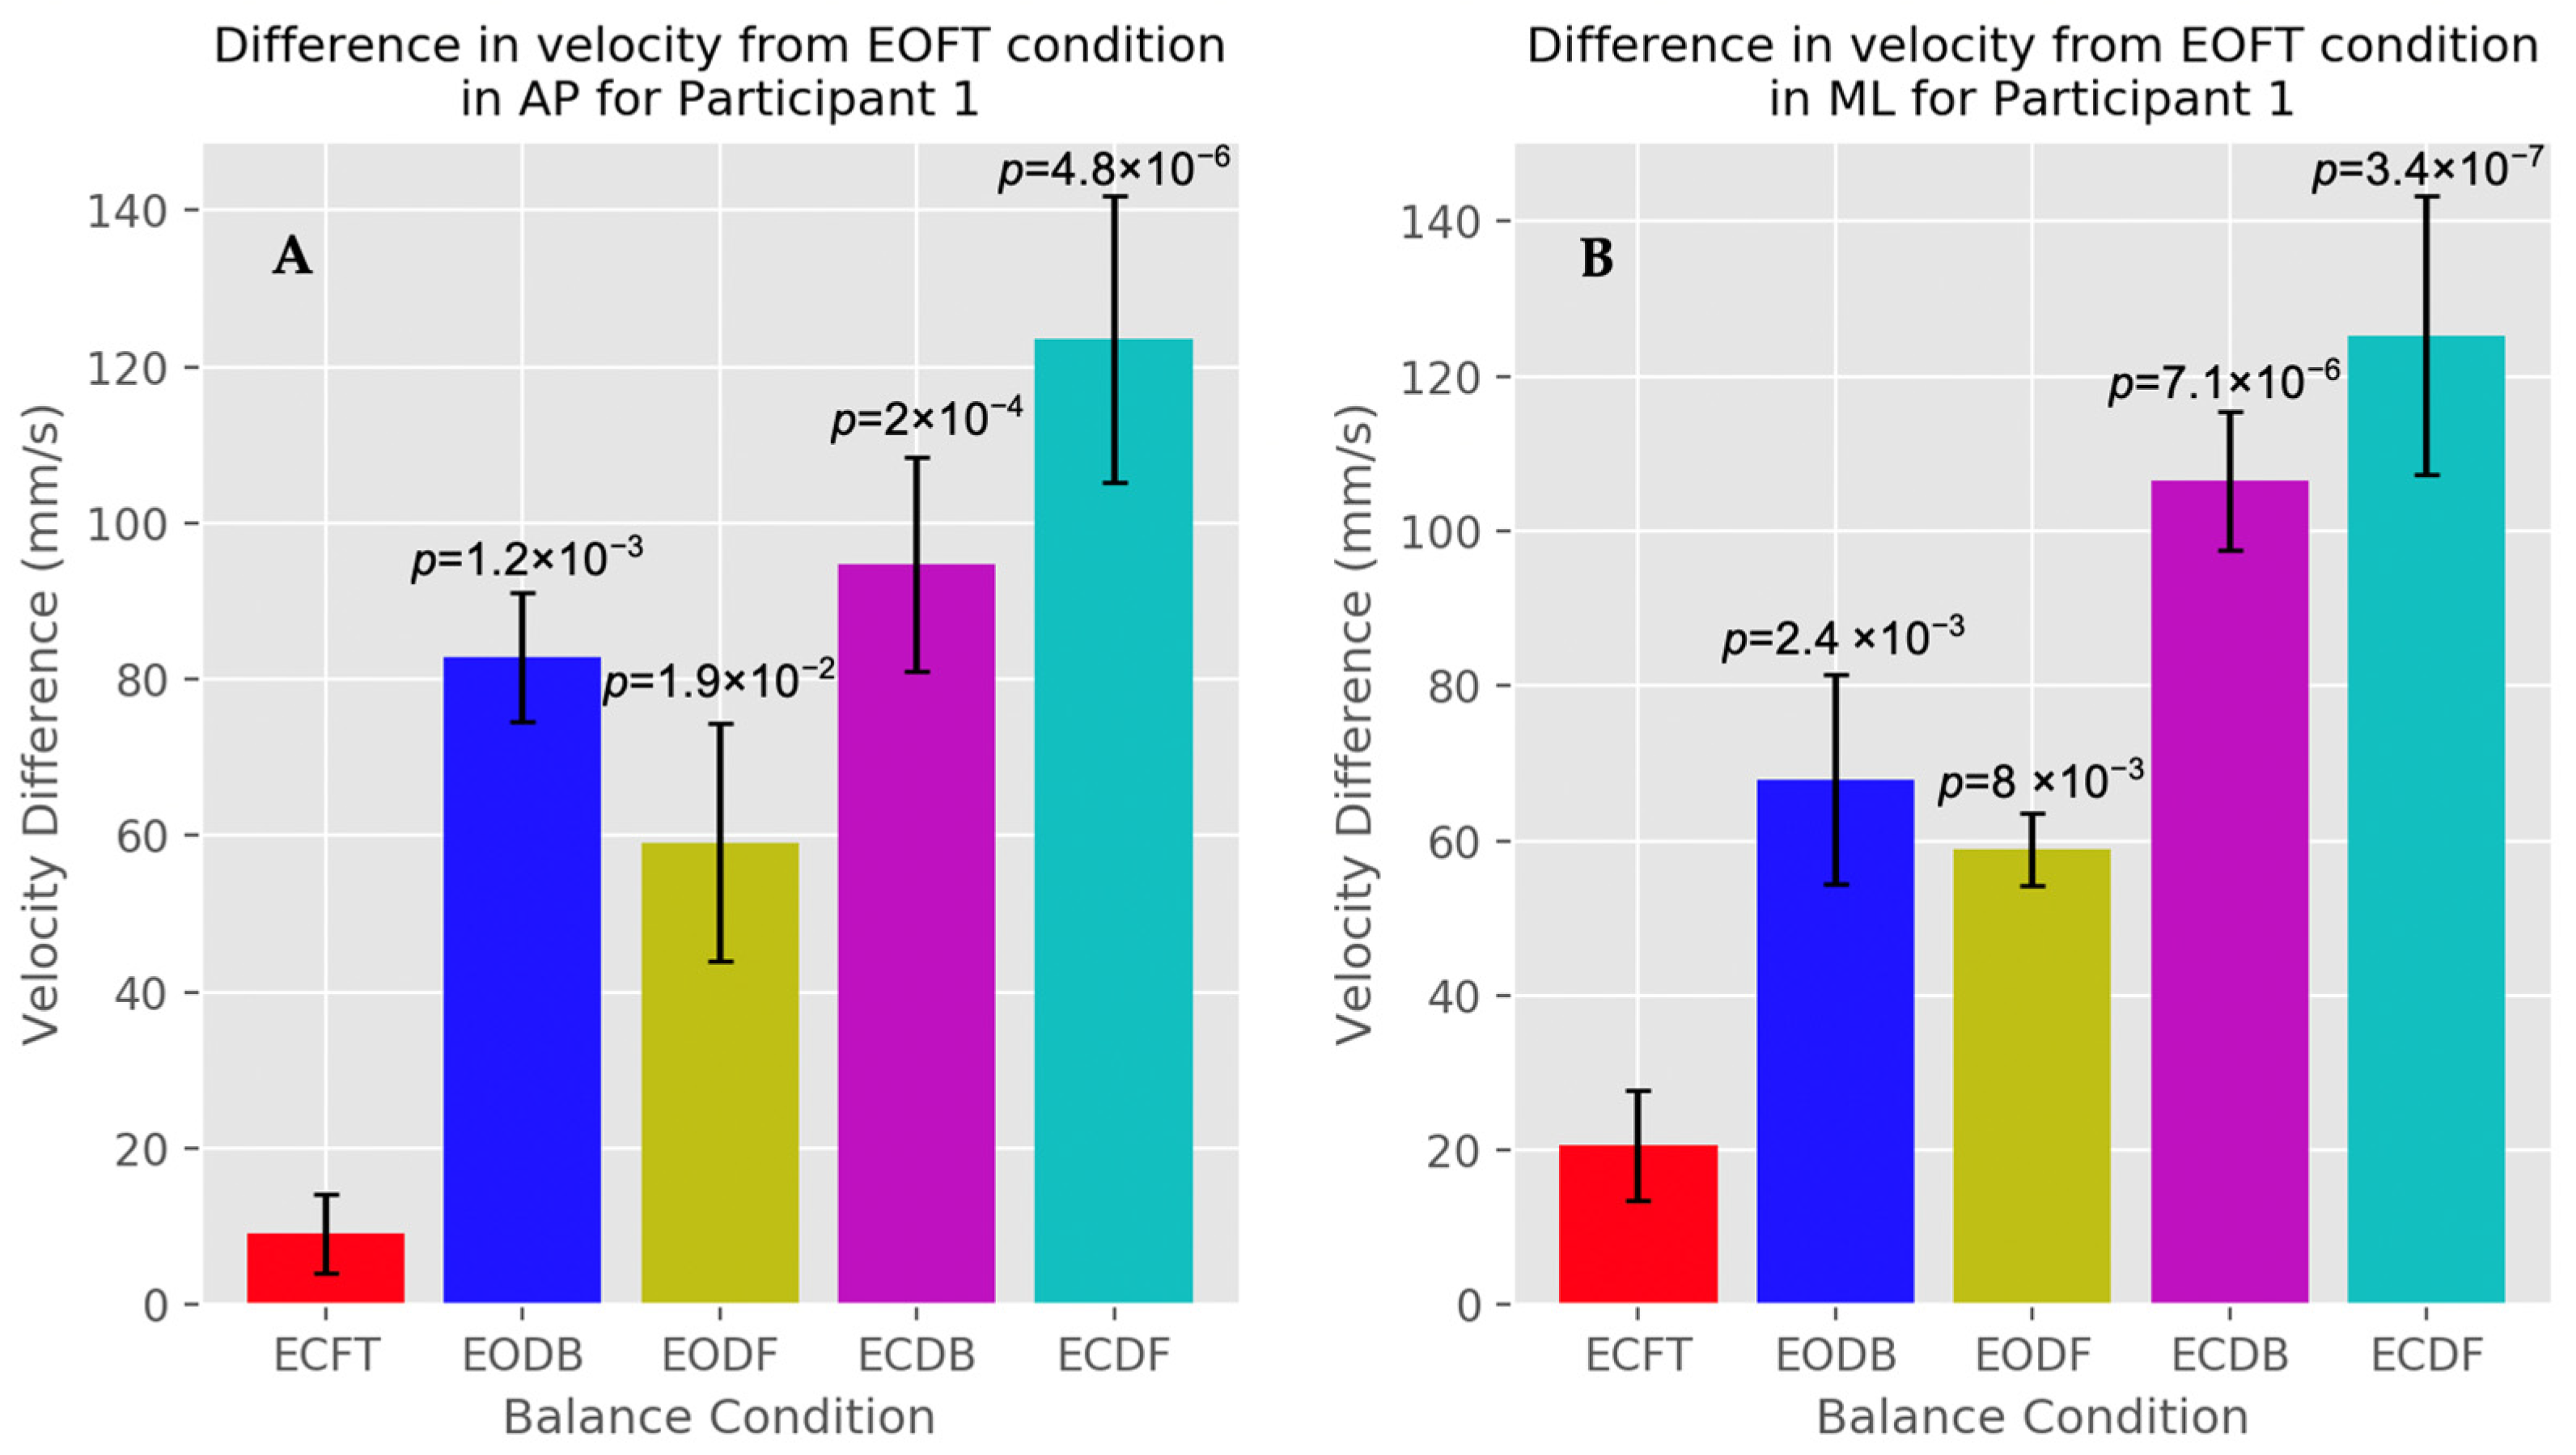
A two-sided Dunnett’s post hoc test was performed for all participants and directions which resulted in a significant ANOVA test. This analysis illustrated that the ECFTan conditions showed a significant increase in velocity from the baseline EOFT conditions more often than the others. Five out of the six participants showed a significant increase in at least one of those conditions (Figure 9). Comparatively, also in all but one participant, the ECFT condition did not show a significant difference from the baseline EOFT condition.

4. Discussion

Biomechanical measures related to neurological injury are sparse. In the case of concussion, particularly in athletes, it is difficult to know whether it is safe to return to play or not. The need for a deeper understanding of physical measurements in healthy participants to, eventually, inform activity limitations for those suffering from mild brain injury motivated this study. Analysis in this research assumed that although postural control is mostly equivalent for all individuals, every person’s postural control mechanism is unique, due to learned experiences [3]. Therefore, it is necessary to consider that each person’s response to changing conditions may be slightly different. This consideration allowed the most stable condition (EOFT) for an individual to be considered their own baseline against which other conditions could be compared as opposed to requiring a large baseline group of participants to compare against. Signals from COP measurements were assessed under increasingly unstable conditions in neurotypical participants to develop indices of interest that may help accurately identify the degree of postural stability. Results showed that COP ApEn and velocity were both clearly and significantly greater in less stable quiet standing positions in comparison to the most stable positions. With an understanding of how ApEn and velocity of COP behave for varying levels of stability in neurotypical subjects, these indices may be useful to screen for conditions such as concussion in a more objective manner. Linear and nonlinear measures have been previously used in studies to determine changes to stability based on different neurological and physical impairments [46,47]. Although these studies compared a baseline control group to a group with impaired postural control as opposed to comparing a baseline condition of an individual to adjusted conditions of the same individual and utilized a different quiet standing methodology than this study, the clinical application of these measures on COP to distinguish postural control encourages the motivation for this work.

4.1. Center of Pressure Irregularity

A very clear pattern emerged with ApEn analysis. All participants displayed an increase in ApEn while under increasingly unstable conditions when compared to baseline EOFT. All participants, except one, showed the highest ApEn in the two ECFTan trials. Motor control theory suggests that an increasing ApEn is related to the postural control system choosing a non-optimal movement to maintain balance and, therefore, having to try another movement [48]. As standing with eyes closed and feet in a tandem orientation is a less natural position than having the eyes open or the feet together, one’s postural control system will be less practiced in making accurate movement decisions. Therefore, a greater ApEn under those circumstances could be expected as the postural control system will be forced to change between numerous states [49]. The participant for which this did not apply differed from the rest due to increased variability among trials of the same condition. Due to this variability, it is not unexpected that the patterns of that participant may look different than those of other, more consistent participants.
Furthermore, in all participants aside from the same one with increased variability, all stability conditions except for ECFT showed a significant difference from the baseline EOFT condition based on Dunnett’s post hoc testing. Half of the time, even the ECFT condition showed a significant increase in ApEn from the baseline condition. The ability to identify significant differences between positions with relatively small changes in stability level shows that ApEn could be a very sensitive and useful metric for analyzing postural control. Changes in ApEn did not appear to differ between the AP direction and ML direction.
Studies that have compared COP ApEn in healthy participants and participants with concussion using more drastic techniques to adjust stability level found that in healthy participants, ApEn increases with decreased stability, supporting the results of this study. Alternatively, ApEn tends to decrease when stability decreases in subjects with a concussion. In addition to decreasing with lowered stability, participants with concussion also displayed a decreased ApEn in the same standing position between pre-injury testing and testing post-concussion [32,34,50,51]. This decrease in ApEn may be caused by the decrease in cognitive function following concussion, leading the postural control system to respond in less complex ways.

4.2. Oscillation Velocity

The mean velocity of COP oscillations was shown to increase as quiet standing stances became less stable. This means that as a participant was less stable, their COP moved from behind to in front of their COM more quickly and that it did so more frequently. This pattern was consistent across both AP and ML directions. This is reasonable because when a participant’s eyes were closed with their feet in a tandem position, their postural control system was challenged causing the postural control mechanism to act more rapidly to counteract the impedance to balance.
Dunnett’s post hoc testing showed that the only conditions that were consistently significant in their difference from the baseline EOFT condition were the two ECFTan conditions. This may be because having closed eyes and tandem feet are the two characteristics that were assumed to decrease stability the most in this research. Therefore, it would be expected that the conditions with the lowest stability would most often show statistical significance in their results when compared to the most stable condition.
A significant increase in velocity between EOFT and ECFT conditions was only observed in one participant. Additionally, a significant increase in velocity between EOFT and EOFTan conditions, which includes a larger gap in stability, was only observed in half of the participants. This indicates that velocity analysis of COP oscillations may not be sensitive to small amounts of instability. However, it has shown that it can be sensitive to significant changes in stability.
Previous studies support the result of increased COP velocity as stability decreases in healthy groups and suggest that the same pattern is true for participants suffering from a concussion. Additionally, studies indicate that participants with concussions have a greater COP velocity across balance conditions than non-concussed participants [7,11].

4.3. Comparison of Analysis Methods

Both computed indices showed significant differences resulting from changes in stability based on COP oscillation data recordings. When all conditions were compared to the baseline using Dunnett’s post hoc analysis, it appears that ApEn was able to find significant changes with more sensitivity than velocity. Although ApEn was able to detect significant differences in nearly all stability conditions, the velocity measure was only able to indicate significant deviances with consistency in the two least stable conditions, ECFTan.
Velocity analysis was only able to find significant differences in the EOFTan and EOFT conditions about half of the time. It is likely that the velocity analysis is limited in its usefulness by the limits that the body has as far as how quickly it can move. ApEn is not limited by the ability of the human body, and the velocity of motion is constrained by physiologic limitations of muscle activation kinetics. Despite the loss of sensitivity with velocity, there are some advantages to using it in real-world scenarios. The computational cost of calculating ApEn is much higher than that of velocity as it operates under polynomial time complexity, compared to the linear time complexity of velocity. This means that ApEn takes much longer to calculate, making velocity valuable for quick analysis of data outside of a lab setting for uses such as rapid concussion diagnosis.

4.4. Limitations and Future Considerations

This study was limited by a couple of factors. The high sample rate (1200 Hz) used for force plate data collection may have caused the entropy analysis to be biased with the redundancy of data in the time series. Additionally, the sample was small and one of convenience, so it is likely the data were underpowered. A larger number of participants to collect data from, a reduced data collection sampling rate, and collection of data over a greater amount of time per trial, such as a minute or two instead of 30 s, as was conducted for this work, would be beneficial for future studies. Additionally, this study was affected by the inherent limitations of ApEn. The values chosen for m and r have a significant effect on the result of ApEn. Although numerous values for each were tested in this study, a more in-depth analysis into how the ApEn of COP data is affected by varied m and r-values would be pertinent. ApEn can also become biased with a large sample size [52], which was a consideration in this study and contributed to the data collection limitations mentioned above.
The results of this study lead to many interesting avenues for future examination. For example, comparing the results of ApEn with the results of sample entropy to determine if, by avoiding the limitations of ApEn, sample entropy can give more information about postural control. Another future consideration could be completing an analysis of data from non-neurotypical participants, such as those suffering from concussion, to learn how the techniques investigated in this work can determine differences in the postural control mechanisms of healthy and injured participants. Finally, including an analysis of the angular acceleration of the COP and COM signals to identify how COP oscillations pivot as the two signals move toward and away from one another could be utilized to learn more about the postural control system during quiet standing. Namely, considering the distance between the COP and COM over time could lead to interesting findings as it is directly proportional to the angular acceleration, but does not require any derivative calculations.

5. Conclusions

Analysis of COP oscillations in quiet standing of neurotypical participants provided insight into how the body compensates for small amounts of instability. Evidence from this study suggests that variability and velocity of the COP increase as stability decreases in the generally healthy sample of six participants. Both of those analyses were able to consistently indicate significant differences between a baseline EOFT condition and less stable ECFTan conditions. ApEn appeared to be more sensitive than velocity and was able to identify significant differences between baseline and all tandem stances, while also indicating significance between EO and EC versions of the feet together stance. The results of this study provide an understanding of how the postural control system functions under baseline, neurotypical conditions. The unique methodology was designed for simple data collection, opening these techniques up to a variety of clinical applications. It may be possible to correlate the patterns which inform that understanding of further instability caused by brain injury and potentially identify metrics that can more objectively link brain functionality to postural control.

Author Contributions

Conceptualization, N.T. and S.R.; methodology, N.T. and S.R.; software, N.T.; validation, N.T. and S.R.; formal analysis, N.T.; investigation, N.T.; resources, N.T., G.A. and S.R.; data curation, N.T. and G.A.; writing—original draft preparation, N.T.; writing—review and editing, N.T., G.A. and S.R.; visualization, N.T.; supervision, G.A. and S.R.; project administration, S.R. All authors have read and agreed to the published version of the manuscript.

Funding

This research received no external funding.

Institutional Review Board Statement

This study was conducted in accordance with the Declaration of Helsinki and approved by the Institutional Review Board of Grand Valley State University (protocol code 18-246-H; date of approval: 7 May 2018).

Informed Consent Statement

Informed consent was obtained from all subjects involved in the study.

Data Availability Statement

The data presented in this study are available upon request from the corresponding author. The data are not publicly available due to constraints imposed on laboratory availability.

Acknowledgments

We thank Diana McCrumb for her efforts in data collection and all the participants who volunteered their time to contribute to the work of this study. We thank Jarred Parr for his valuable advice on software development. We also thank Blake Ashby for his support and input.

Conflicts of Interest

The authors declare no conflict of interest.

References

  1. Pollock, A.S.; Durward, B.R.; Rowe, P.J.; Paul, J.P. What Is Balance? Clin. Rehabil. 2000, 14, 402–406. [Google Scholar] [CrossRef]
  2. Jacobs, J.V.; Horak, F.B. Cortical Control of Postural Responses. J. Neural Transm. 2007, 114, 1339. [Google Scholar] [CrossRef] [Green Version]
  3. Horak, F.B. Postural Orientation and Equilibrium: What Do We Need to Know about Neural Control of Balance to Prevent Falls? Age Ageing 2006, 35, ii7–ii11. [Google Scholar] [CrossRef] [Green Version]
  4. Winter, D. Human Balance and Posture Control during Standing and Walking. Gait Posture 1995, 3, 193–214. [Google Scholar] [CrossRef]
  5. Massion, J. Postural Control System. Curr. Opin. Neurobiol. 1994, 4, 877–887. [Google Scholar] [CrossRef] [PubMed]
  6. Fujimoto, M.; Bair, W.-N.; Rogers, M.W. Center of Pressure Control for Balance Maintenance during Lateral Waist-Pull Perturbations in Older Adults. J. Biomech. 2015, 48, 963–968. [Google Scholar] [CrossRef] [Green Version]
  7. Rochefort, C.; Walters-Stewart, C.; Aglipay, M.; Barrowman, N.; Zemek, R.; Sveistrup, H. Balance Markers in Adolescents at 1 Month Postconcussion. Orthop. J. Sports Med. 2017, 5, 2325967117695507. [Google Scholar] [CrossRef] [PubMed] [Green Version]
  8. Chvatal, S.A.; Torres-Oviedo, G.; Safavynia, S.A.; Ting, L.H. Common Muscle Synergies for Control of Center of Mass and Force in Nonstepping and Stepping Postural Behaviors. J. Neurophysiol. 2011, 106, 999–1015. [Google Scholar] [CrossRef] [PubMed] [Green Version]
  9. Oba, N.; Sasagawa, S.; Yamamoto, A.; Nakazawa, K. Difference in Postural Control during Quiet Standing between Young Children and Adults: Assessment with Center of Mass Acceleration. PLoS ONE 2015, 10, e0140235. [Google Scholar] [CrossRef] [Green Version]
  10. Catena, R.D.; van Donkelaar, P.; Chou, L.-S. Different Gait Tasks Distinguish Immediate vs. Long-Term Effects of Concussion on Balance Control. J. Neuroeng. Rehabil. 2009, 6, 25. [Google Scholar] [CrossRef] [PubMed] [Green Version]
  11. Merchant-Borna, K.; Jones, C.M.C.; Janigro, M.; Wasserman, E.B.; Clark, R.A.; Bazarian, J.J. Evaluation of Nintendo Wii Balance Board as a Tool for Measuring Postural Stability After Sport-Related Concussion. J. Athl. Train. 2017, 52, 245–255. [Google Scholar] [CrossRef] [Green Version]
  12. Yu, E.; Abe, M.; Masani, K.; Kawashima, N.; Eto, F.; Haga, N.; Nakazawa, K. Evaluation of Postural Control in Quiet Standing Using Center of Mass Acceleration: Comparison Among the Young, the Elderly, and People with Stroke. Arch. Phys. Med. Rehabil. 2008, 89, 1133–1139. [Google Scholar] [CrossRef] [PubMed]
  13. Mansfield, A.; Inness, E.L. Force Plate Assessment of Quiet Standing Balance Control: Perspectives on Clinical Application within Stroke Rehabilitation. Rehabil. Process Outcome 2015, 4, RPO.S20363. [Google Scholar] [CrossRef] [Green Version]
  14. Versteeg, C.S.; Ting, L.H.; Allen, J.L. Hip and Ankle Responses for Reactive Balance Emerge from Varying Priorities to Reduce Effort and Kinematic Excursion: A Simulation Study. J. Biomech. 2016, 49, 3230–3237. [Google Scholar] [CrossRef] [PubMed] [Green Version]
  15. Lafonda, D.; Duarteb, M.; Princea, F. Comparison of Three Methods to Estimate the Center of Mass during Balance Assessment. J. Biomech. 2004, 37, 1421–1426. [Google Scholar] [CrossRef] [PubMed]
  16. Winter, D.A.; Patla, A.E.; Ishac, M.; Gage, W.H. Motor Mechanisms of Balance during Quiet Standing. J. Electromyogr. Kinesiol. 2003, 13, 49–56. [Google Scholar] [CrossRef]
  17. Hsue, B.-J.; Miller, F.; Su, F.-C. The Dynamic Balance of the Children with Cerebral Palsy and Typical Developing during Gait. Part I: Spatial Relationship between COM and COP Trajectories. Gait Posture 2009, 29, 465–470. [Google Scholar] [CrossRef]
  18. Sarabon, N.; Jernej, R.; Loefler, S.; Kern, H. Sensitivity of Body Sway Parameters During Quiet Standing to Manipulation of Support Surface Size. J. Sports Sci. Med. 2010, 9, 431–438. [Google Scholar]
  19. Prieto, T.E.; Myklebust, J.B.; Hoffmann, R.G.; Lovett, E.G.; Myklebust, B.M. Measures of Postural Steadiness: Differences between Healthy Young and Elderly Adults. IEEE Trans. Biomed. Eng. 1996, 43, 956–966. [Google Scholar] [CrossRef]
  20. Corbeil, P.; Blouin, J.-S.; Bégin, F.; Nougier, V.; Teasdale, N. Perturbation of the Postural Control System Induced by Muscular Fatigue. Gait Posture 2003, 18, 92–100. [Google Scholar] [CrossRef]
  21. Creath, R.; Kiemel, T.; Horak, F.; Peterka, R.; Jeka, J. A Unified View of Quiet and Perturbed Stance: Simultaneous Co-Existing Excitable Modes. Neurosci. Lett. 2005, 377, 75–80. [Google Scholar] [CrossRef] [PubMed]
  22. Aramaki, Y.; Nozaki, D.; Masani, K.; Sato, T.; Nakazawa, K.; Yano, H. Reciprocal Angular Acceleration of the Ankle and Hip Joints during Quiet Standing in Humans. Exp. Brain Res. 2001, 136, 463–473. [Google Scholar] [CrossRef]
  23. Suzuki, Y.; Nomura, T.; Casadio, M.; Morasso, P. Intermittent Control with Ankle, Hip, and Mixed Strategies during Quiet Standing: A Theoretical Proposal Based on a Double Inverted Pendulum Model. J. Theor. Biol. 2012, 310, 55–79. [Google Scholar] [CrossRef] [PubMed] [Green Version]
  24. Günther, M.; Grimmer, S.; Siebert, T.; Blickhan, R. All Leg Joints Contribute to Quiet Human Stance: A Mechanical Analysis. J. Biomech. 2009, 42, 2739–2746. [Google Scholar] [CrossRef] [PubMed]
  25. Sasagawa, S.; Shinya, M.; Nakazawa, K. Interjoint Dynamic Interaction during Constrained Human Quiet Standing Examined by Induced Acceleration Analysis. J. Neurophysiol. 2014, 111, 313–322. [Google Scholar] [CrossRef] [Green Version]
  26. Reimann, H.; Schöner, G. A Multi-Joint Model of Quiet, Upright Stance Accounts for the “Uncontrolled Manifold” Structure of Joint Variance. Biol. Cybern. 2017, 111, 389–403. [Google Scholar] [CrossRef] [Green Version]
  27. Morasso, P.; Cherif, A.; Zenzeri, J. Quiet Standing: The Single Inverted Pendulum Model Is Not so Bad after All. PLoS ONE 2019, 14, e0213870. [Google Scholar] [CrossRef] [Green Version]
  28. Tigrini, A.; Verdini, F.; Fioretti, S.; Mengarelli, A. Long Term Correlation and Inhomogeneity of the Inverted Pendulum Sway Time-Series under the Intermittent Control Paradigm. Commun. Nonlinear Sci. Numer. Simul. 2022, 108, 106198. [Google Scholar] [CrossRef]
  29. Valovich McLeod, T.C.; Hale, T.D. Vestibular and Balance Issues Following Sport-Related Concussion. Brain Inj. 2015, 29, 175–184. [Google Scholar] [CrossRef]
  30. Baracks, J.; Casa, D.J.; Covassin, T.; Sacko, R.; Scarneo, S.E.; Schnyer, D.; Yeargin, S.W.; Neville, C. Acute Sport-Related Concussion Screening for Collegiate Athletes Using an Instrumented Balance Assessment. J. Athl. Train. 2018, 53, 597–605. [Google Scholar] [CrossRef] [Green Version]
  31. Matuszak, J.M.; McVige, J.; McPherson, J.; Willer, B.; Leddy, J. A Practical Concussion Physical Examination Toolbox. Sports Health 2016, 8, 260–269. [Google Scholar] [CrossRef] [PubMed] [Green Version]
  32. Cavanaugh, J.T.; Guskiewicz, K.M.; Giuliani, C.; Marshall, S.; Mercer, V.S.; Stergiou, N. Recovery of Postural Control after Cerebral Concussion: New Insights Using Approximate Entropy. J. Athl. Train. 2006, 41, 305–313. [Google Scholar] [PubMed]
  33. Pincus, S. Approximate Entropy (ApEn) as a Complexity Measure. Chaos 1995, 5, 110–117. [Google Scholar] [CrossRef] [PubMed]
  34. Fino, P.C.; Nussbaum, M.A.; Brolinson, P.G. Decreased High-Frequency Center-of-Pressure Complexity in Recently Concussed Asymptomatic Athletes. Gait Posture 2016, 50, 69–74. [Google Scholar] [CrossRef] [PubMed] [Green Version]
  35. Cavanaugh, J.T.; Mercer, V.S.; Stergiou, N. Approximate Entropy Detects the Effect of a Secondary Cognitive Task on Postural Control in Healthy Young Adults: A Methodological Report. J. NeuroEngineering Rehabil. 2007, 7, 42. [Google Scholar]
  36. Montesinos, L. On the Use of Approximate Entropy and Sample Entropy with Centre of Pressure Time-Series. J. Neuroeng. Rehabil. 2018, 15, 116. [Google Scholar] [CrossRef] [Green Version]
  37. Winter, D.A. Biomechanics and Motor Control of Human Movement, 4th ed.; Wiley: Hoboken, NJ, USA, 2020; Available online: https://www.wiley.com/en-us/Biomechanics+and+Motor+Control+of+Human+Movement%2C+4th+Edition-p-9780470398180 (accessed on 29 July 2020).
  38. Kirchner, M. Characterising Postural Sway Fluctuations in Humans Using Linear and Nonlinear Methods. Ph.D. Thesis, Goethe University, Frankfurt, Germany.
  39. Latash, M.L.; Ferreira, S.S.; Wieczorek, S.A.; Duarte, M. Movement Sway: Changes in Postural Sway during Voluntary Shifts of the Center of Pressure. Exp. Brain Res. 2003, 150, 314–324. [Google Scholar] [CrossRef]
  40. Singh, N.B.; Taylor, W.R.; Madigan, M.L.; Nussbaum, M.A. The Spectral Content of Postural Sway during Quiet Stance: Influences of Age, Vision and Somatosensory Inputs. J. Electromyogr. Kinesiol. 2012, 22, 131–136. [Google Scholar] [CrossRef]
  41. Woltring, H.J. On Optimal Smoothing and Derivative Estimation From Noisy Displacement Data in Biomechanics. Hum. Mov. Sci. 1985, 4, 229–245. [Google Scholar] [CrossRef]
  42. Combined Output from Multiple Force Plates—Nexus 2.6 Documentation—Vicon Documentation. Available online: https://docs.vicon.com/display/Nexus26/Combined+output+from+multiple+force+plates (accessed on 27 April 2020).
  43. Exell, T.; Kerwin, D.; Irwin, G.; Gittoes, M. Calculating Centre of Pressure from Multiple Force Plates for Kinetic ANalyses of Sprint Running. Port. J. Sport Sci. 2011, 11, 4. [Google Scholar]
  44. Lee, H.; Granata, K.P. Process Stationarity and Reliability of Trunk Postural Stability. Clin. Biomech. 2008, 23, 735–742. [Google Scholar] [CrossRef] [Green Version]
  45. Rocchi, L.; Chiari, L.; Cappello, A.; Horak, F.B. Identification of Distinct Characteristics of Postural Sway in Parkinson’s Disease: A Feature Selection Procedure Based on Principal Component Analysis. Neurosci. Lett. 2006, 394, 140–145. [Google Scholar] [CrossRef]
  46. Mengarelli, A.; Tigrini, A.; Verdini, F.; Rabini, R.A.; Fioretti, S. Multiscale Fuzzy Entropy Analysis of Balance: Evidences of Scale-Dependent Dynamics on Diabetic Patients with and without Neuropathy. IEEE Trans. Neural Syst. Rehabil. Eng. 2023, 31, 1462–1471. [Google Scholar] [CrossRef] [PubMed]
  47. Hadamus, A.; Błażkiewicz, M.; Kowalska, A.J.; Wydra, K.T.; Grabowicz, M.; Łukowicz, M.; Białoszewski, D.; Marczyński, W. Nonlinear and Linear Measures in the Differentiation of Postural Control in Patients after Total Hip or Knee Replacement and Healthy Controls. Diagnostics 2022, 12, 1595. [Google Scholar] [CrossRef]
  48. Stergiou, N.; Decker, L.M. Human Movement Variability, Nonlinear Dynamics, and Pathology: Is There A Connection? Hum. Mov. Sci. 2011, 30, 869–888. [Google Scholar] [CrossRef] [Green Version]
  49. van Emmerik, R.E.A.; Ducharme, S.W.; Amado, A.C.; Hamill, J. Comparing Dynamical Systems Concepts and Techniques for Biomechanical Analysis. J. Sport Health Sci. 2016, 5, 3–13. [Google Scholar] [CrossRef]
  50. Cavanaugh, J.T.; Guskiewicz, K.M.; Stergiou, N. A Nonlinear Dynamic Approach for Evaluating Postural Control: New Directions for the Management of Sport-Related Cerebral Concussion. Sports Med. 2005, 35, 935–950. [Google Scholar] [CrossRef]
  51. Cavanaugh, J.T.; Guskiewicz, K.M.; Giuliani, C.; Marshall, S.; Mercer, V.; Stergiou, N. Detecting Altered Postural Control after Cerebral Concussion in Athletes with Normal Postural Stability. Br. J. Sports Med. 2005, 39, 805–811. [Google Scholar] [CrossRef] [Green Version]
  52. Richman, J.S.; Moorman, J.R. Physiological Time-Series Analysis Using Approximate Entropy and Sample Entropy. Am. J. Physiol. Heart Circ. Physiol. 2000, 278, H2039–H2049. [Google Scholar] [CrossRef] [Green Version]
Figure 1. Participant stance for (A) feet together, and (B) feet tandem trials. Arms were positioned with the index finger pointed towards the shoulder on the same side of the body, the elbows pulled in, and knees extended. For feet together stances, the feet were positioned next to one another on the same force plate, whereas for feet tandem stances, the feet were placed in one front of another on two separate force plates.
Applsci 13 09259 g001
Figure 2. Foot and force plate orientation for (A) feet together and (B) feet tandem stances where the coordinate system of the force plates is such that sway in the x-direction is anterior/posterior and sway in the y-direction is medial/lateral.
Applsci 13 09259 g002
Figure 3. Center of pressure (COP) data of participant 1 from (A) an eyes open, feet together (EOFT) trial in the anterior/posterior direction; (B) an eyes open, feet together (EOFT) trial in the medial/lateral direction; (C) an eyes closed, feet tandem, dominant foot forward (ECFTanDF) trial in the anterior/posterior direction; and (D) an eyes closed, feet tandem, dominant foot forward (ECFTanDF) trial in the medial/lateral direction where the more stable EOFT trial appears to display less variability than the less stable ECFTanDF trial.
Applsci 13 09259 g003
Figure 4. Approximate entropy of participant 1 for (A) an eyes open, feet together (EOFT) trial in the anterior/posterior direction; (B) an eyes open, feet together (EOFT) trial in the medial/lateral direction; (C) an eyes closed, feet tandem, dominant foot forward (ECFTanDF) trial in the anterior/posterior direction; and (D) an eyes closed, feet tandem, dominant foot forward (ECFTanDF) trial in the medial/lateral where the more stable EOFT trial displays a consistently lower ApEn than the less stable ECTanDF trial.
Applsci 13 09259 g004
Figure 5. Approximate entropy for each condition including eyes open, feet together (EOFT), eyes closed, feet together (ECFT), eyes open, dominant foot back (EODB), eyes open, dominant foot forward (EODF), eyes closed, dominant foot back (ECDB), and eyes closed, dominant foot forward (ECDF) with standard error bars shown for participant 1 in (A) the anterior/posterior direction; (B) the medial/lateral direction, displaying the presence of a significant difference between any of the stability levels with an ANOVA test p-value less than the alpha value of 0.05.
Applsci 13 09259 g005
Figure 6. Difference in approximate entropy from the baseline, most stable eyes open, feet together (EOFT) stance with standard error bars shown for each condition from participant 1 in (A) the anterior/posterior direction; (B) the medial/lateral direction. A significant difference from the baseline EOFT condition is displayed for all stability conditions aside from the eyes closed, feet together (ECFT) condition. Dunnett’s post hoc test results are shown with p-values less than the alpha value of 0.05 indicating significant difference from EOFT.
Applsci 13 09259 g006
Figure 7. Velocity of participant 1 from (A) an eyes open, feet together (EOFT) trial in the anterior/posterior direction; (B) an eyes open, feet together (EOFT) trial in the medial/lateral direction; (C) an eyes closed, feet tandem, dominant foot forward (ECFTanDF) trial in the anterior/posterior direction; and (D) an eyes closed, feet tandem, dominant foot forward (ECFTanDF) trial in the medial/lateral direction where the maximum velocity magnitude is lower in the more stable EOFT trial than in the less stable ECFTanDF trial.
Applsci 13 09259 g007
Figure 8. Average velocity for each condition with standard error bars shown for participant 1 in (A) the anterior/posterior direction; (B) the medial/lateral direction, displaying the presence of a significant difference between any of the stability levels with an ANOVA test p-value less than the alpha value of 0.05.
Applsci 13 09259 g008
Figure 9. Difference in velocity from the baseline, most stable eyes open, feet together (EOFT) stance with standard error bars shown for each condition from participant 1 in (A) the anterior/posterior direction; (B) the medial/lateral direction. A significant difference from the baseline EOFT condition is displayed for all stability conditions aside from the eyes closed, feet together (ECFT) condition. Dunnett’s post hoc test results are shown, with p-values less than the alpha value of 0.05 indicating significant difference from EOFT.
Applsci 13 09259 g009
Table 1. Quiet standing balance conditions.
OrderBalance ConditionDescription
1EOFTEyes open, feet together (most stable, baseline)
2ECFTEyes closed, feet together
3EOTanDBEyes open, feet tandem, dominant foot in back
4ECTanDBEyes closed, feet tandem, dominant foot in back
5EOTanDFEyes open, feet tandem, dominant foot in front
6ECTanDFEyes closed, feet tandem, dominant foot in front
Disclaimer/Publisher’s Note: The statements, opinions and data contained in all publications are solely those of the individual author(s) and contributor(s) and not of MDPI and/or the editor(s). MDPI and/or the editor(s) disclaim responsibility for any injury to people or property resulting from any ideas, methods, instructions or products referred to in the content.