Article

Design of Liquid–Air Hybrid Cooling Garment and Its Effect on Local Thermal Comfort

School of Textile and Clothing, Shanghai University of Engineering Science, Shanghai 201620, China
*
Author to whom correspondence should be addressed.
Appl. Sci. 2023, 13(16), 9414; https://doi.org/10.3390/app13169414
Submission received: 7 July 2023 / Revised: 7 August 2023 / Accepted: 17 August 2023 / Published: 19 August 2023
(This article belongs to the Special Issue Advanced Sensors for Postural or Gait Stability Assessment)

Abstract

:
Personal cooling garments were reported effective in improving thermal comfort in hot environments. In this study, three liquid–air hybrid cooling garments and one control garment were designed and made: aluminum-tube fan cooling (AAL), silicone-tube fan cooling (SAL), silicone-tube fan cooling with inner yarn fabric (YAL), and a control garment (CON) without the cooling sources. Subject trials were performed by eight female subjects in a climate chamber to simulate a summer indoor working environment at 32 °C and 50% relative humidity. The results showed that the liquid–air hybrid cooling garment provided effective convective and conductive heat dissipation compared with the no-cooling (CON) stat, chest, belly, shoulder, back, hand, thigh, and calf. The horizontal e, resulting in a decrease in local body skin temperature. Compared with the CON, the liquid–air cooling garment resulted in a maximum reduction of 1 °C for the mean torso skin temperature and 1.5 °C for the localized shoulder skin temperature. The AAL had a better cooling effect on the torso skin temperature compared with the SAL, and the cooling of the AAL was 0.5 °C lower than that of the SAL for the shoulder skin temperature. The presented liquid–air hybrid cooling garments were effective in cooling the body and improving thermal comfort. They were portable, accessible, and sustainable in hot indoor environments compared with air conditioners. Therefore, they could save energy.

1. Introduction

Indoor personnel usually use cooling systems such as air conditioners and electric fans to cool down in hot environments. However, such cooling sources are equipment-specific, importable, inflexible, and poorly adjustable to the needs of different individuals. Also, the use of air conditioners raises ecological and environmental issues [1]. Since these cooling sources limit the scope of personal use, the study of cooling clothing has been of increasing interest to researchers in the past decade. These garments can make up for the lack of thermal regulation of the human body in a hot environment and provide additional thermal protection to the wearer.
In 1962, Burton and Collierl [2] developed the first human-cooling garment, which became the starting point for the exploration of individual micro-environmental cooling clothing systems. Cooling clothing includes the use of air, liquids, phase change materials, and other cooling media to regulate the temperature of the micro-environment under the clothing to reduce the heat stress of the body in high-temperature environments [3]. The cooling form of these clothing items mainly includes liquid cooling, with a liquid pipeline to cool the body; ventilation cooling, with micro-fans to cool the body; PCM (phase change materials) cooling, with PCMs to cool the body; and hybrid cooling with both PCMs and ventilation. Compared with other cooling technologies, such as PCM cooling and air cooling, liquid cooling has higher reliability and cooling efficiency [4].
Currently, liquid cooling garments have been studied by many researchers in the aim of reducing thermal stress. The concept of something being “wearable” is also proposed and applied in the field of possible solutions developed in order to monitor the thermal state of the body [5]. Grant Bue [6] designed a liquid cooling garment where the pipe was woven into the garment to carry cold water to promote heat dissipation. TAO [7] et al. explored the cooling effect of 10% and 20% concentrations of phase change micro-particle coolant and water at different combinations, studied the effect of the inlet temperature and the flow rate, and concluded that the cooling effect of the phase change micro-particle solution was superior to that of water, especially at an inlet water temperature of 13 °C, when it can achieve the best effective cooling. Xu et al. [8] designed a man-portable cooling garment with cold liquid circulation based on thermoelectric refrigeration, and the results indicated that the system was capable of providing a water temperature of 15.7 °C and a cooling power of 340.4 W, with a climatic chamber temperature of 30 °C. In addition to the use of liquid–air garments in daily life, there are also applications in the medical and health fields, the military, and the firefighting field. Ku et al. [9] used three different cooling garments to compare the response of patients with multiple sclerosis (MS) to short-term cooling therapy. The results showed that the active cooling garment system was the most effective one for reducing the temperature of MS patients. Speckman et al. [10] tested the effectiveness of liquid cooling undergarments (LCUs) in reducing the heat burden of soldiers while wearing chemical protective clothing. They found that the cooling effect of LCUs could be increased by designing a larger body coverage for cooling. McLellan et al. studied a liquid–air garment for managing heat stress in firefighters and found that the liquid-cooled garment could achieve 70% cooling within the first ten minutes [11]. Kayacan [12] et al. designed two liquid–air garments with different compositions and placed them on a thermal manikin for cooling comparison, but both were limited in their area of use due to the heavy cooler of the liquid–air garment.
At the same time, portable ventilated garments have the advantages of convenience, light weight, and low cost [13]. The most important thing is that the ventilation device embedded in the clothing can greatly increase the convection heat dissipation [14,15,16]. Over the years, many scholars have studied the ventilation efficiency and cooling performance of ventilation clothing. The effects of body movement and wind speed [17], garment design [18], fabric properties, and body posture [19] on the ventilation rate of garments have been investigated using tracer gas methods. Numerous studies [20,21,22,23] have studied the cooling effect of ventilation clothing under forced ventilation in different environments and different motion states. Del Ferraro et al. [24] designed a ventilation jacket, and the cooling effect was examined using a thermal manikin. The results showed that significant increases in dry heat losses (through convection) were brought for the trunk thermal zones, of which the percent changes greatly exceeded 100% for the thermal zones close to the fans. The air ventilation determined significant decreases in the total thermal insulation (IT) values (up to 35%) compared with the fans-off condition, confirming and quantifying the cooling effect of the ventilation jacket. Apart from these research studies, many studies have performed subject trials to study the cooling effect of air ventilation garments. Chinevere et al. [25] showed that subjects wearing a ventilated garment over a soldier’s combat uniform had significantly reduced heat stress. Chan et al. [26,27] studied the effect of wearing ventilated clothing on thermal comfort for outdoor workers in Hong Kong during the summer and showed that subjects experienced a significant reduction in heat stress. Hidenori Otani [28] used a fan-cooled garment to test its cooling effect on athletes after exercise, confirming that air-cooled clothing can effectively alleviate heat stress and discomfort during and after exercise in a humid and hot environment. Fukuda et al. [28] showed that the using of fan-cooled clothing while walking under compensable heat stress was effective in attenuating increases in core temperature, skin temperature, and heat rate compared with no cooling, but Bian et al. [29] showed that when the air temperature exceeds the skin temperature, the cooling effect provided by the ventilated garment may not be sufficient to dissipate the excess body heat. Wang et al. [30] designed a personal cooling system (HPCS) by combining a phase change material (PCM) with an electric fan. Results demonstrated that the control of electric fans could suppress the mean skin temperature rise to 34.0 °C by over 15 min.
Although there are some differences in the cooling methods of various types of cooling garments, most of them aim to reduce the skin temperature of the microclimate zone. In previous studies, some scholars have put the cooling source in direct contact with the surface of the human body. Although this cooling method can significantly improve the cooling effect, it tends to cause local hypothermia [31]. In addition, the cooling source in some cooling garments can cause mobility inconveniences to the wearer due to its excessive size [12]. Furthermore, from the aforementioned studies, it can be concluded that both liquid cooling and air ventilation cooling had a good application point, but the use of both cooling methods in one garment was quite few. Therefore, in this study, hybrid cooling garments using both liquid and air cooling were designed and made. The cooling garments combined both liquid cooling and air ventilation cooling. They were aluminum tube combined with fan cooling (AAL), silicone tube combined with fan cooling (SAL), silicone tube with inner yarn fabric combined with fan cooling (YAL), and a control garment without a cooling source (CON). This study was conducted by human trials, in which a summer indoor working environment with an ambient temperature of 32 °C and relative humidity of 50% was set in the climate chamber, and the subjects simulated a sedentary working condition for 45 min and rest for 20 min. The objective of this study was to examine the cooling effect of different styles of liquid–air cooling garments and find the best layout in the structural design of the cooling garments.

2. A general Description of the Designed Cooling Garments and the Control Garment

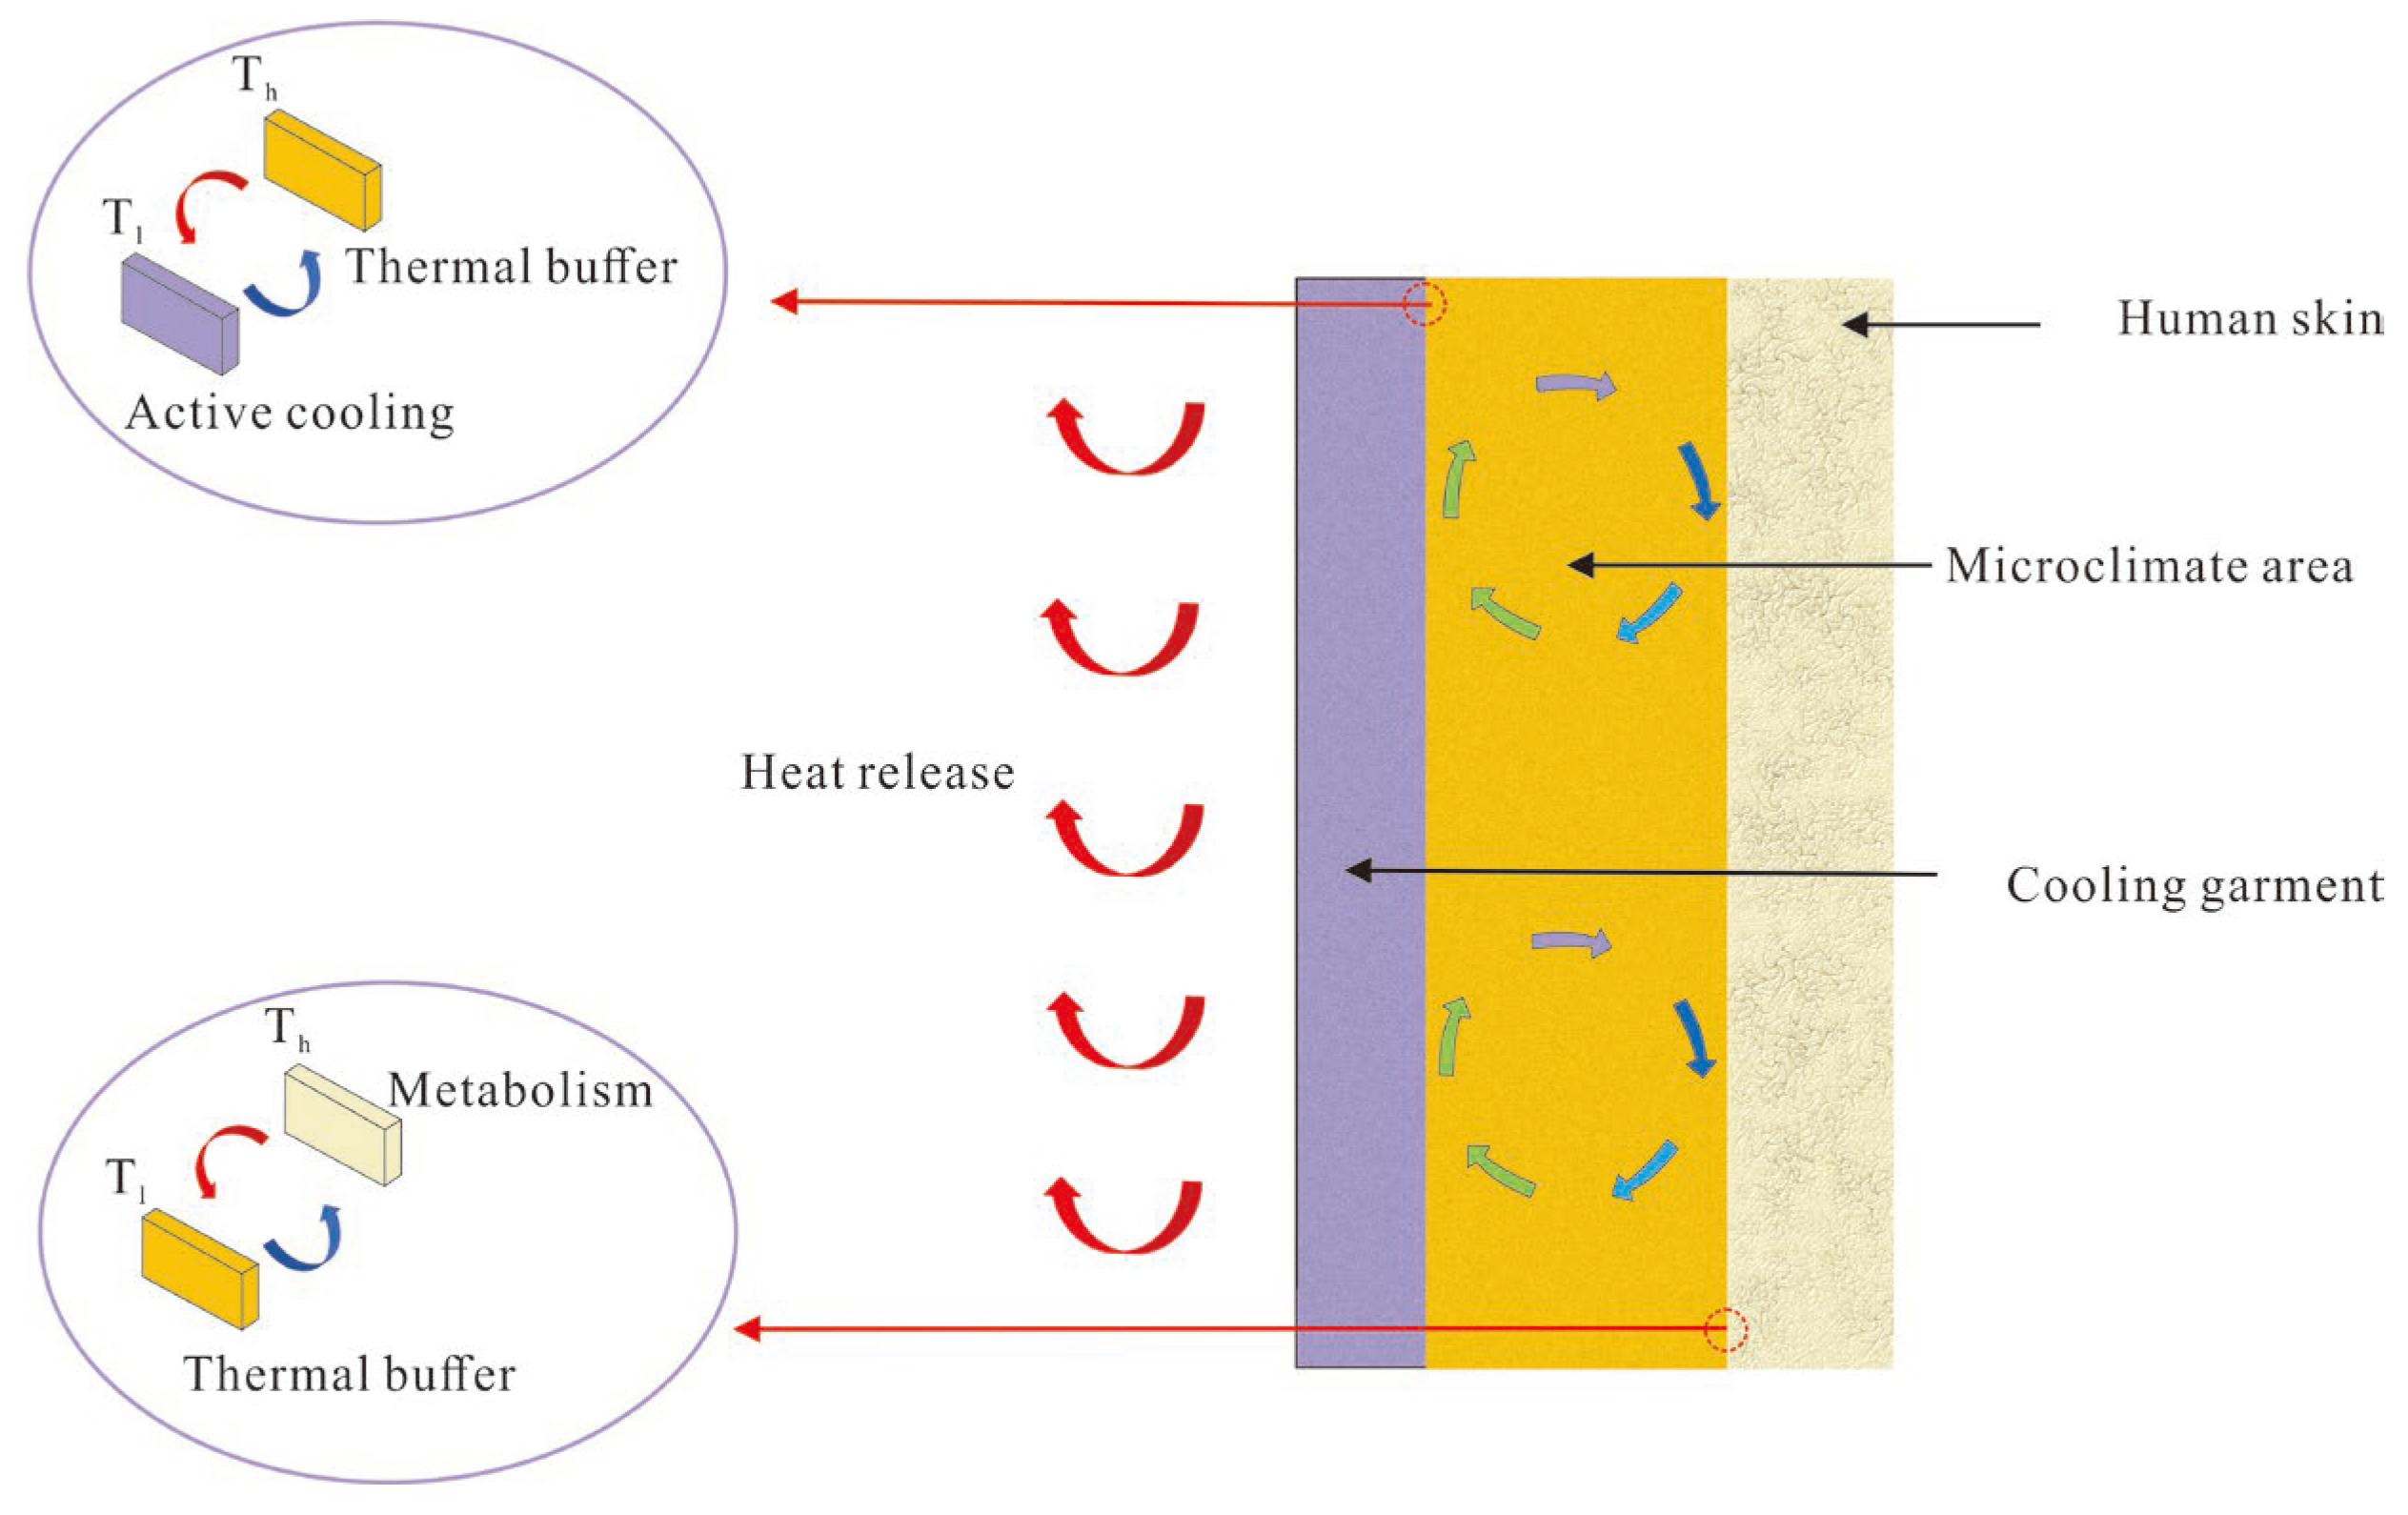
2.1. Heat Exchange Processes in the Micro-Climate under Clothing

The area between the inner surface of the liquid–air garments and the body surface is called the microclimate zone (Figure 1). The temperature of the microclimate zone directly affects the temperature perception of the human skin surface. In nature, heat always travels from the high-temperature region (Th) to the low-temperature region (Tl). Excess heat generated by the body due to metabolism is transferred to the microclimate zone in various ways, and if the heat in the microclimate zone does not dissipate in time, it can make the body feel stuffy. However, when a cooling garment is used, it can enhance heat dissipation under the micro-climate and relieve heat discomfort.

2.2. The Design Idea of the Cooling Garments and the Control Garment

The location of the skin surface for heat exchange needs continuous improvement. The torso accounts for 74% of the body’s basal metabolism. Thus, it is more reasonable to set the torso as the cooling site according to previous studies [32,33]. Thus, the design of liquid–air cooling garments in the form of a vest structure was used. Three cooling garments and one control garment were designed and made: aluminum-tube fan cooling (AAL), silicone-tube fan cooling (SAL), silicone-tube fan cooling with inner yarn (YAL), and a control garment (CON) without the cooling sources but the same size and fabrics as the cooling garments. The difference between AAL and SAL is the difference in the tubes. AAL uses aluminum tubes, SAL uses silicone tubes, both use the way of upper and lower splicing, the upper part of the torso is liquid–air, and the lower part is air-cooled. The difference between YAL and the first two garments is that YAL uses the way of inner and outer splicing, the inner layer is liquid–air, the outer layer is air-cooled, and the tube part still uses silicone tubes. The total weight of AAL is 1.16 kg, the total weight of SAL is 1.08 kg, the total weight of YAL is 1.14 kg, and the total weight of CON is 0.15 kg. An illustration of the cooling garments is shown in Figure 2, Figure 3 and Figure 4.

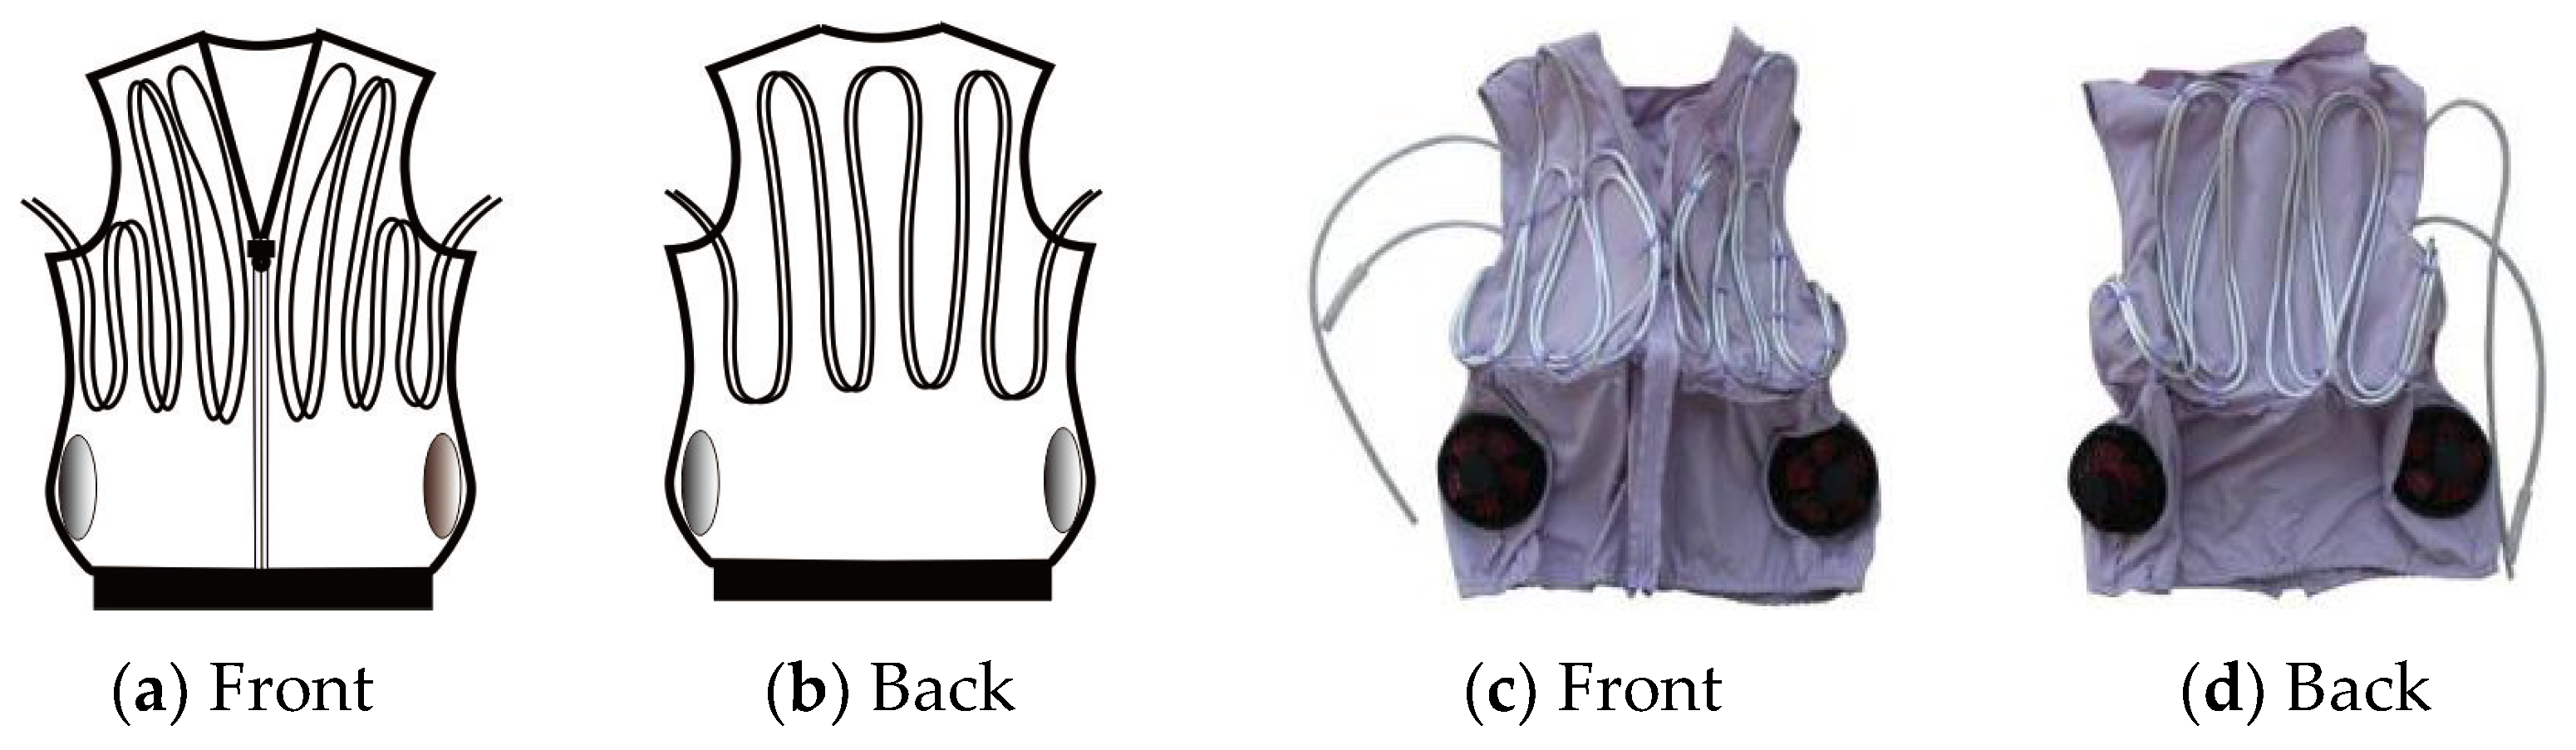
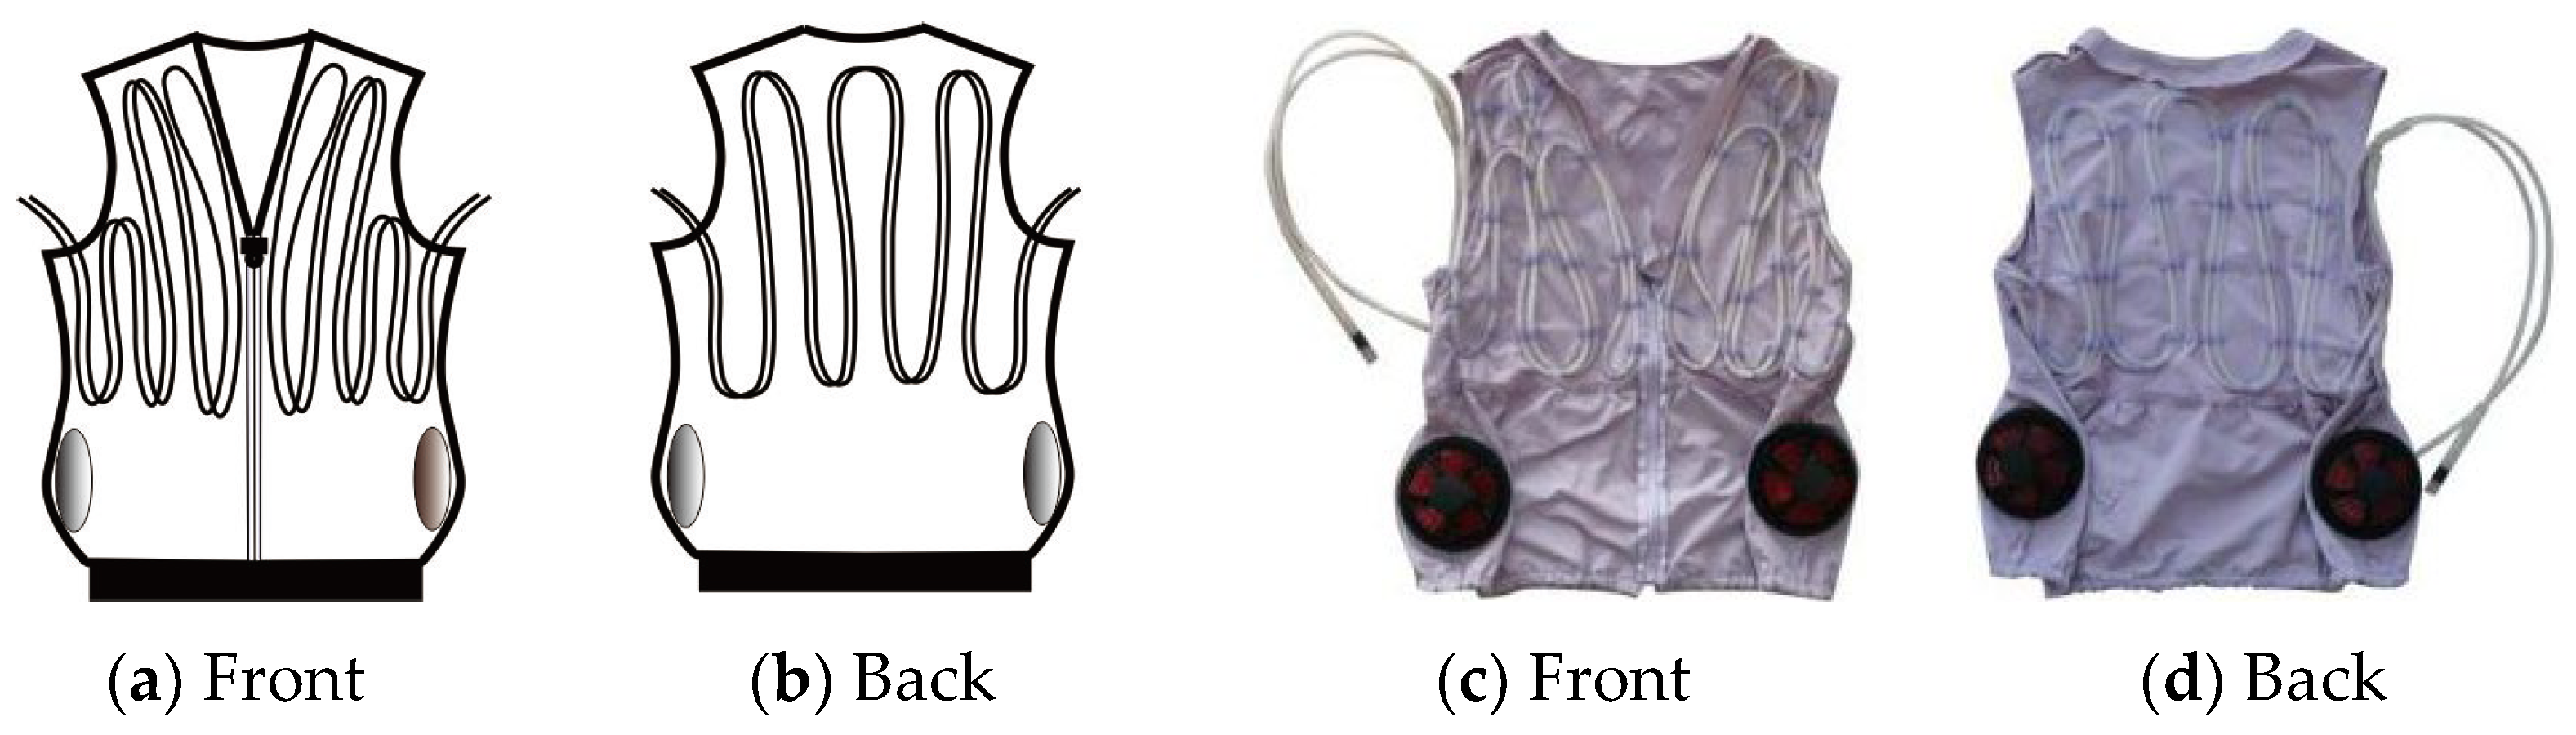
3. A Detailed Description of the Designed Cooling Garments and the Control Garment

3.1. Clothing Size and Textile Martials

The specifications and sizes of the four garments, including the control garment, are shown in Table 1. In terms of fabric, all four garments were made of polyester-blend cotton non-elastic fabric, among which the outer layer of YAL was made of polyester spandex mesh fabric. Table 2 shows the details of the parameters of the four garments.

3.2. Liquid Pipe Materials of the Cooling Garments

If the thermal conductivity of the liquid-cooled pipe material is excellent, most of the cooling source cold can be conveyed to the body, which can increase the efficiency of the cooling source utilization [34]. Therefore, an aluminum tube with a lower density was selected and used in AAL, and its density was 2.7 g/cm3. The aluminum tube pipe was 8.4 m long and weighed 356 g. The pipe size was a round pipe with an inner diameter of 4 mm and an outer diameter of 6 mm. A silicone tube was used both in SAL and YAL. The inner and outer diameter of the silicone tube was the same as that of the aluminum tube; both were 4 mm × 6 mm. The silicone tube density was 2.2 g/cm3. A length of 8.4 m and weight of 290 g of the silicone pipe was used both in SAL and YAL. Table 3 shows the material details of the liquid pipes used in the three cooling garments.

3.3. The Liquid Cooling System of the Cooling Garments

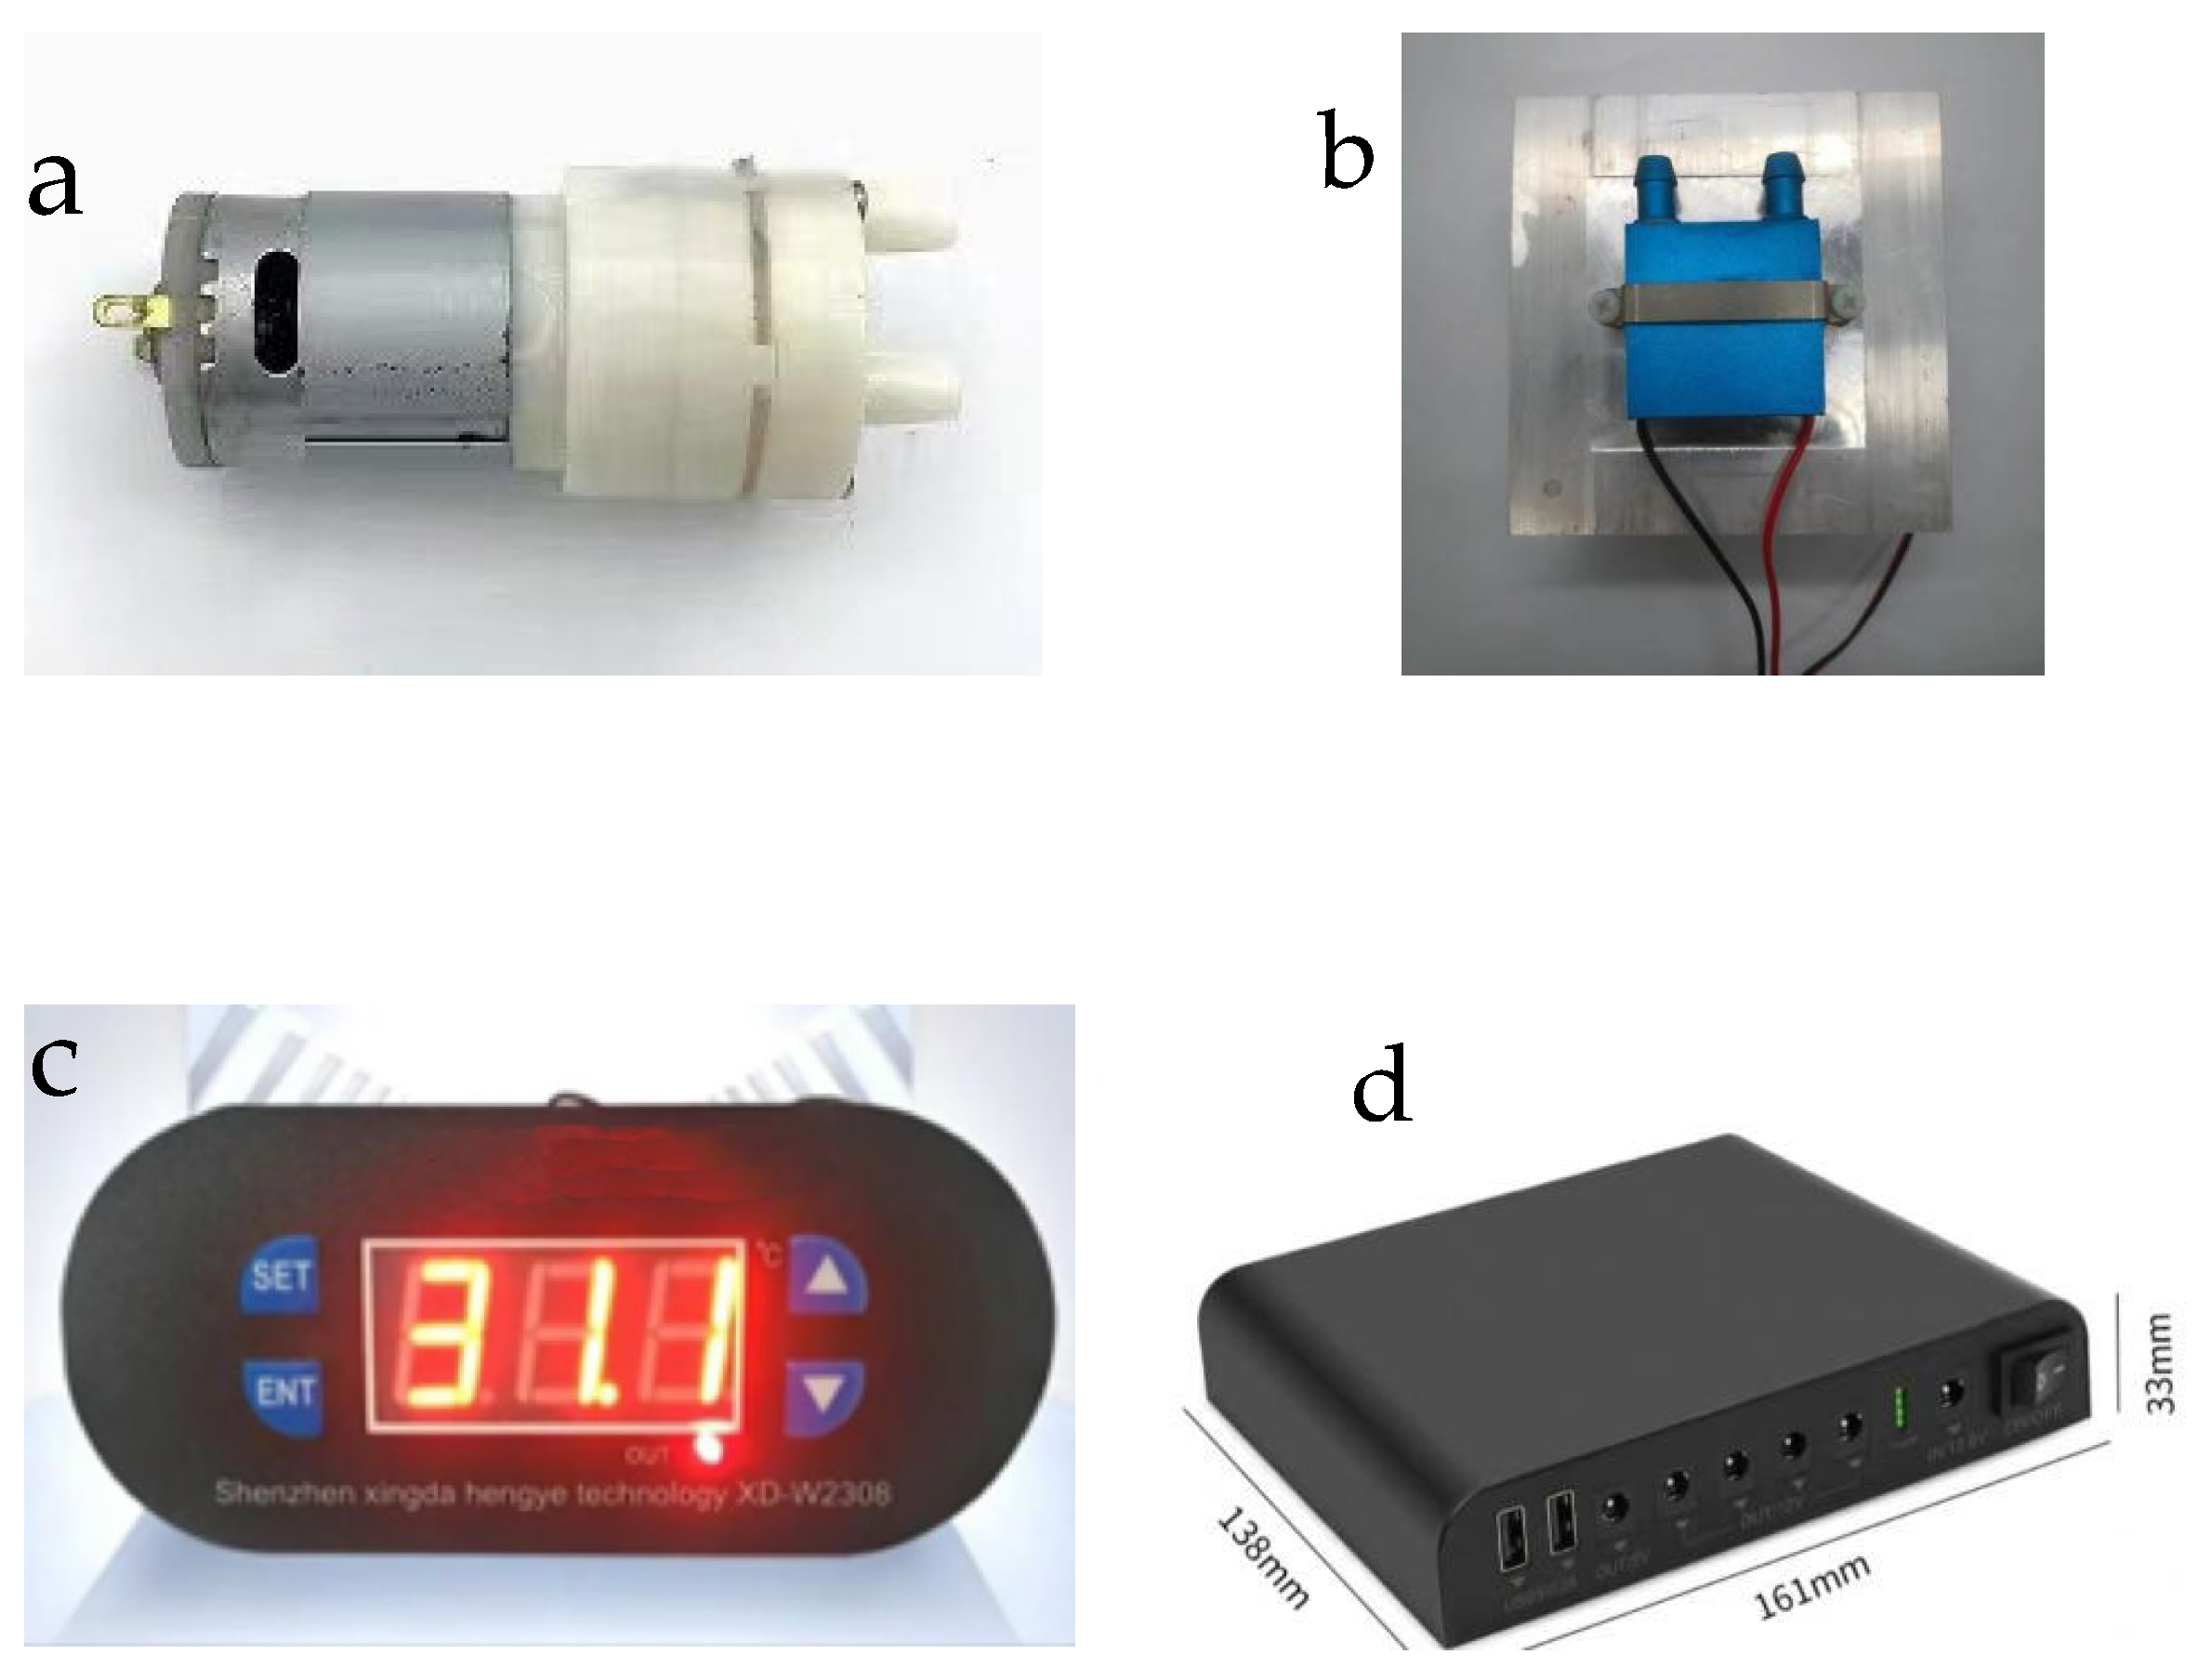
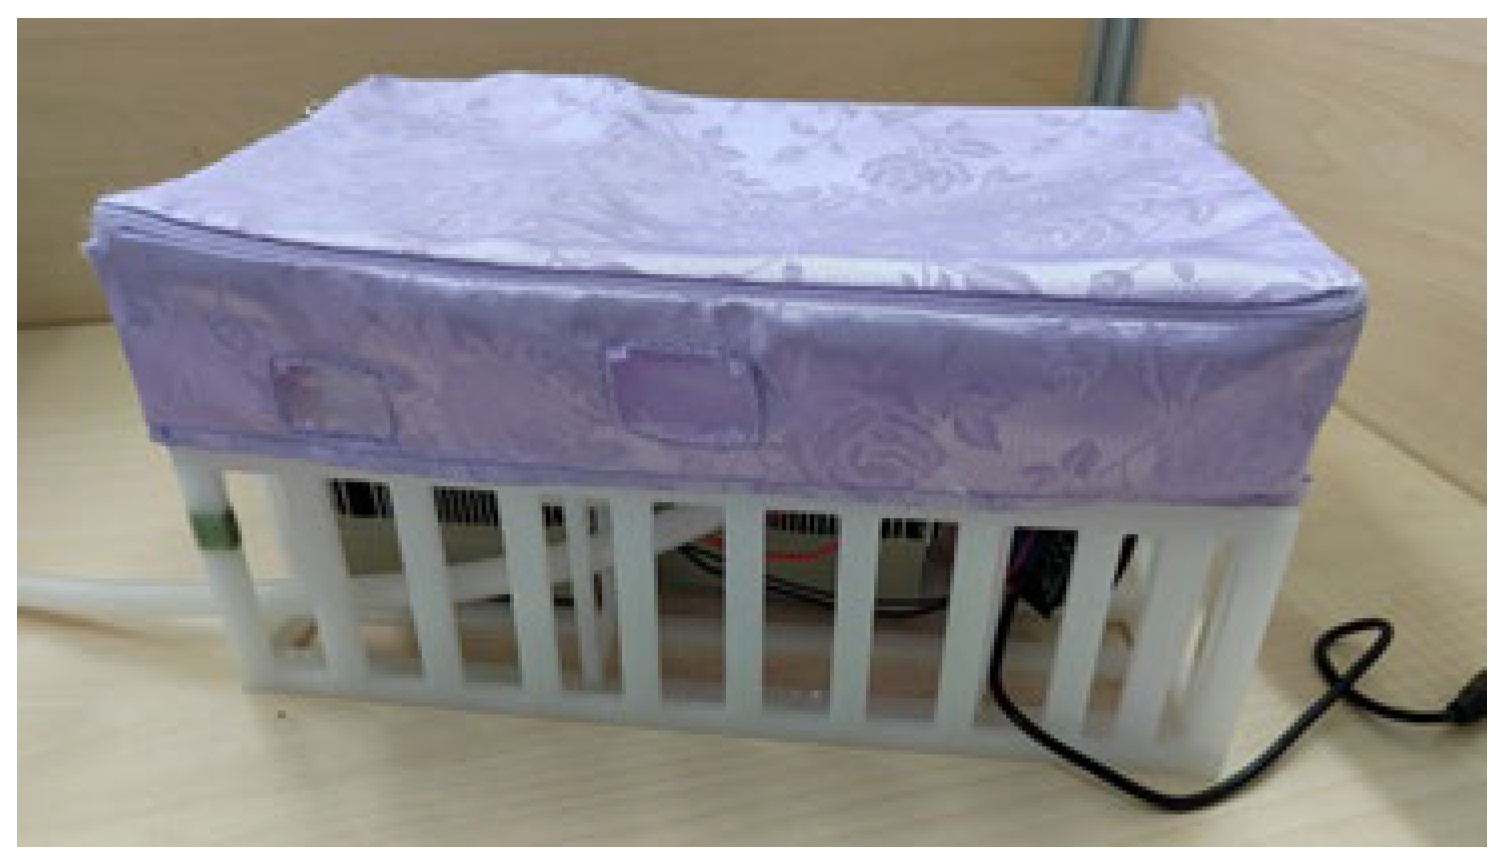
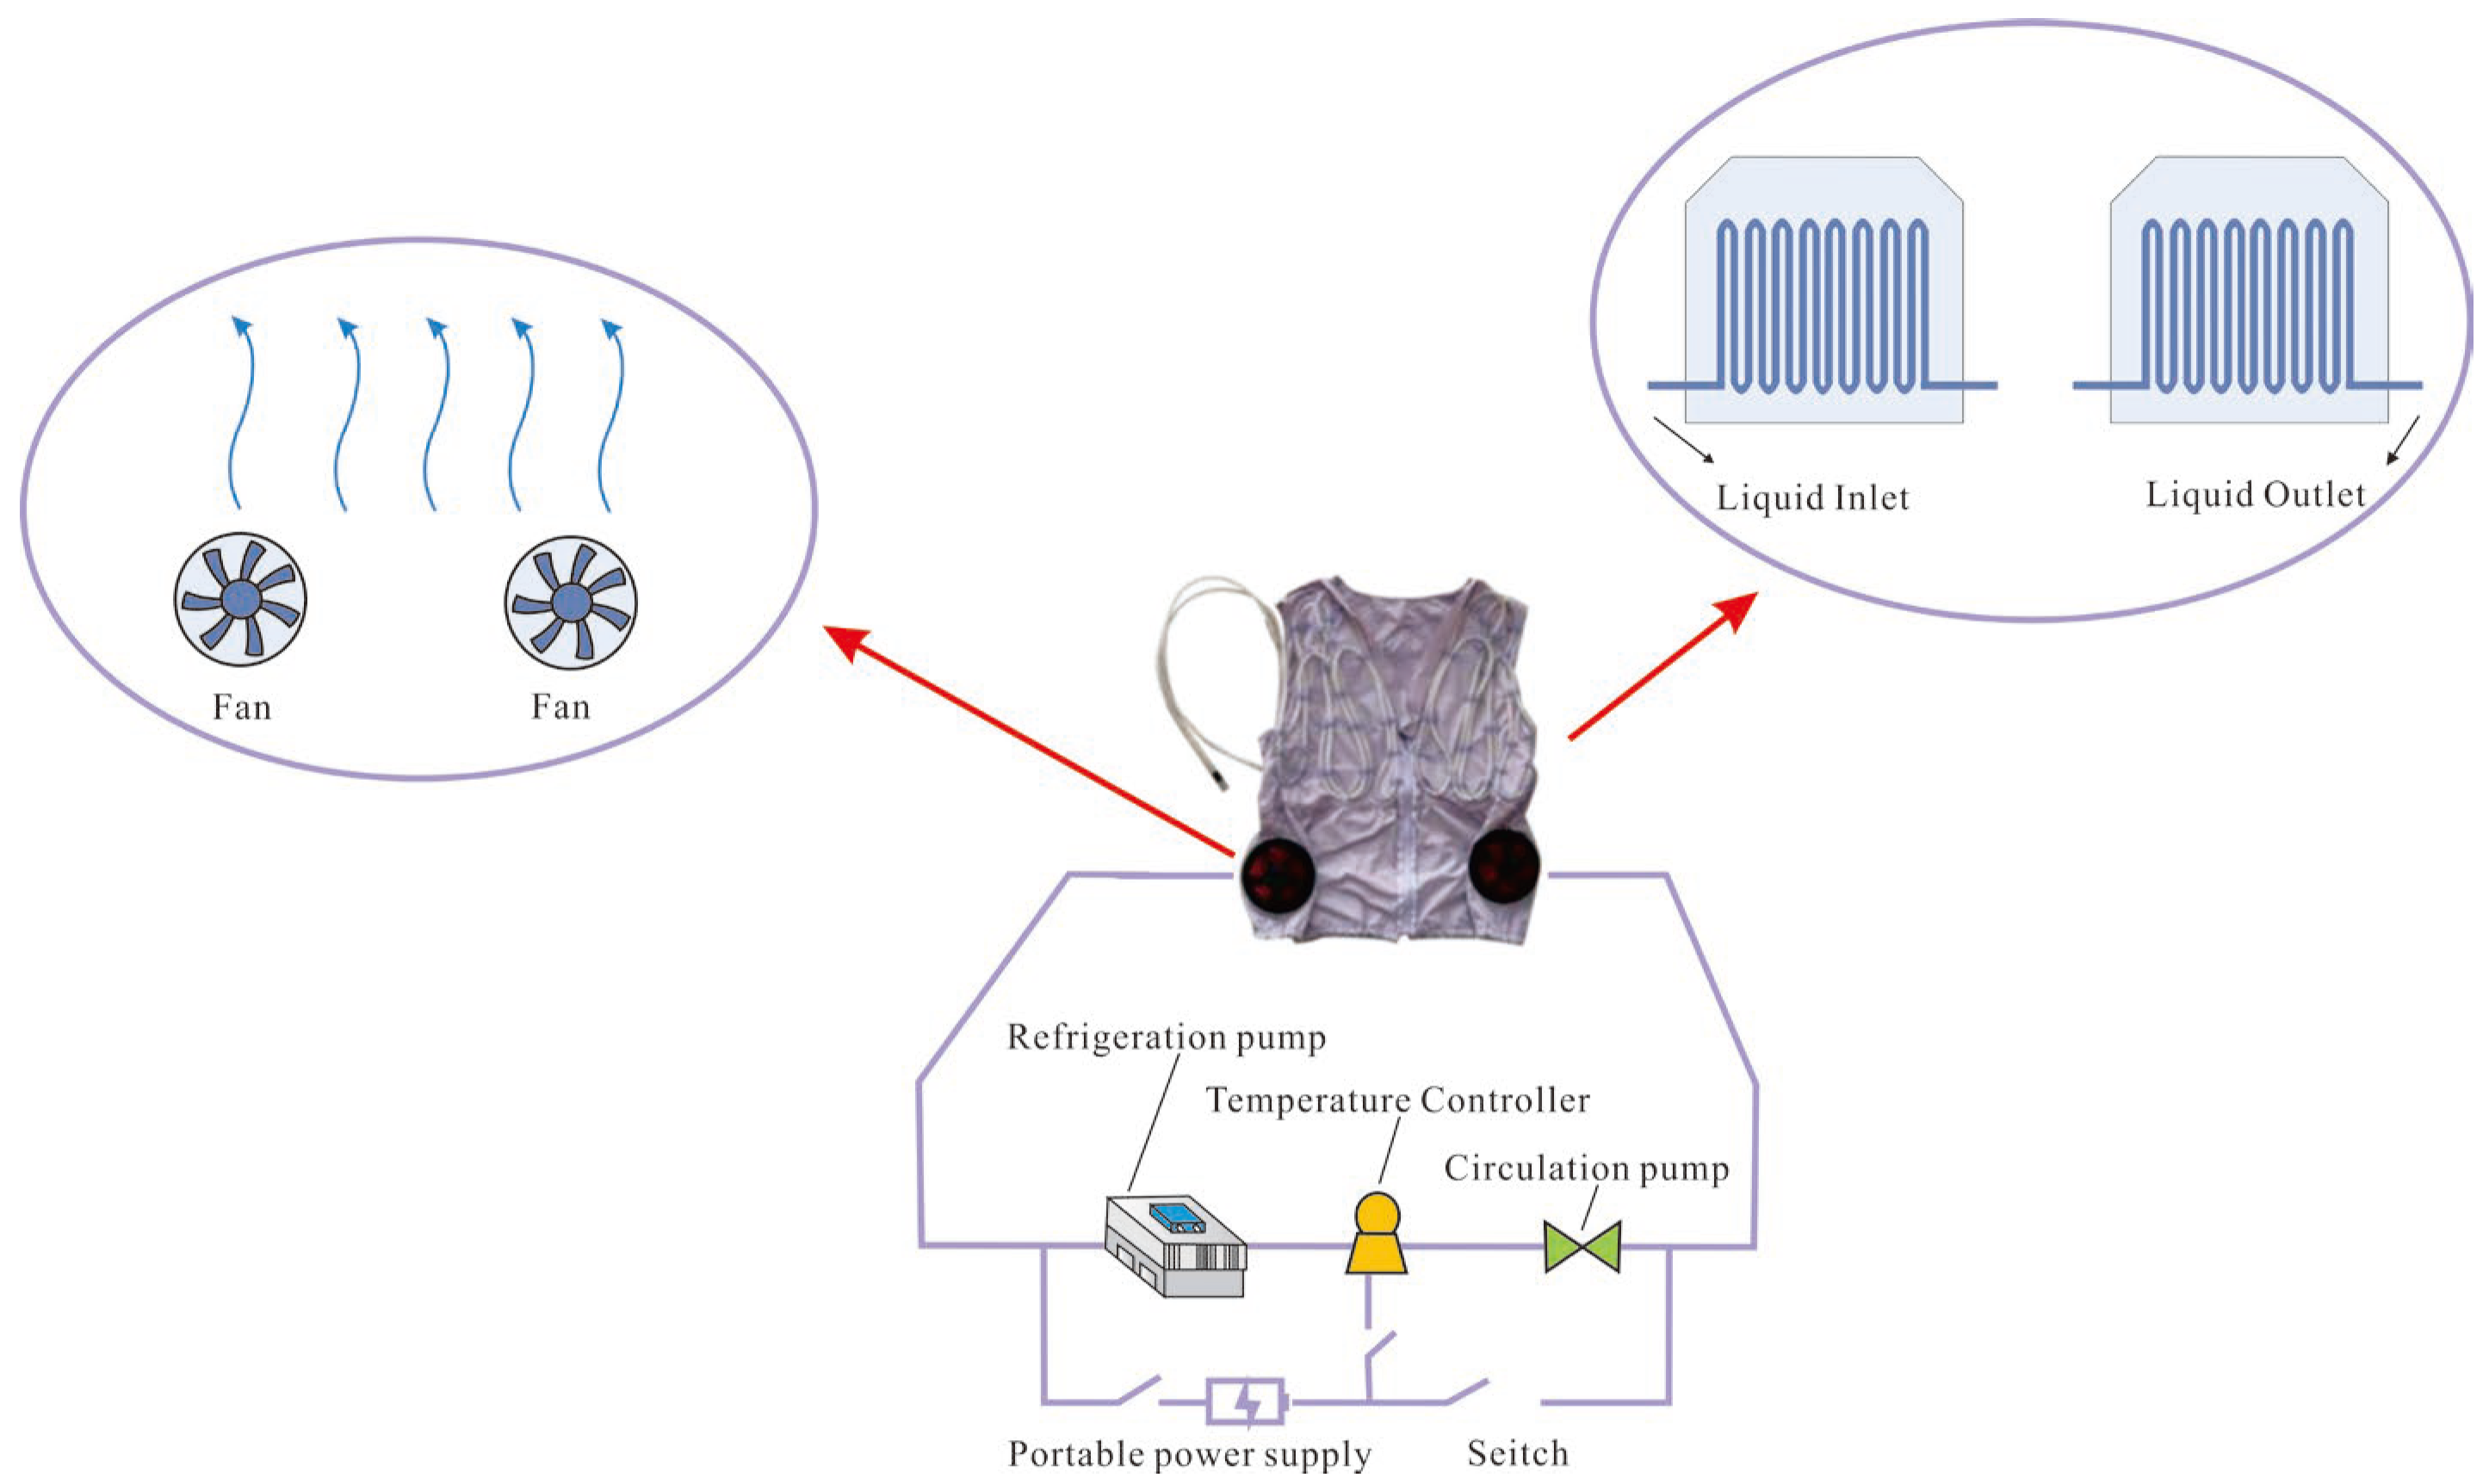
3.3.1. The Components of the Liquid Cooling System

In the present study, an emerging semiconductor refrigeration pump was used to produce cooled water. The pump was compact and capable of providing a continuous cooling capacity [35]. Considering the problem of overcooling when wearing liquid–air garments, a thermostat was set in the whole device, and the role of the thermostat was to make the clothing more intelligent. The probe of the thermostat was connected to the outer wall of the liquid cooling tube, and when the liquid cooling tube was detected to be overcooled, it controlled the semiconductor refrigeration pump to stop the cooling.
The circulation pump used a head of 550 mL/min (as shown in Figure 5a). The refrigeration pump was two miniature water-cooled pumps (Figure 5b) which contained a refrigeration piece, with a size of 100 × 100 mm heat sink and a small fan; A SeetyXH-W1308 digital (Square Technology Ltd., Shenzhen, China) display thermostat was used (Figure 5c), whose temperature control range is −55–120 °C and whose temperature control accuracy is 0.1 °C. A mobile power supply (YNS-120HK, Romance Technology Corporation, Shenzhen, China) with an output voltage of 12v and a capacity of 38,400 mah (Figure 5d) was used to supply power. Additionally, different parts of the torso have different acceptance of water temperature [36], and the dynamic change of water temperature can meet the cooling needs of various parts of the body in different periods. Therefore, the thermostat was set to, when the temperature monitored by the thermostat was greater than 28 °C, start the semiconductor refrigeration pump to open refrigeration; when the monitored temperature was less than 20 °C, it stopped the work of the semiconductor refrigeration pump, providing overcooling protection.

3.3.2. The Circuit System

In terms of circuitry, the mobile power supply supplies the circulating pump and thermostat, and the thermostat controls the switch of the semiconductor refrigeration pump. In the circuit assembly process at the thermostat end, four interfaces A, B, C, and D, of the thermostat (Figure 6) are connected to different lines. Interface A connects the negative terminal of the load circuit (two semiconductor refrigeration pumps); interface B is connected to interface C to form a short circuit, while interface C connects to the negative terminal of the power supply; interface D connects to the positive terminal of the load circuit (two semiconductor refrigeration pumps), while interface D connects to the positive terminal of the power supply. Because the positive and negative terminals of the power supply side are at a socket, the connection of interfaces C and D to the power supply side is line-merged.

3.3.3. The Assembling of the Liquid Cooling System

When assembling these devices, PP (polypropylene) plates with better thermal insulation performance were used. Compared with the general acrylic material, PP material can withstand high temperatures, and can emit heat from the hot end of the semiconductor refrigeration pump, providing a guarantee of the safety of the experiment. The cuboid PP box is divided into two layers. In the upper layer, the circulating pump and mobile power supply are placed, and the two are isolated from each other; the lower layer houses the semiconductor refrigeration pump and thermostat, which are also isolated from each other. The periphery of the PP box adopts a fence structure, so that the hot air generated by the refrigeration pump can be distributed in time.
The assembled portable liquid cooling cycle box can be moved with the cooling vest and is a portable refrigeration system with a total weight of 3.2 kg (Figure 7). The assembled circulating cooling box can be worn by resting operators for approximately 2 h at 32 °C and 50% humidity. The quick-insert design of the water stop is convenient for quick connections between the cooling box and the three cooling vests designed. All the equipment can work normally after the power is powered on. The refrigeration pump starts the refrigeration, the circulation pump can drive the water circulation, and the pipelines are not blocked.

3.4. The Air Ventilation System of the Cooling Garments

For the three cooling garments, two small fans were selected with a mounting aperture of 9 cm, an outer diameter of 10.6 cm, and a thickness of 3.3 cm, weighing a total of 270 g; the fan blades were angled at 45° to form an efficient air inlet. The fans were connected to a mobile power supply 130 mm in length, 70 mm in width, and 28 mm in height, with an output voltage of 12 V. An airflow level of 25 L/S was provided when the power was fully charged. A working diagram of the whole cooling system of the liquid–air cooling garments is shown in Figure 8.

4. Methods

4.1. Participants of the Experiment

Eight healthy female subjects were selected for the experiment. Their age was (25 ± 1) years, their height was (162 ± 5) cm, their weight was (56 ± 5) kg, and their BMI was 21 ± 2 kg/m2. The subjects were informed of the purpose and procedure of the experiment before the experiment. They were aware of the precautions and safety policies during the experiment, and they were clear about the contents of the questionnaire they filled out. They were not allowed to drink alcohol or coffee for 24 h before the experiment, avoided strenuous exercise, and maintained emotional stability. Each subject wore four types of experimental clothing, and a total of 32 experiments (8 subjects × 4 clothing) were conducted, with each experiment being randomized. The study complied with the declaration of Helsinki and was approved by the University Ethnic Committee.

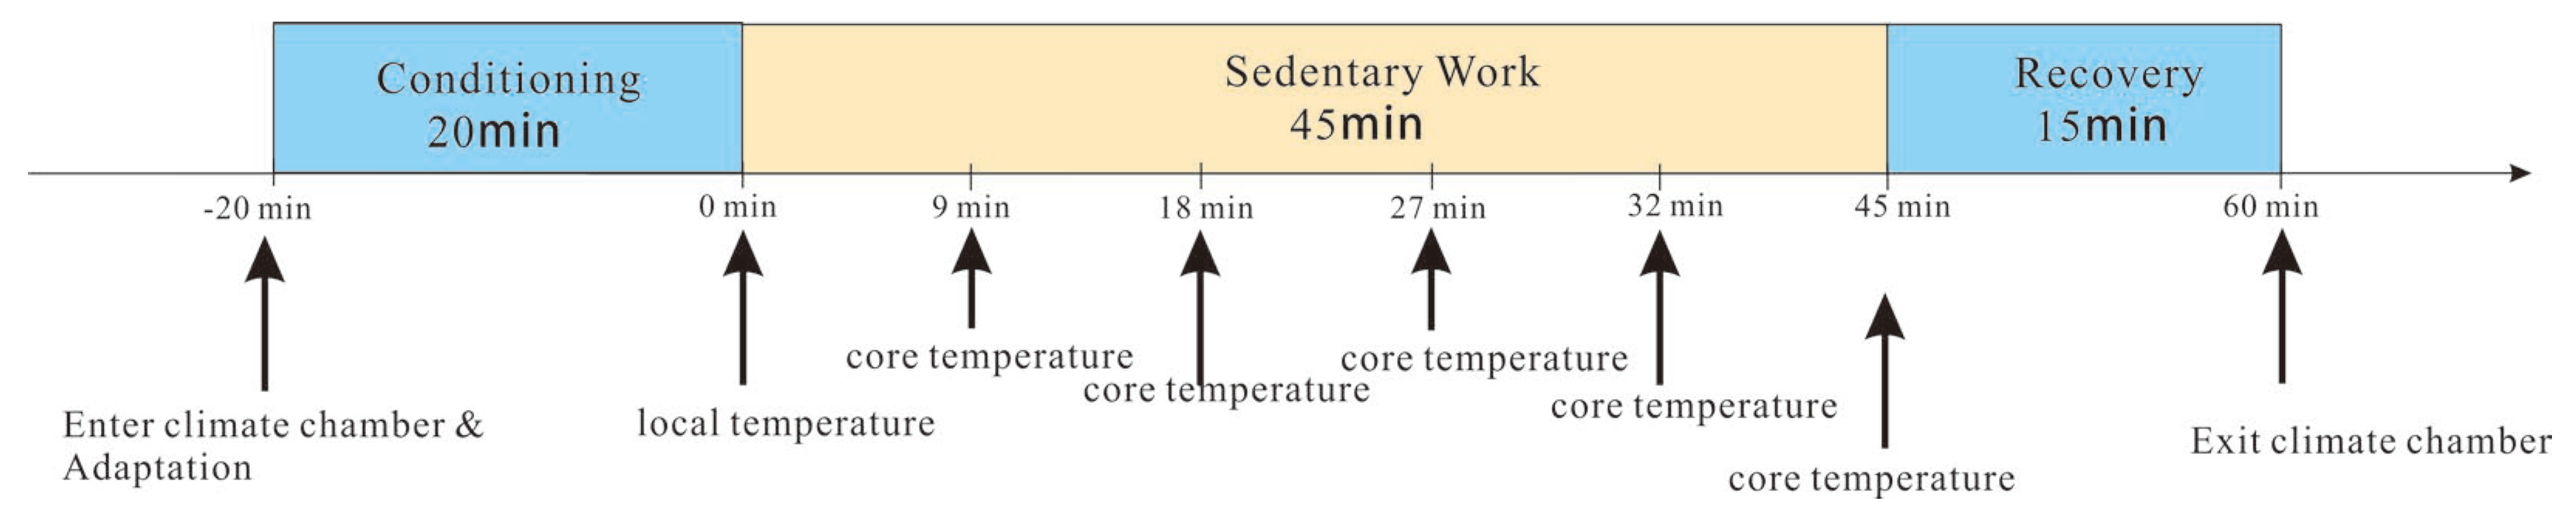
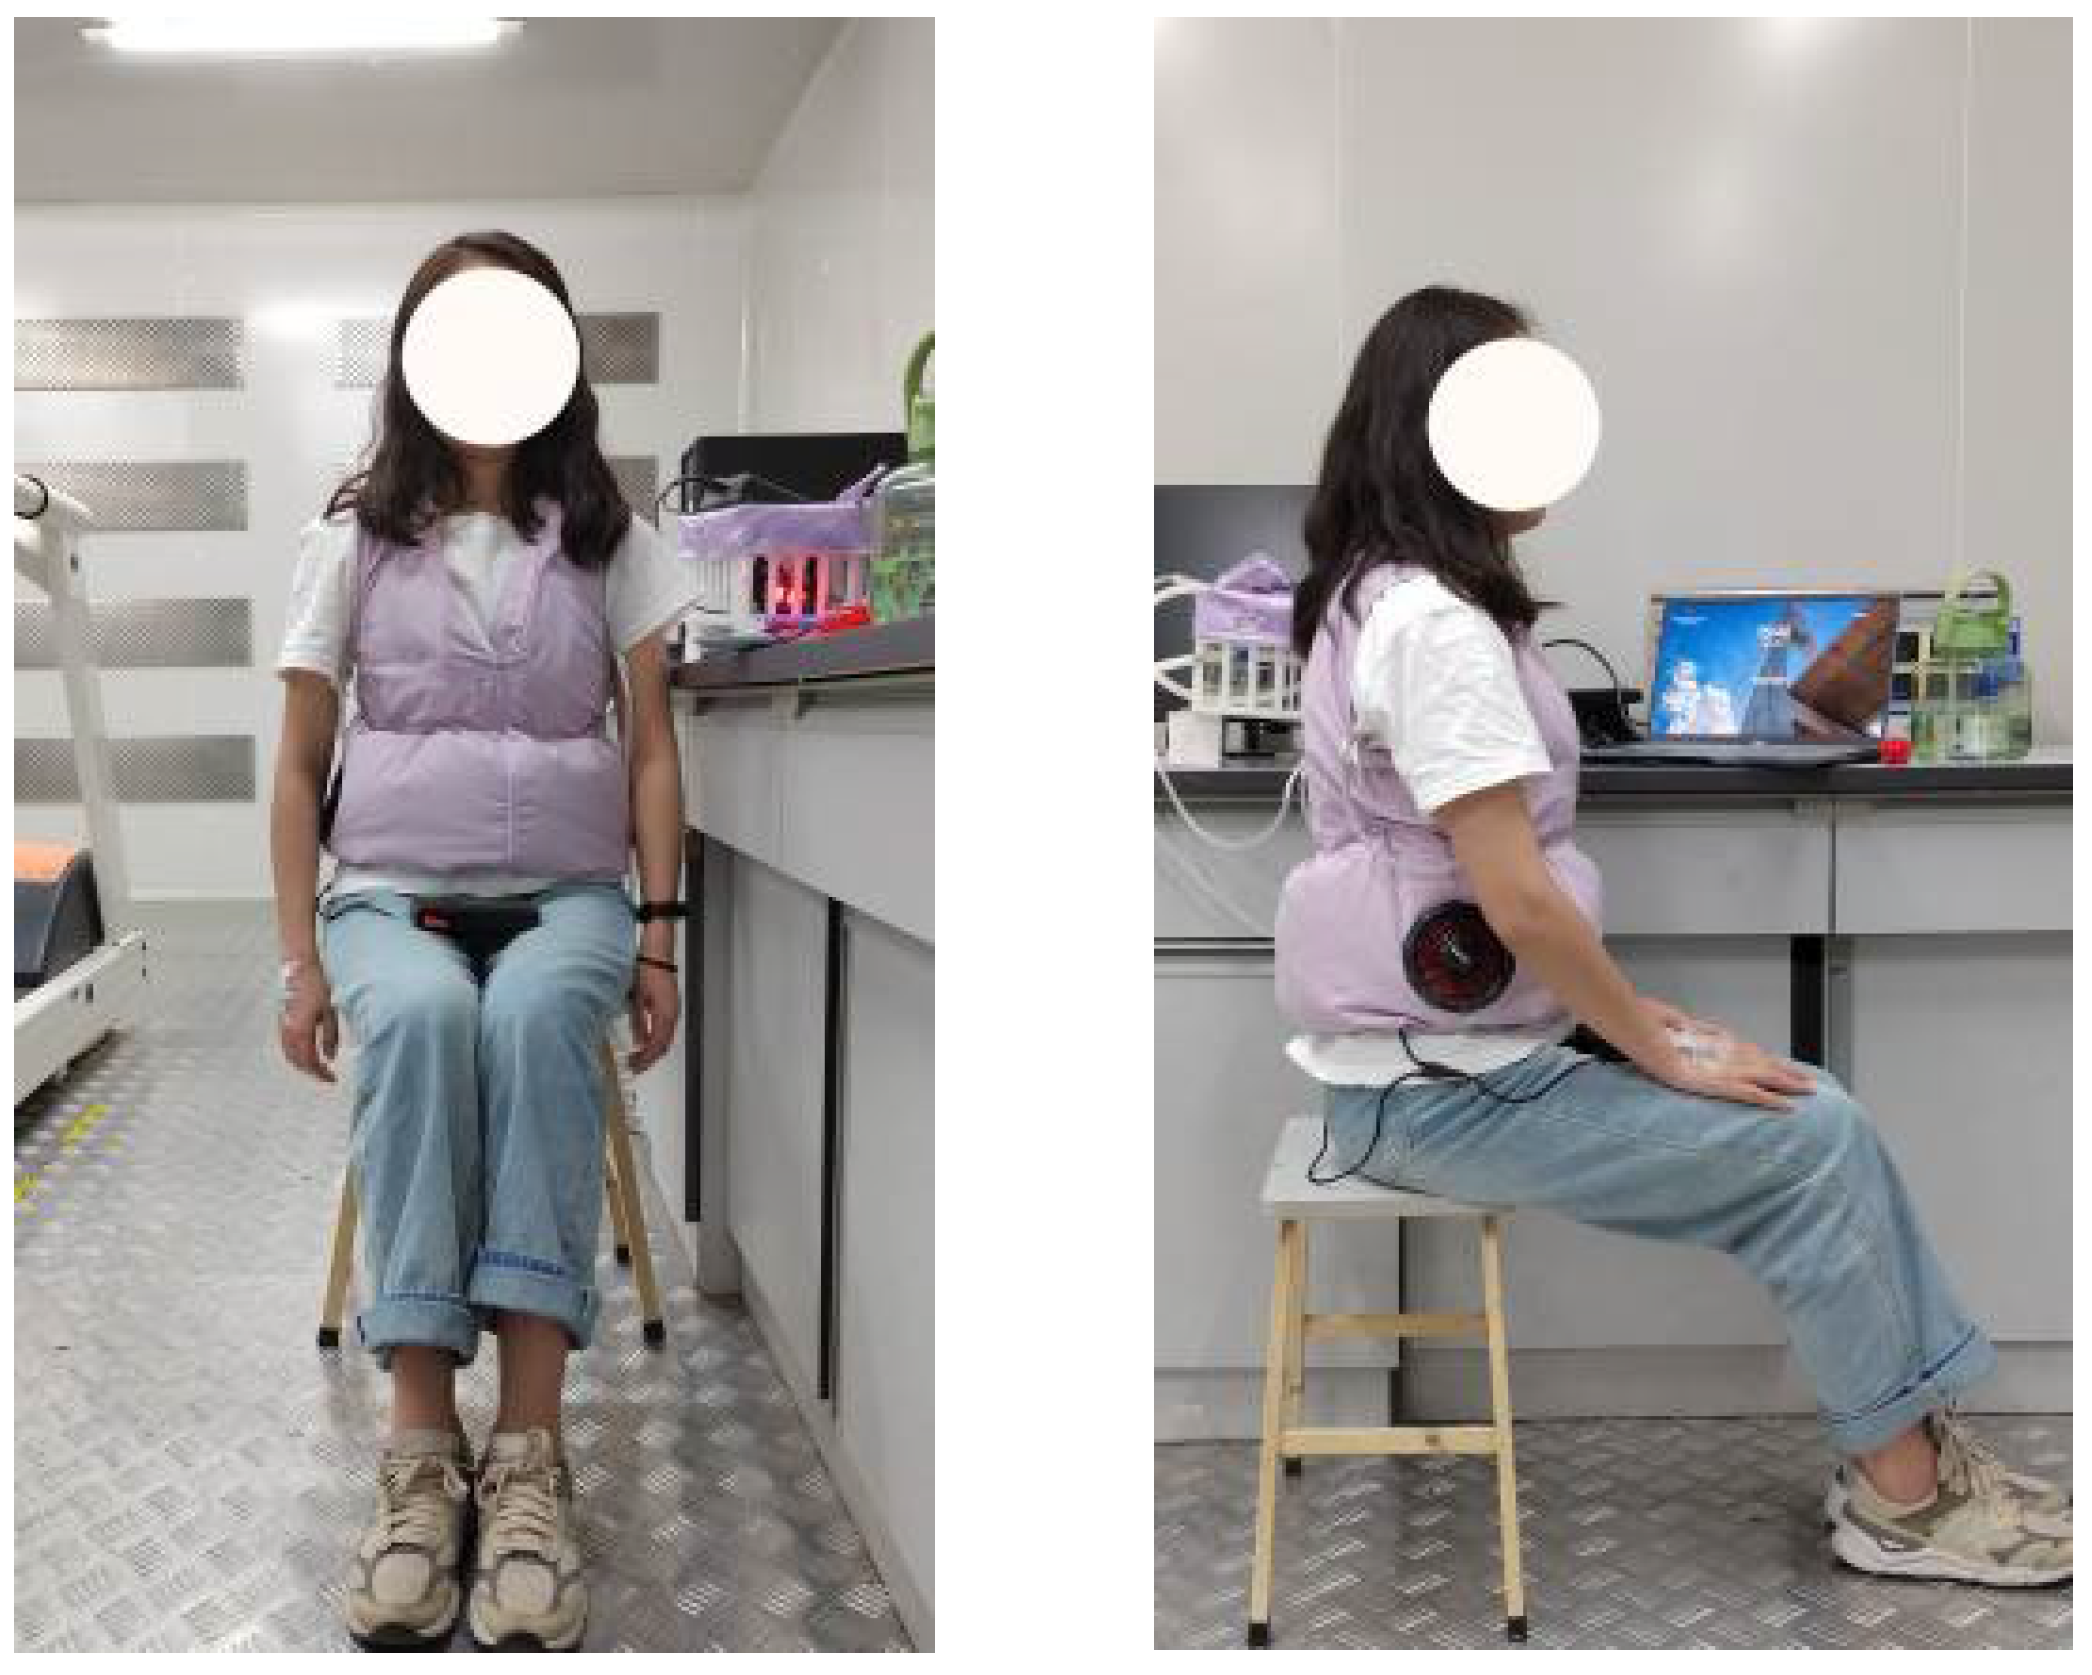
4.2. Experimental Protocol and Test Conditions

The climatic chamber was set to 32 °C, 50% relative humidity, and 0.5 m/s air velocity. Subjects came to the climate chamber and rested for 20 min. After that, the sensors were attached to the skin of the right side of the subjects using medical tape, during which the subjects were wearing their own bras, briefs, socks, and sneakers. A DS1923 (Maxim, CA, USA)-type Ibutton temperature was used to collect data on the local skin temperature changes of the subject during the experiment, with data recorded every 15 s. The Ibutton was fixed to the right part of the body (neck, chest, shoulder, back, hands, thighs, and calves) with 3 M of medical tape before the start of the experiment. Then, the subjects were changed into uniform white t-shirts and began the experiment after 20 min of adaptation to the chamber environment. During the experiment, subjects wore the four types of vests (AAL, SAL, YAL, CON), sat on a stool, and used their laptops as usual to simulate a sedentary work state for 45 min. During the experiment, their core temperature was measured every 9 min using an ear thermometer (Braun, IRT6520, Frankfurt, Germany) and the subjective sensation of the torso was recorded every 9 min. The experiment procedure is shown in Figure 9.
The consistency of the initial inlet water temperature needed to be ensured at the beginning of the experiment. According to the study of TAO [7], the best effective specific heat can be achieved when the inlet water temperature is 13 °C. Therefore, the initial water temperature for the liquid pipes was 13 °C. When each garment was about to start testing, a medical auxiliary syringe was used to fill the tube with water. A 200 mL medical syringe was filled with water and connected to one end of the tube. The other end of the tube was opened upward, the upward opening was able to squeeze out the air while pressing in the water flow, and, eventually, the tube was filled with water. The total amount of water filled each time was 160 mL. After filling the water in the pipe, the power switch of the liquid cooling and the fan cooling were turned on to make the garment start cooling work. The experiment scene of a subject is shown in Figure 10.
Participants’ perceptual responses, including overall thermal sensation vote (TSV) and thermal comfort vote (TCV), were surveyed. Perceptual responses were measured every nine minutes from the start to the end of the experiment. As shown in Table 1, ratings of TSV and TCV ranged from −3 (‘Cold’) to 3 (‘Hot’), 0 (‘Neutral’) to −3 (‘Very uncomfortable’), and 0 (‘Comfortable’) to 1 (‘Very comfortable’), respectively. All rating scales are continuous (Table 4).

4.3. Calculations

The mean skin temperature was calculated using the 6-point method [37] with the following Equation (1). The calculation of the mean torso skin temperature [38] was calculated using Equation (2).
Tsk = 0.14 Tneck + 0.19 Tchest + 0.11 Tshoulder + 0.19 Tback + 0.05 Thand + 0.32 Tthigh
Ttorso = 0.25 Tchest + 0.25 Tshoulder + 0.25 Tbelly + 0.25 Tback
where Tsk is the mean skin temperature, Tneck is the neck temperature, Tchest is the chest skin temperature, Tbelly is the belly skin temperature, Tshoulder is the shoulder skin temperature, Tlowerback is the back skin temperature, Thand is the hand skin temperature, and Tthigh is the inner thigh skin temperature, all in °C.

4.4. Statistical Analysis

SPSS Statistics 24 was used to analyze the data. The data were first tested for normal distribution using a combination of the Shapiro–Wilk method and Q–Q plots to determine whether the data obeyed a normal distribution; if they did, one-way ANOVA was used, and if they did not, the Kruskal–Wallis test, a nonparametric test, was used. The test was conducted to see if there was a significant difference between subjects wearing the four garments on the mean skin temperature, the mean torso temperature, the core temperature, the overall thermal sensation, and the overall thermal comfort. When they were tested to be significantly different from each other, a two-by-two comparison was made.

5. Results

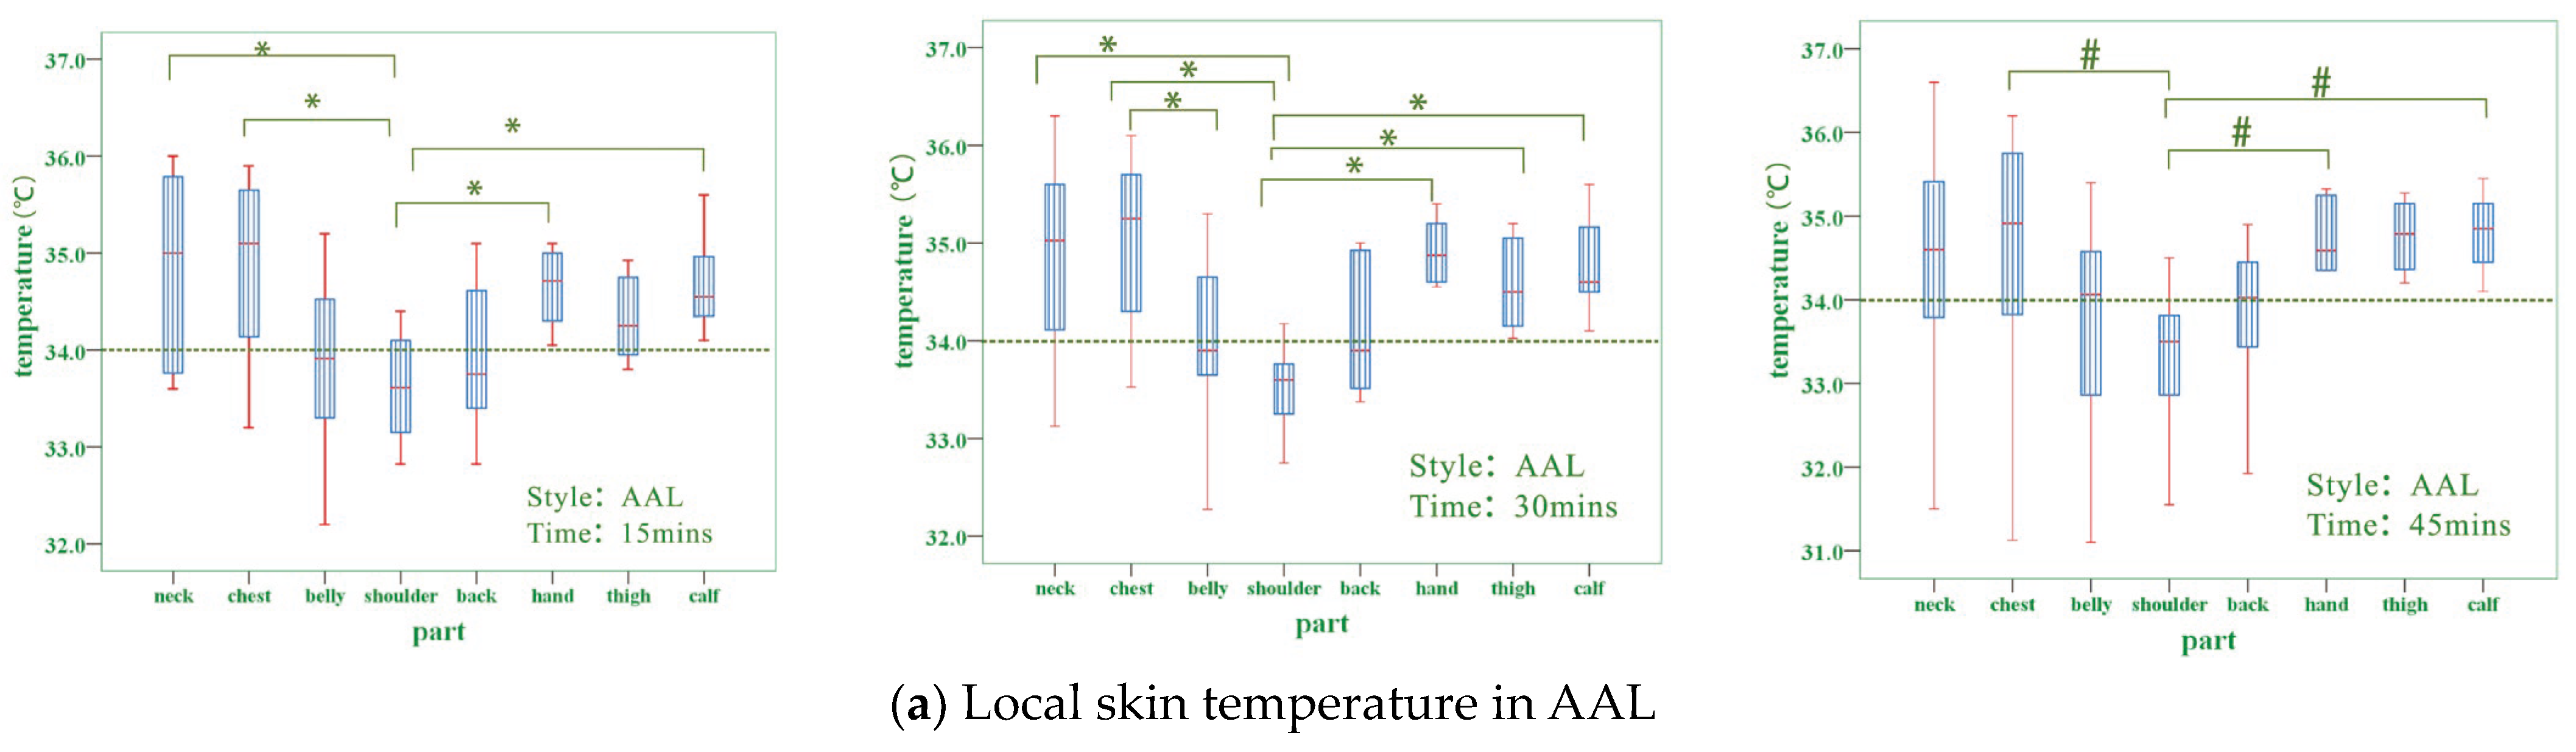
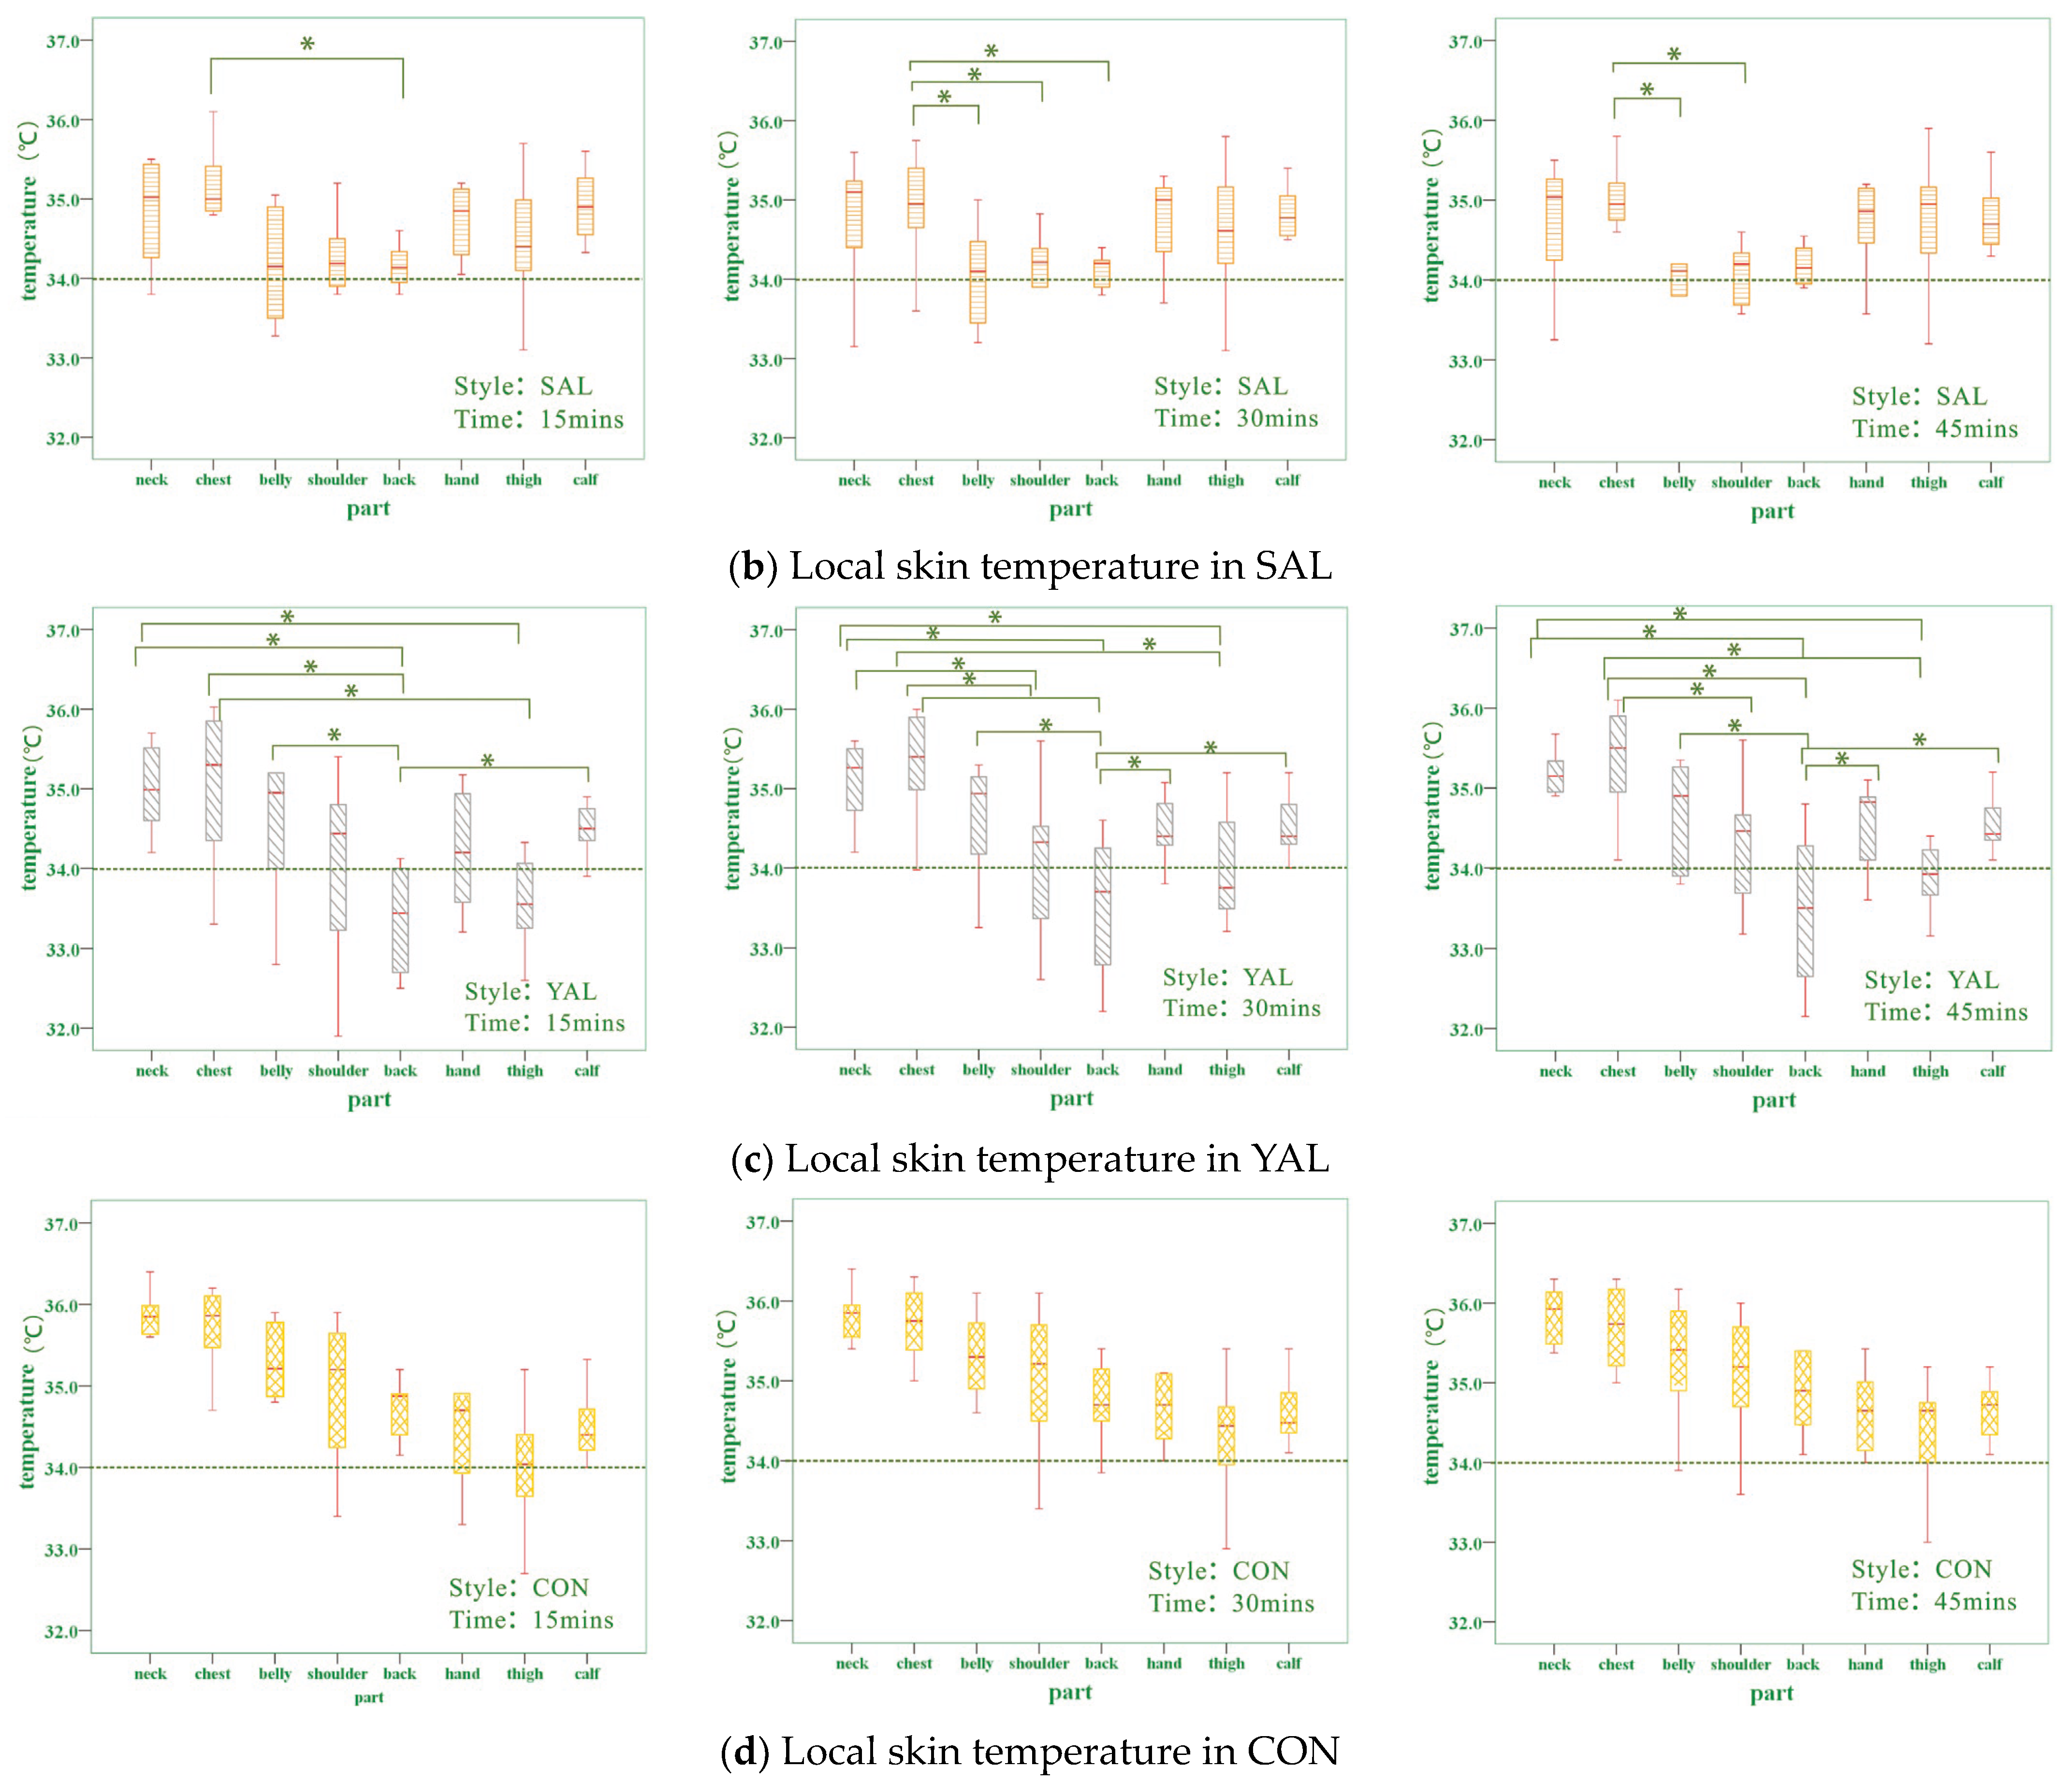
5.1. Local Skin Temperature

Figure 11 illustrates the local skin temperature changes at eight sites in the four garment scenarios. The eight sites were the neck, chest, belly, shoulder, back, hand, thigh, and calf. The horizontal view of Figure 11a, Figure 11b, Figure 11c and Figure 11d represent the temperature changes of the AAL, SAL, YAL, and CON groups at 15, 30, and 45 min, respectively, and their variability at each site at the same time, while the vertical view shows the three cooling garments at 15, 30, and 45 min, respectively, compared with the non-cooling group at the same time.
From Figure 11a, it can be seen that the shoulder temperature of the AAL group was the lowest during the three time periods at 15, 30, and 45 min, and there was a temperature difference of about 0.5 °C compared with the SAL of the same layout. Longitudinal observation of the four graphs at the 45th minute revealed that at the end of the experiment, the shoulder temperature of the non-cooled group CON was 35.1 °C, while the lowest temperature of the cooled garment group was only 33.6 °C, a temperature difference of 1.5 °C. This indicates that the cooling effect of the three cooling garments in the shoulder area was significant. Data analysis showed significant differences between the shoulder and the chest, the shoulder and the hand, and the shoulder and the calf at the 15th, 30th, and 45th minutes (p < 0.01).
From Figure 11b, it can be seen that the belly had the lowest temperature in the three time periods of 15, 30, and 45 min, which was because the fan for SAL was designed in the side waist, and its air was circulated in the belly and back, so the belly received more intense air cooling. Data analysis showed significant differences in both the chest and the back at the 15th and 30th minutes. There was a significant difference between the chest and shoulder in the 30th and 45th minutes (p < 0.01).
From Figure 11c, it can be seen that the back temperature of YAL was the lowest in the three time periods of 15, 30, and 45 min, and the back temperature of YAL was only 33.5 °C at the 45th minute, compared with 34.9 °C for the back temperature of the non-cooled CON at the same time, with a temperature difference of 1.4 °C. Comparing Figure 11a and Figure 11b, it can been seen that the back temperature for YAL is lower than that for AAL and SAL. From Figure 11c, it can also be found that YAL’s chest temperature was the highest in the three time periods of 15, 30, and 45 min, and a longitudinal observation of the chest temperature at the 45th minute showed that YAL’s chest temperature was significantly higher than that of AAL and SAL. Data analysis showed that at the 15th, 30th, and 45th minutes, the back and the belly, the back and the chest, and the back and the neck were significantly different (p < 0.01).
From Figure 11, it can be found that the temperature of the neck, hands, thighs, and calves of the non-cooling group CON was higher than that of the cooling group, but the temperature difference between the cooling groups was not significant because the neck, hands, thighs, and calves were not the direct cooling area of the garment, but part of the air volume of the fans still blowing out from the neck, hands, thighs, and calves through the torso. Thus, it also indicated a certain cooling effect.

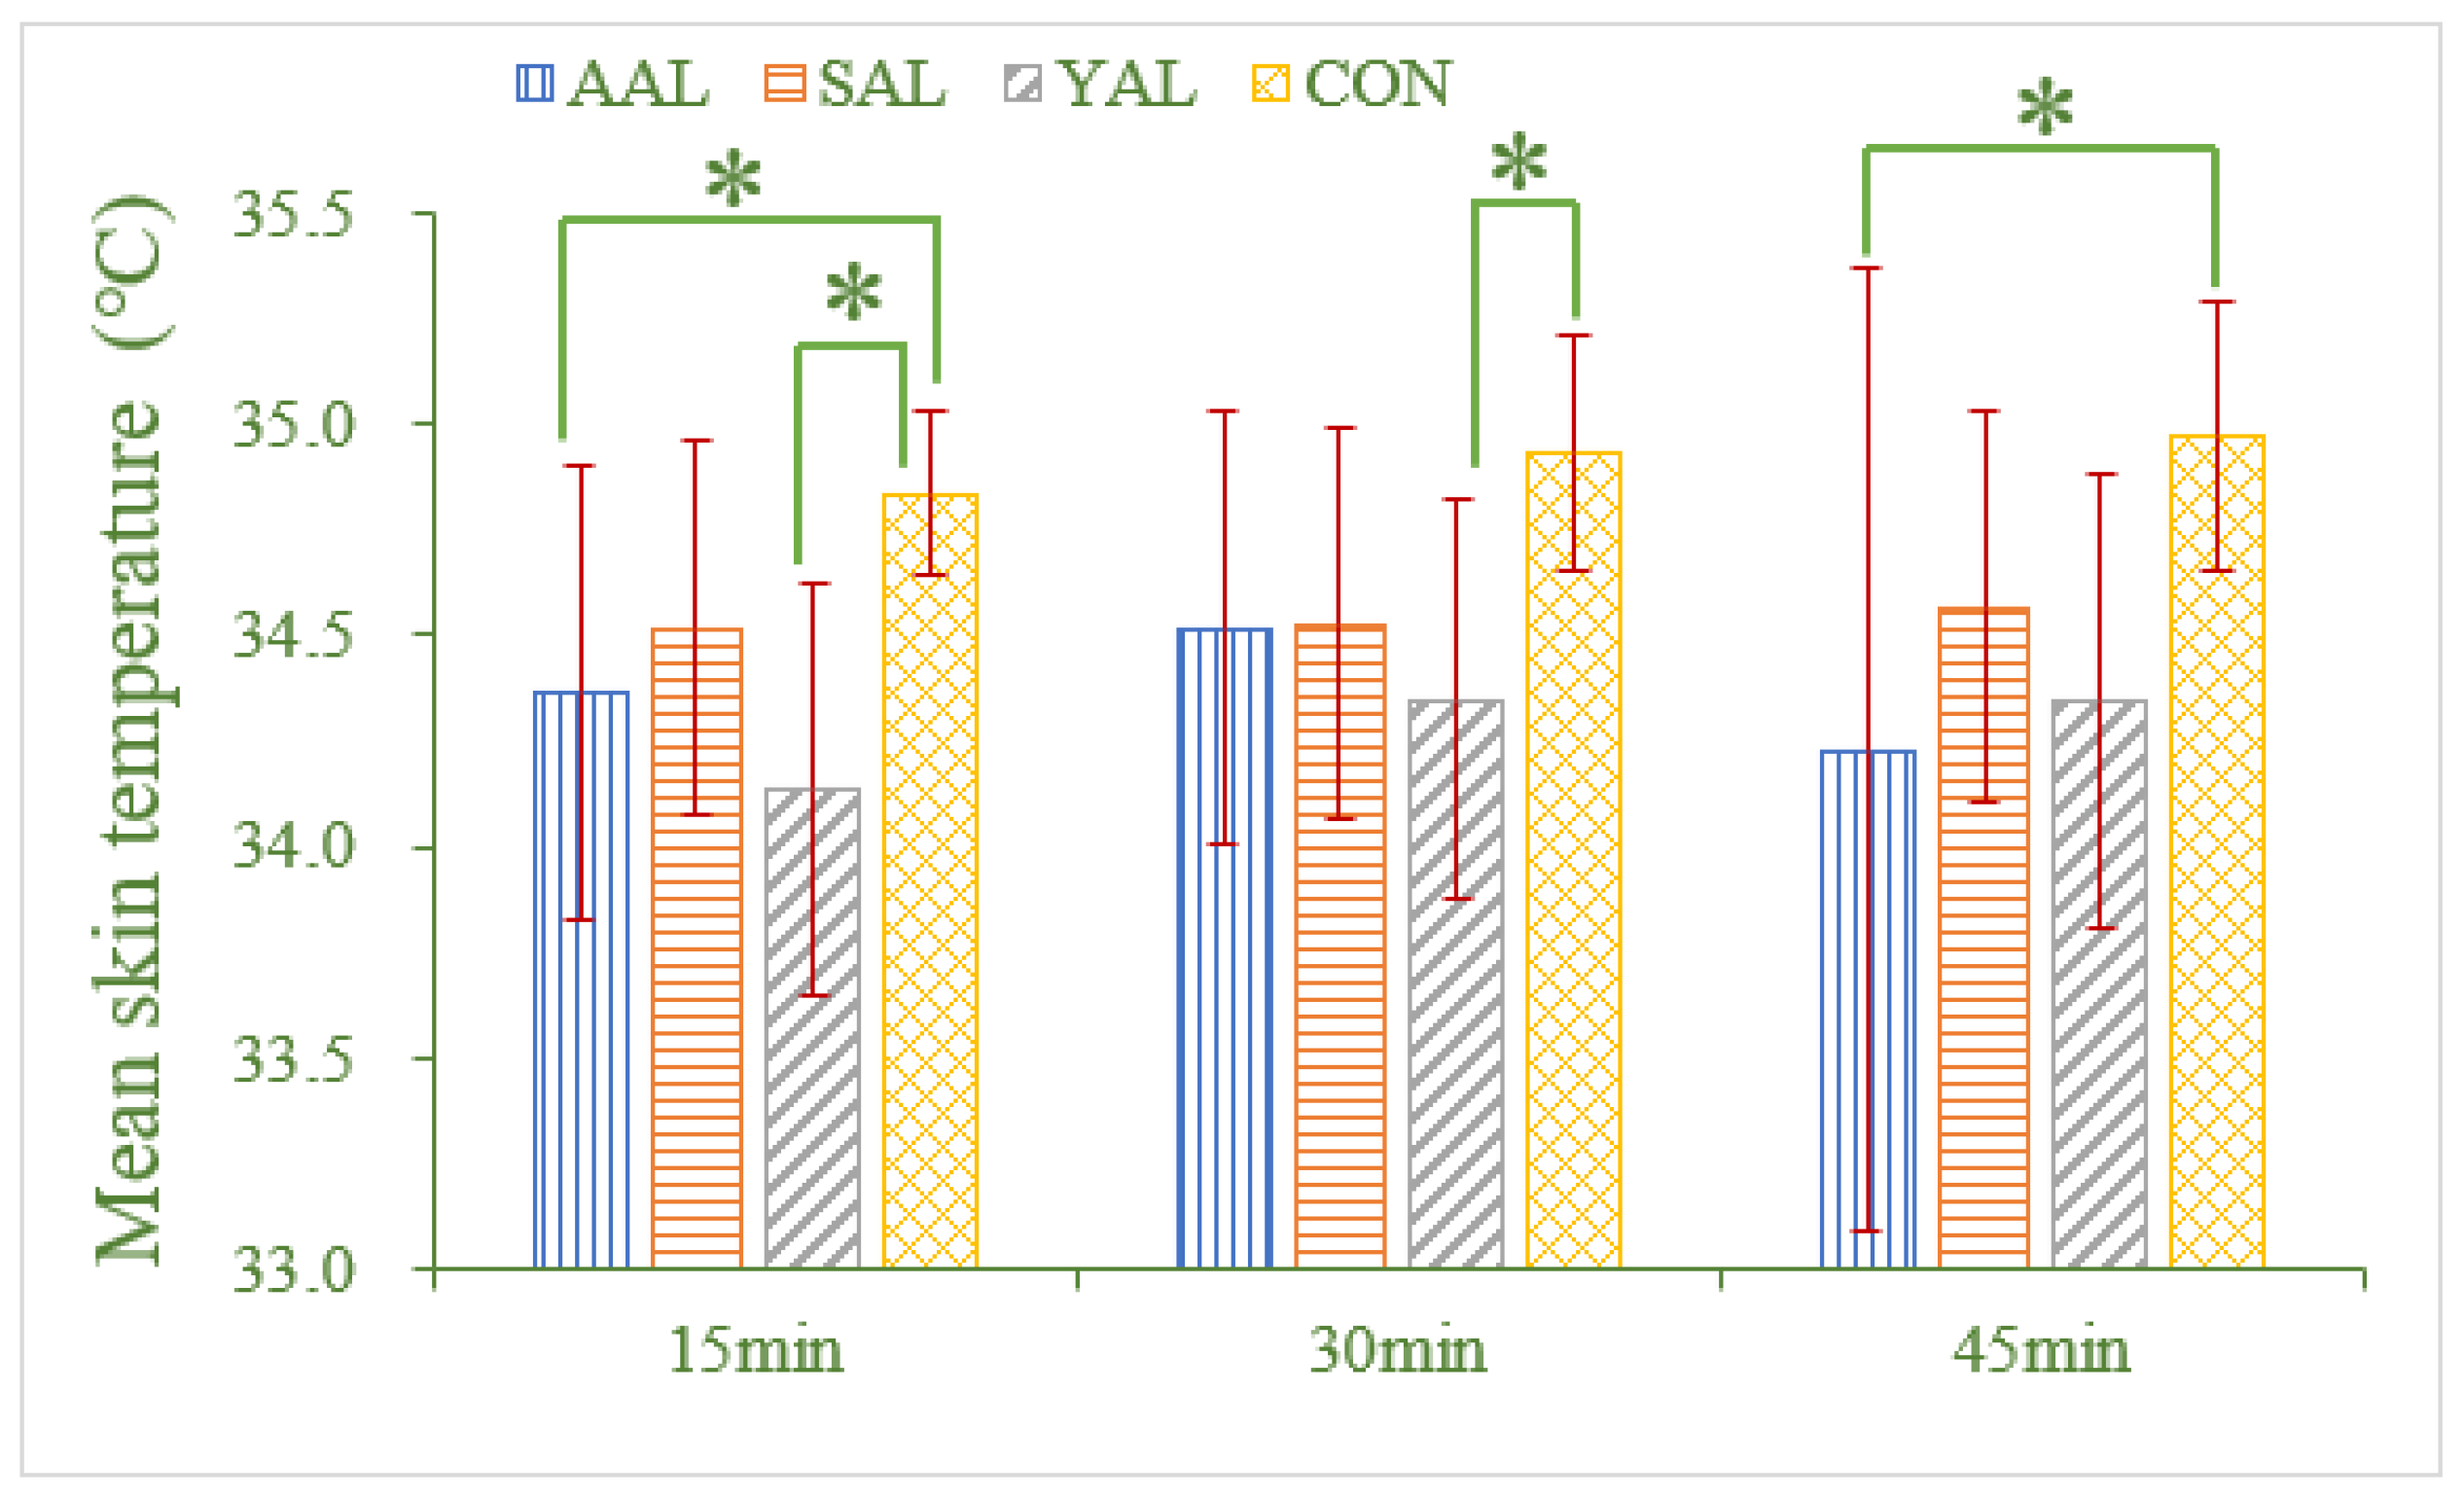
5.2. Core, Mean Skin, and Mean Torso Temperatures

The changes in core temperature are shown in Figure 12. The core temperatures of both AAL and YAL were lower than the CON group at the 9th minute, indicating that the cooling effect of AAL and YAL was more significant at the beginning. And the core temperatures of all three clothing groups were lower than the control CON group at the 27th and 45th minutes, indicating that all three cooling garments had a certain cooling effect, but the maximum temperature difference during the whole experiment was only 0.1 °C, which was not significant. Data analysis showed that there was no significant difference between the four clothes during the whole experiment at the p < 0.05 level.
The mean skin temperature changes are shown in Figure 13, which shows that the mean skin temperature of the non-cooled group (CON) showed a significant increasing trend, while the cooling garment group showed different degrees of decrease, and all were lower than the non-cooled group (CON). At the end of the experiment, the maximum mean skin temperature of the non-cooled group (CON) was 35 °C, while the maximum mean skin temperature of the cooled garment group was 34.6 °C, a decrease of 0.4 °C. At the 9th min of the experiment, the temperature of the CON was 34.8 °C and the temperature of the YAL was 34.1 °C, a difference of 0.7 °C, which indicated that the cooling garment had an effective cooling effect. Data analysis showed that there was a significant difference (p < 0.01) in the cooling effect of the four garments on the mean skin temperature throughout the experiment. A two-by-two comparison revealed that there was a significant difference between AAL and YAL and CON at the 9th minute, between YAL and CON at the 27th minute, and between AAL and CON at the 45th minute.
The mean torso temperature is shown in Figure 14. It can be seen that the temperature of the control group (CON) showed a significant increasing trend, and the torso temperature was higher than that of the liquid–air garments group (AAL, SAL, YAL). At the end of the experiment at 45 min, the torso skin temperature in the CON was 35.2 °C, while the highest torso temperature in the liquid–air cooling garment was 34.4 °C, a decrease of 0.8 °C. The mean torso skin temperature difference between the control group and the cooling garment group was greater than the mean skin temperature difference, mainly because the torso is the main action part of the garment and the data are more intuitive. Data analysis showed that there was a significant difference (p < 0.01) in the effect of the four garments on the mean skin temperature throughout the experiment. A two-by-two comparison revealed that AAL, SAL, and YAL all differed significantly from CON. The mean torso temperature of the aluminum tube group (AAL) was consistently lower than that of the silicone group (SAL) during the experiment.

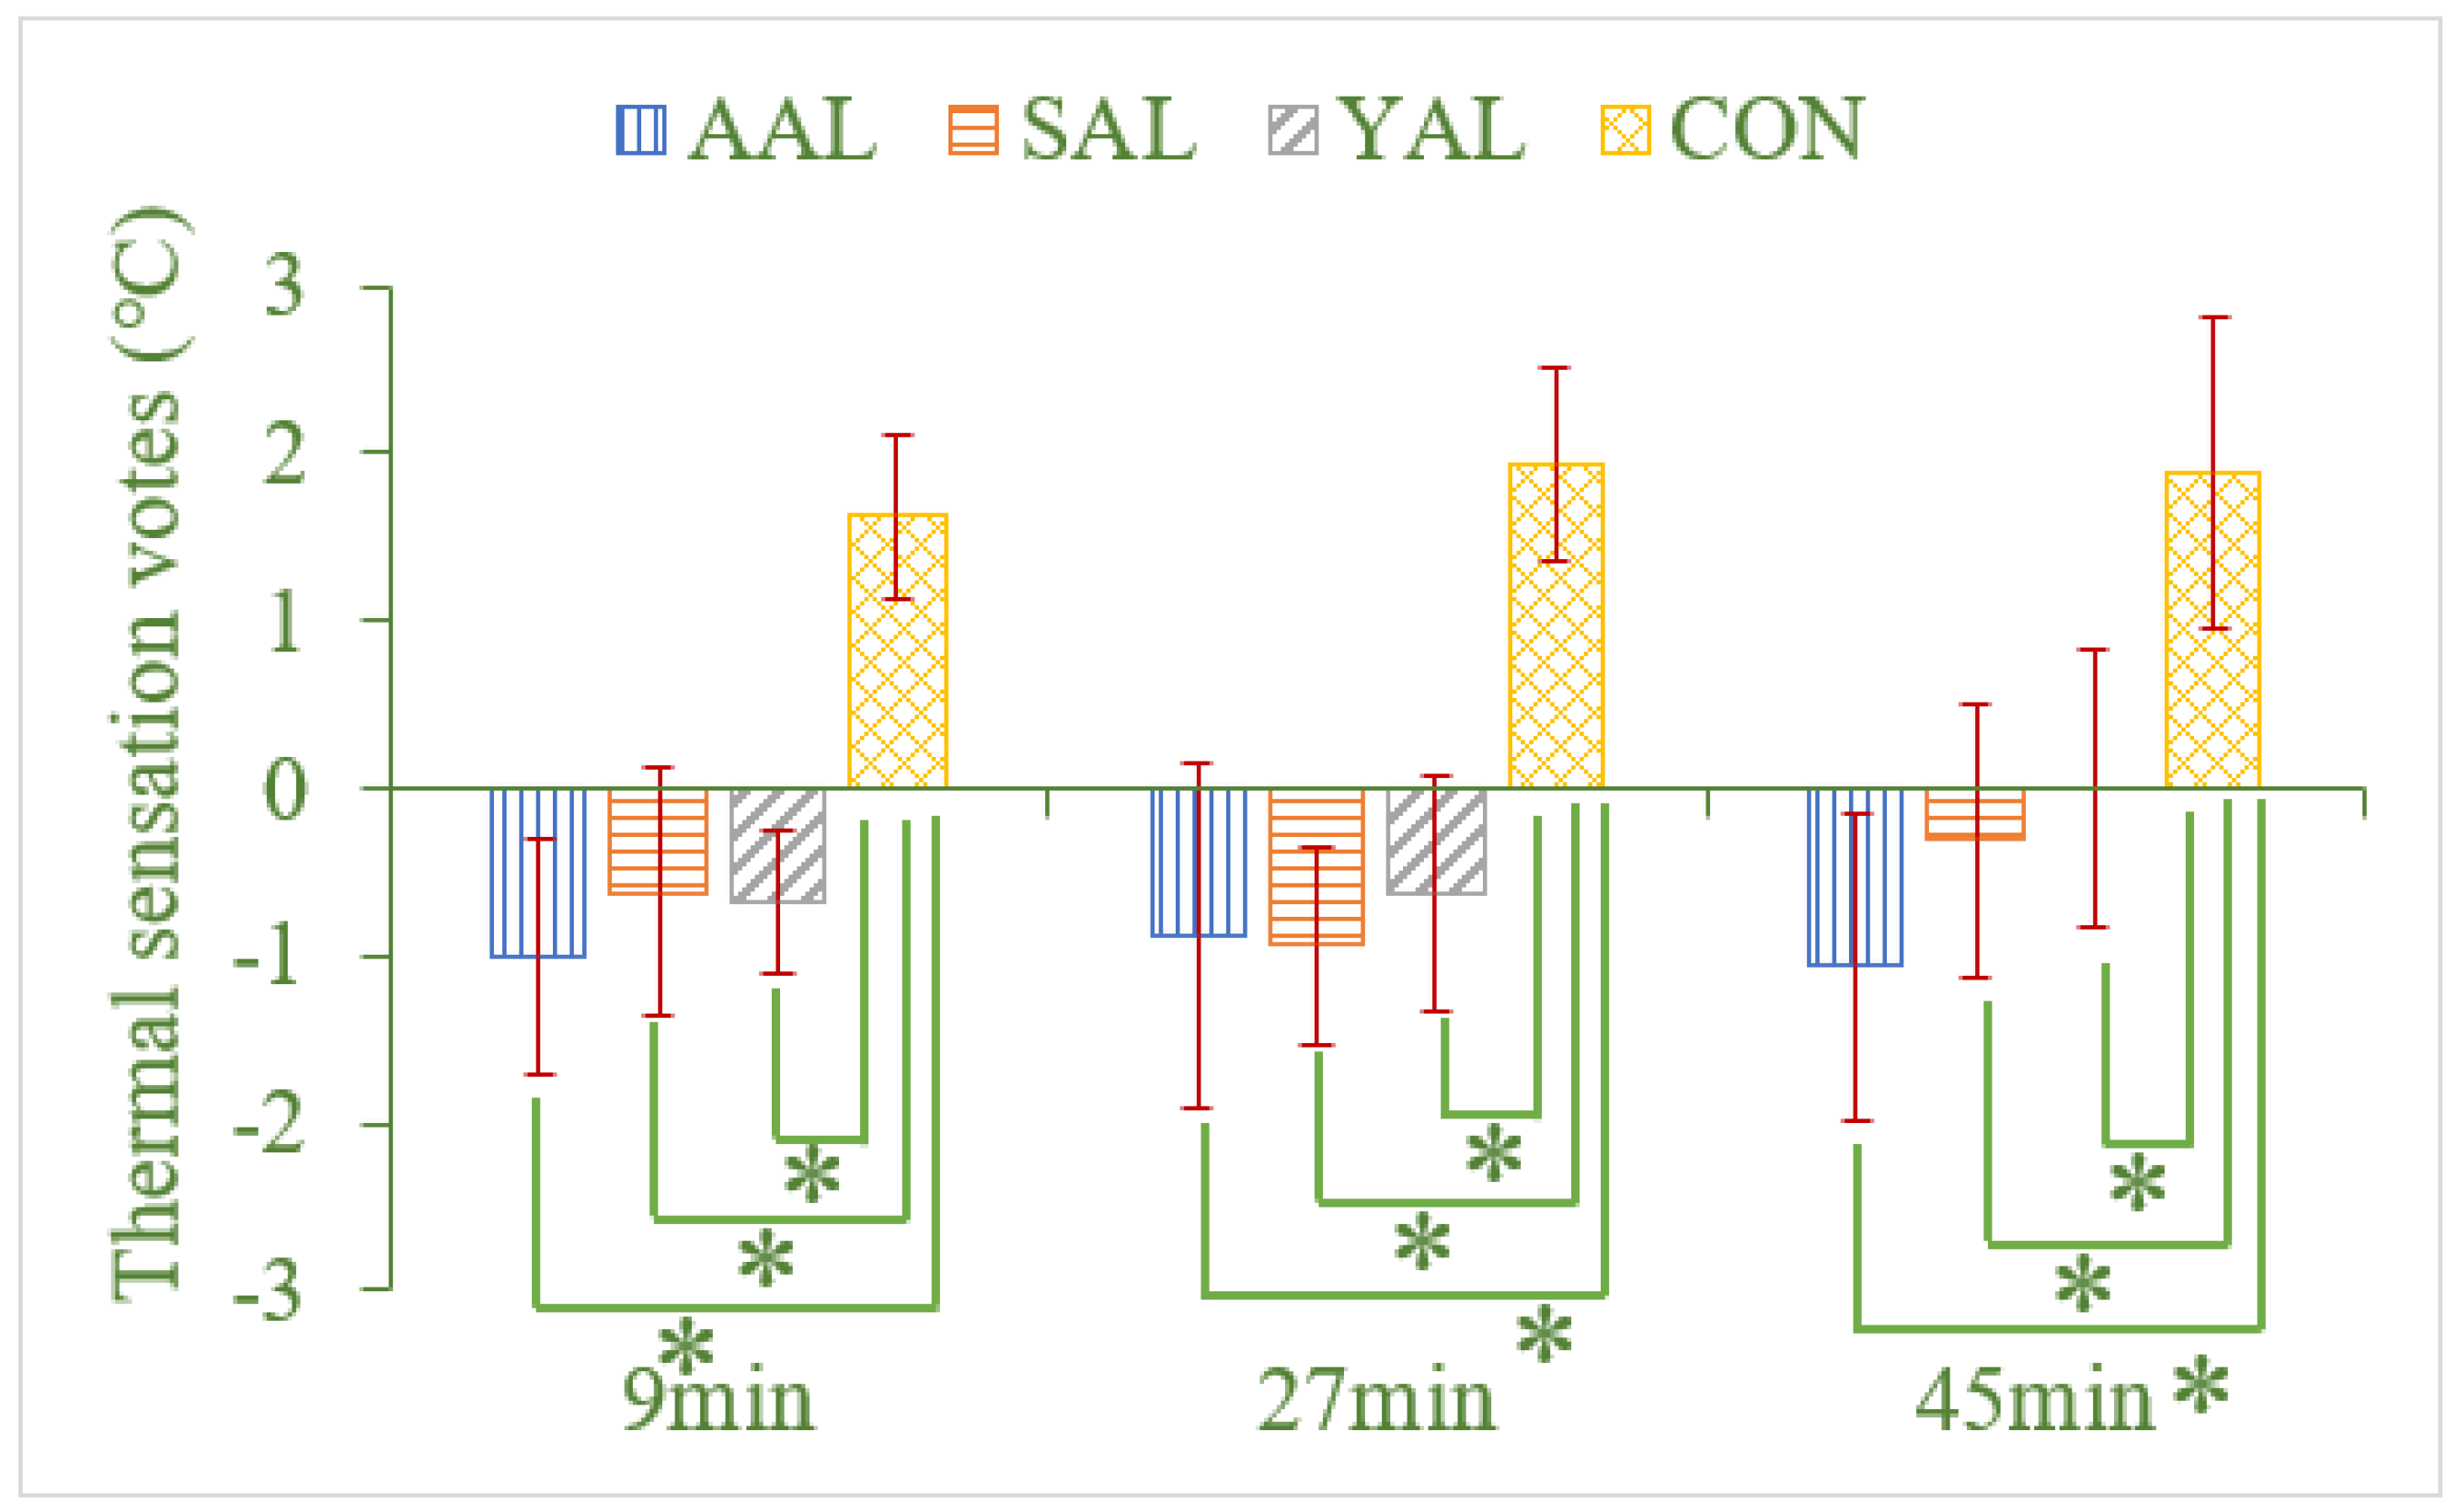
5.3. Perceptual Responses

The thermal sensation of the torso brought to the subjects by the four garments is shown in Figure 15. The torso thermal sensation of the subjects wearing the CON was significantly higher than that of the cooling garments, and the data can visually show that the subjects felt relatively cooler when wearing the liquid–air cooling garments. This indicates that the cooling garment has an effective cooling effect. The data analysis showed that there was a significant difference between CON and AAL, SAL and YAL (p < 0.01).
The torso thermal comfort of the subjects is shown in Figure 16. The subjects’ torso thermal comfort while wearing the CON was significantly lower than that of the cooling garment, and the data visually show that the subjects had greater thermal discomfort when they did not have the cooling garment. This indicates that the cooling garment has an effective effect on improving thermal comfort. Analysis of the data showed that there were significant differences between CON and AAL, SAL, and YAL at both the 9th and 27th minute on torso thermal comfort (p < 0.01). There was a significant difference between CON, AAL, and YAL at the 45th minute (p < 0.01)

6. Discussion

6.1. Effect of Liquid–Air Hybrid Cooling on Cooling Performance

The liquid–air cooling garments provided effective convection and conduction of heat dissipation compared with the no-cooling state, resulting in a significant decrease in local skin temperature, mean skin temperature, mean torso skin temperature, thermal sensation, and an increase in thermal comfort, while having little effect on core temperature. The liquid–air cooling garments showed significant differences in skin temperature in five local regions of the torso, including the neck, chest, belly, shoulder, and back, compared with the CON, and its cooling effect was mainly for the torso. In the local skin temperature comparison of YAL with AAL and SAL, it was found that the back skin temperature of YAL was lower than that of AAL and SAL among the three cooling garments, which indicates that the design form of its garment has the best cooling effect on the back. This is because when wearing the YAL, the back of the body was cooled by the conduction of the liquid cooling tube and also by the air-cooling cycle of the fan across the torso. With AAL and SAL, the back was only cooled by air. The skin temperature of the back area showed that when the local area was cooled by a combination of liquid and air cooling, the cooling effect was better than air cooling only. The experimental results of Yang [39] also showed that among the four parts of the torso, back cooling was the most effective. For the mean torso skin temperature, it was found that the mean torso skin temperature of the aluminum tube (AAL) was always lower than that of the inner yarn (YAL) during the experiments, which indicated that the cooling of the torso with the aluminum tube (AAL) design was better than that of the inner yarn group (YAL). For the mean skin temperature, the inner yarn group (YAL) was mostly lower than that of the aluminum tube (AAL). It indicates that the two garments do not have the same cooling effect on the mean skin temperature and the mean torso skin temperature, and the YAL has a better overall cooling effect for the whole body, while the AAL has a better local cooling effect for the torso.
Through the analysis of the core temperature, the maximum temperature difference of the core temperature was only 0.1 °C during the whole experiment, which was not significant. The reason for this is that the subjects sat still and did office work during the experiment without strenuous exercise; thus, the effect on the core temperature was not significant. This was also detected in the studies of Li et al. [40] and Yang et al. [41], in which the authors found that exercise intensity had a great effect on the core and skin temperatures.

6.2. The Effect of Different Pipe Materials on Cooling Performance

The aluminum tube had a better local cooling effect on the torso compared with the silicone tube, but did not affect the overall body cooling effect. In the local temperature control between AAL and SAL, the difference between subjects wearing AAL and SAL was only reflected in the local skin temperature of the shoulder, but not in the chest skin temperature. During the experiment, there was a temperature difference of about 0.5 °C between the shoulder skin temperature of the AAL and the shoulder skin temperature of the SAL. This was because the clothing fit of the aluminum tube was not very good due to the convex shape of the chest, while in the back the aluminum tube was able to fit the body more closely. The use of aluminum tubes instead of silicone tubes did result in a better cooling effect with the improved fit of the aluminum tubes. For the mean torso skin temperature, it was found that the mean torso skin temperature in the aluminum tube group (AAL) was consistently lower than that in the silicone group (SAL) during the experiment. This indicates that the use of aluminum tubes (AAL) has a better cooling performance than silicone tubes (SAL) during the experiments due to the better thermal conductivity of the tubes. On the other hand, since the subjects were in a sedentary working state which did not have a high requirement for the torso movement, the aluminum tubes could be used for the liquid cooling, but for those working environments which require frequent body movement, other types of tubes with high flexibility should be considered.

6.3. The Effect of Different Forms of Garment Design on Cooling Performance

From the design form of the three cooling garments, the inside and outside collocation-type structure is better than the top and bottom collocation structure, which was demonstrated by YAL with the best cooling effect. From the local skin temperature control of YAL, AAL, and SAL, it can be found that the chest skin temperature of YAL was significantly higher than that of AAL and SAL. From the design of the garment, YAL was only subjected to the effect of circulating air in the chest, while AAL and SAL were designed with liquid cooling tubes in the chest, so the chest skin temperature of YAL was slightly higher than that of AAL and SAL. For the mean skin temperature, it was found that the mean skin temperature of the subjects wearing the inner yarn cooling garment (YAL) was slightly lower than the other two cooling garments (AAL and SAL) throughout the experiment, which indicated that the cooling effect of the inner yarn YAL was better than that of the garments AAL and SAL; YAL reached the lowest mean skin temperature point first, which indicated that YAL had the fastest cooling speed. And also, it can be seen that the design of the inner liquid cooling tube and outer fan collocation has an excellent cooling effect.

7. Conclusions

In this study, three liquid–air hybrid cooling garments and one control garment were designed and explored to study and compare the local thermal comfort of female participants working in an ambient temperature of 32 °C and 50% RH. The results showed that the liquid–air cooling garments provided effective convection and conduction heat dissipation compared with the no-cooling state, resulting in lower local skin temperatures and improved perceptual responses. Compared with the no-cooling state of CON, the liquid–air cooling garments reduced the mean torso temperature by up to 1 °C. They reduced shoulder skin temperature and lower back skin temperature by up to 1.5 °C and 1.4 °C, respectively. The aluminum tube had a better cooling effect on the torso skin temperature compared with the silicone tube, and the cooling of the AAL was 0.5 °C lower than that of the SAL for the shoulder skin temperature. The inner liquid cooling tube and the outer fan structure of the clothing style (YAL) could bring the best cooling effect based on the lowest mean skin temperature. The liquid and air hybrid cooling garment was portable, accessible, and sustainable compared with air conditioners, and, therefore, they could save energy and are recommended to be used in hot environments. The study of the different materials and structures of liquid–air hybrid cooling garments could provide a reference for the selection and design of personal cooling garments used in hot indoor environments.

Author Contributions

Conceptualization, M.Z.; methodology, M.Z.; formal analysis, W.W.; original draft preparation, W.W.; review and editing, M.Z. All authors have read and agreed to the published version of the manuscript.

Funding

This research received no external funding.

Institutional Review Board Statement

This study was conducted in accordance with the Declaration of Helsinki, and was approved by the Institutional Review Board of Shanghai University of Engineering Science (Approval No.EST-2023-014).

Informed Consent Statement

Informed consent was obtained from all subjects involved in the study.

Data Availability Statement

Data are available on request from the corresponding author.

Acknowledgments

The authors thank Xinyue Liu for the help with the design of the cooling garments.

Conflicts of Interest

The authors declare no conflict of interest.

References

  1. Zhang, H.; Arens, E.; Zhai, Y. A review of the corrective power of personal comfort systems in non-neutral ambient environments. Build. Environ. 2015, 91, 15–41. [Google Scholar] [CrossRef]
  2. Burton, D.R.; Collier, L. The Development of Water Conditioned Suits; Tech. Note ME-400; Royal Aircraft Establishment: Farnborough, UK, 1964. [Google Scholar]
  3. Yang, J.; Wang, F.; Song, G.; Li, R.; Raj, U. Effects of clothing size and air ventilation rate on cooling performance of air ventilation clothing in a warm condition. Int. J. Occup. Saf. Ergon. 2022, 28, 354–363. [Google Scholar] [CrossRef] [PubMed]
  4. Nunneley, S.A. Water cooled garments: A review. Space Life Sci. 1970, 2, 335–360. [Google Scholar] [CrossRef] [PubMed]
  5. Falcone, T.; Cordella, F.; Molinaro, V.; Zollo, L.; Del Ferraro, S. Real-time human core temperature estimation methods and their application in the occupational field: A systematic review. Measurement 2021, 183, 109776. [Google Scholar] [CrossRef]
  6. Bue, G.; Trevino, L. Thermal analysis of lightweight liquid cooling garments using highly conductive materials. SAE Trans. 2005, 114, 425–433. [Google Scholar]
  7. Wang, T.; Wang, L.; Bai, L.; Lin, G.; Bu, X.; Liu, X.; Xie, G. Experimental study on the performance of a liquid cooling garment with the application of MEPCMS. Energy Convers. Manag. 2013, 5, 359–364. [Google Scholar] [CrossRef]
  8. Xu, Y.; Li, Z.; Wang, J.; Zhang, M.; Jia, M.; Wang, Q. Man-portable cooling garment with cold liquid circulation based on thermoelectric refrigeration. Appl. Therm. Eng. 2022, 200, 117730. [Google Scholar] [CrossRef]
  9. Ku, Y.T.E.; Montgomery, L.D.; Lee, H.C.; Luna, B.; Webbon, B.W. Physiologic and functional responses of MS patients to body cooling. Am. J. Phys. Med. Rehabil. 2000, 79, 427–434. [Google Scholar] [CrossRef]
  10. Speckman, K.L.; Allan, A.E.; Sawka, M.N.; Young, A.J.; Muza, S.R.; Pandolf, K.B. Perspectives in microclimate cooling involving protective clothing in hot environments. Int. J. Ind. Ergon. 1988, 3, 121–147. [Google Scholar] [CrossRef]
  11. McLellan, T.M.; Selkirk, G.A. The management of heat stress for the firefighter: A review of work conducted on behalf of the Toronto Fire Service. Ind. Health 2006, 44, 414–426. [Google Scholar] [CrossRef]
  12. Kayacan, O.; Kurbak, A. Effect of garment design on liquid cooling garments. Text. Res. J. 2010, 80, 1442–1455. [Google Scholar] [CrossRef]
  13. Bogdan, A.; Chludzinska, M. Assessment of thermal comfort using personalized ventilation. HV ACR Res. 2010, 16, 529–542. [Google Scholar] [CrossRef]
  14. Ghaddar, N.; Ghali, K.; Harathani, J. Modulated air layer heat and moisture transport by ventilation and diffusion from clothing with open aperture. J. Heat Transf. 2005, 127, 287–297. [Google Scholar] [CrossRef]
  15. Gonzalez, J.A.; Berglund, L.G.; Endrusick, T.L.; Kolka, M.A. Forced Ventilation of Protective Garments for Hot Industries; Army Research Institute of Environmental Medicine: Natick, MA, USA, 2006; USARIEM Publication; no. ADA460047. [Google Scholar]
  16. Kaczmarczyk, J.; Melikov, A.; Bolashikov, Z.; Nikolaev, L.; Fanger, P.O. Human response to five designs of personalized ventilation. HV ACR Res. 2006, 12, 367–384. [Google Scholar] [CrossRef]
  17. Ke, Y.; Havenith, G.; Zhang, X.; Li, X.; Li, J. Effects of wind and clothing apertures on local clothing ventilation rates and thermal insulation. Text. Res. J. 2014, 84, 941–952. [Google Scholar] [CrossRef]
  18. Ke, Y.; Li, J.; Havenith, G. An improved experimental method for local clothing ventilation measurement. Int. J. Ind. Ergon. 2014, 44, 75–81. [Google Scholar] [CrossRef]
  19. Ueda, H.; Havenith, G. The Effect of Fabric Air Permeability on Clothing Ventilation; Elsevier Ergonomics Book Series; Elsevier: Amsterdam, The Netherlands, 2005; Volume 3, pp. 343–346. [Google Scholar]
  20. Desruelle, A.; Hoef, A.; Candas, V. Local moderate ventilation and thermoregulatory responses in man exercising in an impermeable garment. In Proceedings of the 6th International Conference on Environmental Ergonomic, Montebello, QC, Canada, 25–30 September 1994; pp. 62–63. [Google Scholar]
  21. Hadid, A.; Yanovich, R.; Erlich, T.; Khomenok, G.; Moran, D.S. Effect of a personal ambient ventilation system on physiological strain during heat stress wearing a ballistic vest. Eur. J. Appl. Physiol. 2008, 104, 311. [Google Scholar] [CrossRef]
  22. Zhao, M.; Gao, C.; Wang, F.; Kuklane, K.; Holmér, I.; Li, J. A study on local cooling of garments with ventilation fans and openings placed at different torso sites. Int. J. Ind. Ergon. 2013, 43, 232–237. [Google Scholar] [CrossRef]
  23. Yi, W.; Zhao, Y.; Chan, A.P.C. Evaluating the Effectiveness of Cooling Vest in a Hot and Humid Environment. Ann. Occup. Hyg. 2017, 61, 481. [Google Scholar] [CrossRef]
  24. Del, F.S.; Falcone, T.; Morabito, M.; Messeri, A.; Bonafede, M.; Marinaccio, A.; Gao, C.; Molinaro, V. Cooling garments against environmental heat conditions in occupational fields: Measurements of the effect of a ventilation jacket on the total thermal insulation. Int. J. Ind. Ergon. 2021, 86, 103230. [Google Scholar]
  25. Chinevere, T.D.; Cadarette, B.S.; Goodman, D.A.; Ely, B.R.; Cheuvront, S.N.; Sawka, M.N. Efficacy of body ventilation system for reducing strain in warm and hot climates. Eur. J. Appl. Physiol. 2008, 103, 307. [Google Scholar] [CrossRef] [PubMed]
  26. Chan, A.P.C.; Zhang, Y.; Wang, F.; Wong, F.F.; Chan, D.W. A field study of the effectiveness and practicality of a novel hybrid person-al cooling vest worn during rest in Hong Kong construction industry. J. Therm. Biol. 2017, 70, 21–27. [Google Scholar] [CrossRef] [PubMed]
  27. Chan, A.P.; Yang, Y.; Song, W. Evaluating the usability of a commercial cooling vest in the Hong Kong industries. Int. J. Occup. Saf. Ergon. 2018, 24, 73–81. [Google Scholar] [CrossRef] [PubMed]
  28. Otani, H.; Fukuda, M.; Tagawa, T. Cooling between exercise bouts and post-exercise with the fan cooling jacket on thermal strain in hot-humid environments. Front. Physiol. 2021, 12, 640400. [Google Scholar] [CrossRef] [PubMed]
  29. Wang, H.; Xu, M.; Bian, C. Experimental comparison of local direct heating to improve thermal comfort of workers. Build. Environ. 2020, 177, 106884. [Google Scholar] [CrossRef]
  30. Wang, F.; Ke, Y.; Raj, U.; Yang, B.; Xu, P.; Noor, N. Effect of cooling strategies on overall performance of a hybrid personal cooling system incorporated with phase change materials (PCMs) and electric fans. J. Therm. Biol. 2020, 92, 102665. [Google Scholar] [CrossRef] [PubMed]
  31. Guo, T.H.; Shang, B.F.; Duan, B.; Luo, X.B. Design and testing of a liquid-cooled garment for hot environments. J. Therm. Biol. 2015, 49–50, 47–50. [Google Scholar] [CrossRef]
  32. Shitzer, A. Thermal protective garment using independent regional control of coolant temperature. Aerosp. Med. Hum. Perform. 1973, 1, 49–59. [Google Scholar]
  33. Young, A.J.; Sawka, M.N.; EpStein, Y.; Decristofano, B.A.R.R.Y.; Pandolf, K.B. Cooling different body surfaces during upper and lower body exercise. J. Appl. Physiol. 1987, 63, 1218–1223. [Google Scholar] [CrossRef]
  34. Kim, D.E.; LaBat, K. Design process for developing a liquid cooling garment hood. Ergonomics 2010, 6, 818–828. [Google Scholar] [CrossRef]
  35. Hamilton, R.L. Body Cooling System. US 20130142656 A1, 6 June 2013. [Google Scholar]
  36. Koscheyev, V.S.; Leon, G.R.; Treviño, R.C. An advanced physiological based shortened liquid cooling/warming garment for comfort management in routine and emergency EVA. SAE Trans. 2002, 111, 274–280. [Google Scholar]
  37. Mochida, T. Mean Skin Temperature Weighted by Skin Area, Heat Transfer Coefficients and Thermal Sensitivity; Research Report; Engineering Department of Hokkaido University: Sapporo, Japan, 1983; Volume 115, pp. 1–10. [Google Scholar]
  38. Gao, C.; Kuklane, K.; Wang, F.; Holmér, I. Personal cooling with phase change materials to improve thermal comfort from a heat wave perspective. Indoor Air 2012, 22, 523–530. [Google Scholar] [CrossRef] [PubMed]
  39. Yang, H.; Cao, B.; Ju, Y.; Zhu, Y. The effects of local cooling at different torso parts in improving body thermal comfort in hot indoor environments. Energy Build. 2019, 198, 528–541. [Google Scholar] [CrossRef]
  40. Li, Z.; Yuan, T.; Hu, P.; Jia, Q.; Wang, Q.; Xu, Y. Performance research of portable thermoelectric cooling garment under different working conditions. Int. J. Refrig. 2023. [Google Scholar] [CrossRef]
  41. Yang, J.; Zhang, Y.; Huang, Y.; Chen, W. Effects of liquid cooling garment on physiological and psychological strain of firefighter in hot and warm environments. J. Therm. Biol. 2023, 112, 103487. [Google Scholar] [CrossRef]
Figure 1. Schematic diagram of heat exchange in microclimate regions.
Applsci 13 09414 g001
Figure 2. The liquid–air cooling garment with aluminum pipe (AAL).
Applsci 13 09414 g002
Figure 3. The liquid–air cooling garment with silicone tube (SAL).
Applsci 13 09414 g003
Figure 4. The liquid–air cooling garment with inner yarn fabric (YAL).
Applsci 13 09414 g004
Figure 5. (a) Circulating pump; (b) refrigeration pump; (c) temperature controller; (d) mobile power supply.
Applsci 13 09414 g005
Figure 6. Temperature controller interface. A, B, C and D are four interfaces.
Applsci 13 09414 g006
Figure 7. The portable box of the assembled liquid cooling system.
Applsci 13 09414 g007
Figure 8. Schematic diagram of the composition of the liquid–air hybrid cooling clothing system.
Applsci 13 09414 g008
Figure 9. The experiment procedure of the subjects wearing the designed garments.
Applsci 13 09414 g009
Figure 10. Experiment scene of a subject in a sitting position.
Applsci 13 09414 g010
Figure 11. Local skin temperature of the subjects in (a) AAL, (b) SAL, (c) YAL, and (d) CON. “*” means significant difference at p < 0.01 level, and “#” means significant difference at p < 0.05 level.
Applsci 13 09414 g011aApplsci 13 09414 g011b
Figure 12. Core temperature of the subjects in the different clothing conditions.
Applsci 13 09414 g012
Figure 13. Mean skin temperature of the subjects in the different clothing conditions. “*” means significant difference at the p < 0.01 level.
Applsci 13 09414 g013
Figure 14. Mean torso skin temperature of the subjects in the different clothing conditions. “*” means significant difference at the p < 0.01 level.
Applsci 13 09414 g014
Figure 15. Thermal sensation votes of the torso in the different clothing conditions. “*” means significant difference at the p < 0.01 level.
Applsci 13 09414 g015
Figure 16. Thermal comfort votes of the torso in the different clothing conditions. “*” means significant difference at the p < 0.01 level.
Applsci 13 09414 g016
Table 1. Clothing specification and size (cm).
Clothing LengthChest WidthHip WidthWaist WidthCross Shoulder
5810010011640
Table 2. The material details of each style of liquid–air cooling garment.
StyleStructurePipe MaterialMaterialFabric Gram Weight
AALUpper and lower splicingAluminum tubePolyester, nylon, and cotton blended non-stretch fabric180 g/m2
SALUpper and lower splicingSilicone tubePolyester, nylon, and cotton blended non-stretch fabric180 g/m2
YALInternal and external splicingSilicone tubePolyester, nylon, and cotton blended non-stretch fabric, Polyester mesh fabric180 g/m2, 73 g/m2
CONPolyester, nylon, and cotton blended non-stretch fabric180 g/m2
Note: –, not applicable.
Table 3. The material details of the liquid pipes.
StylePipe MaterialInner DiameterOuter DiameterDensityLengthWeight
AALAluminum tube4 mm6 mm2.7 g/cm38.4 m356 g
SALSilicone tube4 mm6 mm2.2 g/cm38.4 m290 g
YALSilicone tube4 mm6 mm2.2 g/cm38.4 m290 g
Table 4. Perceptual response rating scales.
ScaleThermal Sensation Vote (TSV)Thermal Comfort Vote (TCV)
−3ColdVery uncomfortable
−2CoolUncomfortable
−1Slightly coolSlightly uncomfortable
0NeutralComfortable
1Slightly warmVery comfortable
2Warm
3Hot
Note: –, not applicable.
Disclaimer/Publisher’s Note: The statements, opinions and data contained in all publications are solely those of the individual author(s) and contributor(s) and not of MDPI and/or the editor(s). MDPI and/or the editor(s) disclaim responsibility for any injury to people or property resulting from any ideas, methods, instructions or products referred to in the content.

