Article

Study on Disintegration and Infiltration Characteristics of Nanjing Jiangxinzhou Embankment Soil

Department of Civil and Transportation Engineering, Hohai University, Nanjing 210098, China
*
Author to whom correspondence should be addressed.
Appl. Sci. 2023, 13(17), 9819; https://doi.org/10.3390/app13179819
Submission received: 19 July 2023 / Revised: 21 August 2023 / Accepted: 29 August 2023 / Published: 30 August 2023

Abstract

:
Flood season embankment due to long-term high water immersion environment creates situations where its soil properties will deteriorate, quickly triggering bank slope instability and other dangerous situations. In order to study embankment slope soil in the disintegration and permeability characteristics under the long-term water immersion process, disintegration tests and variable head infiltration tests were carried out on embankment-disturbed clays in Jiangxinzhou, Nanjing, Jiangsu Province, China. The results showed that the disintegration rate decreased with increasing dry density. Moreover, the samples gained weight quickly when the water content was low. Moreover, there is a threshold water content of around 20%, and it is assumed that the disintegration pattern of the soil may be significantly different depending on the optimum moisture content. The effect of moisture content on the disintegration of the samples was more significant. There were three main typical disintegration modes of the samples. The primary influencing factors resulting in the various disintegration patterns are the soil matrix suction, the change in consistency following water immersion, and the water membrane on the surface of the clay particles. The coefficient of permeability decreases with increasing dry density, and the variation of the coefficient of permeability with dry density coincides with the exponential function relationship. Long-term immersion conditions will change the permeability of the soil. An electron microscope test of immersed and unimmersed samples shows that the internal structure change is an essential factor affecting the permeability. After water immersion, with the dissolution of cementing material between soil particles, the particles move to fill the intergranular pore space so that the permeability coefficient decreases.

1. Introduction

During the flood season, the water level of rivers, lakes, and seas increases under continuous heavy rainfall. It remains at a high level for a long time. An embankment has been in an aquatic environment for a long time, resulting in the deterioration of the embankment soil in many aspects. The instability of the embankment slope can cause significant losses to people’s life security and property safety. In November 2017, a dangerous situation occurred near Guide Village, Sanmao Street, Yangzhong City, Zhenjiang City, Jiangsu Province, where the main river embankment collapsed about 240 m. In August 2020, during an inspection, the government of Luoshui Township, Shifang City, Deyang City, Sichuan Province, found a dangerous situation in the Zhonghekou section of Luoshui Township, Shiting River. By the flood, the overall collapse of the embankment was more than 250 m, causing economic losses of more than CNY 4,000,000.
The study of soil hydrophysical properties (including water-holding, water-stability, and permeability) is of great significance to the study of mechanical stability, consolidation deformation, and structural evolution of soils so that the knowledge of the above hydrophysical properties will help to understand the intrinsic mechanisms of soils generating engineering diseases more systematically.
Rainfall and immersion can rapidly transition from unsaturated to saturated soils submerged by wetting fronts. The volume of a liquid phase in the pore space increases, the solid phase components, such as crystalline and soluble salt, dissolve and transport, and the gas phase components decrease in volume due to extrusion or escape to the atmosphere, leading to slope deformation and damage by wetting and disintegration [1,2]. The disintegration mechanisms of soils are commonly associated with erosion and wetting disintegration. After water immersion, soil disintegration occurs as a water–soil interaction behavior. This property is called disintegration [3] and the wetting of soils in the geotechnical test procedure [4]. The study of the disintegration properties of soils has positive engineering significance and can be used to evaluate the aggression of soils. Zhou provided a reference for developing anti-erosion measures by studying the soil disintegration characteristics of collapsed walls in South China [5]. Also, soil slope stability relates to soil disintegration characteristics [1,6].
The degree of drying of the soil masses dramatically influences the degree of disintegration [7]. Many scholars have previously discussed the relationship between the initial water content state of the soil and the disintegration characteristics. The view is that the degree of soil disintegration intensity is inversely proportional to the water content. Luo [8] analyzed the disintegration of residual granite soils in the collapse erosion zone in South China and investigated the effects of dry density, initial water content, and temperature on the disintegration of residual granite soils. Li [9] found that the water content of residual granite soil was only related to its initial disintegration rate. Wang [10] found that when the water content increases, the disintegration rate decreases. Moreover, the disintegration phenomenon disappears when the water content increases to a particular value. Zhou [11] found that granite residual soil disintegration is more intense at low saturation.
Conventional indoor tests are often used to study the disintegration mechanisms of soils [12]. The whole process of soil disintegration is visualized by immersing a specific size of in-situ soil block or remodeled soil block into water and recording the change in the applied tensile force (buoyancy force applied) to the soil block. In situ experiments have also been carried out [12].
In soil disintegration tests, four common indicators are used to evaluate the degree of disintegration: disintegration volume [5,6], disintegration modulus [10], disintegration rate [9,13], and disintegration morphology [14]. Disintegration volume and disintegration rate are the two most widely used indicators. Permeability is one of the most fundamental hydrological properties of soils and is closely related to mechanical properties such as soil consolidation [15,16] and deformation and seepage [17,18].
Cai [19] established a density-dependent infiltration equation based on the incremental relationship between the initial porosity ratio and saturation and the relationship between the infiltration function and the soil–water characteristic curve. Ma Yawei [20] found that the effect of density on the infiltration coefficient is no longer significant when the loess water content is close to the residual water content. Xu [21] combined with the microstructural observation and found that the change in saturated infiltration coefficient of loess is not monotonous when the dry density is increased and that the dominant reason lies in the change from the physical process to the chemical process.
In geotechnical engineering, density is an important physical indicator of soils. The laws of dry density on the disintegration characteristics of unsaturated soils have been documented in different ways [5,22,23]. Embankments are often subjected to inundation during the flood season and have the potential to cause partial or complete destruction of the soil structure. It is important to study embankment slope soil disintegration characteristics and infiltration properties during long-term water accumulation. It is crucial to provide experimental support for monitoring and warning of embankment stability during the flood season.

2. Materials and Methods

2.1. Materials

Located between Jianye and Pukou districts, Nanjing Jiangxinzhou is the only urban island in the Yangtze River Basin in the main urban area. It is an alluvial sandbar in the lower reaches of the Yangtze River. Every year during the flood season, Jiangxinzhou is the most vulnerable area in Nanjing. After years of renovation, Jiangxinzhou has now built 22.5 km of the standard embankment, with the top of the embankment reaching an elevation of 12.13–12.3 m.
The soil used in this paper comes from a construction site of the Nanjing Jiangxinzhou embankment. Figure 1 is a schematic diagram of the primary sampling location. According to the Standard for Geotechnical Test Methods (GB/T50123-2019) [4], the specific gravity, liquid limit, maximum dry density, and optimum moisture content of the soil were determined through experimentation and shown in Table 1.

2.2. Disintegration Test

Disintegration tests are often performed by the float method [24] and the tensiometer method [10]. Due to the soil shedding disturbance and the bubble escape effect causing the float to float, the float method could be more stable during the measurement process. In this paper, the tensiometer method was chosen. As shown in Figure 2, a simple disintegration test device was designed, allowing the sample to deform freely in all directions. The samples were placed on a wire mesh grid of 1 cm × 1 cm. Moreover, a spring dynamometer (Range: 1 N, Accuracy: 0.02 N) weighed the samples during disintegration.
After drying and cooling the samples with different immersion times, they were ground into fine particles using a grinding rod and then sieved through a 2 mm screen. The prepared samples were stored in preservation bags. Deionized water was used to prepare soil samples with water contents of 5%, 10%, 15%, 20%, 25%, and 30% before they were sealed in plastic bags and left for 24 h. Considering disintegration occurs in shallow soils, standard ring knives with smaller thicknesses and larger cross-sectional areas were used to press the samples (Φ61.8 mm × 20.0 mm). This produced samples with different dry densities (1.4 g/cm3, 1.5 g/cm3, 1.6 g/cm3). The disintegration test design is shown in Table 2.
The equipment was assembled according to Figure 2 and the pushers were used to remove the soil sample from the ring knife to ensure the integrity of the soil sample. The container was filled with a fixed volume of deionized water to provide a hydrostatic environment for the disintegration of the sample, and the suspension height of the spring force gauge was fixed to ensure that the test device was not disturbed during the entire test. During the test, the ring knife sample was placed smoothly on the wire mesh and quickly submerged in water while immediately starting the timer and recording the spring force meter readings. When the spring dynamometer reading remained unchanged, it indicated that the sample had been completely disintegrated, and the test was terminated.
Based on the literature [9,13] and norms [4], the soil’s disintegration properties were assessed using the disintegration quantity and rate. The general equations for both are shown below.
Real-time disintegration volume Δ m t (%):
Δ m t = F 0 F t F 0 × 100 % ,
In the formula, F 0 is the spring force gauge reading when the ring knife sample and the metal mesh are submerged in water and just stabilized(N), and F t is the spring dynamometer reading after time t(N).
Real-time disintegration rate v   (%/s):
v = Δ i + 1 Δ i   t i + 1 t i
In the formula, Δ i + 1 and Δ i correspond to the real-time disintegration volume of the adjacent recording times t i + 1 and t i .
Equation (2) is the formula for the real-time disintegration rate. It reflects the speed of disintegration of the soil after water immersion. Observing the mass time variation curves shows that it has some linearity and can be fitted by a straight line. Therefore, the average disintegration rate is used to analyze the main processes of sample disintegration. The average disintegration rate is determined as follows in Figure 3.

2.3. Variable Head Permeability Test

Adoption of the indoor variable head test, whereby the variable head method is a test method in which the head difference varies with time during the laboratory test for determining the coefficient of permeability and is suitable for determining cohesive soils with negligible permeability. The penetration test instrument is shown in Figure 4.
The variable head permeability coefficient shall be calculated by the following formula [4]:
K t = 2.3 a L A t 2 t 1 l o g H 1 H 2
where a is the cross-sectional area of the variable head tube (cm2); 2.3 is the transformation factor; L is the seepage diameter, i.e., the height of the sample (cm); t 1 and t 2 are the start and end times of the head readings (s), respectively; and H 1 and H 2 are the start and end heads, respectively.

3. Results

3.1. Disintegration Test

3.1.1. Mass Time Variation Curves

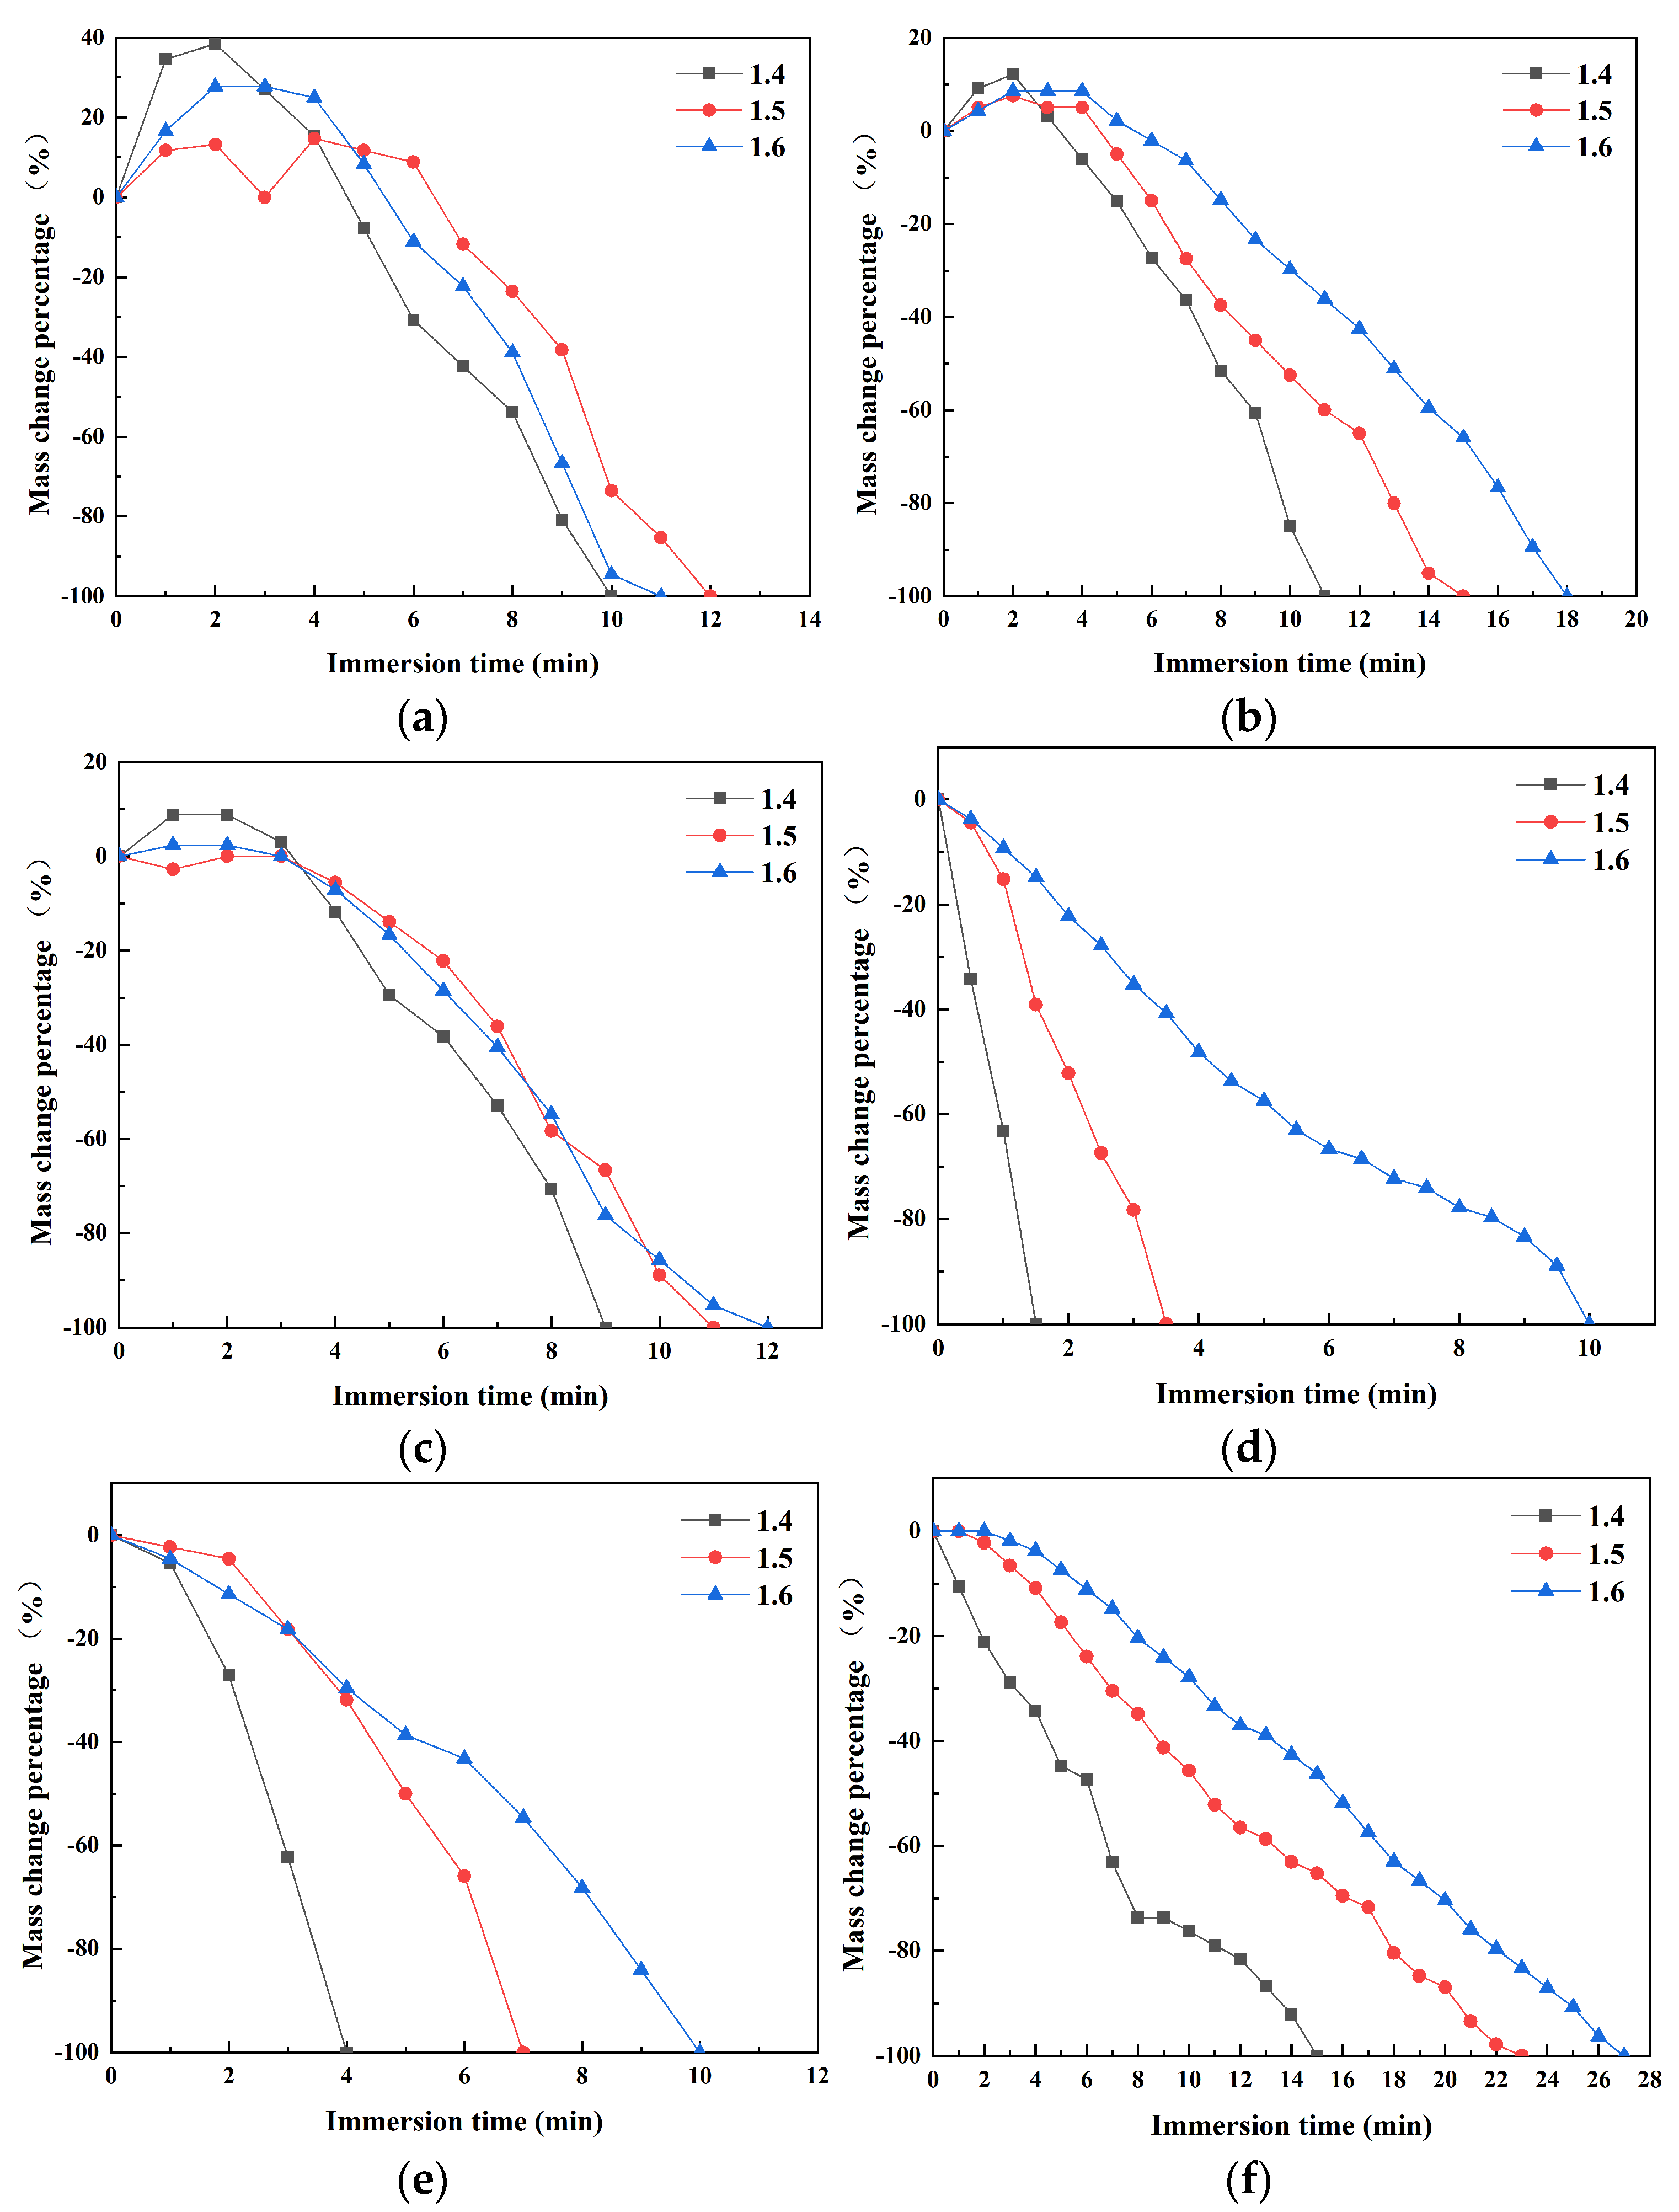
When the water content was low, the remolded sample absorbed water and gained weight first due to the suction of the matrix. The destruction was not strictly one-way disintegration. The destruction included water absorption, weight gain, and disintegration. Therefore, the percentage change in mass was used instead of the actual disintegration amount. The results are shown in Figure 5.
Throughout the test, the samples for all working conditions eventually disintegrated completely. Both water content and dry density significantly affected the soil samples’ disintegration characteristics. First, the rate of change of sample mass slowed with the increase in dry density degree.
Secondly, when the water content was low (5%–15%), sample mass change had the following stages: absorption, weight gain, and disintegration. In the initial stage, the water absorption of the sample was more significant than the disintegration amount, and the macroscopic expression was an increase in the total mass. In the later stage, the increase in the disintegration amount showed a continuous decrease in mass.
When the initial water content was significant (>15%), the continuous and rapid mass loss occurred after the soil was immersed in water until the disintegration was complete. This phenomenon was inconsistent with the conclusion of many scholars in previous studies wherein the degree of soil disintegration intensity was inversely proportional to the water content [11,25]. Since there is a threshold water content of around 20% and the optimum water content of the tested soil is 19.86%, it is assumed that the disintegration pattern of the soil may be significantly different depending on the optimum moisture content.

3.1.2. Total Disintegration Time

The time taken for the soil to complete disintegration in water is the total disintegration time. It mainly reflects the water stability of the soil in a particular initial state. The longer the total disintegration time, the better the soil water stability. The shorter the total disintegration time, the worse the soil water stability. Therefore, the total disintegration time can be used as an effective index to evaluate soil water stability.
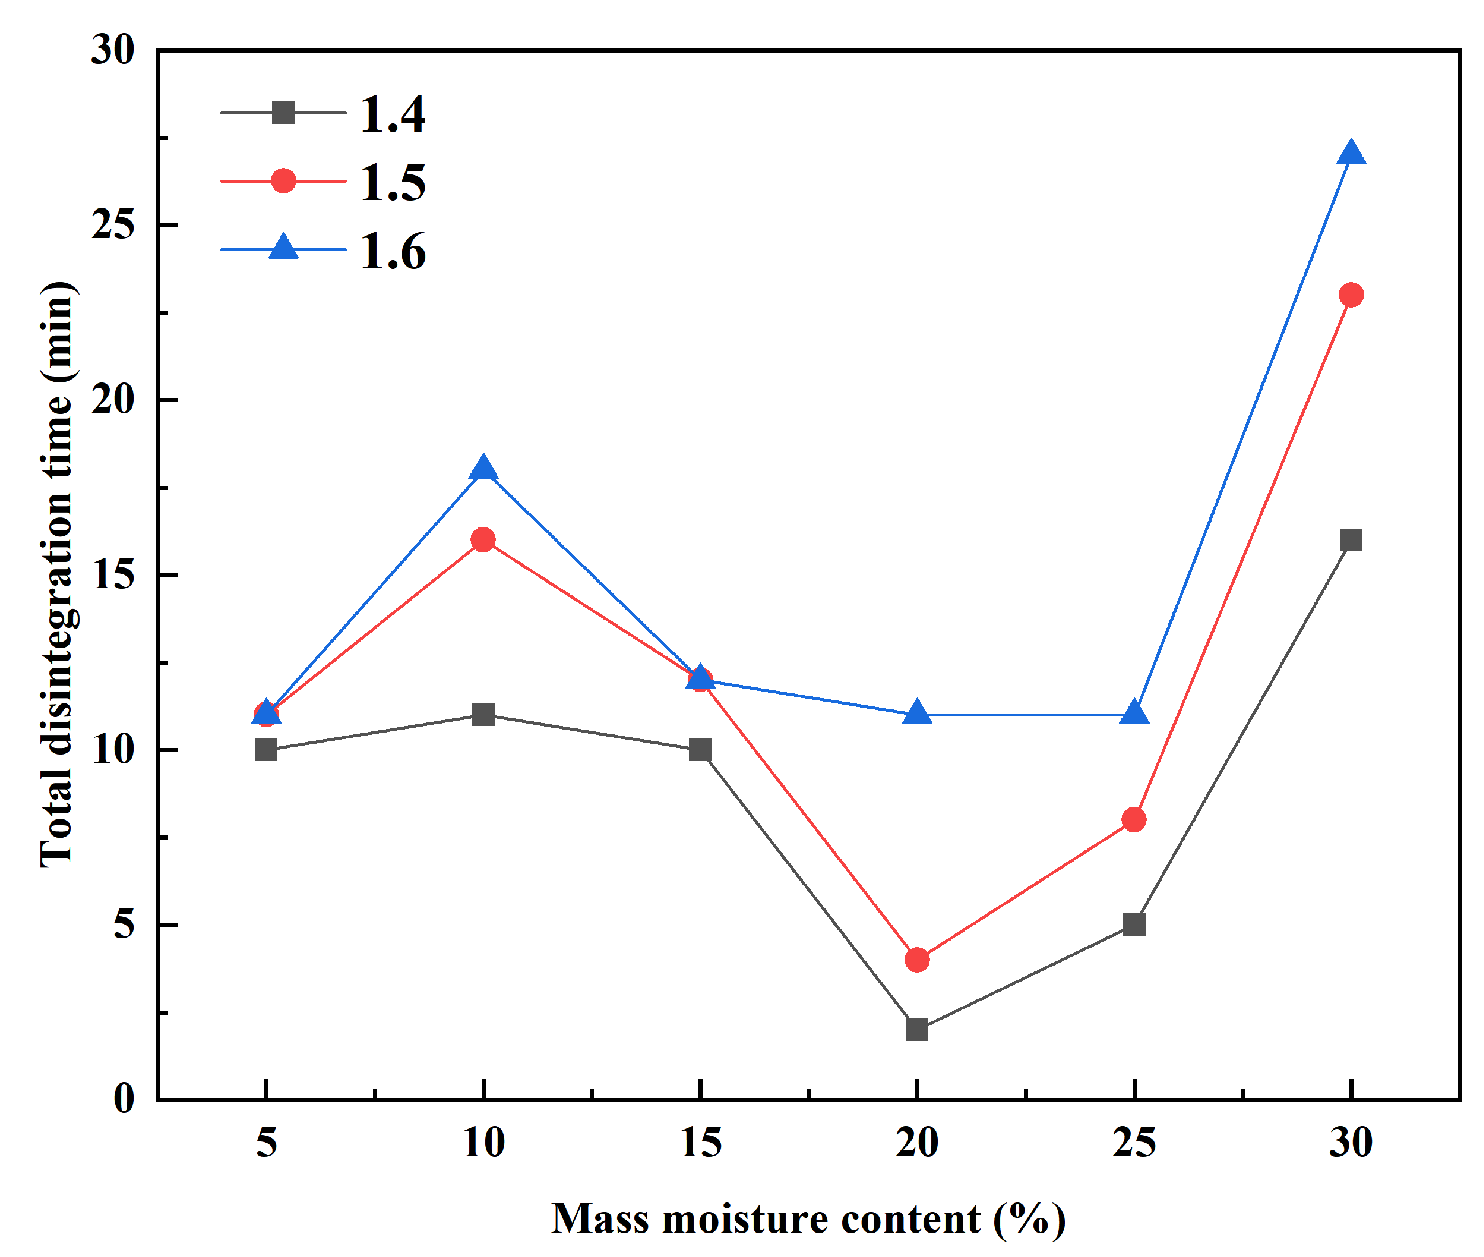
The complete disintegration epochs of the samples at different dry density levels and water contents were compiled. The results are shown in Figure 6. It was clear that the sample’s water content and degree of dry density significantly impacted the total disintegration time. Firstly, the greater the soil dry density, the longer the total disintegration time. Second, the soil’s initial moisture level rose from 10% to 20%, shortening the overall disintegration time, whereas the water content rose from 25% to 30%, lengthening the duration.

3.1.3. Average Disintegration Rate

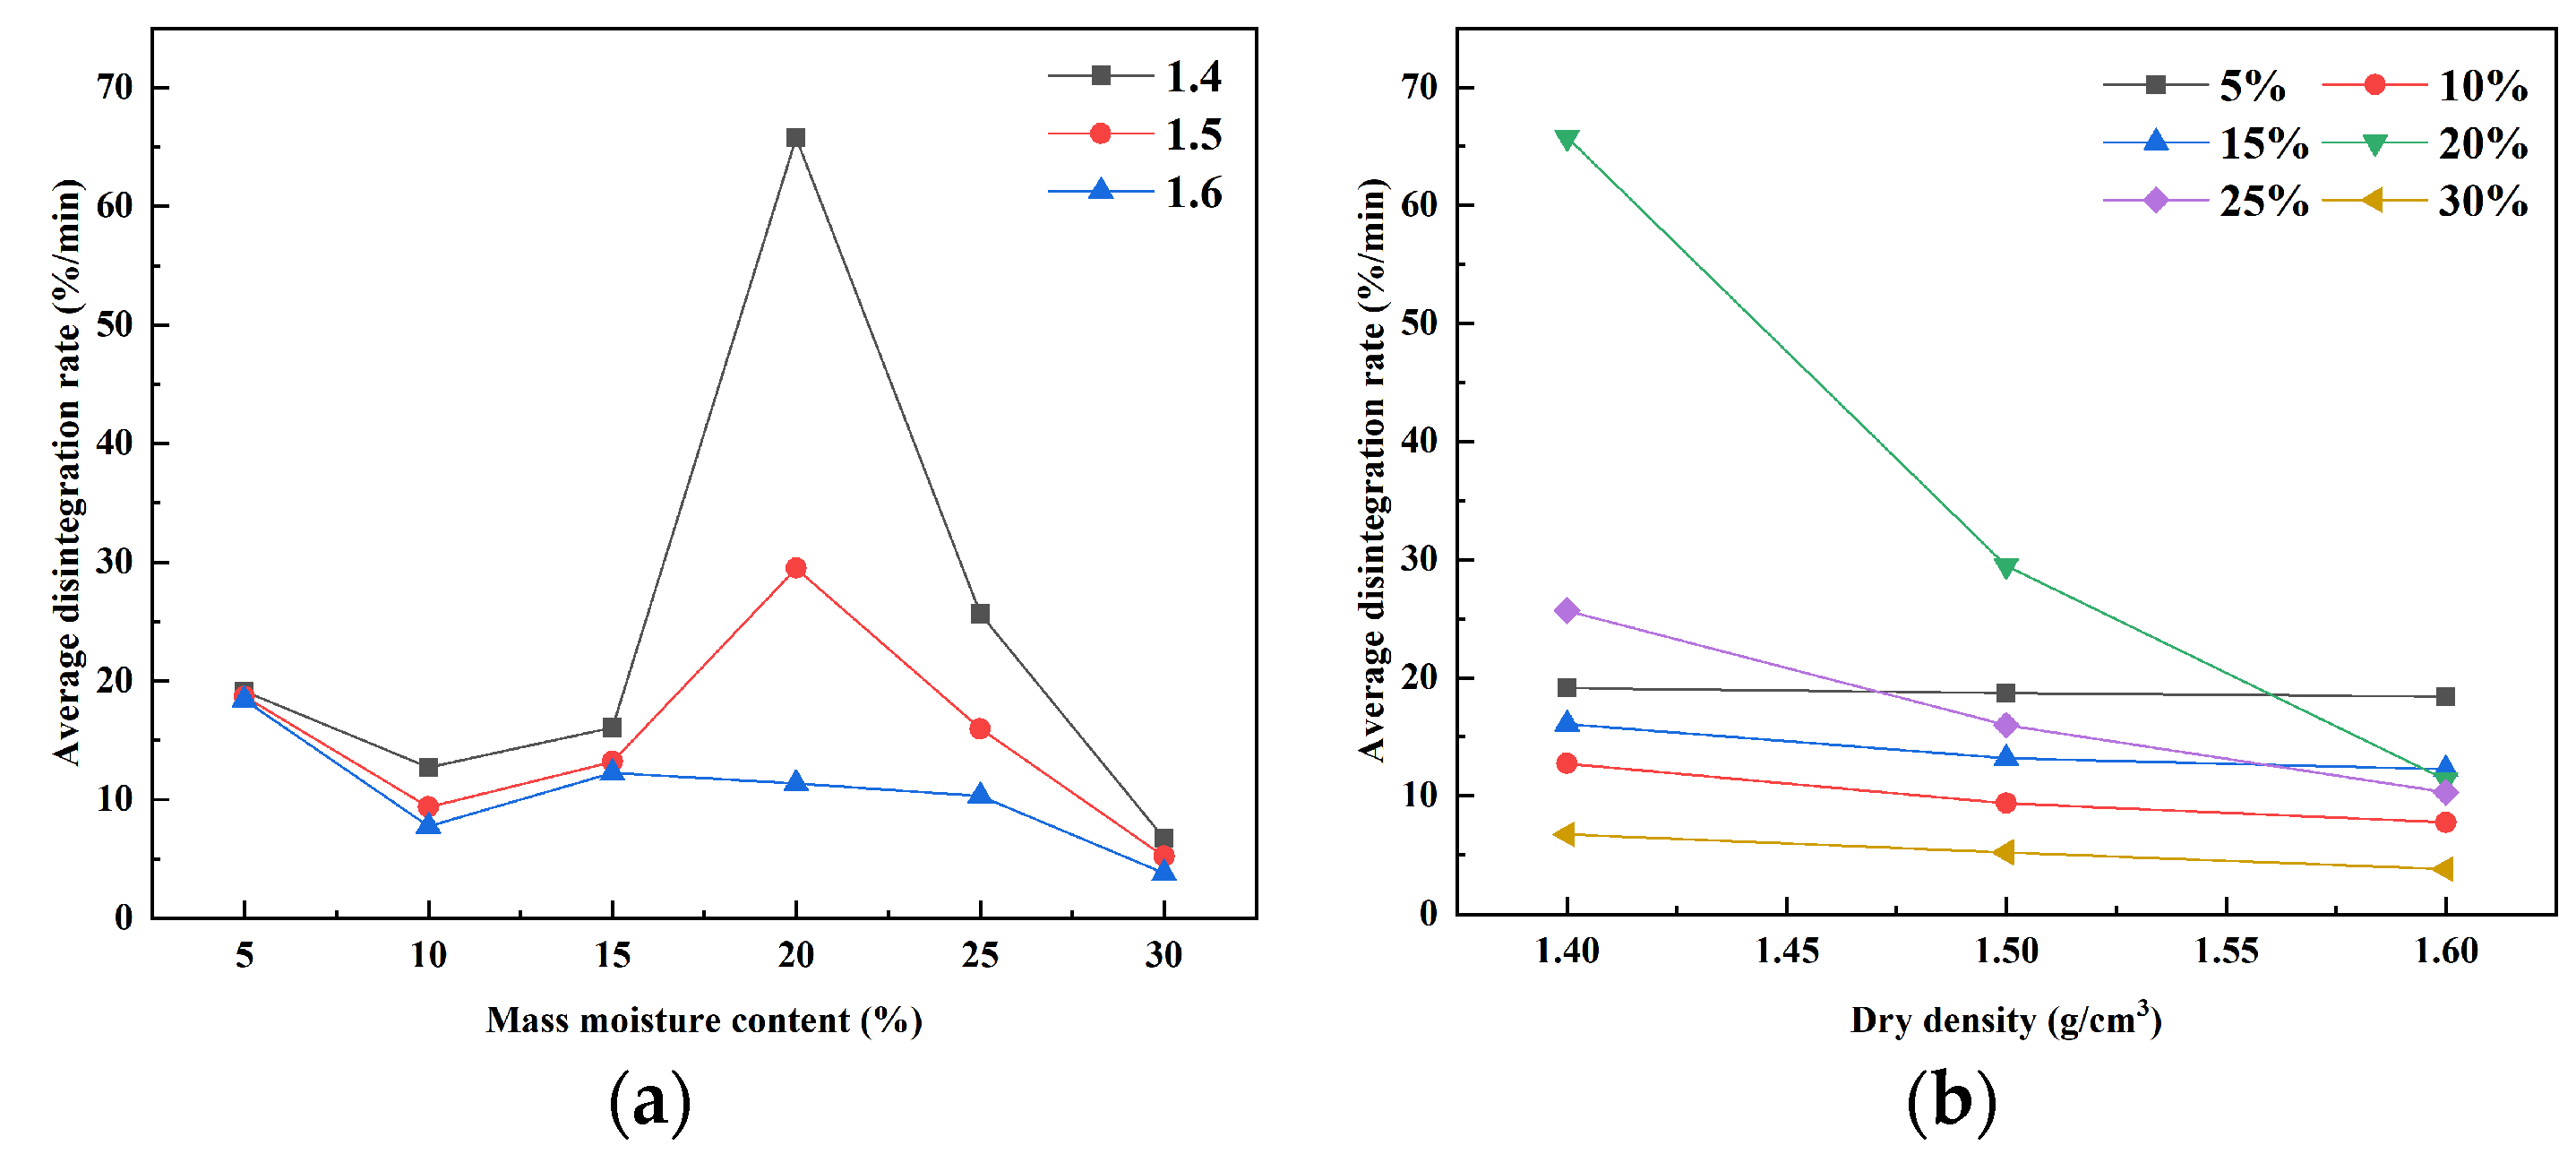
According to Figure 7, the average disintegration rate first increased (<20%) and then dropped as the water content rose (>20%). Its change was related to the change in disintegration mode. Also, the average disintegration rate decreased with the increase in dry density degree.

3.1.4. Typical Disintegration Processes of Soil Samples

Depending on the water content, three morphological modes occurred in soil samples after water immersion. The first disintegration mode corresponded to samples with 5%, 10%, and 15% water content. The second disintegration mode corresponded to samples with 20% and 25% water content. The third disintegration mode corresponded to samples with 30% water content.
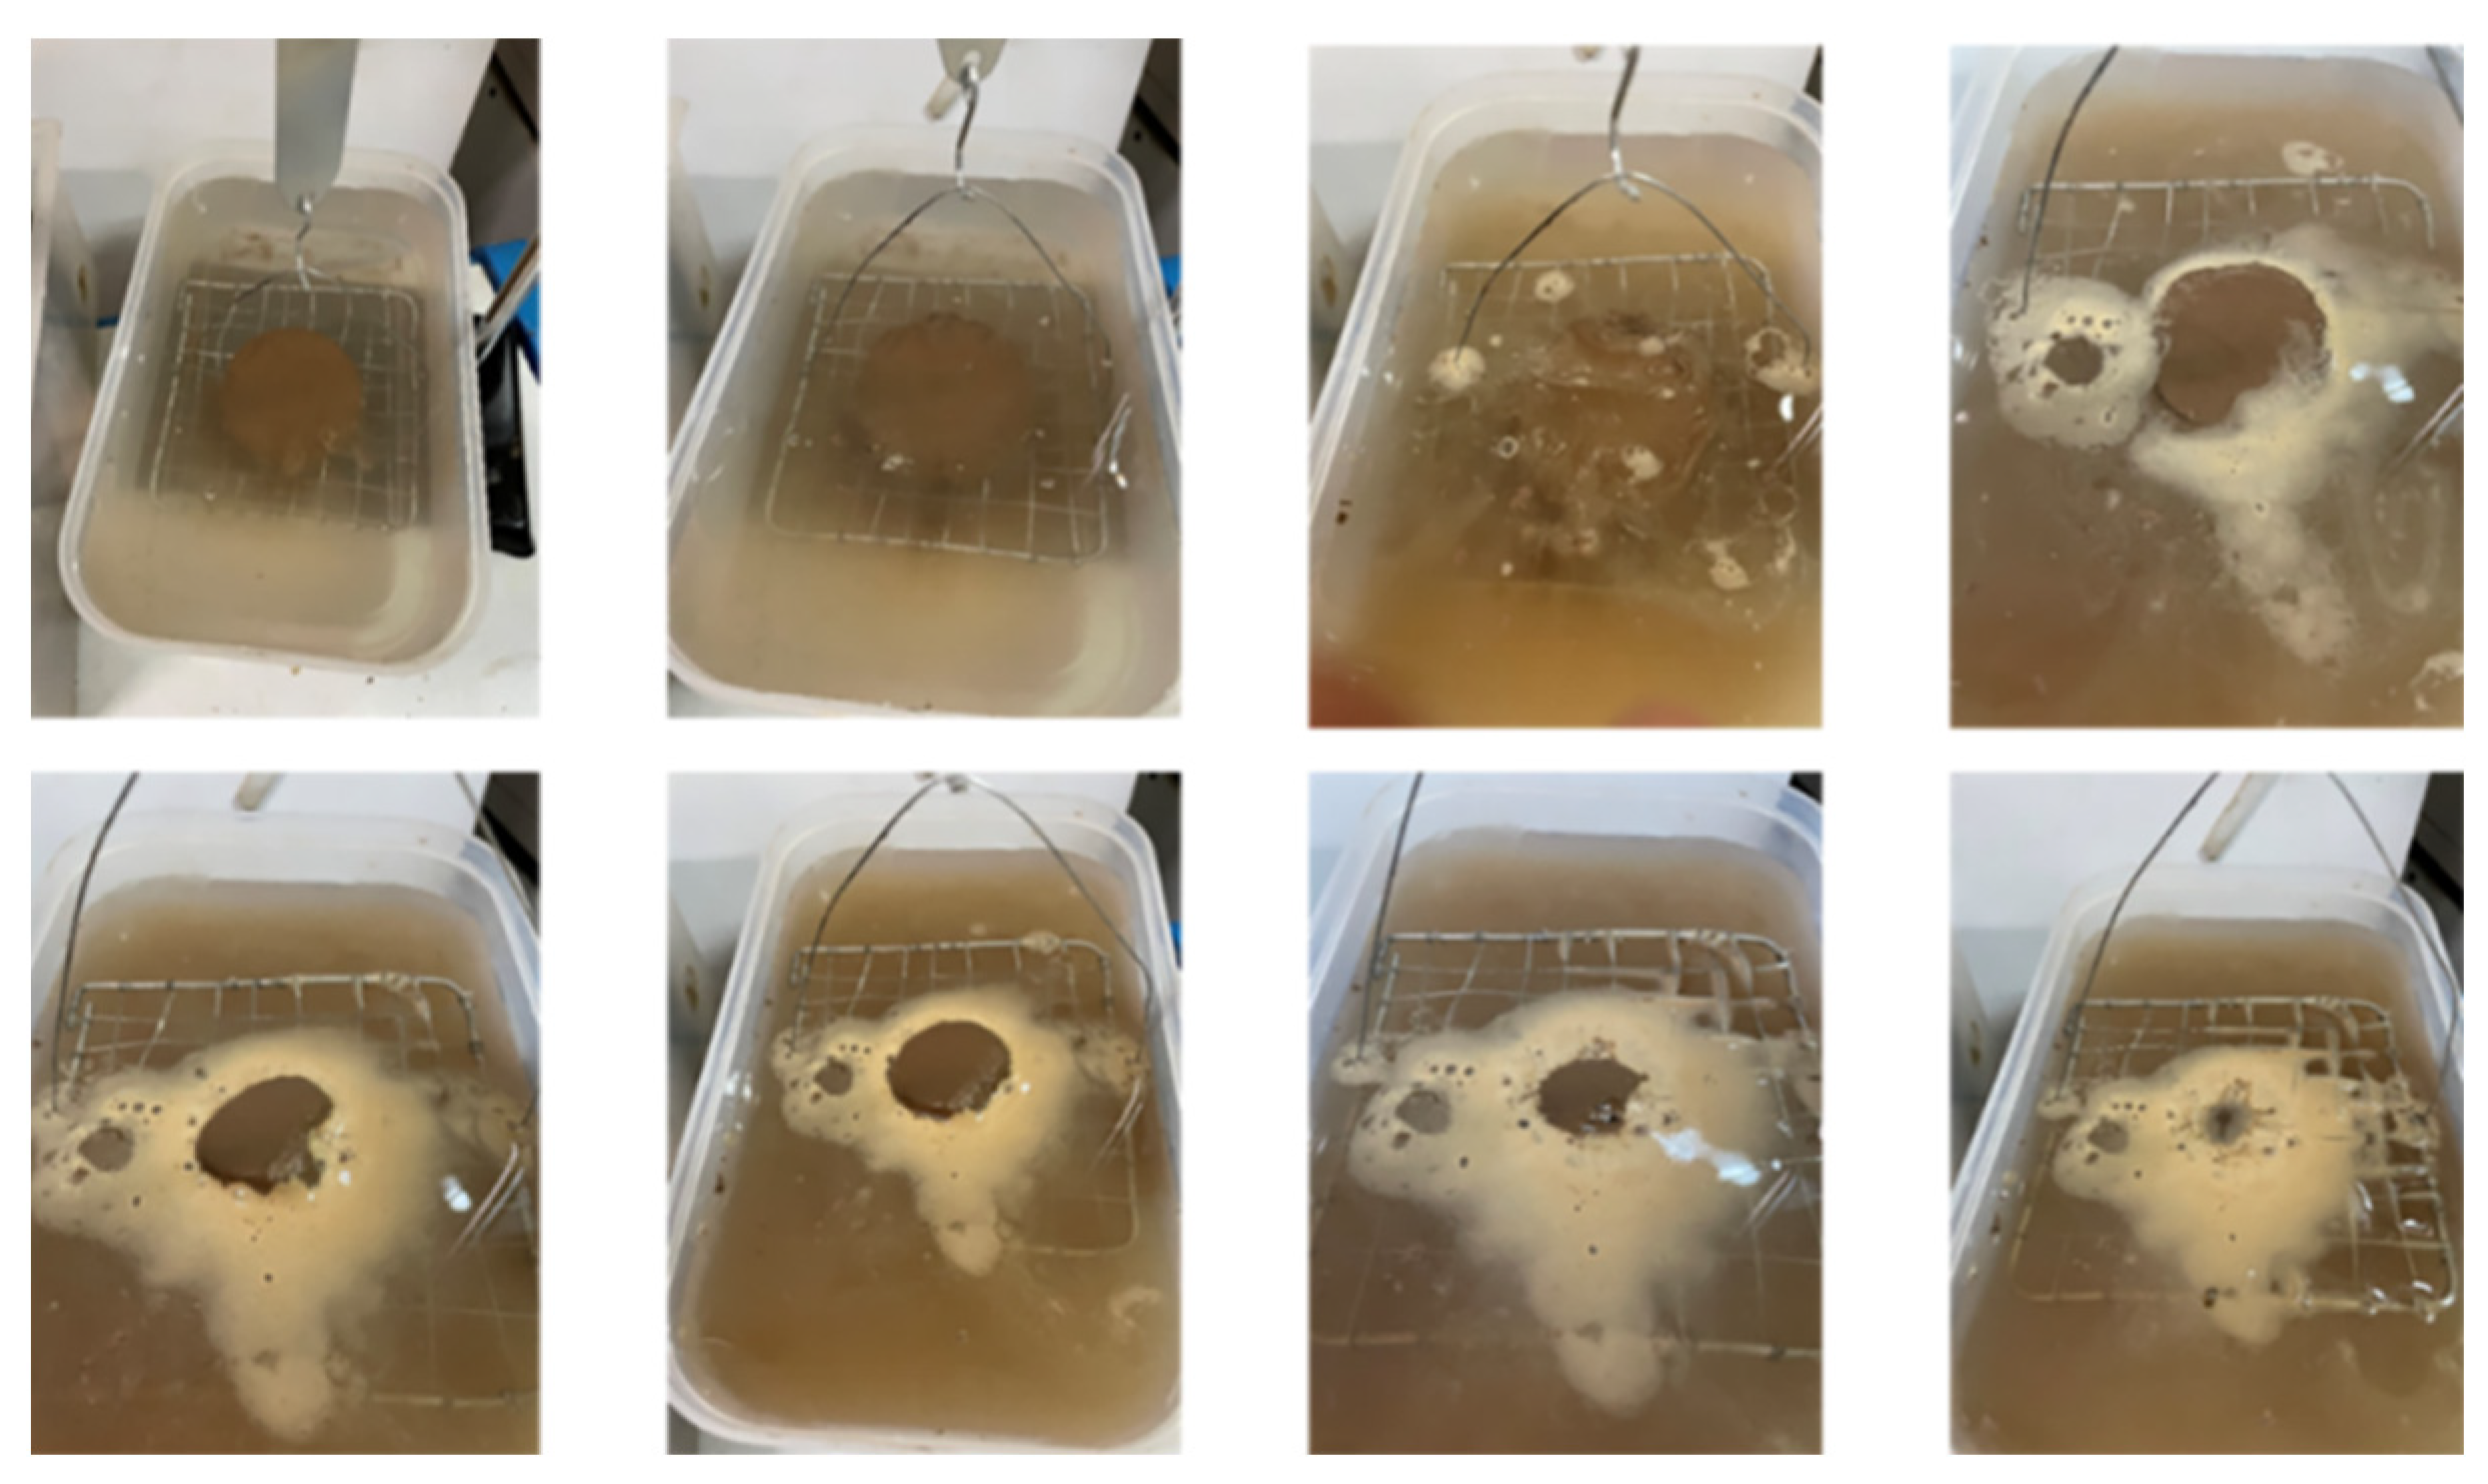
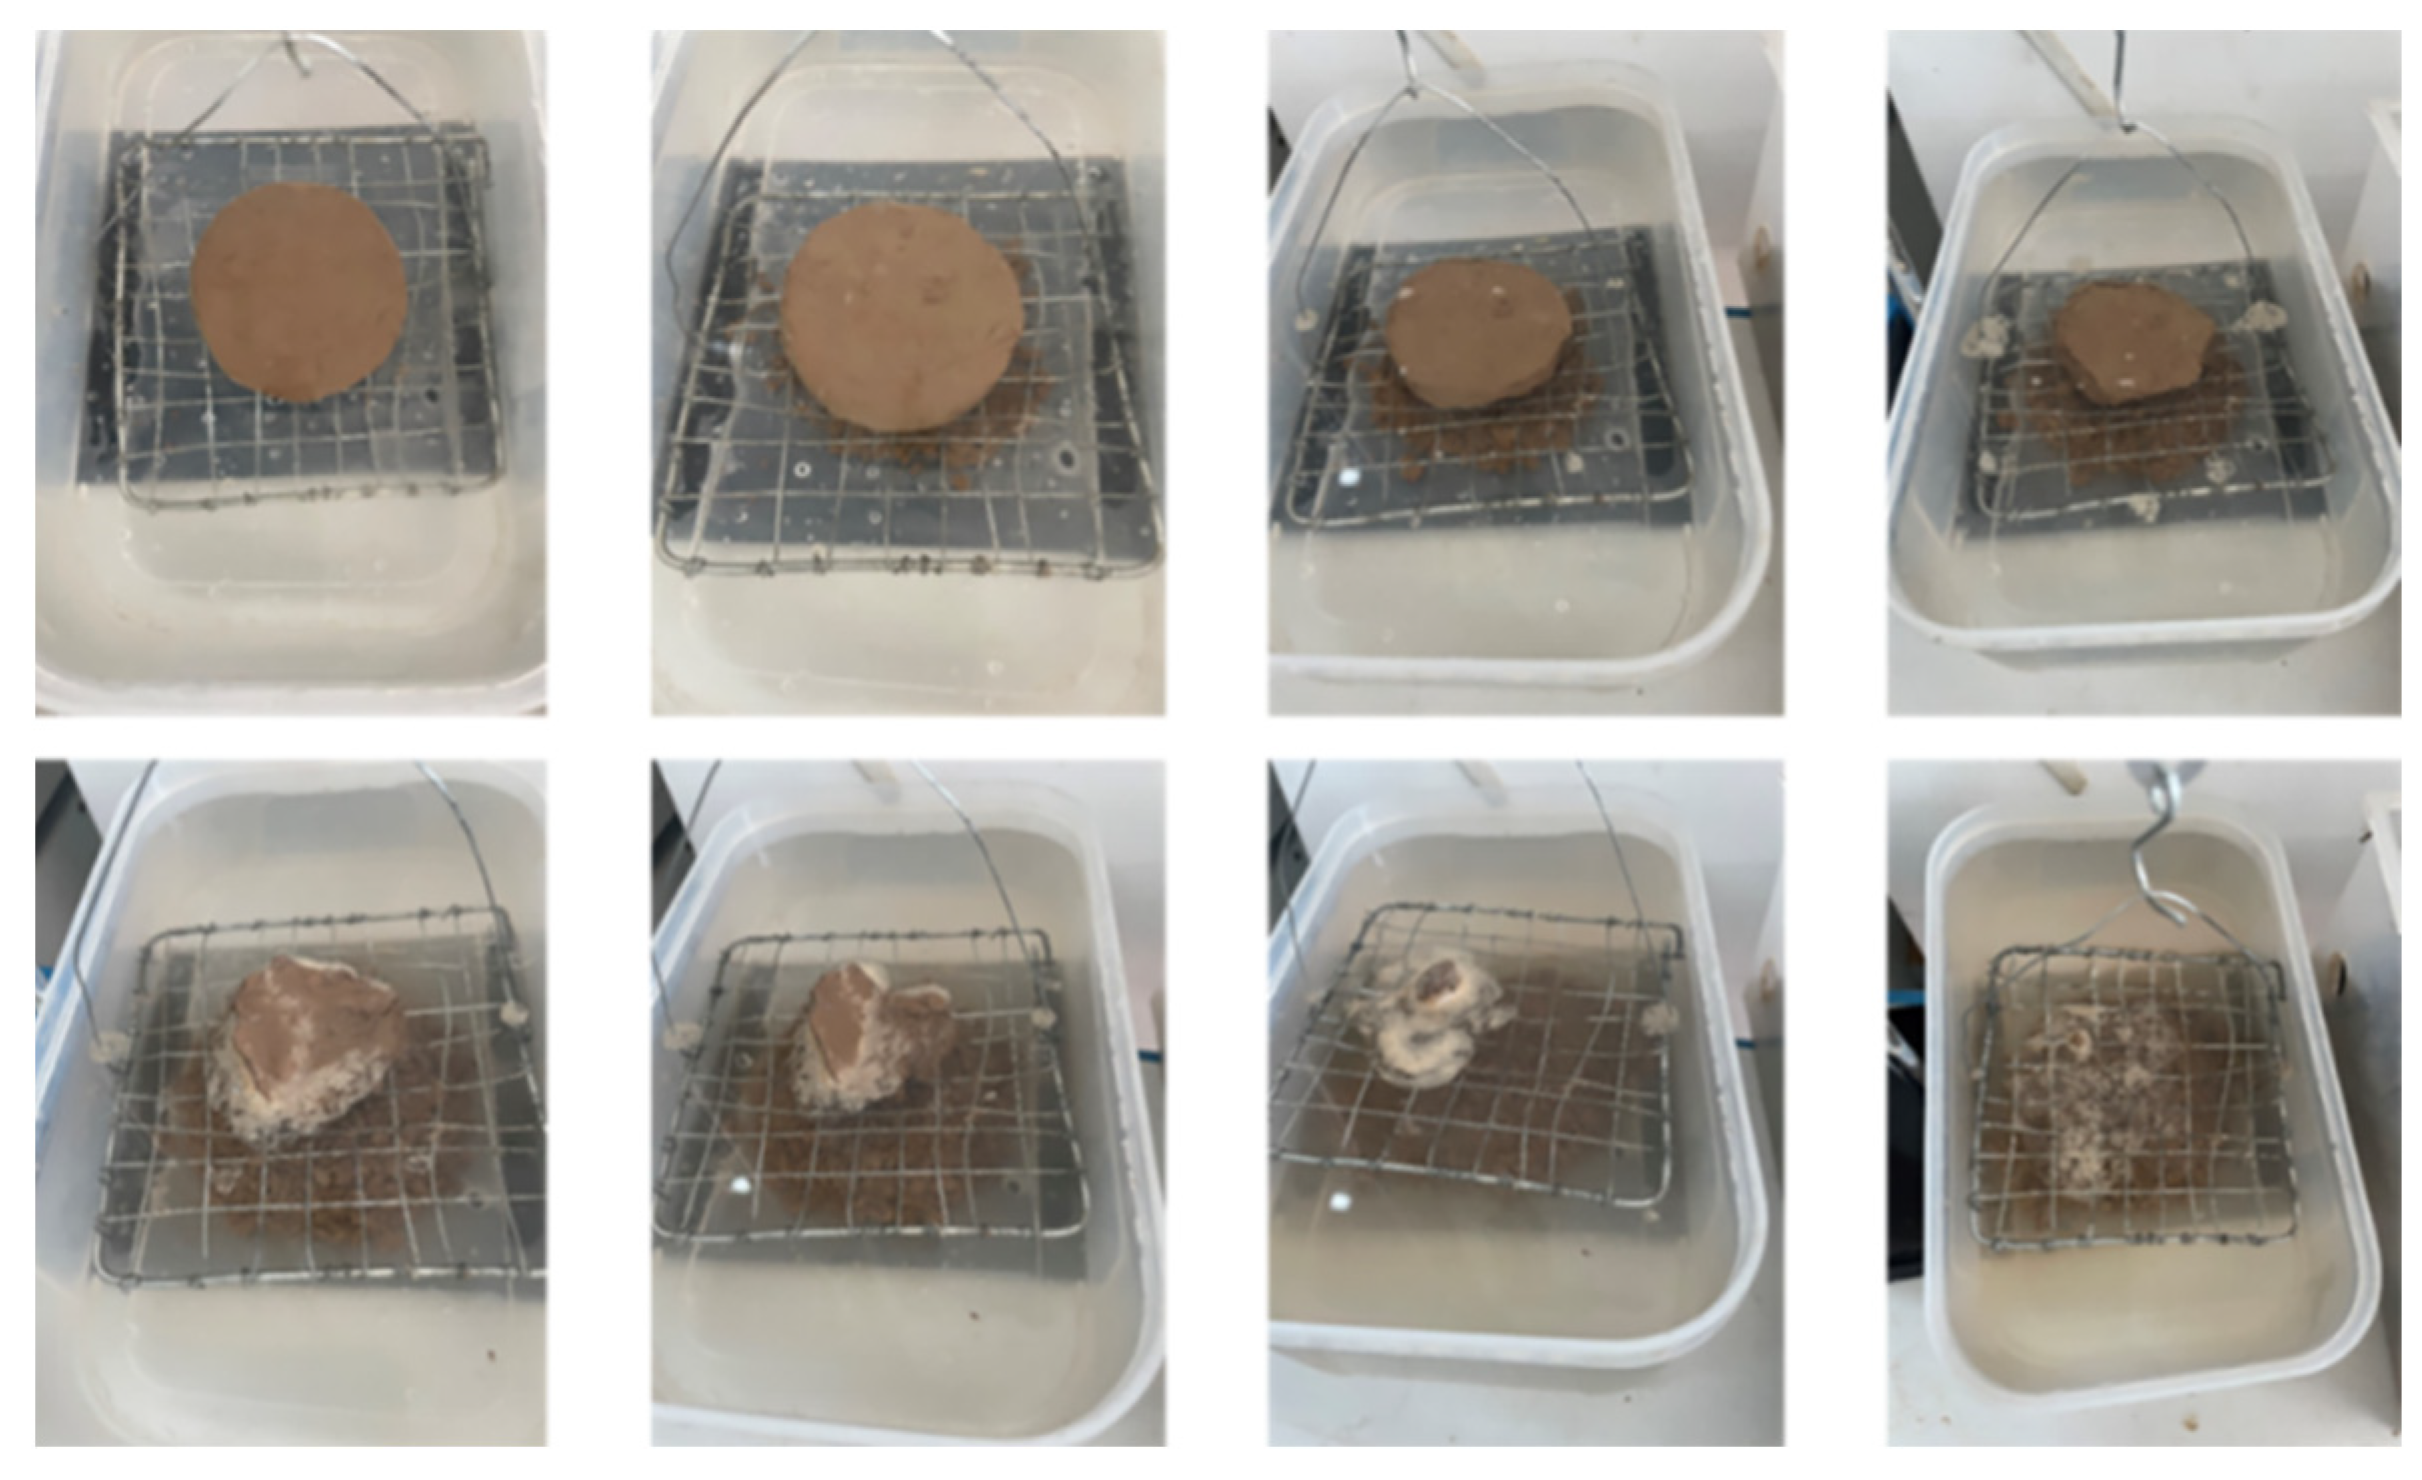
Figure 8 shows a sample with 5% water content and a 1.4 g/cm3 dry density. The process of weight gain-disintegration mode occurs after water immersion. In the initial stage, the samples showed localized soil loss at the edges and signs of soil disintegration at the sides after water immersion. The liquid in the container was relatively unambiguous. At this point, the soil mass gained by water absorption of the sample was higher than the soil lost after disintegration, and the spring dynamometer reading increased. Subsequently, the disintegrated soil steadily sinks rapidly through the metal mesh to the bottom of the container over a more extended period.
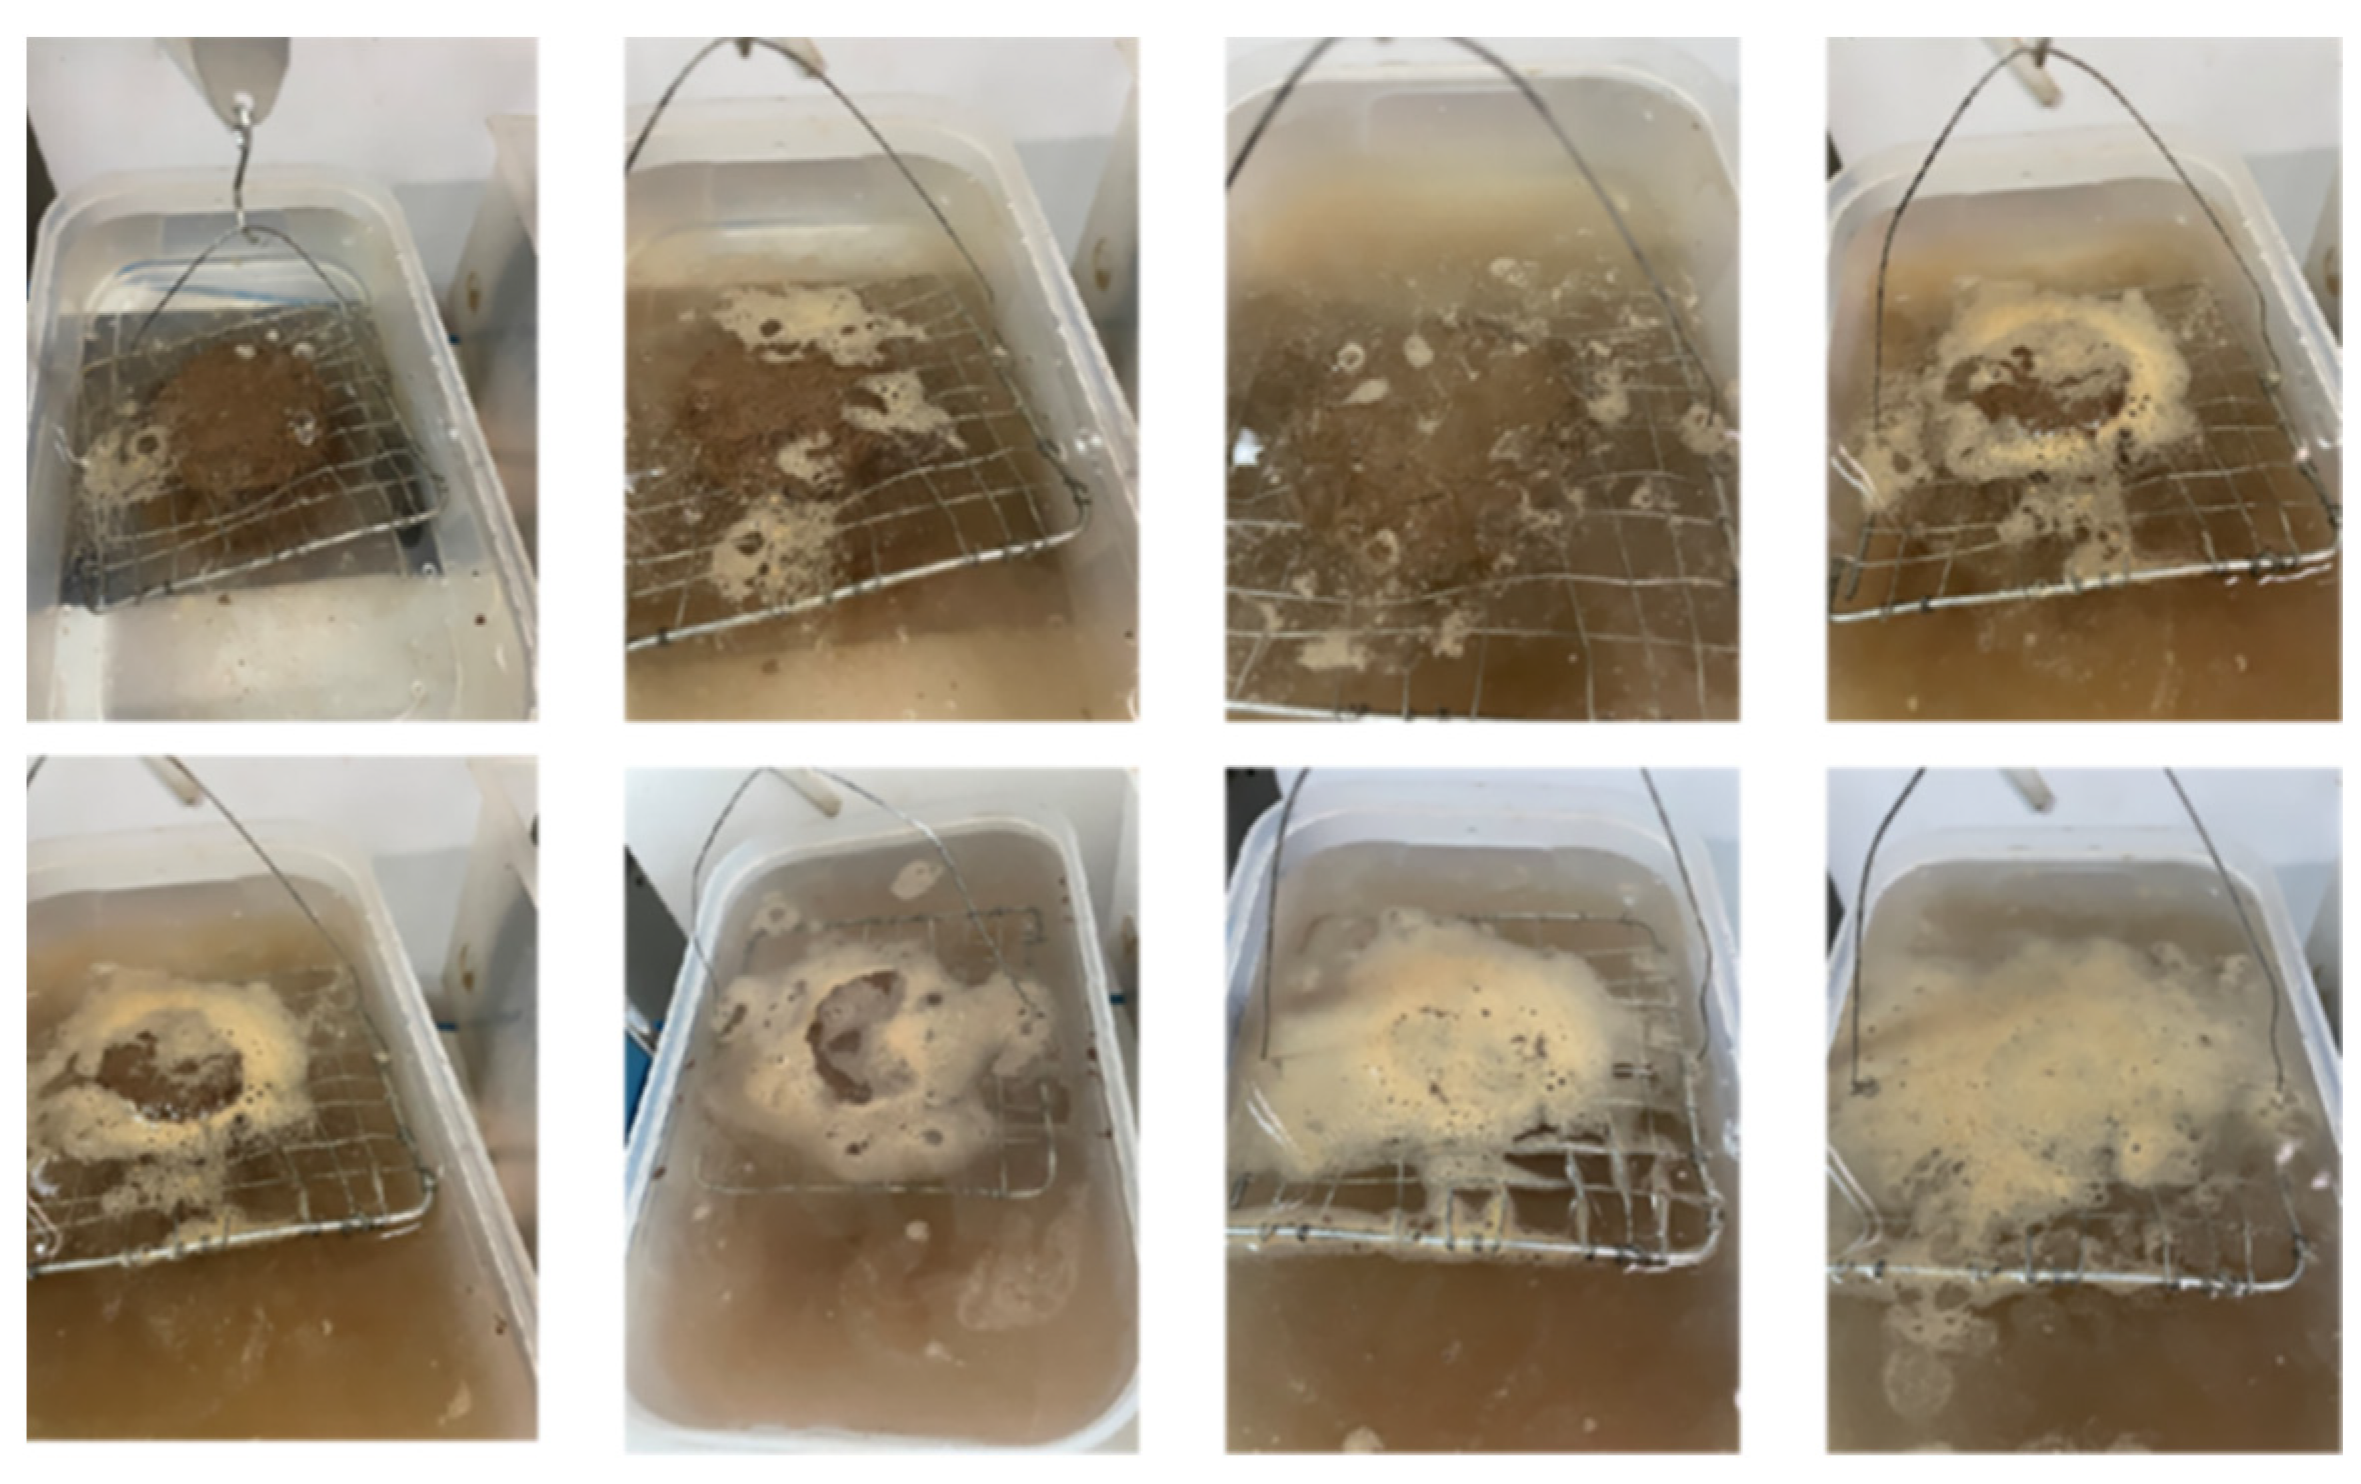
Figure 9 shows a sample with 20% water content and a 1.4 g/cm3 dry density. It underwent a rapid disintegration mode of morphological evolution process after water immersion. After immersion, the initial bubbles could be observed because of the initial non-saturated state. Also, some sample fragments could be observed coming off and deposited from the bottom of the equipment vessel. The water in the vessel was still evident. After a relatively short period, the sample disintegrated severely, and many tiny particles could be observed decomposing in a cloudy manner on the sample. The water was muddy and unknown. The test volume dropped sharply briefly, leaving only the central. The turbidity of the water in the equipment vessel deepened, and bubbles increased. The following sample quickly disintegrated, and eventually, the water surface produced many bubbles. The whole process of disintegration was relatively continuous, with the sample rapidly flaking and disintegrating radially from the outside to the inside, and the process was never interrupted.
Figure 10 shows a sample with 30% water content and a 1.4 g/cm3 dry density. It underwent a continuous stable disintegration mode of morphological evolution after water immersion. After water immersion, although the initial state was unsaturated, only a small number of bubbles were observed initially because of the high water content. The disintegration process was from the outside to the inside and from the bottom to the top. It could be observed that sample debris was falling and deposited at the bottom of the device container with the development in disintegration time. The water in the container had been kept clear.

3.2. Variable Head Permeability Test

From Table 3, it can be seen that after 20 days of immersion, as the dry density increases, the degree of change in the permeability coefficient is weakening, which may be due to the increase in the degree of densification of the sample, resulting in a weakening of the destructive effect of the immersion time on the sample structure.
In Table 3, K s is the increment of saturated permeability coefficient (cm/s); K f is the relative increment of saturated permeability coefficient (%); Δ K and δ K denote the saturated permeability coefficients (cm/s) at the initial and final moments in the infiltration cycle, respectively.
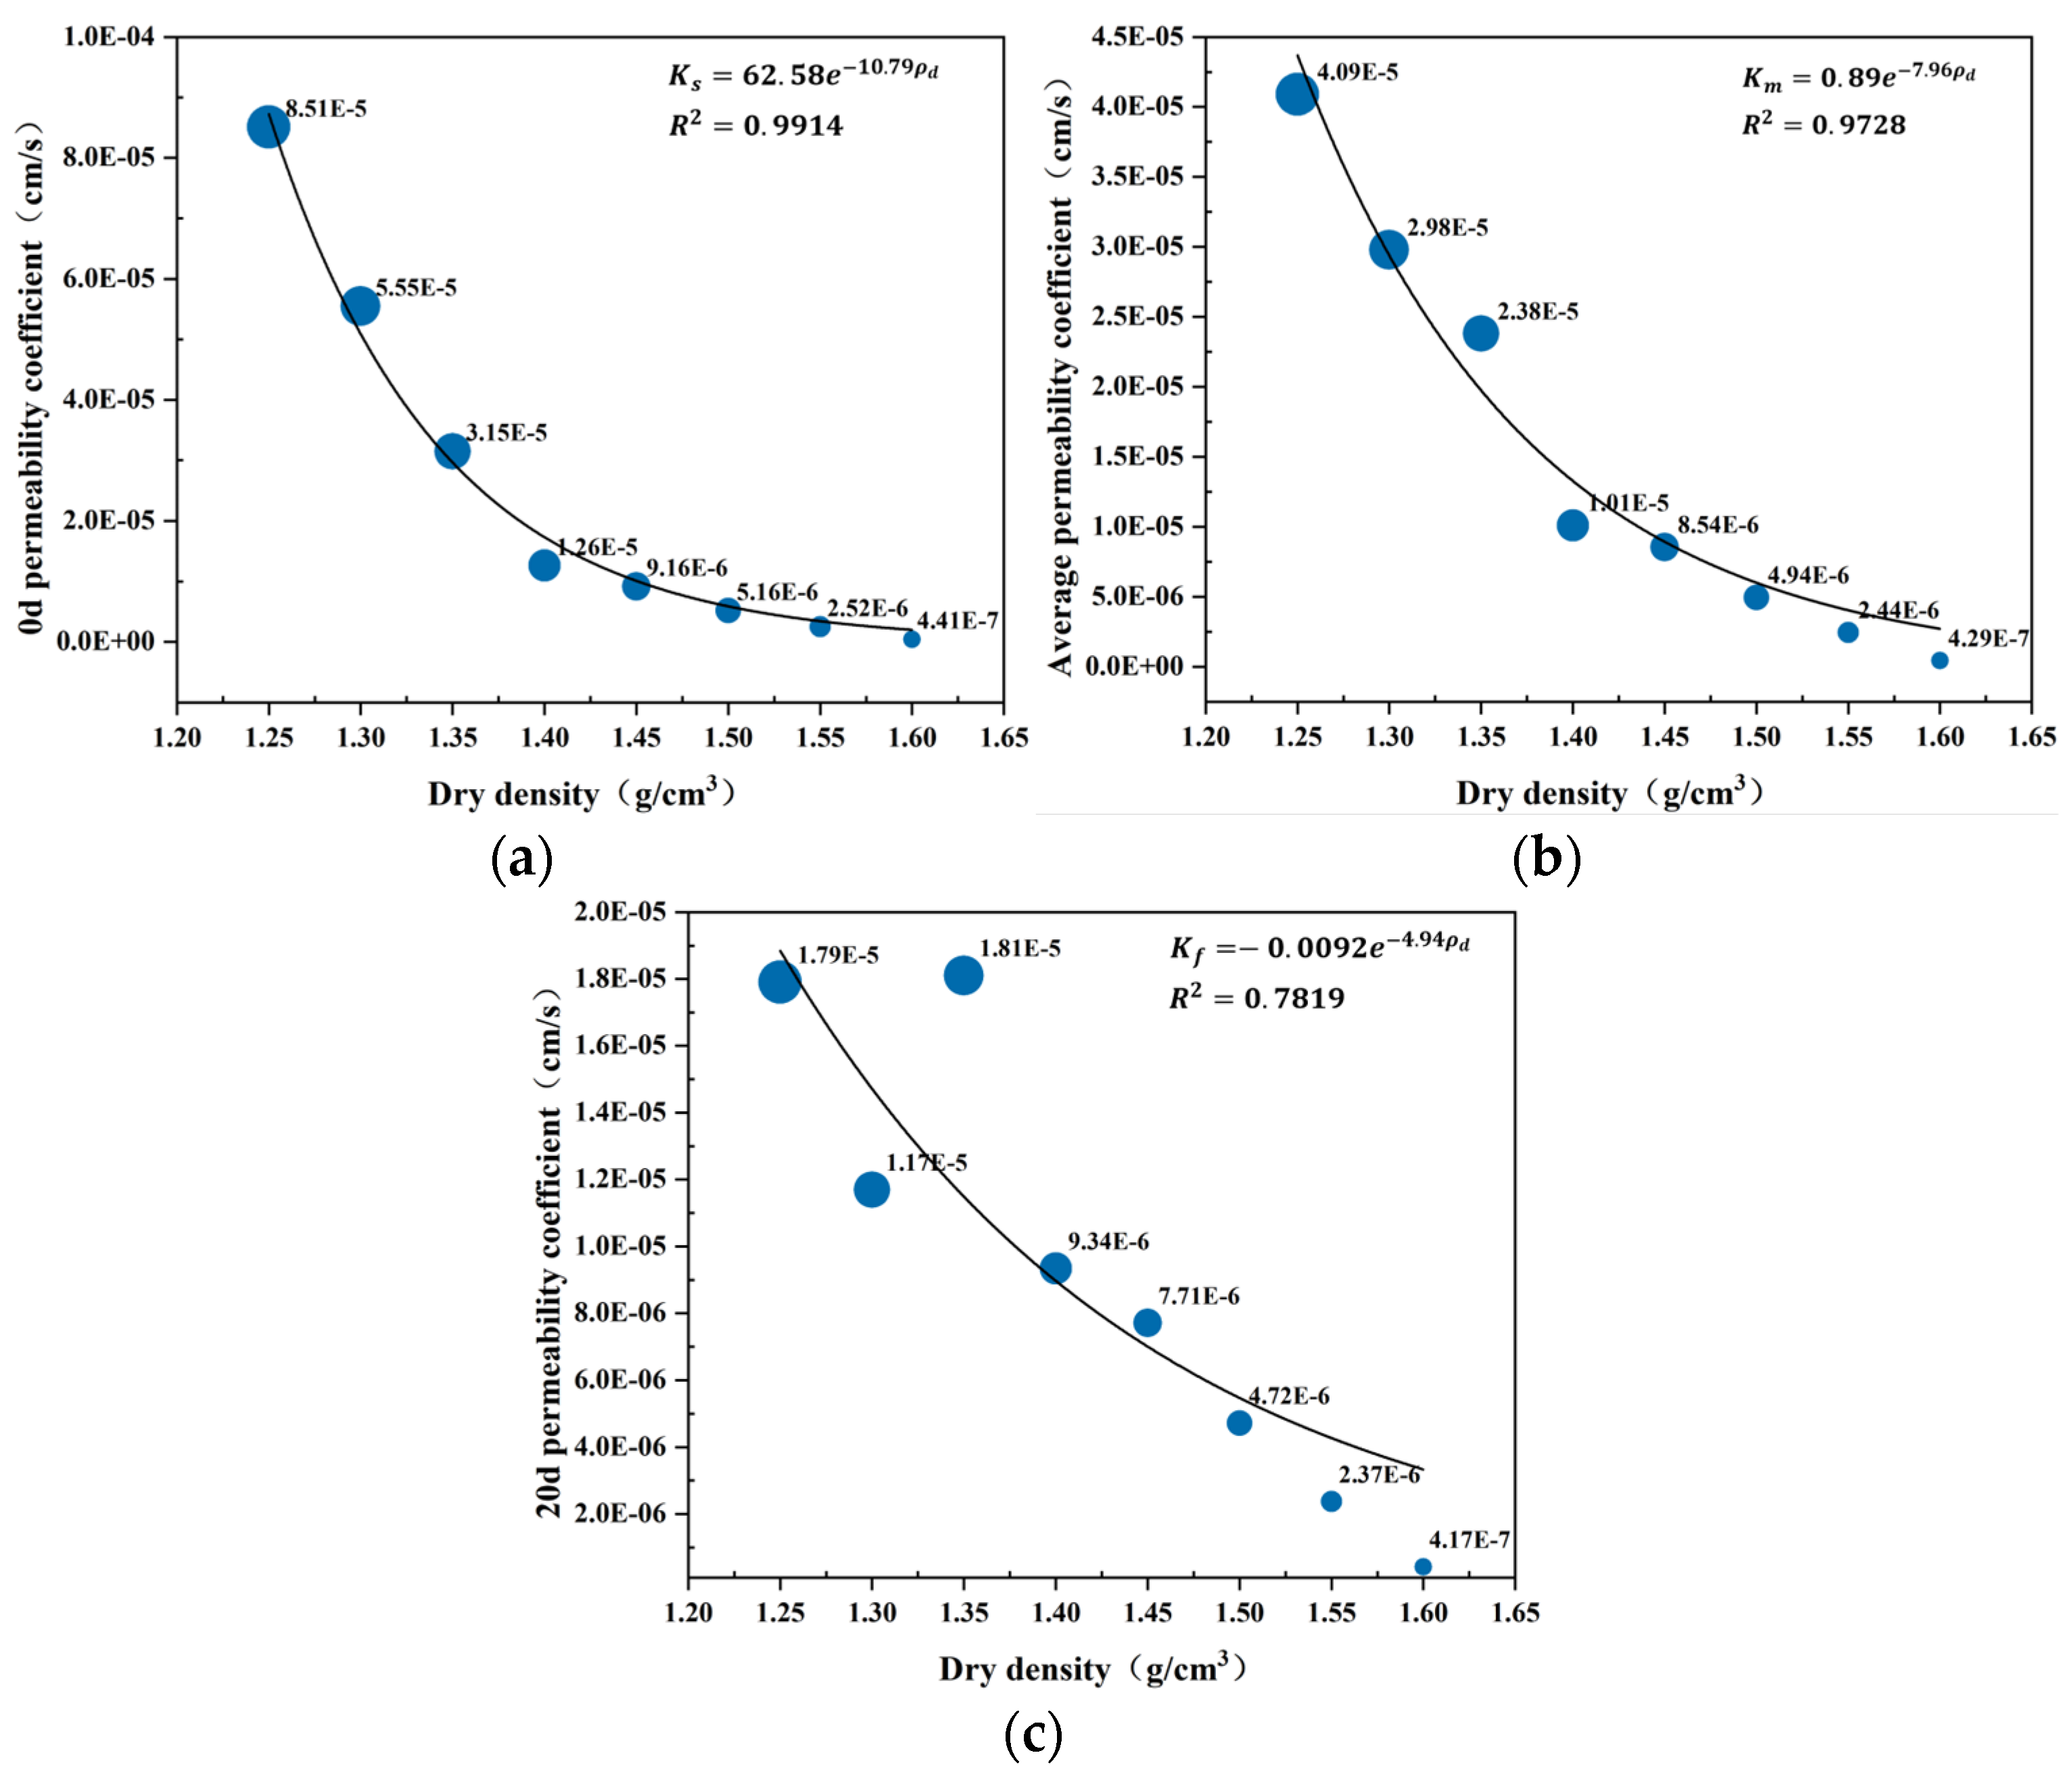
In order to thoroughly investigate the relationship between the permeability coefficient and dry density of the remodeled soil, the permeability coefficients at different stages were fitted to the dry density, as shown in Figure 11. The fitting equations of initial, final, and average permeability coefficients to dry density are K s = 62.58 e 10.79 ρ d , K f = 0.0092 e 4.94 ρ d , K m = 0.89 e 7.96 ρ d , respectively, and their correlation coefficients (R) are 0.9914, 0.7819, and 0.9728, respectively. It can be seen that the permeability coefficients of the different stages have a negative exponential relationship with dry density, which agrees with other scholars’ studies on the relationship between dry density and permeability coefficient [26]. In addition, it can also be seen from Figure 11 that the fitting relationship between the final permeability coefficient and the dry density is relatively poor, mainly because of the anomalous decrease in the permeability coefficient of the samples with a dry density not greater than 1.35 g/cm3.

4. Discussion

4.1. Soil Disintegration

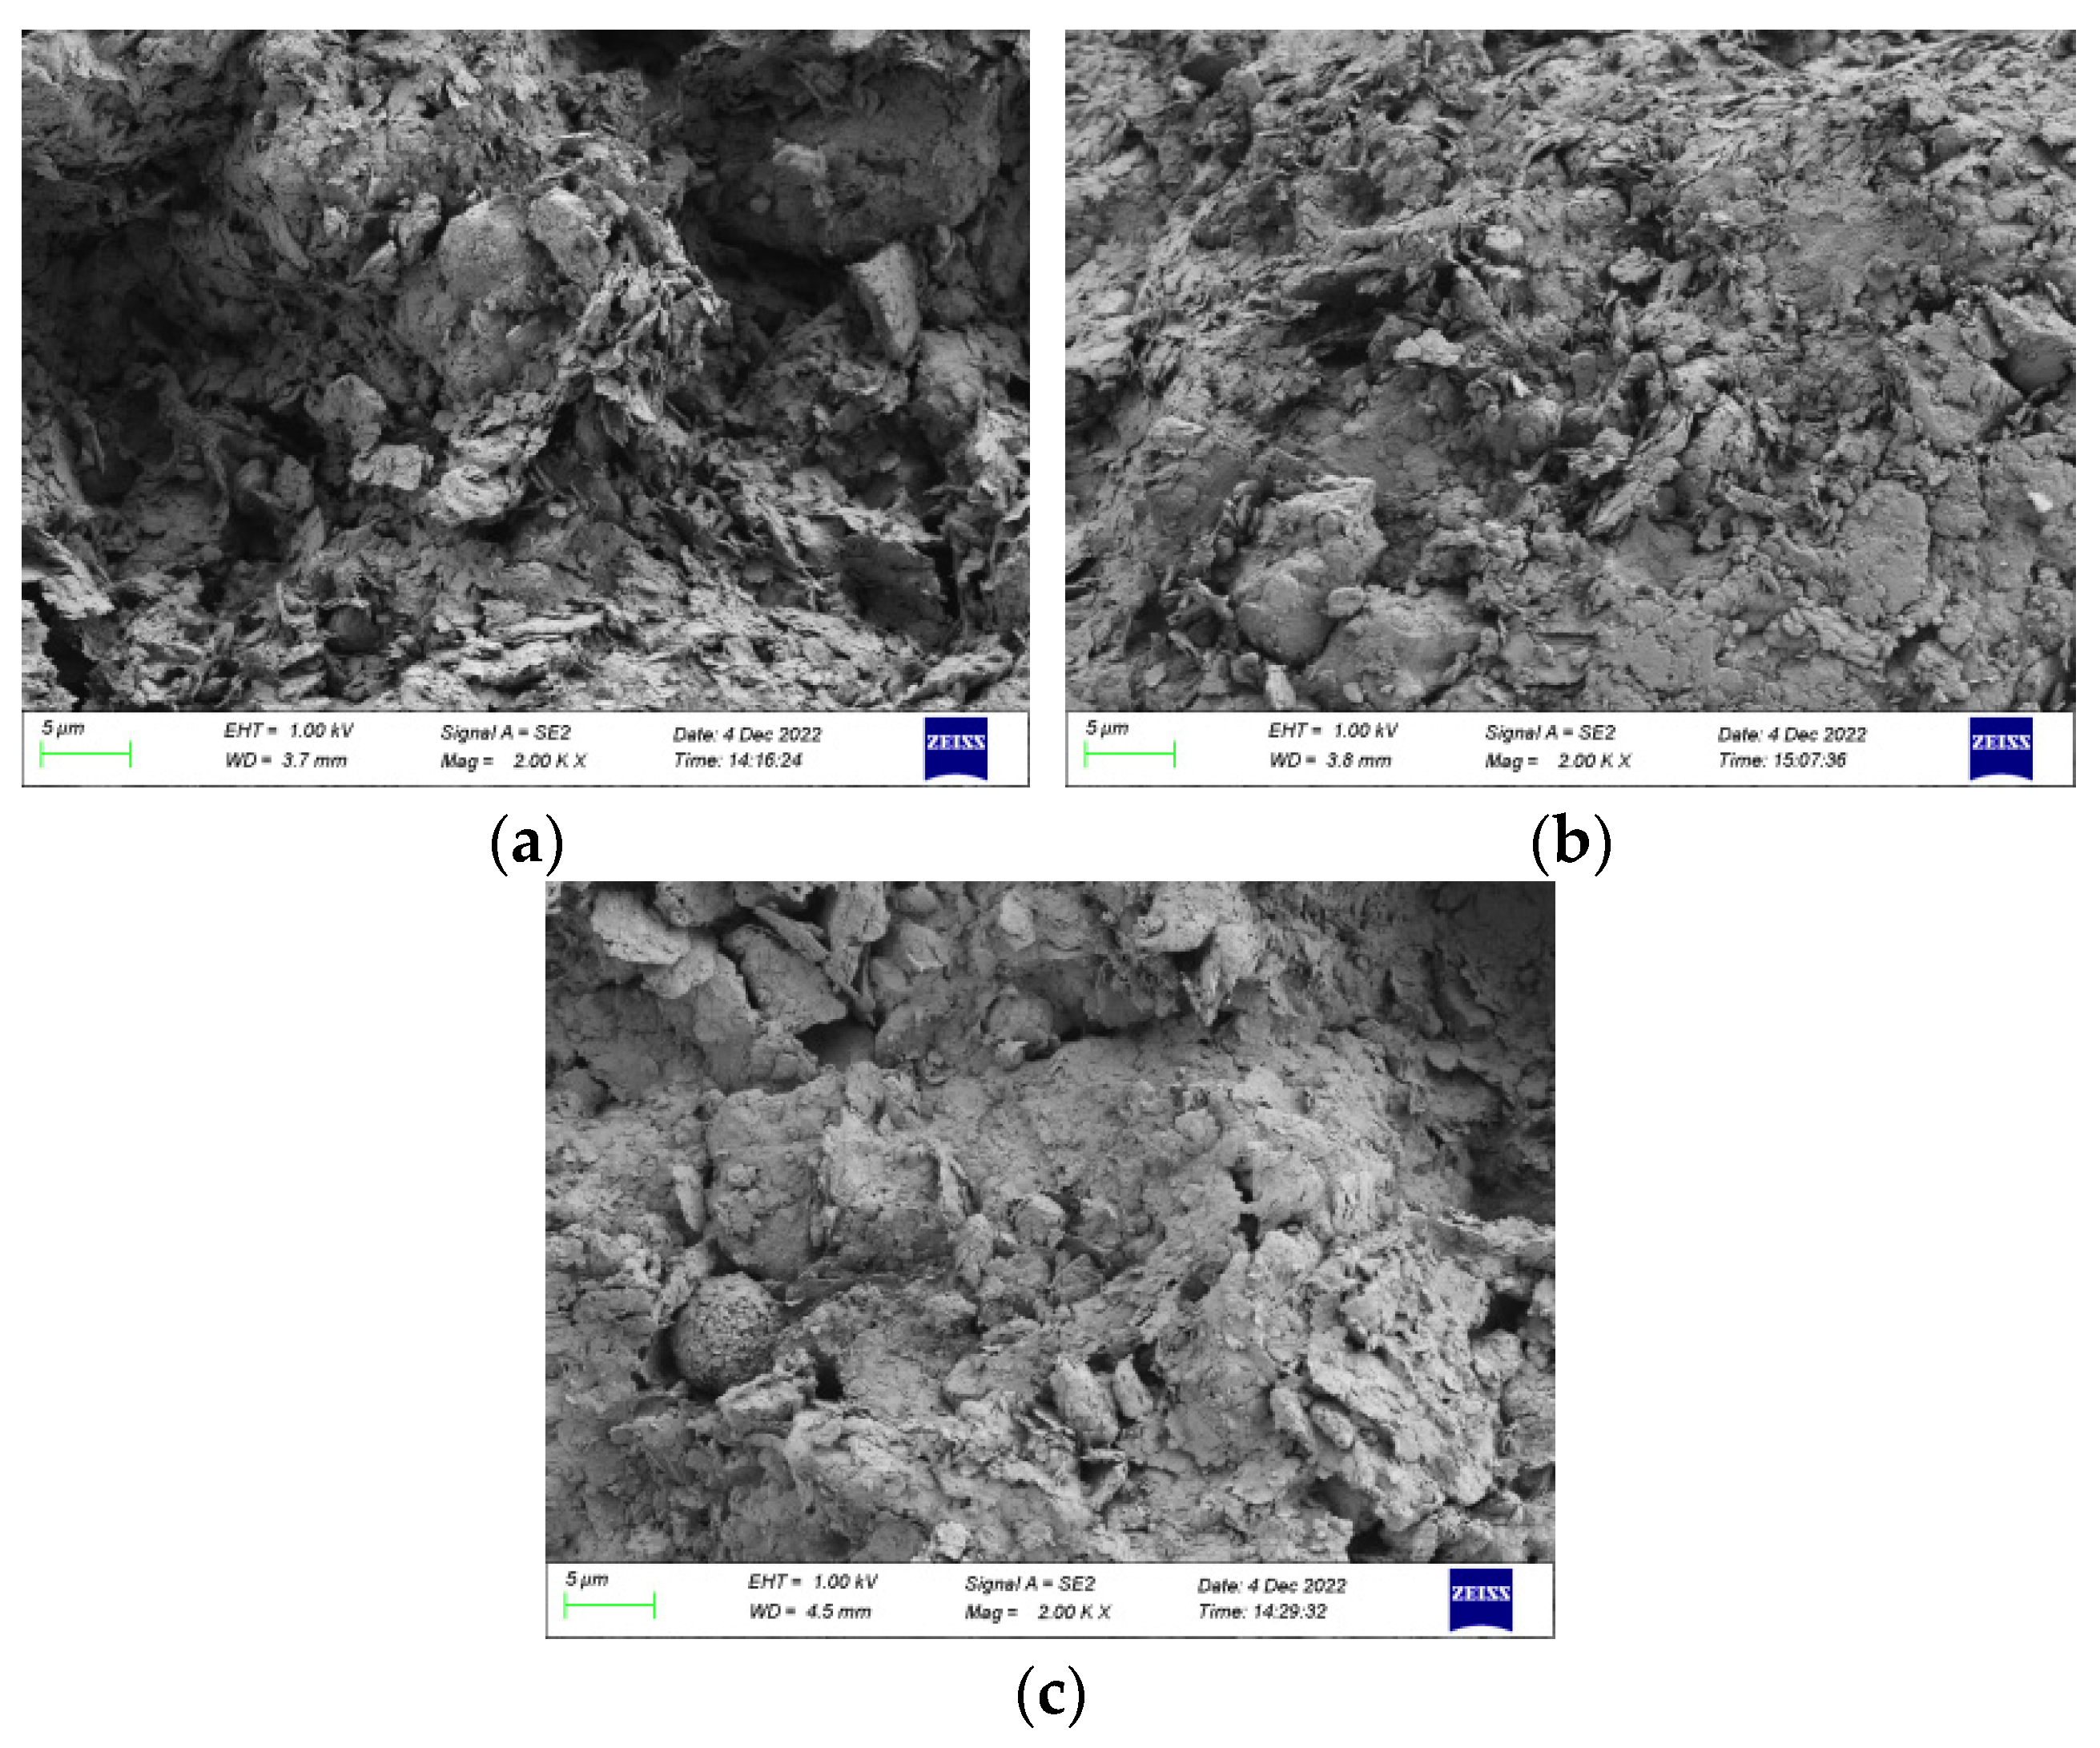
The test microstructure under different dry density degrees was observed by electron microscope scanning. The results are shown in Figure 12. With the increase in dry density degree, the number of soil particles per unit space increased, the number of pores decreased, and the structure was more compact. Therefore, after the same amount of time of water immersion, the position of the internal wetting peak of the sample with significant dry density was farther from the center of the sample.
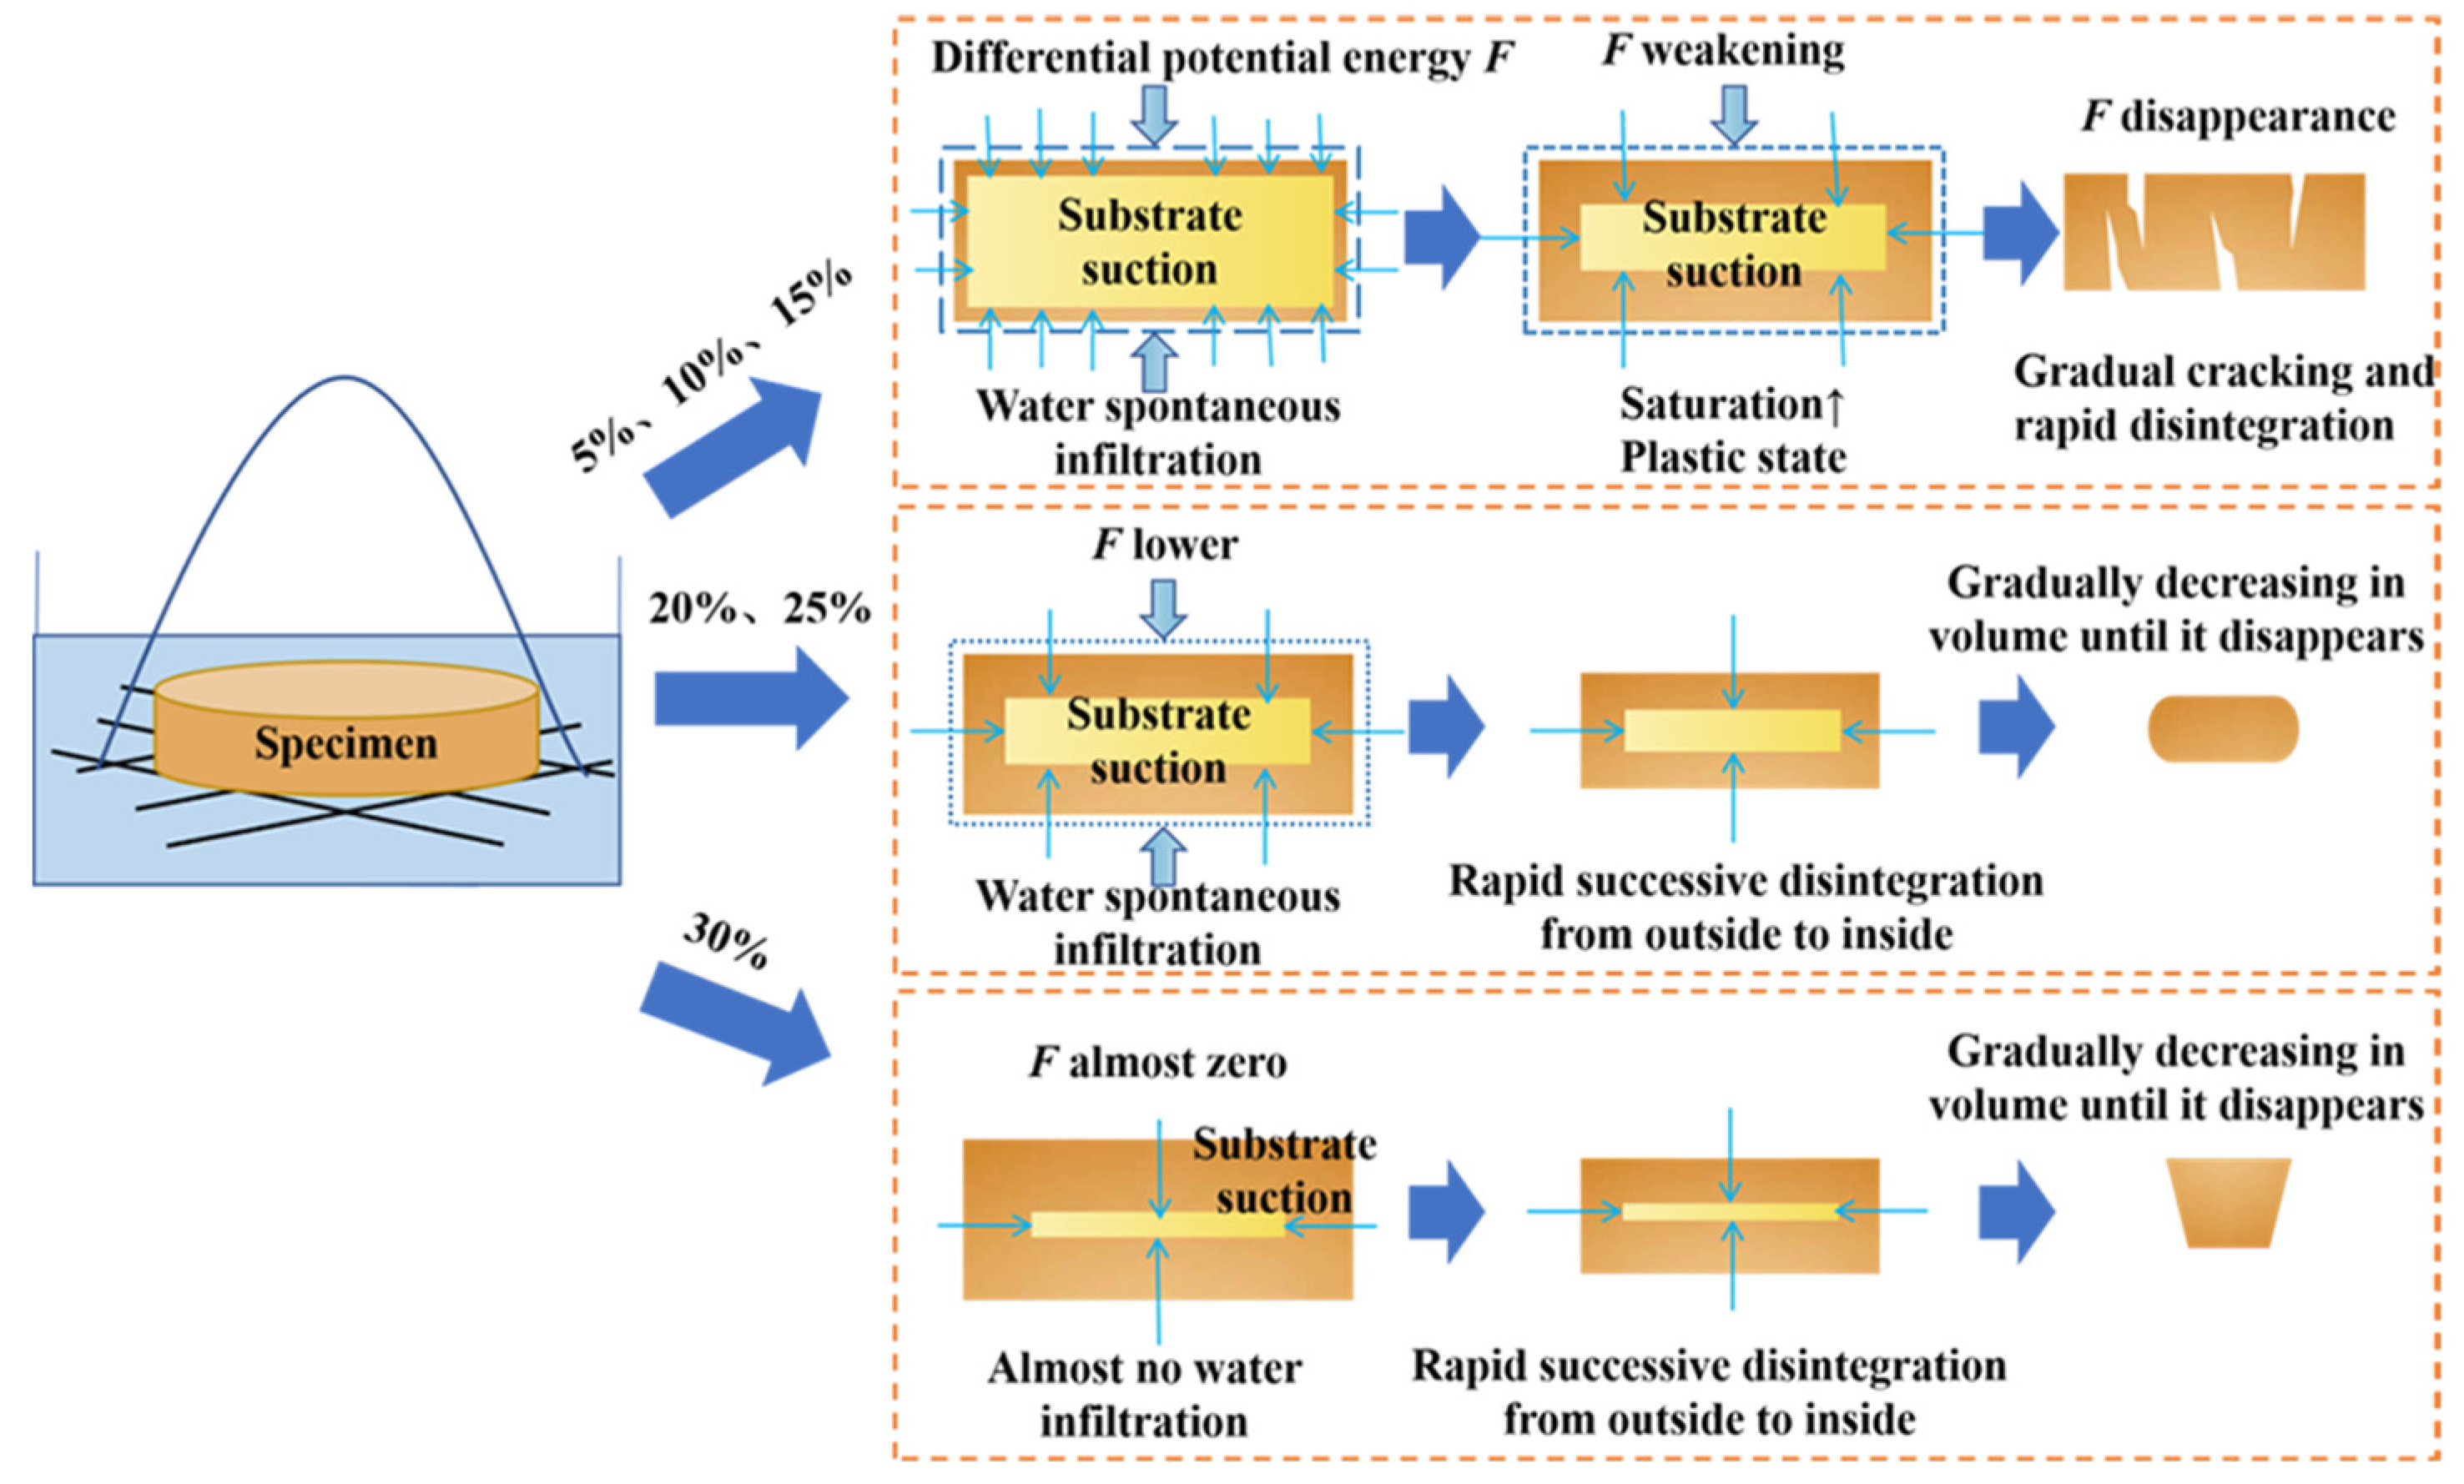
Second, increased capillary forces and substrate suction due to increased dry density, increasing the internal potential energy difference, will impede the water infiltration rate. The sample’s resistance to water infiltration and the pace of disintegration increased with the magnitude of the potential energy differential.
As can be seen from the mass time curve, the lower the test moisture content, the greater the percentage mass increment. The reason is that due to the existence of matrix suction, the lower the water content, the higher the matrix suction, the more significant the potential energy difference that exists, and the greater the suction of the sample’s interior to external moisture. As the water content increased, the sample matrix suction decreased, weakening the water absorption capacity. With the increase in disintegration time, the matrix suction continued to decrease. When a critical value was reached, the “restraining” force of the potential energy difference on the sample almost disappeared, and the sample underwent a continuous flaking phenomenon.
Second, the sample changed from its solid form to its plastic condition after being submerged in water. The sample remained plastic for a while at the beginning of water immersion. With the increase in water immersion time, the samples softened continuously. When the water content of the test reached a particular value, there was almost no cementing ability between the soil particles in the sample. The softened sample wedged into the metal mesh under gravity, causing cracking and sudden disintegration. The disintegration pattern of the samples under different water content conditions is shown in Figure 13.
According to the plasticity index, a water membrane has been adsorbed on the surface of the clay particles. This water membrane is free, weakly bound, and firmly bonded water. Clay particles, therefore, have high hydrophilicity. The clay particles adsorb the nearby water molecules during the sample disintegration, expanding their surfaces. The volume increases, the gravitational force weakens, and the cohesive strength decreases so that the clay structure is dispersed and the clay disintegrates. Gouy [27] and Chapman [28] proposed the diffusive bilayer theory in the early 20th century. It divides the hydrated ions into two layers: the adsorption layer (very thin, usually consisting of several layers of water molecules, also known as the firmly bound water layer) and the diffuse layer (thicker, with variable thickness, also known as the weakly bound water layer), as shown in Figure 14.
Two critical swelling stages comprise the entire disintegration process. The surface hydration swelling stage came first. It involved the close-range interaction of clay particles and water. At this point, water adsorbed onto clay particles, the water film was thicker, and the clay interlayer was thicker. The forces currently at work were the van der Waals force, the electrostatic gravitational force between the positive and negative charges of the layers, and the hydration energy between the water molecules and the layers. The next stage was the infiltration hydration swelling stage. Surface adsorption was no longer significant as the distance between clay layers increased. The double electric layer repulsion and osmotic pressure were the dominating forces. Clay layers were increasingly separated from one another. The number of cations in the interlayer was significantly higher than in the solution due to the soil particles’ extensive cation adsorption. A specific concentration differential was created, causing water molecules to constantly penetrate the soil sample’s interlayer and ultimately causing sample disintegration.

4.2. Permeation Properties

Figure 15 shows the SEM images of the soil particles after scanning and magnification by 1000 times in the states of 0 d and 20 d of water immersion. From Figure 15a, it can be seen that the soil shows the characteristics of large particles with many pores, with tiny substances attached to the soil particles and noticeable pores between the particles. In Figure 15b, the soil particles and pores are minor, and fine particles fill the inter-particle pores. Figure 15 shows that with the increase in water immersion days, the dissolution of cementing material occurred between soil particles, and the particles moved to fill the intergranular pore space. The intergranular structure also went from loose to compact.
It shows that in the soils with small density during soaking, the intergranular cementing material was dissolved with the increase in soaking time. The large and medium pores in the soils were gradually changed to small and medium pores after soaking. The dissolution of the intergranular cementing material led to structural changes affecting the permeability of the soils. The smaller the dry density, the more significant the change.

5. Conclusions

Long-term flooding of the embankment’s soil has caused partial or complete degradation of the soil structure at parts of the terrain’s naturally low slopes. This study’s test variables were the soil’s water content and dry density in the Nanjing Jiangxinzhou embankment. The disintegration and infiltration characteristics of the modified Jiangxinzhou embankment soil under hydrostatic immersion were investigated through indoor tests. The key findings are the following:
(1)
The pattern of the dry density effect on soil disintegration can be found in Figure 5. In Figure 12, with the rise of dry density, it can be observed that the number of soil particles per unit space of the sample increases, the number of pores decreases, and the structure becomes more compact. Furthermore, increased dry density leads to increased capillary force and matrix suction. The increase in potential energy difference will have a more significant hindering effect on water infiltration and the slower disintegration rate of the sample. Therefore, the disintegration rate decreases with increasing dry density for soil samples with the same water content.
(2)
Based on Figure 5a–c, when the water content was low, the water absorption of the sample was more significant than the disintegration amount due to the large matrix suction, and the sample gained weight for a short time. When the water content of the test reached a particular value, there was almost no cementing ability between the soil particles of the sample. The softened sample wedged into the metal mesh under gravity, causing cracking and sudden disintegration. Moreover, there is a threshold water content of around 20%, and it is assumed that the disintegration pattern of the soil may be significantly different depending on the optimum moisture content. The effect of moisture content on the disintegration of the samples was more significant.
(3)
The results of the indoor test showed that there were three main disintegration modes of the samples. When the water content was low, including 5%, 10%, and 15%, the disintegration process mainly showed a weight gain disintegration mode (Figure 8). The samples showed continuous and rapid disintegration when the water content rose to 20% and 25% (Figure 9). The samples showed a constant and stable disintegration when the water content was up to 30% (Figure 10). This phenomenon was independent of the dry density of the samples. The disintegration pattern of the samples under different water content conditions is shown in Figure 13.
(4)
Infiltration significantly affects the soil’s permeability. After 20 days of immersion, the degree of change in the permeability coefficient weakens as the dry density increases. With the increase in water immersion days, the dissolution of cementing material between soil particles occurs and the particles move to fill the intergranular pore space. The result of pore structure reduction can better explain the phenomenon of soil permeability decreasing with the increase in immersion time.
(5)
The disintegration characteristics of soil are affected by many factors, such as initial water content, dry density, temperature, dry and wet cycles, and immersion height. In this paper, only two factors, initial water content and dry density, are considered. Future research can consider the comprehensive influence of multiple factors on the disintegration characteristics. This paper’s comparative analysis of microstructure before and after immersion reveals the microscopic mechanism of permeability change. Therefore, the use of other advanced scientific techniques needs to be considered to achieve further revelation of the microstructural evolution patterns during the permeation process. The current study is mainly an indoor experiment, which needs to be better integrated with the actual problems in the field, and the research scale should be enlarged to combine with the actual engineering problems.

Author Contributions

Conceptualization, K.Z. and D.F.; Data curation, K.Z.; Formal analysis, K.Z. and D.F.; Funding acquisition, D.F.; Investigation, K.Z. and D.F.; Methodology, K.Z.; Writing— original draft, K.Z. and D.F.; Writing—review and editing, K.Z. and D.F. All authors have read and agreed to the published version of the manuscript.

Funding

The authors appreciate the financial support from the National Natural Science Foundation of China Joint Fund Key Project (Grant No. U2240210, 52179100).

Institutional Review Board Statement

Not applicable.

Informed Consent Statement

Not applicable.

Data Availability Statement

All data included in this study are available upon request by contact with the corresponding author.

Conflicts of Interest

The authors declare no conflict of interest.

References

  1. Qi, Y.-Z.; Jiang, P.-M.; Liu, X.-Y.; Zhang, Y.-L.; Qiu, W.-R.; Wang, T.-G.; Zha, W.-J. Influences of soil disintegration in water on slope stability. Chin. J. Geotech. Eng. 2020, 42, 214–218. (In Chinese) [Google Scholar] [CrossRef]
  2. Ben-Hur, M.; Lado, M. Effect of soil wetting conditions on seal formation, runoff, and soil loss in arid and semiarid soils—A review. Soil. Res. 2008, 46, 191–202. [Google Scholar] [CrossRef]
  3. Tang, D.; Liu, Y.; Zhang, W. Engineering Geotechnics; Geological Press: Beijing, China, 1999. (In Chinese) [Google Scholar]
  4. GB/T50123-2019; Standard for Geotechnical Test Methods. Ministry of Housing and Urban-Rural Development of the People’s Republic of China: Beijing, China, 2019. (In Chinese)
  5. Zhou, H.; Li, H. Soil Disintegration Characteristics of Collapsed Walls and Influencing Factors in Southern China. Open Geosci. 2018, 10, 797–806. [Google Scholar] [CrossRef]
  6. Qi, Y.; Guan, Y.; Wang, L.; Jiang, P.; Zhang, G. The Influence of Soil Disintegration in Water on SlopeInstability and Failure. Adv. Civ. Eng. 2020, 2020, 8898240. [Google Scholar] [CrossRef]
  7. Zhang, D.; Chen, A.; Liu, G. Laboratory investigation of disintegration characteristics of purple mudstone under different hydrothermal conditions. J. Mt. Sci. 2012, 9, 127–136. [Google Scholar] [CrossRef]
  8. Luo, X.; Gao, H.; He, P.; Liu, W. Experimental investigation of dry density, initial moisture content, and temperature for granite residual soil disintegration. Arab. J. Geosci. 2021, 14, 1060. [Google Scholar] [CrossRef]
  9. Li, C.; Kong, L.; Shu, R.; An, R.; Zhang, X. Disintegration characteristics in granite residual soil and their relationship with the collapsing gully in South China. Open Geosci. 2020, 12, 1116–1126. [Google Scholar] [CrossRef]
  10. Wang, N.Q.; Wang, Q.T.; Xue, Q.; Liu, X.L. Experimental study of static disintegration on unsaturated soil. Appl. Mech. Mater. 2014, 580–583, 68–72. [Google Scholar] [CrossRef]
  11. Zhou, X.; Liu, P.; Lan, Z. Experimental study on disintegration behavior of granite residual soil. In Advances in Transportation Geotechnics and Materials for Sustainable Infrastructure; ASCE: Reston, VA, USA, 2014; pp. 98–104. [Google Scholar] [CrossRef]
  12. Li, X.-A.; Wang, L.; Yan, Y.-L.; Hong, B.; Li, L.-C. Experimental study on the disintegration of loess in the Loess Plateau of China. Bull. Eng. Geol. Environ. 2018, 78, 4907–4918. [Google Scholar] [CrossRef]
  13. Ze, Z.; Vadim, P.; Svetlana, N.; Zhongqiong, Z.; Junjie, W. Disintegration characteristics of a cryolithogenic clay loam with different water content: Moscow covering loam (prQIII), case study. Eng. Geol. 2019, 258, 105159. [Google Scholar] [CrossRef]
  14. Zhang, X.W.; Kong, L.W.; Li, J.J. Influence of dry and wet seasons on disintegration characteristics of basalt residual soil from the Leizhou Peninsula, China. Q. J. Eng. Geol. Hydrogeol. 2018, 51, 450–460. [Google Scholar] [CrossRef]
  15. Tsai, T.-L.; Jang, W.-S. Deformation effects of porosity variation on soil consolidation caused by groundwater table decline. Environ. Earth Sci. 2014, 72, 829–838. [Google Scholar] [CrossRef]
  16. Kwon, Y. Geotechnical hybrid simulation to investigate the effects of the hydraulic conductivity on one-dimensional consolidation settlement. Mar. Georesour. Geotec. 2016, 34, 219–233. [Google Scholar] [CrossRef]
  17. Liao, H.; Ji, J.; Zeng, J. Stability analysis of soil slopes considering saturated-unsaturated seepage action. Geotech Nical Eng. 2008, 29, 3229–3234. (In Chinese) [Google Scholar] [CrossRef]
  18. Tan, X.; Xue, W.; Sara, K. Seepage analysis of earth dams considering spatial variability of hydraulic parameters. Eng. Geol. 2017, 228, 260–269. [Google Scholar] [CrossRef]
  19. Cai, G.; Zhou, A.; Sheng, D. Permeability function for unsaturated soils with different initial densities. Can. Geotech. J. 2014, 51, 1456–1467. [Google Scholar] [CrossRef]
  20. Ma, Y.; Chen, W.; Bi, J.; Guo, G.; Jiao, G. Guide Effect of dry density on the coefficient of permeability of loess. J. Geotech. Eng. 2018, 40, 165–170. (In Chinese) [Google Scholar]
  21. Xu, P.; Zhang, Q.; Hui, Q.; Qu, W.; Li, M. Microstructure and permeability evolution of remolded loess with different dry densities under saturated seepage. Eng. Geol. 2021, 282, 105875. [Google Scholar] [CrossRef]
  22. Xia, Z.; Zhang, L.; Niu, P.; Liang, Y.; Hu, W.; Xu, W. Effect of dry density initial moisture content slope on disintegration characteristics of purple soils. Chin. Soil. Water Conserve. Sci. 2017, 15, 121–127. (In Chinese) [Google Scholar] [CrossRef]
  23. Gao, C.; Du, G.; Zhuang, Z.; Zeng, B.; Chen, X.; Cheng, F. Disintegration characteristics of collapsible loess after vibration compaction. Proc. Inst. Civ. Eng. Geotech. Eng. 2021, 176, 86–98. [Google Scholar] [CrossRef]
  24. Li, X.; Huang, R.; Peng, J. Experimental study on the disintegration of loess. J. Rock. Mech. Eng. 2009, 28, 3207–3213. (In Chinese) [Google Scholar] [CrossRef]
  25. Wang, J.; Gu, T.; Zhang, M.; Xu, Y.; Kong, J. Experimental study of loess disintegration characteristics. Earth Surf. Process. Landf. 2019, 44, 1317–1329. [Google Scholar] [CrossRef]
  26. Gao, Y.; Qian, H.; Yang, J.; Feng, J.; Huo, J. Indoor experimental study on the permeability of remodeled Malan loess. South North Water Divers. Water Sci. Technol. 2016, 14, 130–136. (In Chinese) [Google Scholar] [CrossRef]
  27. Gouy, M. Sur la constitution de la charge électrique à la surface d’un électrolyte. J. Phys. Theor. Appl. 1910, 9, 457–468. [Google Scholar] [CrossRef]
  28. Chapman, D.L. A contribution to the theory of electrocapillarity. Philos. Mag. 1913, 25, 475–481. [Google Scholar] [CrossRef]
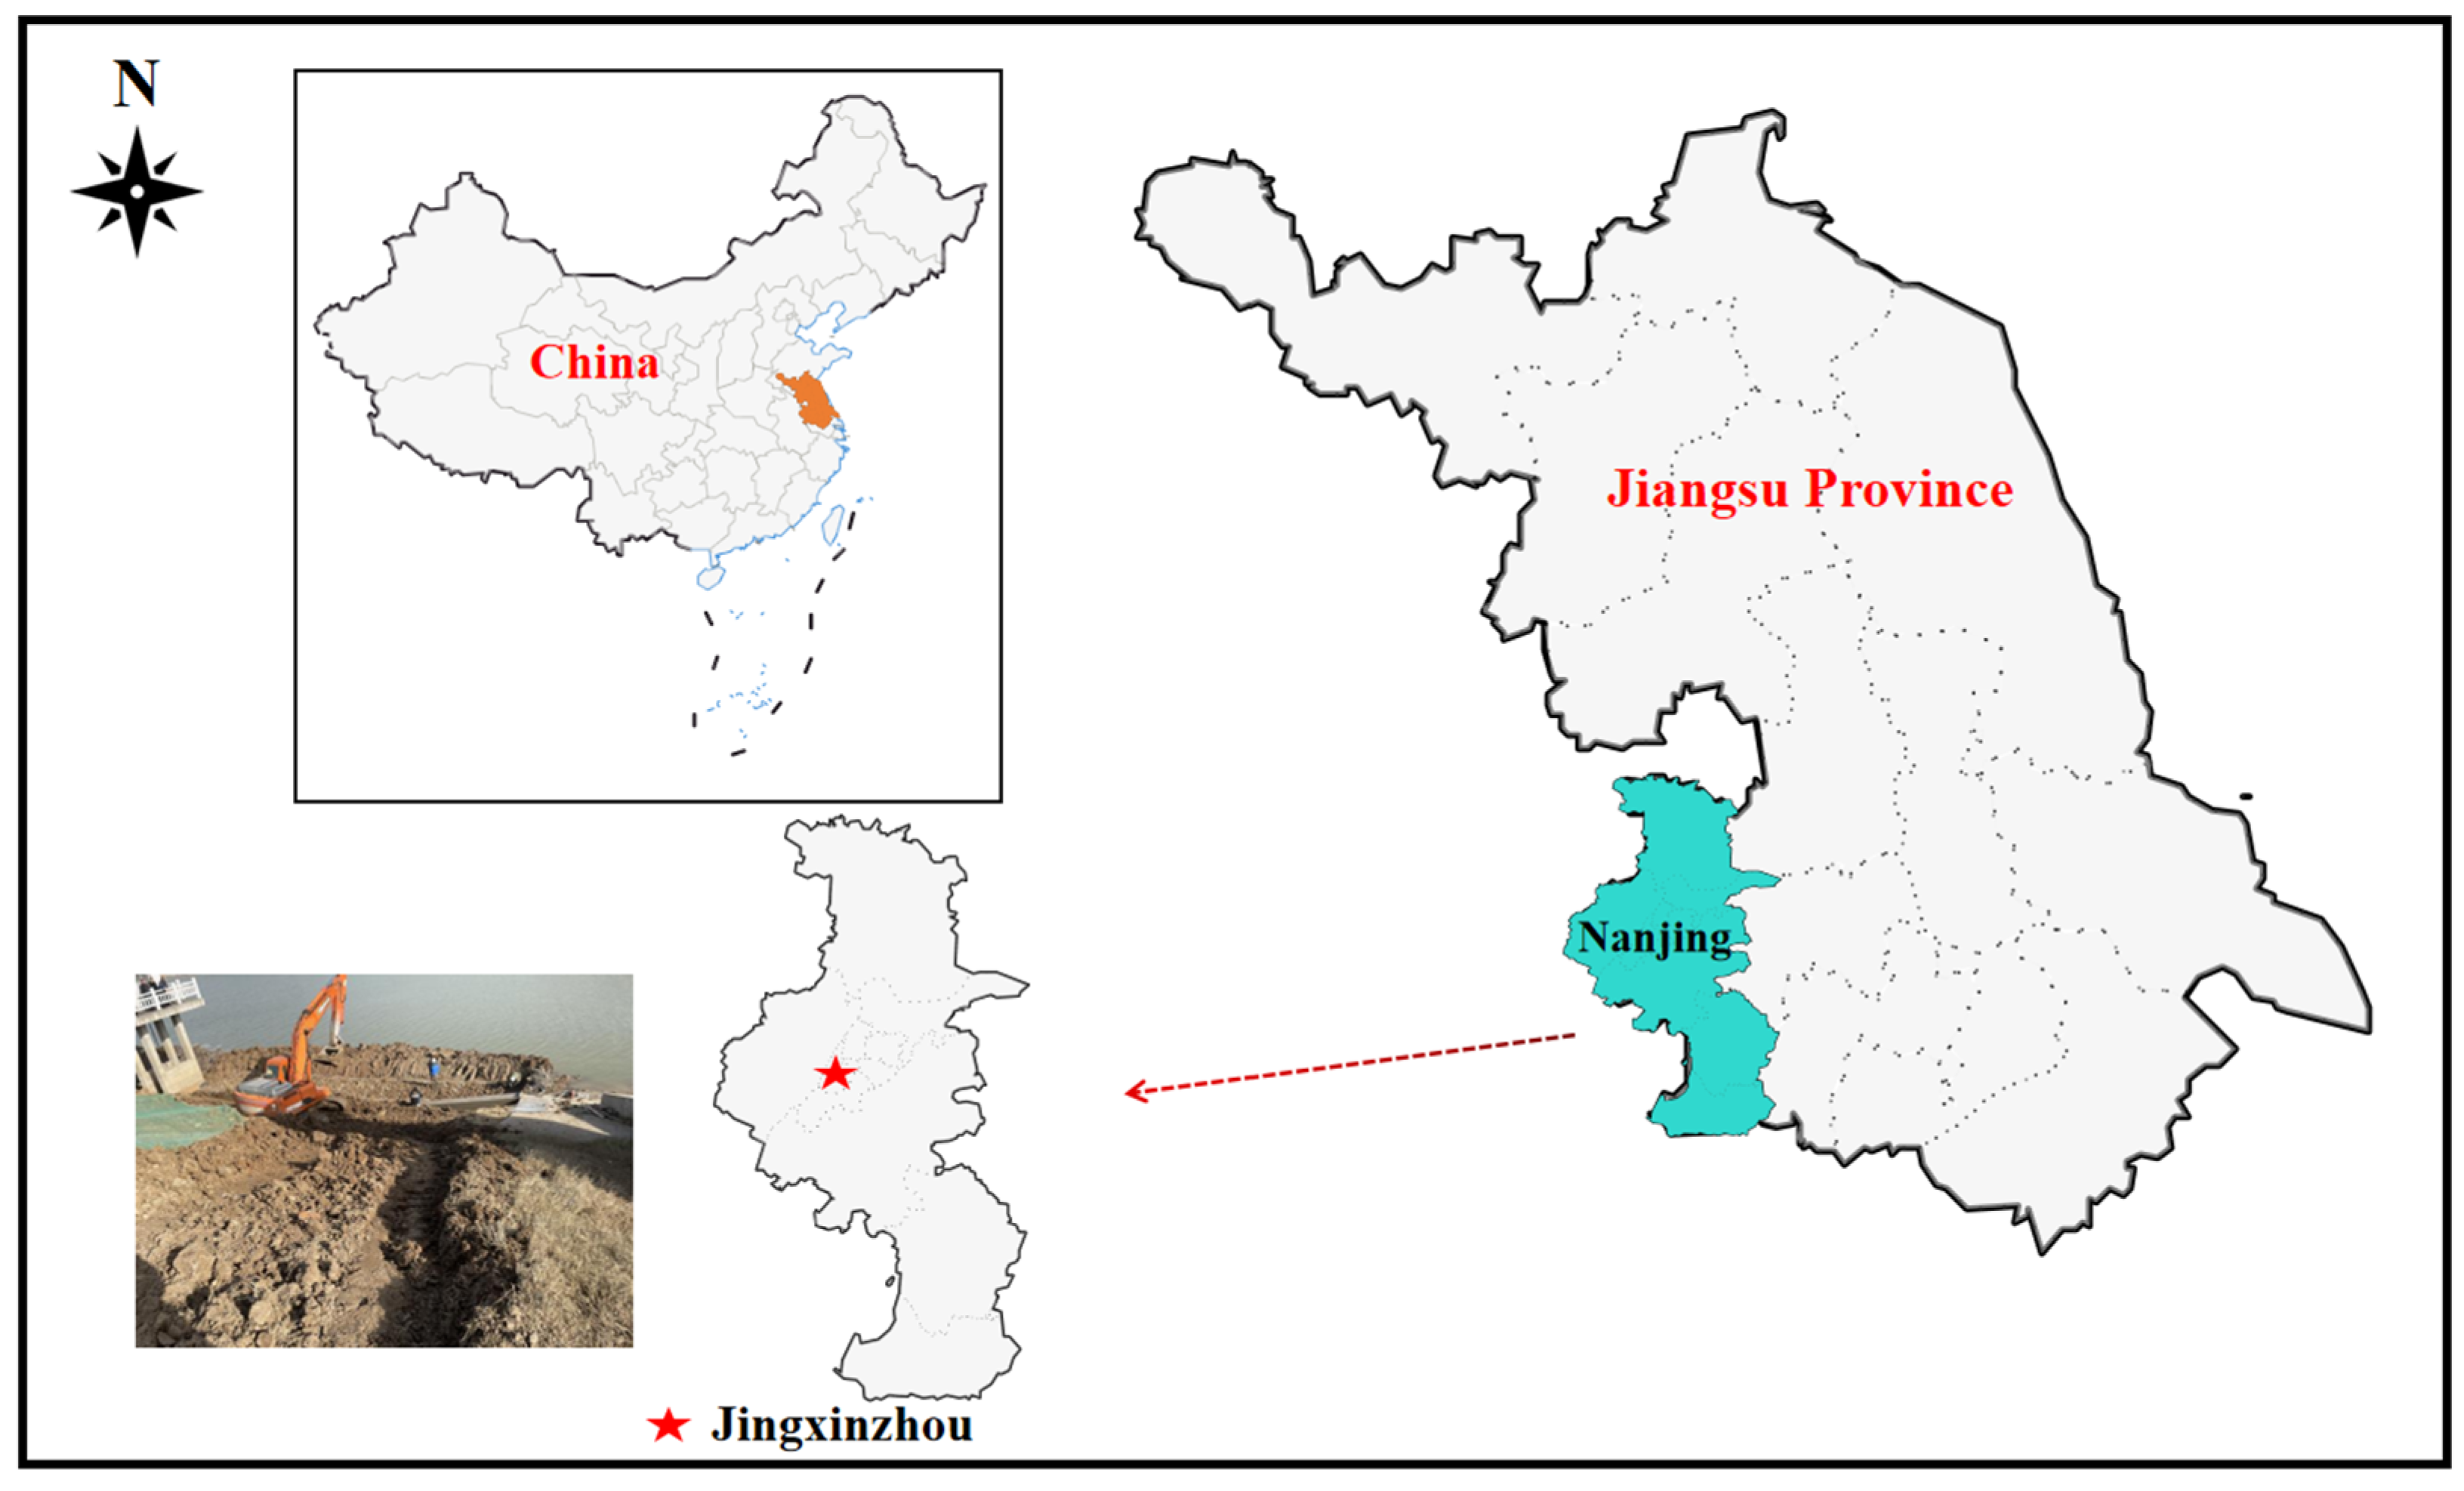
Figure 1. Sampling site in Nanjing, China.
Applsci 13 09819 g001
Figure 2. Disintegration test device.
Applsci 13 09819 g002
Figure 3. Calculation of the average disintegration rate.
Applsci 13 09819 g003
Figure 4. Schematic diagram of penetration test instrument.
Applsci 13 09819 g004
Figure 5. Time course curve of sample mass change for each working condition. (a) Water content 5%; (b) Water content 10%; (c) Water content 15%; (d) Water content 20%; (e) Water content 25%; (f) Water content 30%.
Applsci 13 09819 g005
Figure 6. Variation of complete disintegration time with different water content and dry density degree.
Applsci 13 09819 g006
Figure 7. The average disintegration rate of samples under each working condition. (a) different water content; (b) different dry density.
Applsci 13 09819 g007
Figure 8. Morphological evolution of weight gain−disintegration modes.
Applsci 13 09819 g008
Figure 9. Morphological evolution of the sustained rapid disintegration mode.
Applsci 13 09819 g009
Figure 10. Morphological evolution of continuous stable disintegration mode.
Applsci 13 09819 g010
Figure 11. Permeability coefficient versus dry density fitting curve. (a) 0 d permeability coefficient; (b) Average permeability coefficient; (c) Permeability coefficient after 20 d immersion.
Applsci 13 09819 g011
Figure 12. SEM results of the test at different dry density levels. (a) 1.4 g/cm3; (b) 1.5 g/cm3; (c) 1.6 g/cm3.
Applsci 13 09819 g012
Figure 13. Schematic diagram of the disintegration pattern of samples with different water content conditions.
Applsci 13 09819 g013
Figure 14. Schematic diagram of water film on the surface of clay particles.
Applsci 13 09819 g014
Figure 15. SEM results of the test at different immersion days. (a) 0 d; (b) 20 d.
Applsci 13 09819 g015
Table 1. Basic physical characteristics.
Specific Gravity GsMaximum Dry DensityOptimum Water ContentLiquid Limit wLPlastic Limit wpPlasticity Index Ip
2.721.68g/cm319.86%39.17%19.48%19.69
Table 2. Experimental schemes.
Experiment No.Water Content (%)Dry Density (g/cm3)
1–351.4, 1.5, 1.6
4–610
7–915
10–1220
13–1525
16–1830
Table 3. Permeability Coefficient Indicator.
Permeability Coefficient IndicatorDry Density (g/cm3)
1.251.31.351.41.451.51.551.6
K s (cm/s)8.51 × 10−55.55 × 10−53.15 × 10−51.26 × 10−59.17 × 10−65.16 × 10−62.52 × 10−64.41 × 10−7
K f (cm/s)1.79 × 10−51.17 × 10−51.81 × 10−59.34 × 10−67.71 × 10−64.72 × 10−62.37 × 10−64.17 × 10−7
Δ K (cm/s)−6.72 × 10−5−4.38 × 10⁻⁵−1.34 × 10⁻⁵−3.26 × 10⁻⁶−1.45 × 10⁻⁶−4.40 × 10⁻⁷−1.50 × 10⁻⁷−2.40 × 10⁻⁸
δ K (cm/s)−78.97%−78.92%−42.54%−25.87%−15.83%−8.53%−5.95%−5.44%
Disclaimer/Publisher’s Note: The statements, opinions and data contained in all publications are solely those of the individual author(s) and contributor(s) and not of MDPI and/or the editor(s). MDPI and/or the editor(s) disclaim responsibility for any injury to people or property resulting from any ideas, methods, instructions or products referred to in the content.