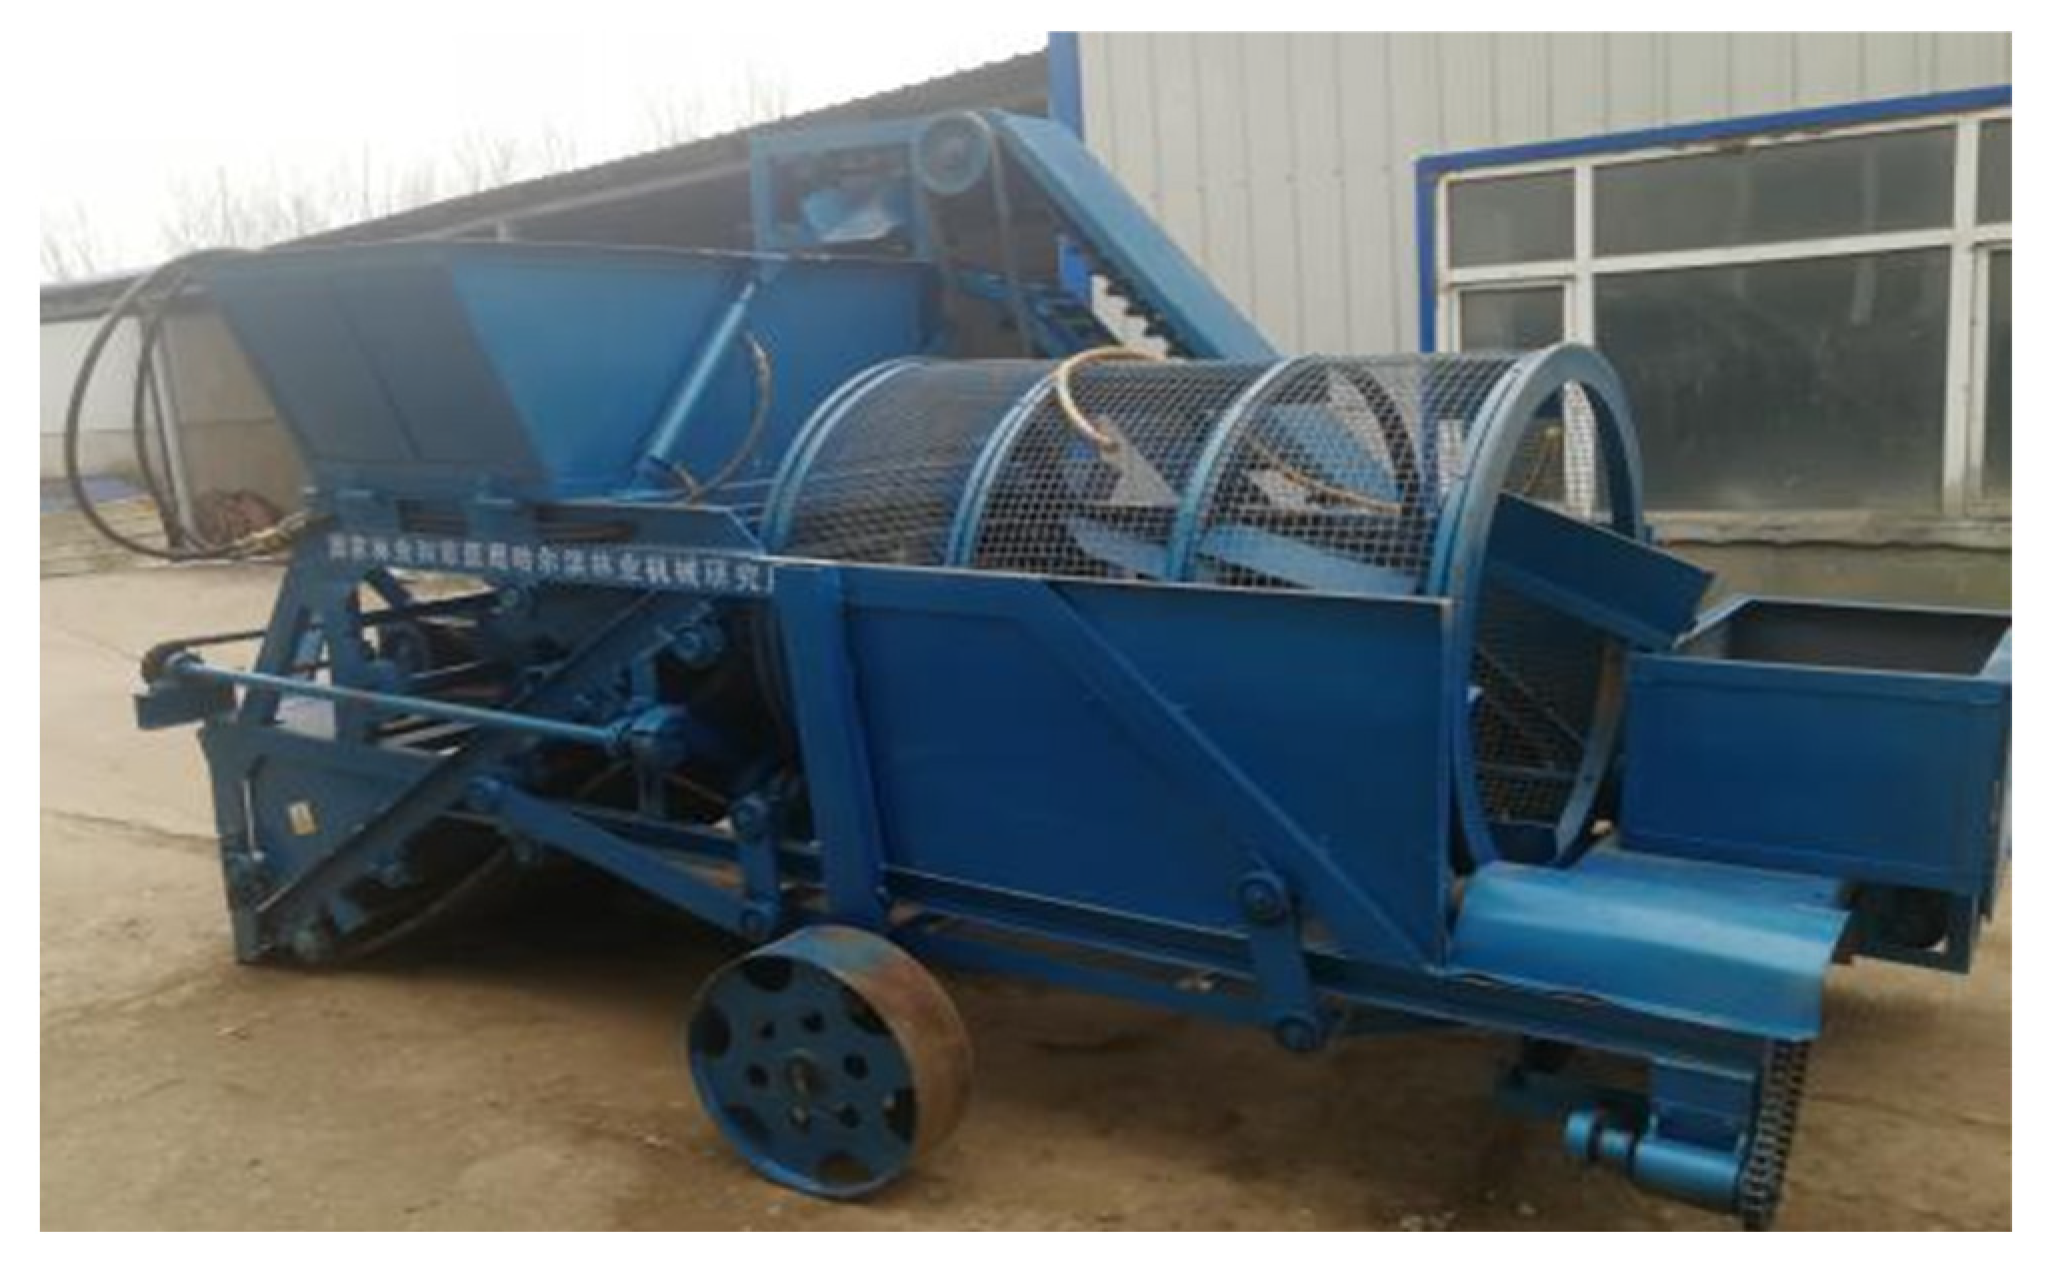
Figure 1.
The 4QPB-1201 Fritilariae ussuriensis maxim harvester.
Figure 1.
The 4QPB-1201 Fritilariae ussuriensis maxim harvester.
Figure 2.
Integral mechanism of Fritilariae ussuriensis maxim digging device: 1, excavator shovel mechanism; 2, bulldozer shovel mechanism; 3, clay cutter mechanism.
Figure 2.
Integral mechanism of Fritilariae ussuriensis maxim digging device: 1, excavator shovel mechanism; 2, bulldozer shovel mechanism; 3, clay cutter mechanism.
Figure 3.
Digging shovel mechanism: 1, extension fence bar; 2, second-order shovel blade; 3, bearings; 4, first-order shovel rest; 5, first-order shovel blade; 6, hydraulic motor; 7, slider linkage mechanism; 8, bearing housing.
Figure 3.
Digging shovel mechanism: 1, extension fence bar; 2, second-order shovel blade; 3, bearings; 4, first-order shovel rest; 5, first-order shovel blade; 6, hydraulic motor; 7, slider linkage mechanism; 8, bearing housing.
Figure 4.
Bulldozer shovel mechanism: 1, hydraulic cylinder; 2, SBR slide rail; 3, locking lever; 4, slide rail; 5, connecting rod; 6, bulldozer shovel body.
Figure 4.
Bulldozer shovel mechanism: 1, hydraulic cylinder; 2, SBR slide rail; 3, locking lever; 4, slide rail; 5, connecting rod; 6, bulldozer shovel body.
Figure 5.
Surface force analysis of shovel body.
Figure 5.
Surface force analysis of shovel body.
Figure 6.
Load application.
Figure 6.
Load application.
Figure 7.
Total deformation cloud map.
Figure 7.
Total deformation cloud map.
Figure 8.
Elastic deformation cloud.
Figure 8.
Elastic deformation cloud.
Figure 9.
Equivalent effect force cloud.
Figure 9.
Equivalent effect force cloud.
Figure 10.
Static simulation analysis of bulldozer.
Figure 10.
Static simulation analysis of bulldozer.
Figure 11.
Field experiment of improved prototype.
Figure 11.
Field experiment of improved prototype.
Figure 12.
Plant discrete element model.
Figure 12.
Plant discrete element model.
Figure 13.
Agglomeration–shovel system model.
Figure 13.
Agglomeration–shovel system model.
Figure 14.
Test bench design and physical drawing.
Figure 14.
Test bench design and physical drawing.
Figure 15.
Model reliability analysis validation curve.
Figure 15.
Model reliability analysis validation curve.
Figure 16.
Velocity vector diagram of aggregate particles at different operating speeds.
Figure 16.
Velocity vector diagram of aggregate particles at different operating speeds.
Figure 17.
Figure of granular conical cones of aggregates at different shovel dip angles.
Figure 17.
Figure of granular conical cones of aggregates at different shovel dip angles.
Figure 18.
Changes in aggregate particle trajectories under different excavation depths.
Figure 18.
Changes in aggregate particle trajectories under different excavation depths.
Figure 19.
Evaluation diagram of regression fitting model.
Figure 19.
Evaluation diagram of regression fitting model.
Figure 20.
Three−dimensional response surface diagram of excavation resistance.
Figure 20.
Three−dimensional response surface diagram of excavation resistance.
Table 1.
Parameters table of shovel blade.
Table 1.
Parameters table of shovel blade.
| Parameters | Numerical Value | Parameters | Numerical Value |
|---|
| First-order shovel blade digging depth | 180 mm | Second-order shovel blade digging depth | 90 mm |
| First-order shovel blade working width | 140 mm | Second-order shovel blade working width | 68 mm |
| Digging resistance F1 | 1260 N | Digging resistance F2 | 306 N |
Table 2.
Field test results.
Table 2.
Field test results.
| Blade Penetration Angle α (°) | Excavation Depth (mm) | Net Recovery Rate (%) | Damage Rate (%) | Soil Content (%) | Recovery Efficiency (hm2·h−1) |
|---|
| 20 | 82 | 93.5 | 5.6 | 12.9 | 0.15 |
| 25 | 101 | 97.6 | 3.9 | 15.3 | 0.13 |
| 30 | 120 | 99.2 | 1.2 | 18.6 | 0.10 |
Table 3.
Percentage of particles in soil samples.
Table 3.
Percentage of particles in soil samples.
| Particle Diameter | Numerical Value |
|---|
| ≥2 mm | 18.66% |
| >1~2 mm | 23.05% |
| >0.1~1 mm | 48.36% |
| ≤0.1 mm | 9.93% |
Table 4.
Parameter table of EDEM soil particle model.
Table 4.
Parameter table of EDEM soil particle model.
| Particle Model | -- | Physical Radius | Contact Radius | Particle Ratio |
|---|
| Single-ball pellet | -- | 3.5 | 3.5 | 10 |
| Double-ball pellet | Particle 1 | 3.5 | 3.5 | 48 |
| Particle 2 | 3.5 | 3.5 |
| Three-ball pellets | Particle 1 | 3.5 | 3.5 | 23 |
| Particle 2 | 3.5 | 3.5 |
| Particle 3 | 3.5 | 3.5 |
| Four-ball pellet | Particle 1 | 3.5 | 3.5 | 19 |
| Particle 2 | 3.5 | 3.5 |
| Particle 3 | 3.5 | 3.5 |
| Particle 4 | 3.5 | 3.5 |
Table 5.
Parameters of soil-Fritillaria bulb-root aggregate model.
Table 5.
Parameters of soil-Fritillaria bulb-root aggregate model.
| Model Parameters | Numerical Value |
|---|
| Soil density (g/cm3) | 1.590 |
| Soil Poisson’s ratio | 0.35 |
| Soil shear modulus (Pa) | 1.1 × 10⁶ |
| Soil–soil recovery coefficient | 0.8 |
| Soil–soil static friction coefficient | 0.89 |
| Soil–soil kinetic friction coefficient | 0.2 |
| Soil–soil kinetic friction coefficient (g/cm3) | 1.070 |
| Poisson’s ratio of roots | 0.5 |
| Root shear modulus (Pa) | 1 × 10⁶ |
| Root–root recovery coefficient | 0.8 |
| Root–root static friction coefficient | 0.8 |
| Root–root dynamic friction coefficient | 0.8 |
| Root–soil recovery coefficient | 0.1 |
| Root–soil static friction coefficient | 0.4 |
| Root–soil dynamic friction coefficient | 0.01 |
| Root–65 Mn recovery factor | 0.4 |
| Root–65 Mn static friction coefficient | 0.5 |
| Root–65 Mn dynamic friction coefficient | 0.01 |
| 65 Mn material density (g/cm3) | 7.81 |
| Soil density (g/cm3) | 1.590 |
| Soil–65 Mn recovery factor | 0.2 |
| Soil–65 Mn static friction coefficient | 0.65 |
| Soil–65 Mn dynamic friction coefficient | 0.15 |
| Fritillaria ussuriensis maxim’s density (g/cm3) | 2.500 |
| Poisson’s ratio of fritillaria ussuriensis maxim | 0.25 |
| Shear modulus of fritillaria ussuriensis maxim (Pa) | 1 × 10⁷ |
| FUM’s bulb–FUM’s bulb recovery factor | 0.3 |
| FUM’s bulb–FUM’s bulb static friction coefficient | 0.4 |
| FUM’s bulb–FUM’s bulb kinetic friction Coefficient | 0.04 |
| FUM’s bulb–65 Mn recovery coefficient | 0.72 |
| FUM’s bulb–65 Mn static friction coefficient | 0.56 |
| FUM’s bulb–65 Mn dynamic friction coefficient | 0.16 |
| FUM’s bulb–root recovery coefficient | 0.2 |
| FUM’s bulb–root static friction coefficient | 0.4 |
| FUM’s bulb–root dynamic friction coefficient | 0.1 |
| FUM’s bulb–soil recovery coefficient | 0.16 |
| FUM’s bulb–soil static friction coefficient | 0.5 |
| FUM’s bulb–soil dynamic friction coefficient | 0.01 |
| 65 Mn material shear modulus (Pa) | 8.19 × 10¹⁰ |
Table 6.
Orthogonal test factor level table.
Table 6.
Orthogonal test factor level table.
| Level | Operating Speed A (m/s) | Shovel Surface Inclination B (°) | Digging Depth C (mm) |
|---|
| 1 | 0.3 | 20 | 100 |
| 2 | 0.4 | 25 | 120 |
| 3 | 0.5 | 30 | 140 |
Table 7.
Orthogonal experimental design.
Table 7.
Orthogonal experimental design.
| Serial Number | Operating Speed A (m/s) | Shovel Surface Inclination B (°) | Digging Depth
C (mm) | Excavation Resistance F (N) |
|---|
| 1 | 0.3 | 20 | 100 | 217.94 |
| 2 | 0.3 | 25 | 120 | 330.92 |
| 3 | 0.3 | 30 | 140 | 428.4 |
| 4 | 0.4 | 20 | 120 | 279.82 |
| 5 | 0.4 | 25 | 140 | 408.86 |
| 6 | 0.4 | 30 | 100 | 410.51 |
| 7 | 0.5 | 20 | 140 | 305.64 |
| 8 | 0.5 | 25 | 100 | 327.09 |
| 9 | 0.5 | 30 | 120 | 406.16 |
Table 8.
Range analysis of orthogonal test.
Table 8.
Range analysis of orthogonal test.
| Factors | Operating Speed A (m/s) | Shovel Surface Inclination B (°) | Digging Depth C (mm) |
|---|
| K1 | 977.26 | 803.4 | 955.54 |
| K2 | 1099.19 | 1066.87 | 1016.9 |
| K3 | 1038.89 | 1245.07 | 1142.9 |
| k1 | 325.75 | 267.8 | 318.51 |
| k2 | 366.40 | 355.62 | 338.97 |
| k3 | 346.30 | 415.02 | 380.97 |
| Range | 40.64 | 147.22 | 62.45 |
| Impact rate | B > C > A |
Table 9.
Mining speed impact analysis table.
Table 9.
Mining speed impact analysis table.
| Serial Number | Digging Speed
A (m/s) | Angle of Entry
B (°) | Digging Depth
C (mm) | Horizontal Resistance F1 (N) | Vertical Resistance F2 (N) |
|---|
| 10 | 0.3 | 25 | 140 | 329.24 | 69.23 |
| 5 | 0.4 | 25 | 140 | 356.60 | 81.7 |
| 11 | 0.5 | 25 | 140 | 379.91 | 67.47 |
Table 10.
Influence analysis table of shovel angle.
Table 10.
Influence analysis table of shovel angle.
| Serial Number | Digging Speed A (m/s) | Angle of Entry B (°) | Digging Depth C (mm) | Horizontal Resistance F1 (N) | Vertical Resistance F2 (N) |
|---|
| 12 | 0.5 | 20 | 120 | 267.37 | 61.28 |
| 13 | 0.5 | 25 | 120 | 330.17 | 84.96 |
| 9 | 0.5 | 30 | 120 | 394.41 | 90.32 |
Table 11.
Impact analysis table of excavation depth.
Table 11.
Impact analysis table of excavation depth.
| Serial Number | Digging Speed
A (m/s) | Angle of Entry B (°) | Digging Depth
C (mm) | Horizontal Resistance F1 (N) | Vertical Resistance F2 (N) |
|---|
| 14 | 0.3 | 25 | 100 | 278.54 | 87.37 |
| 2 | 0.3 | 25 | 120 | 305.32 | 82.72 |
| 10 | 0.3 | 25 | 140 | 329.24 | 69.23 |
Table 12.
Box–Behnken Mining simulation test design and result parameters.
Table 12.
Box–Behnken Mining simulation test design and result parameters.
| Serial Number | Running Speed
A (m/s) | Shovel Surface Inclination B (°) | Digging Depth
C (mm) | Excavation Resistance R2 (N) |
|---|
| 1 | 1 | −1 | 0 | 341.45 |
| 2 | 0 | 0 | 0 | 378.25 |
| 3 | 1 | 0 | 1 | 408.2 |
| 4 | 0 | −1 | 1 | 334.61 |
| 5 | −1 | −1 | 0 | 286.07 |
| 6 | 0 | −1 | −1 | 278.51 |
| 7 | 0 | 1 | −1 | 439.37 |
| 8 | 0 | 0 | 0 | 370.15 |
| 9 | −1 | 0 | −1 | 348.49 |
| 10 | −1 | 0 | 1 | 374.37 |
| 11 | 0 | 1 | 1 | 492.36 |
| 12 | 1 | 0 | −1 | 361.4 |
| 13 | 0 | 0 | 0 | 385.25 |
| 14 | −1 | 1 | 0 | 490.93 |
| 15 | 1 | 1 | 0 | 520.77 |
| 16 | 0 | 0 | 0 | 379.45 |
| 17 | 0 | 0 | 0 | 368.56 |
Table 13.
Mining the resistance variance analysis table.
Table 13.
Mining the resistance variance analysis table.
| Source of Variance | Degree of Freedom | Quadratic Sum | Mean Square | F-Value | p-Value | Significance |
|---|
| Model | 9 | 71,718.33 | 7968.7 | 51.66 | <0.0001 | Very significant |
| B | 1 | 2176.68 | 2176.68 | 14.11 | 0.0071 | Very significant |
| C | 1 | 61,739.22 | 61739.22 | 400.24 | <0.0001 | Very significant |
| D | 1 | 4130.04 | 4130.04 | 26.77 | 0.0013 | Very significant |
| BC | 1 | 163.07 | 163.07 | 1.06 | 0.3381 | Not significant |
| BD | 1 | 109.41 | 109.41 | 0.71 | 0.4275 | Not significant |
| CD | 1 | 2.42 | 2.42 | 0.016 | 0.9039 | Not significant |
| B2 | 1 | 437.01 | 437.01 | 2.83 | 0.1362 | Not significant |
| C2 | 1 | 2282.96 | 2282.96 | 14.8 | 0.0063 | Very significant |
| D2 | 1 | 756.58 | 756.58 | 4.9 | 0.0624 | Significant |
| Residuals | 7 | 1079.78 | 154.25 | - | - | - |
| Loss of proposed items | 3 | 888.23 | 296.08 | 6.18 | 0.0554 | Not significant |
| Pure Error | 4 | 191.55 | 47.89 | - | - | - |
| Total | 16 | 72798.11 | - | - | - | - |
Table 14.
Optimal parameter verification.
Table 14.
Optimal parameter verification.
| Test Number | Measured Results (N) | Relative Error (%) |
|---|
| 1 | 356.17 | 3.29 |
| 2 | 359.56 | 4.29 |
| 3 | 349.81 | 1.44 |
| 4 | 332.89 | 3.47 |
| 5 | 336.56 | 2.4 |
| Average value | 347 | 2.98 |


