Article

Probability Distributions of Asphalt Pavement Responses and Performance under Random Moving Loads and Pavement Temperature

1
State Key Laboratory of Mechanical Behavior and System Safety of Traffic Engineering Structures, Shijiazhuang Tiedao University, Shijiazhuang 050043, China
2
School of Transportation and Science Engineering, Harbin Institute of Technology, Harbin 150090, China
*
Authors to whom correspondence should be addressed.
Appl. Sci. 2023, 13(2), 715; https://doi.org/10.3390/app13020715
Submission received: 20 December 2022 / Revised: 31 December 2022 / Accepted: 2 January 2023 / Published: 4 January 2023
(This article belongs to the Section Civil Engineering)

Abstract

:
Asphalt pavements are damaged by traffic load repetitions. Conventionally, the allowed number of load repetitions until pavement failure is calculated based on empirical transfer functions from deterministic pavement mechanical responses to performance. However, the mechanical responses and damage to the pavement are uncertain under a random realistic traffic load and pavement temperature. Therefore, the non-deterministic problem—that is, the probability distributions of asphalt pavement responses and performance under random moving loads and pavement temperatures—was investigated in this study. Random factors include the load pressure, vehicle wandering, speed, and temperature inside the asphalt layer. A combination of the response surface and first-order reliability methodologies was recommended to calculate the probability of mechanical responses at any point within the pavement, for reasons of computational efficiency. The accuracy of this method was verified by a Monte-Carlo simulation. Then, the effects of the mean values and standard deviations of the random factors on the probability distributions of the mechanical responses were discussed. Finally, probability distributions of pavement performance (i.e., probability density distributions of cumulative damage for fatigue failure and rutting after repeated random loads) were calculated using transfer functions and the probability distributions of the mechanical responses; thereby, the failure probability of the pavement after a given number of load repetitions was obtained. The results show that the previous deterministic analysis could not fully reflect the random characteristics of pavement mechanical responses under realistic random moving loads, and the mean values and standard deviations of the random factors have significant effects on the probability distributions of mechanical responses and performance. The failure probability of the pavement after a given number of load repetitions can be used as a guide to reliability-based pavement design. This study on the probability distributions of asphalt pavement responses and performance exhibits the potential to understand pavement behavior and could be beneficial as a complement during reliability-based pavement design.

1. Introduction

The performance of asphalt pavement gradually deteriorates under traffic load repetitions. The evaluation of pavement performance is one of the most important steps in pavement design. Traditional pavement design and analysis is a deterministic approach that utilizes a fixed input, and thus the deterministic pavement performance—such as the allowed number of load repetitions for fatigue failure and rutting—can be obtained [1,2] However, the pavement performance under realistic traffic loads is uncertain because pavement performance is affected by variability in factors such as traffic, climate, and structural and material parameters [3].
Currently, the most prevalent asphalt pavement design method is the Mechanistic-Empirical Pavement Design Guide (MEPDG). The MEPDG provides a state-of-the-art practice tool for designing new and rehabilitated pavement structures based on mechanistic-empirical principles [4]. In the MEPDG, mechanical responses can be calculated by multilayered system theory or finite element simulation in the mechanistic part, and pavement performance can be evaluated by using empirical transfer functions with the calculated mechanical responses in the empirical part. This pavement design method also provides the option to perform reliability concepts. Pavement reliability can be captured in the MEPDG by comparing predicted and measured distress models.
Many researchers believe that the current reliability framework in the MEPDG is insufficient for implementing the complete concept of reliability-based pavement design. Researchers have discussed three main reasons that cause the uncertainty of pavement performance: the variability in traffic, as well as structural and material parameters; the uncertainty of constants in design equations; and the uncertainty of model error [5]. The influence of the uncertainty of constants in design equations and model error can be eliminated by modifying the MEPDG through long-term in situ pavement testing and monitoring [6]. However, the variability in traffic, as well as structural and material parameters, which are inherent properties and cannot be ignored, should be discussed in reliability-based pavement design. Therefore, researchers consider random variables, such as traffic volume, pavement strength, pavement modulus, and pavement depth, to establish the reliability concepts in the pavement design procedure [7,8]. Different reliability methods for pavement analysis, such as Monte-Carlo simulation (MCS) [9], first-order reliability methodology (FORM) [10], Rosenblueth [11,12], and response surface methodology (RSM) [13,14] have been used in reliability-based pavement design.
Although reliability concepts have been applied in previous studies (the variability in traffic such as traffic volume and even traffic wandering were considered in reliability-based pavement design), it is worth mentioning that the random factors (especially the randomness of realistic traffic loads, and the viscoelastic properties of the asphalt layer) were not sufficiently considered in previous studies. The random variables of realistic traffic loads, including tire inflation pressure, wandering, and speed—where tire inflation pressure has an effect on the amplitude of the mechanical responses of the pavement, wandering changes the distribution of the mechanical responses, and the variability in speed causes the variability in the moduli of asphalt layers due to the viscoelastic properties of the asphalt mixture—cause variability in the mechanical responses of the pavement. These random variables of realistic traffic loads, which cause the variability in mechanical responses, hence affect the variability in pavement performance. Moreover, the temperature inside the asphalt layers, which affects the moduli of the asphalt layers, also causes variability in the mechanical responses and damage to the pavement.
Therefore, obtaining the accurate mechanical responses inside the pavement under realistic moving loads and pavement temperatures can be beneficial to predict pavement performance. The non-deterministic problem—that is, the probability distributions of asphalt pavement responses and performance under random moving loads and pavement temperature—was investigated in this study. It could be considered complementary to reliability-based pavement design.

2. Analytical Solutions of Pavement Response under Random Moving Loads and Pavement Temperatures

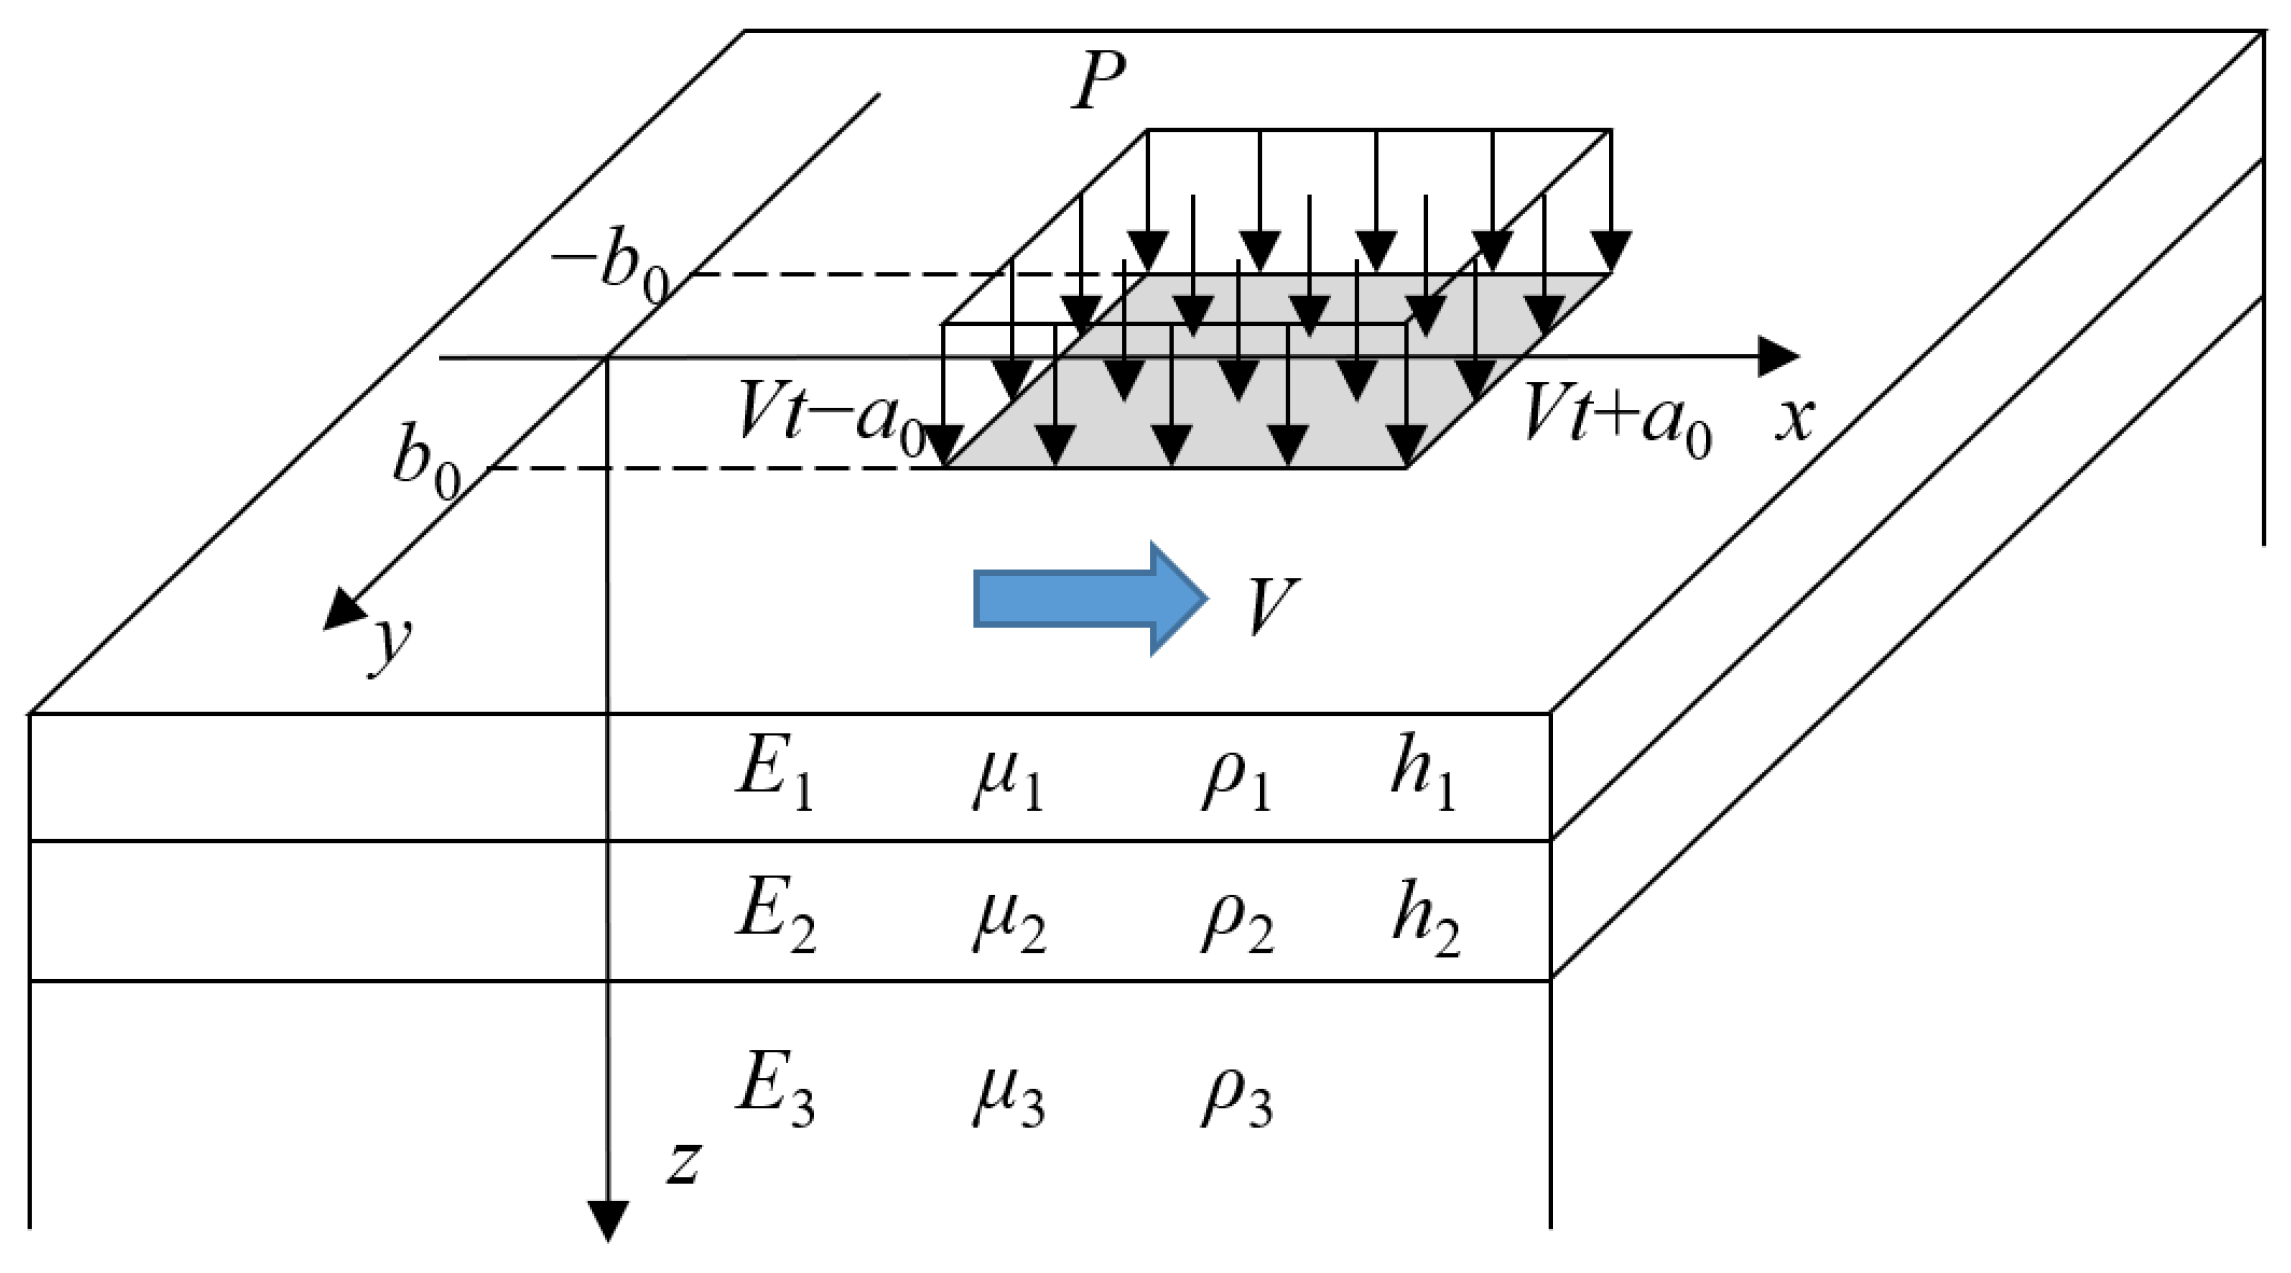
2.1. Analytical Solutions of Viscoelastic Multilayered System

Asphalt pavement is generally simplified as a viscoelastic multilayered system. The analytical solutions of the viscoelastic multilayered system under a moving load have been derived based on Galilean and Fourier transforms, and the numerical calculations of analytical solutions have been implemented using a Gaussian integral [15].
A viscoelastic three-layered system under a rectangular uniform moving load as illustrated in Figure 1 was considered as an example; the three layers from top to bottom correspond to the asphalt layer, base layer, and subgrade. The property of the asphalt layer was assumed as viscoelasticity, and the properties of the base layer and subgrade were considered as elasticity. The mechanical responses at any point within the pavement can be expressed as Equation (1).
R ( x , y , z , t ) = P 4 π 2 F ( E ˜ 1 , E 2 , E 3 , μ , ρ , h 1 , h 2 , ξ 1 , ξ 2 , z ) e i ξ 1 ( x V t ) e i ξ 2 y d ξ 1 d ξ 2
where, x, y, and z = coordinates of the calculation point; ξ 1 = coordinate in the complex plane with respect to x; ξ 2 = coordinate in the complex plane with respect to y; t = movement time of load; V = speed of moving load; P = load pressure; μ = Poisson’s ratios of the three layers [ μ 1 μ 2 μ 3 ] ; ρ = densities of the three layers [ ρ 1 ρ 2 ρ 3 ] ; h 1 and h 2 = depths of the asphalt and base layer; E 2 and E 3 = elastic moduli of the base layer and subgrade; E ˜ 1 = viscoelastic modulus of the asphalt layer in the complex plane, which is related to ξ 1 and V, and can be written as Equation (2) using Prony series; F = function describes a viscoelastic three-layered system in the complex plane; and R ( x , y , z , t ) = mechanical responses, such as displacements, strains, and stresses at any point within the pavement.
E ˜ 1 ( ξ 1 V ) = E ( 1 j = 1 J g j 1 i ξ 1 V τ j )
where, E = instantaneous elastic modulus; g j = Prony series; and τ j = reduced time.
The dimension of ξ 1 V is frequency (Hz). The Prony series equation in the time domain can be expressed as Equation (3), and Equation (2) is the frequency domain expression of Equation (3).
E 1 ( t 0 ) = E [ 1 j = 1 J g j ( 1 e t 0 / τ j ) ]
where, t 0 = load time; and E 1 = viscoelastic modulus of the asphalt layer in the time domain.

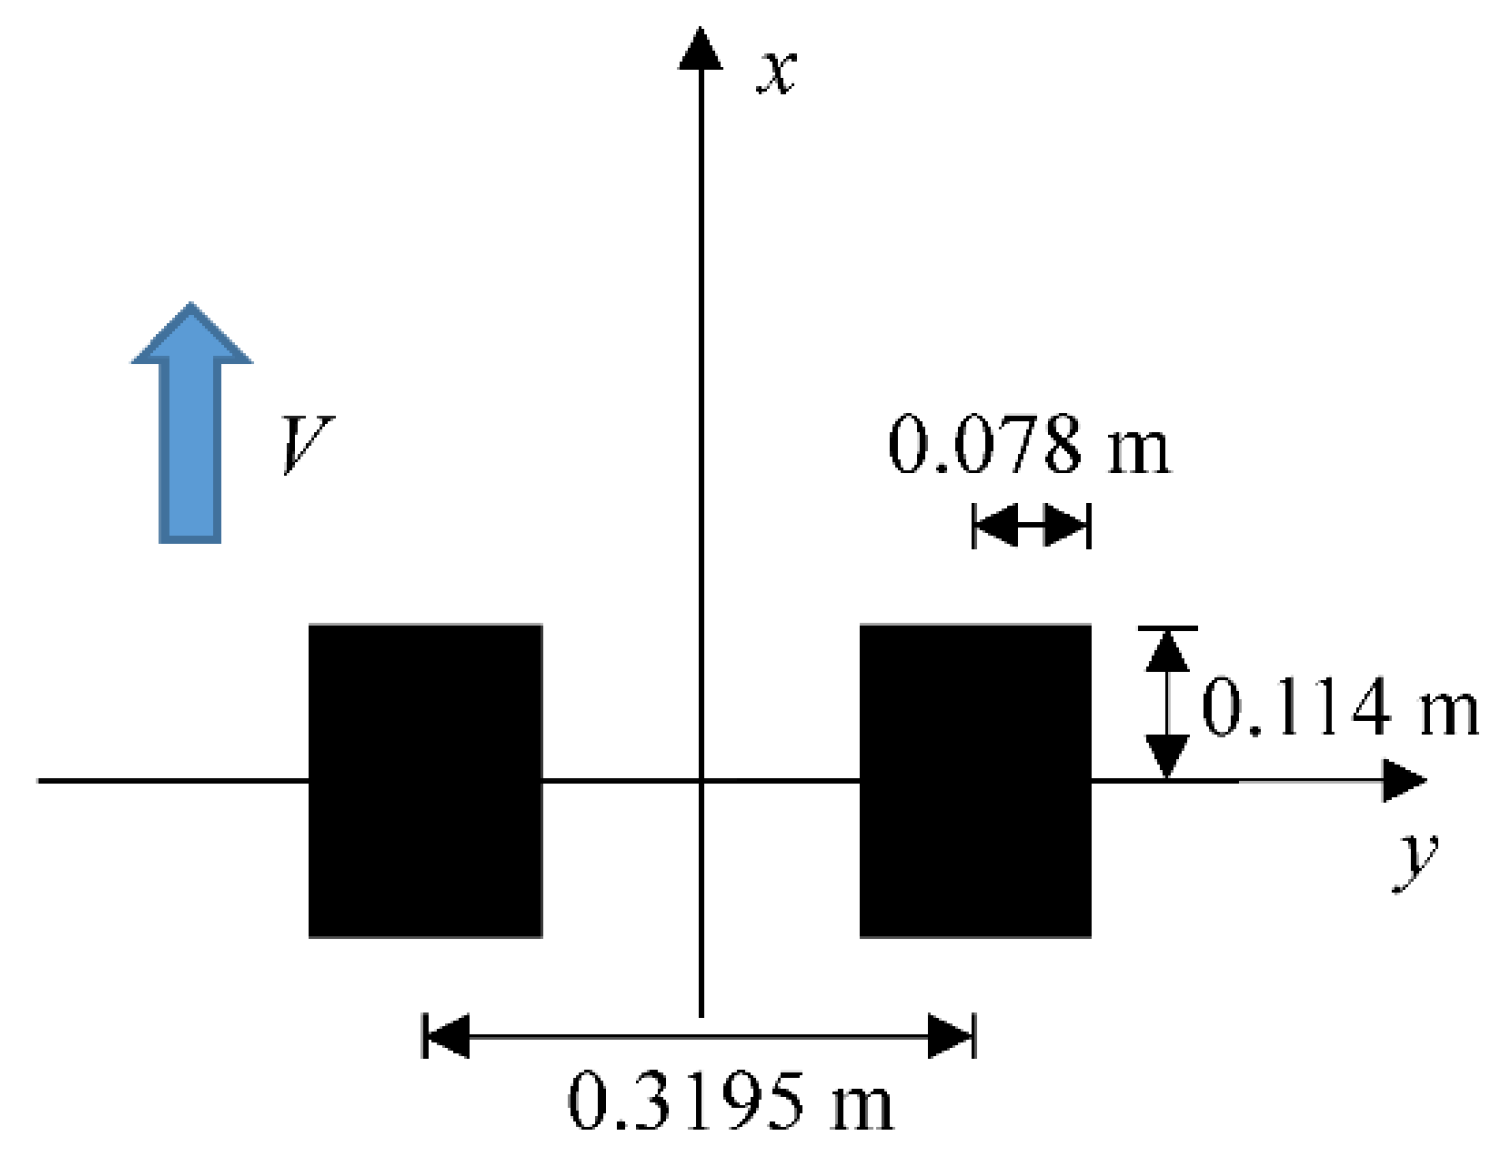
2.2. Definition of Random Moving Loads and Pavement Temperature

The mechanical responses at a certain point inside the pavement are not constant because of random load pressure, vehicle wandering, different speeds, and various temperatures of the asphalt layer when a vehicle passes over a pavement section.
In Equation (1), only the random factors of load pressure and vehicle speed could be considered. In order to describe all the random factors in the analytical solutions of an asphalt pavement under a moving load, Equation (1) should be rewritten as follows:
R ( x , y , z , t ) = P 4 π 2 F ( E ˜ ˜ 1 , E 2 , E 3 , μ , ρ , h 1 , h 2 , ξ 1 , ξ 2 , z ) e i ξ 1 ( x V t ) e i ξ 2 ( y y w ) d ξ 1 d ξ 2
where, y w = vehicle wandering; and E ˜ ˜ 1 = viscoelastic modulus of the asphalt layer in the complex plane, which is related to ξ 1 , V, and the temperature of the asphalt layer, and can be written as Equation (5). This equation is an effective model for the consideration of the viscoelastic properties of the asphalt layer.
E ˜ ˜ 1 ( ξ 1 V , T ) = E ( 1 j = 1 J g j 1 i ξ 1 V a T τ j )
where, T = temperature of the asphalt layer; and a T = time-temperature shift factor, which is related to temperature T, and can be expressed by the following Williams–Landel–Ferry (WLF) equation:
log 10 ( a T ) = C 1 ( T T r e f ) C 2 + ( T T r e f )
where, C 1 and C 2 = model coefficients; and T r e f = reference temperature.

3. Probability Modeling of Asphalt Pavement Responses

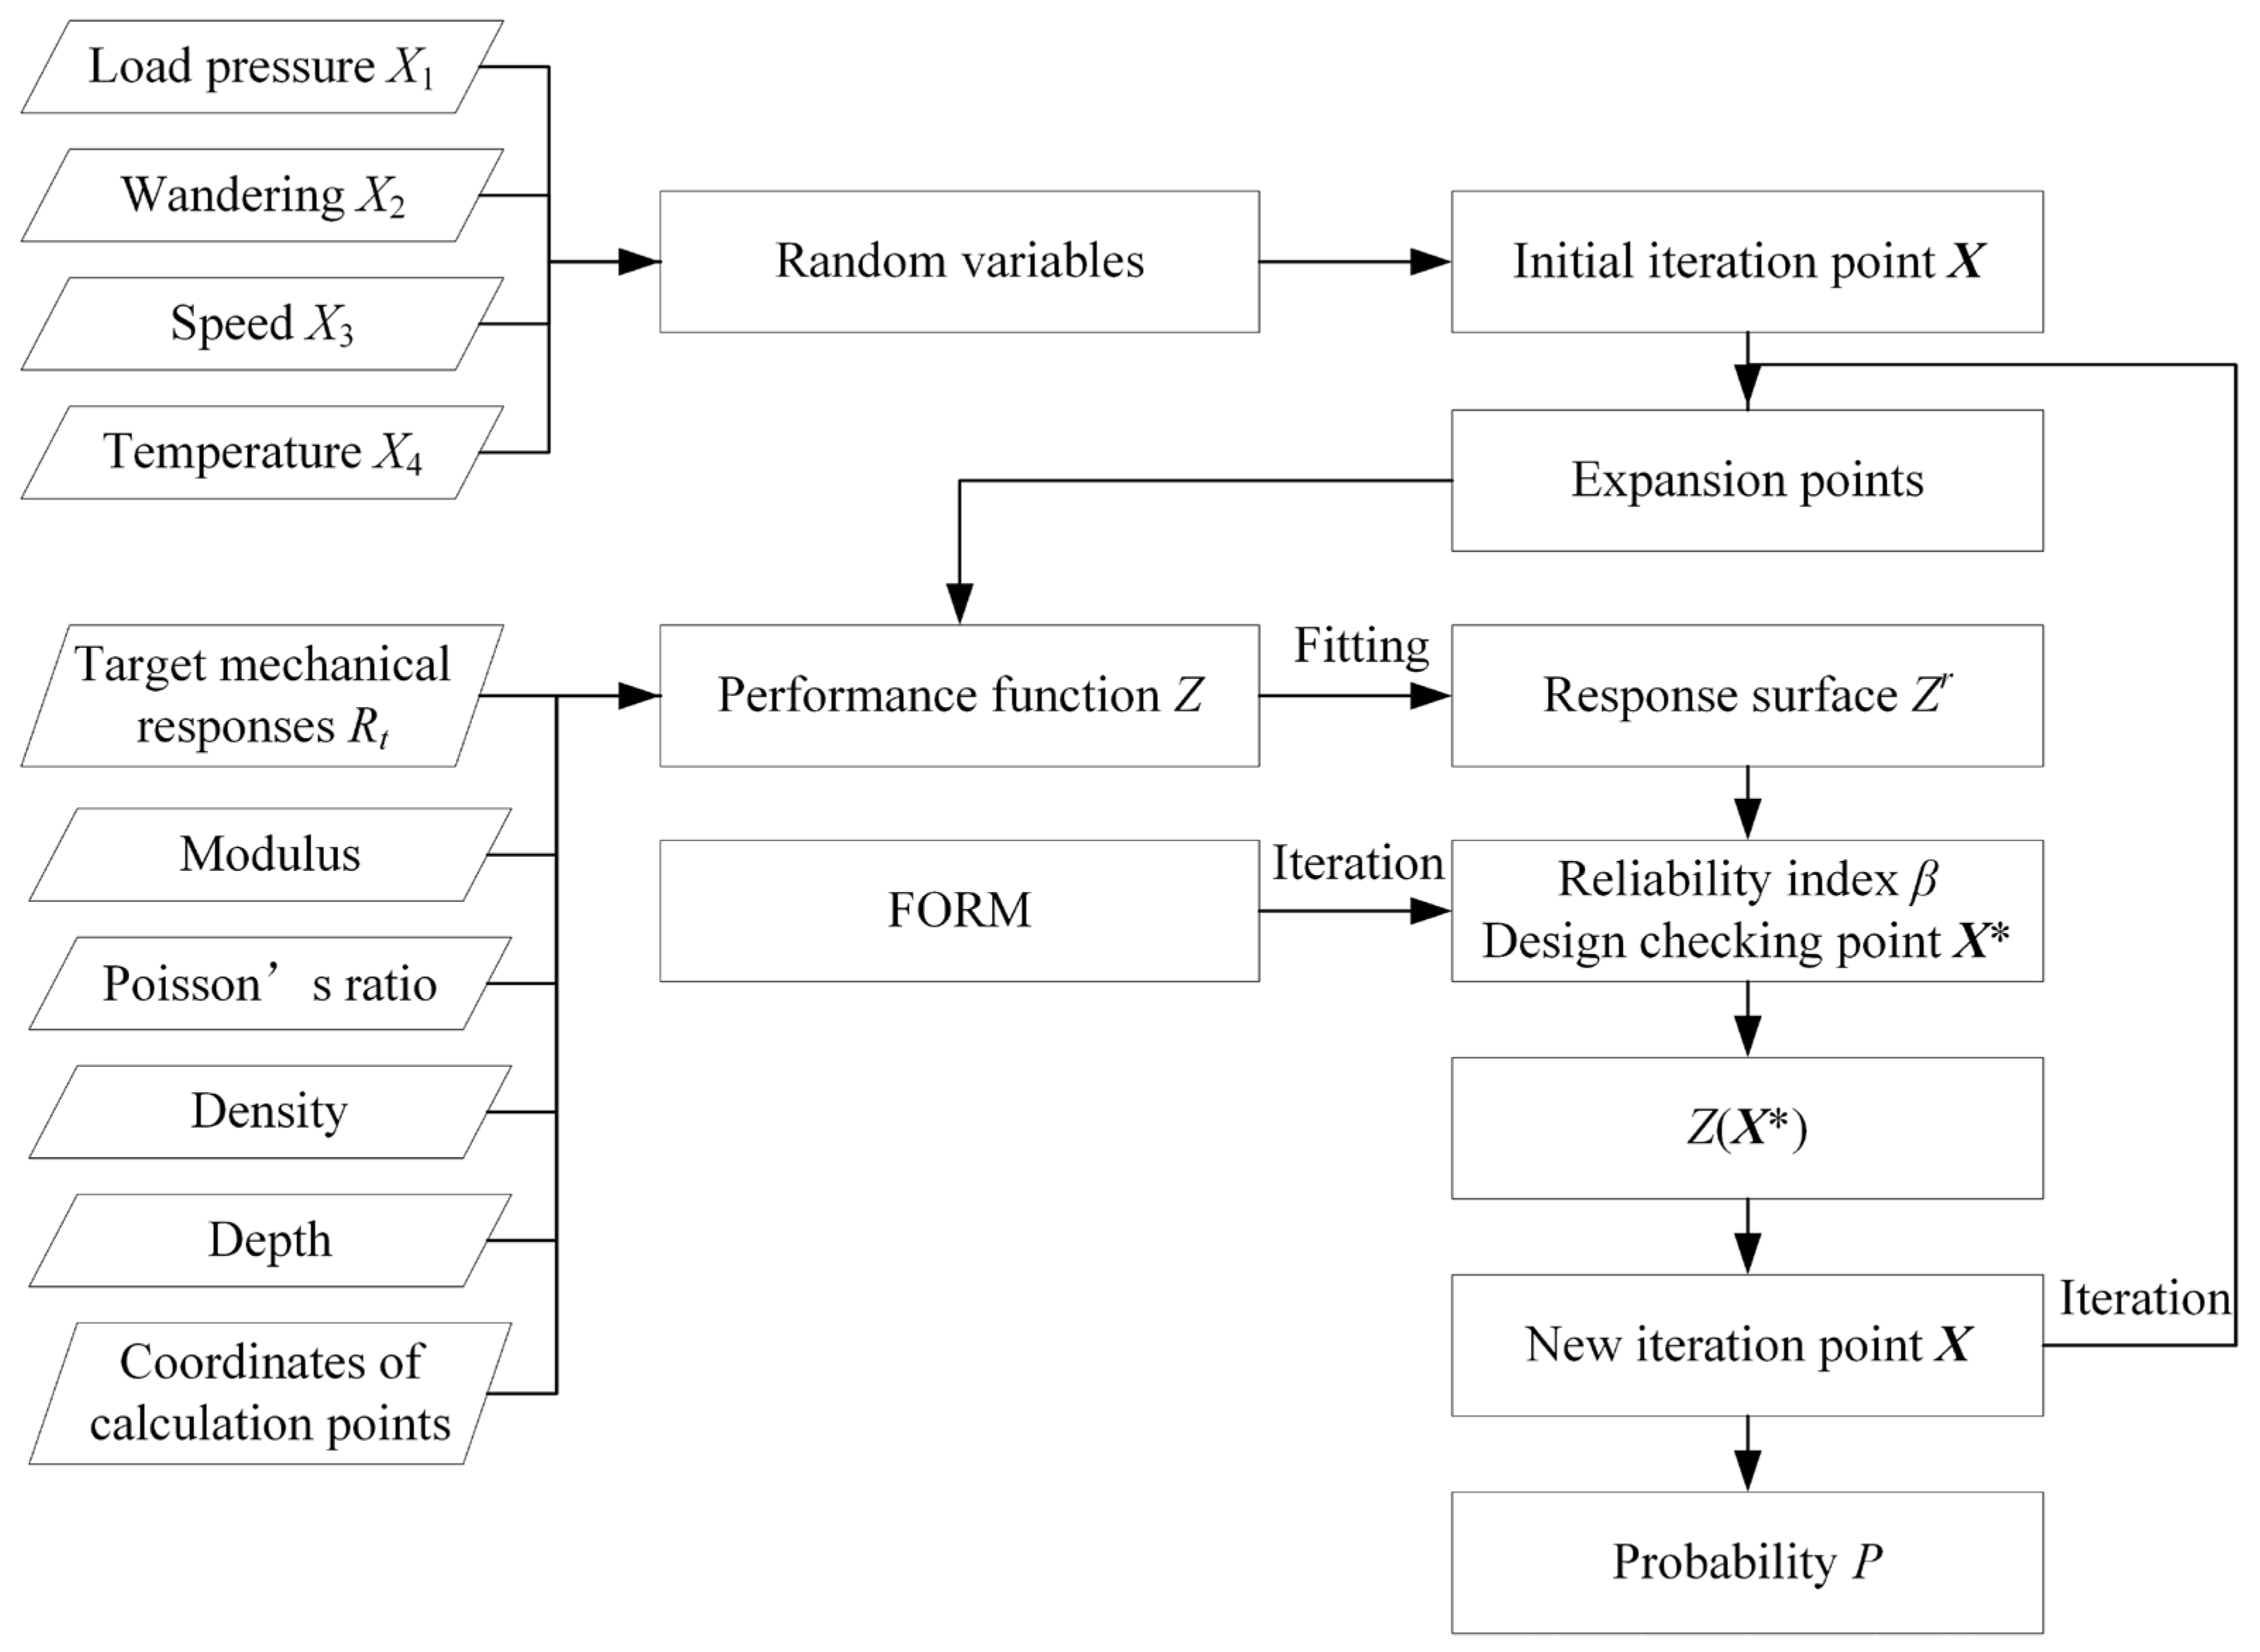
3.1. Response Surface Methodology

The analytical solutions of asphalt pavement under a moving load expressed as Equation (4) illustrate the nonlinear relationship between the input (random moving loads and pavement temperature) and output (mechanical responses). In Equation (4), the analytical solutions are unclear and complex expressions. Thus, traditional reliability methods such as FORM could not be applied directly.
The RSM, which is a collection of statistical and mathematical techniques, is an effective method for the probability calculation of complex analytical solutions through quadratic polynomial fitting and substitution. The performance function of asphalt pavement responses can be written as Equation (7).
Z ( X ) = R t R ( x , y , z , t m )
where, R t = target mechanical responses which can be achieved; R ( x , y , z , t m ) = peak value of the time history of mechanical responses at any point within the pavement; Z = performance function of asphalt pavement responses; X = [ X 1 X 2 X 3 X 4 ] ; X 1 = P (load pressure); X 2 = y w (vehicle wandering); X 3 = V (speed); and X 4 = T (temperature of the asphalt layer).
Random variables indicate that the response surface function can be expressed as Equation (8). The response surface function was used for the explicit approximation of the performance function.
Z r ( X ) = a + i = 1 4 b i X i + i = 1 4 c i X i 2
where, a , b i , and c i = fitting parameters; and Z r = fitted results.

3.2. Probability Calculation Procedure

The combination of RSM and FORM was performed to calculate the probability distributions of the asphalt pavement responses. The probability calculation procedure was as illustrated, and the flowchart of the probability calculation is shown in Figure 2.
Step 1: Pavement material parameters (i.e., modulus, Poisson’s ratio, and density of each layer) and pavement structural parameters (i.e., depth of each layer) were inputted. In addition, the coordinates of the calculation point inside the pavement (x, y, and z) were determined. The target mechanical responses, which can be achieved as Rt, were set.
Step 2: The probability distribution of each random variable was inputted. The mean values of random variables were μ X = [ μ X 1 μ X 2 μ X 3 μ X 4 ] , and the standard deviations of random variables were σ X = [ σ X 1 σ X 2 σ X 3 σ X 4 ] .
Step 3: The initial iteration point X = [ X 1 X 2 X 3 X 4 ] was assumed. Generally, the mean values of each random variable were selected as the initial iteration point.
Step 4: The expansion points [ X 1 X 2 X 3 X 4 ] , [ X 1 f σ X 1 X 2 X 3 X 4 ] , [ X 1 X 2 f σ X 2 X 3 X 4 ] , [ X 1 X 2 X 3 f σ X 3 X 4 ] , [ X 1 X 2 X 3 X 4 f σ X 4 ] , [ X 1 + f σ X 1 X 2 X 3 X 4 ] , [ X 1 X 2 + f σ X 2 X 3 X 4 ] , [ X 1 X 2 X 3 + f σ X 3 X 4 ] , and [ X 1 X 2 X 3 X 4 + f σ X 4 ] , were selected, where f = 1–3. The values of the performance function Z k ( k = 1 , 2 , , 9 ) at expansion points were calculated subsequently by Equation (7). The coefficient matrix A was established at expansion points.
A = [ 1 [ X i ] 1 × 4 [ X i 2 ] 1 × 4 1 [ X i ] 1 × 4 [ X i 2 ] 1 × 4 1 [ X i ] 1 × 4 [ X i 2 ] 1 × 4 ] + [ 0 0 0 0 f diag [ σ X i ] 4 × 4 diag [ f 2 σ X i 2 2 f X i σ X i ] 4 × 4 0 f diag [ σ X i ] 4 × 4 diag [ f 2 σ X i 2 + 2 f X i σ X i ] 4 × 4 ]
Step 5: The fitting parameters of the response surface a , b i , and c i ( i = 1 , 2 , , 4 ) were solved by Equation (10). Meanwhile, the fitted results Z r could be determined by Equation (8).
[ a [ b i ] 1 × 4 [ c i ] 1 × 4 ] = A 1 [ Z k ] 1 × 9
Step 6: The reliability index β and design checking point X * = [ X 1 * X 2 * X 3 * X 4 * ] were calculated through a series of iterations based on FORM. In this case, the mean values of each random variable were selected as the initial design checking point. The iteration process can be expressed as Equations (11)–(13). Equivalent normalization of each random variable must be conducted before executing the FORM.
α X i = Z r ( X * ) X i σ X i i = 1 4 [ Z r ( X * ) X i ] 2 σ X i 2
β = i = 1 4 α X i X i * μ X i σ X i
X i * = μ X i + β σ X i α X i
Step 7: The value of the performance function Z ( X * ) could be calculated by Equation (7). The new iteration point X = [ X 1 X 2 X 3 X 4 ] could be interpolated by Equation (14).
X = μ X + Z ( μ X ) Z ( μ X ) Z ( X * ) ( X * μ X )
Step 8: Steps 4 to 7 were repeated until X could be converged to meet the error requirements.
Step 9: The probability, where the mechanical responses R are less than the target mechanical responses R t , can be calculated by Equation (15).
P ( R R t ) = ϕ ( β )
where P is probability; ϕ is the standard normal cumulative distribution.

3.3. Monte-Carlo Simulation

Monte-Carlo simulation (MCS), which relies on repeated random sampling to obtain numerical results, is another approach to realize the probability calculation of complex analytical solutions, aside from RSM. In order to obtain the exact probability distribution of the mechanical responses, a huge number of random samples should be calculated by Equation (4). Therefore, performing MCS is time consuming and may not be a suitable and convenient approach to solving this problem. However, this study utilized MCS to verify the RSM.

4. Results and Discussions

4.1. Pavement Parameters and Random Variable Parameters

Taking a viscoelastic three-layered system under a rectangular uniform moving load as an example, the asphalt pavement material and structural parameters are listed in Table 1. The viscoelastic properties of the asphalt layer were described by Prony series and WLF equations which are displayed in Table 2 and Table 3, respectively. The instantaneous elastic modulus of the asphalt layer is 13,551.76 MPa.
A double rectangular uniform moving load as depicted in Figure 3 was exerted on the viscoelastic three-layered system. The half values of the rectangular size along x- and y-directions were 0.114 and 0.078 m, correspondingly. The distance between two rectangular loads was 0.3195 m.
Table 4 lists the mean values and standard deviations of the load pressure (X1), vehicle wandering (X2), speed (X3), and temperature of the asphalt layer (X4) with the assumption that load pressure (X1) and speed (X3) conformed to a lognormal distribution, while vehicle wandering (X2) and the temperature of the asphalt layer (X4) conformed to a normal distribution.

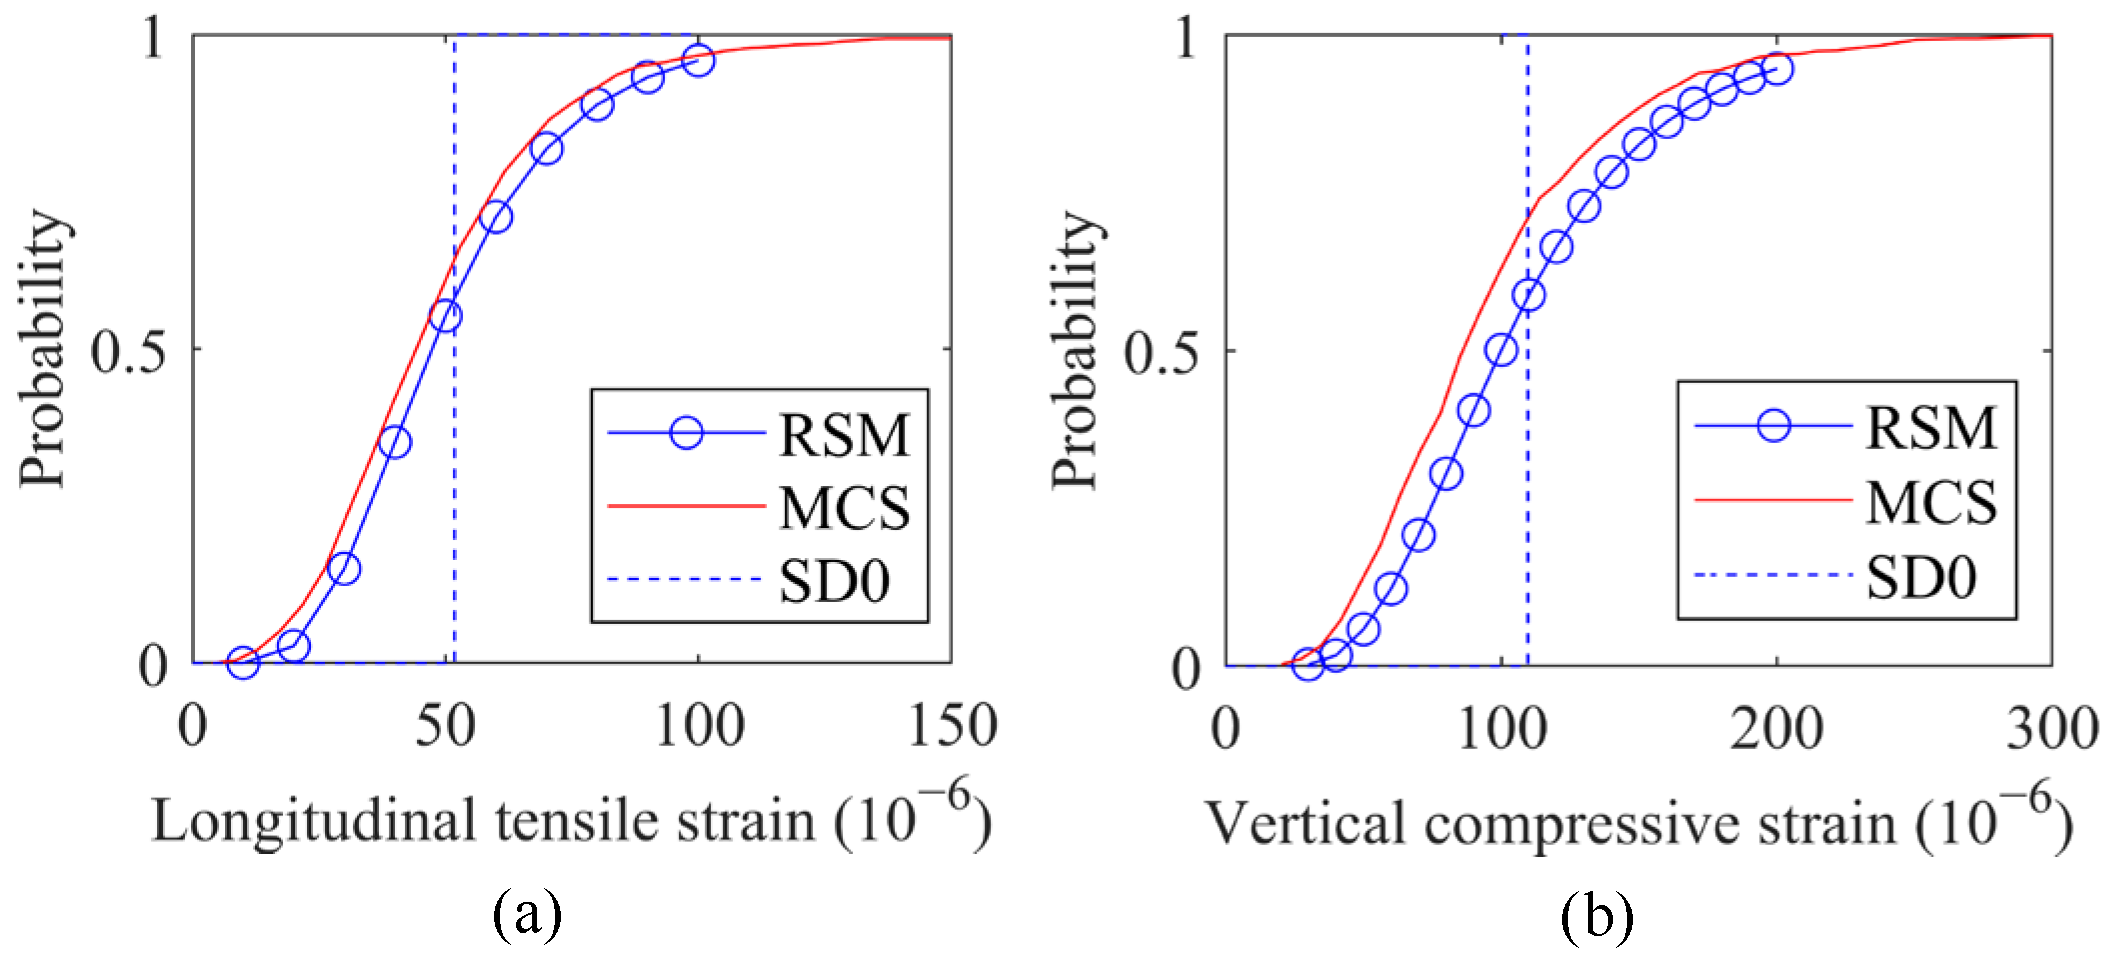
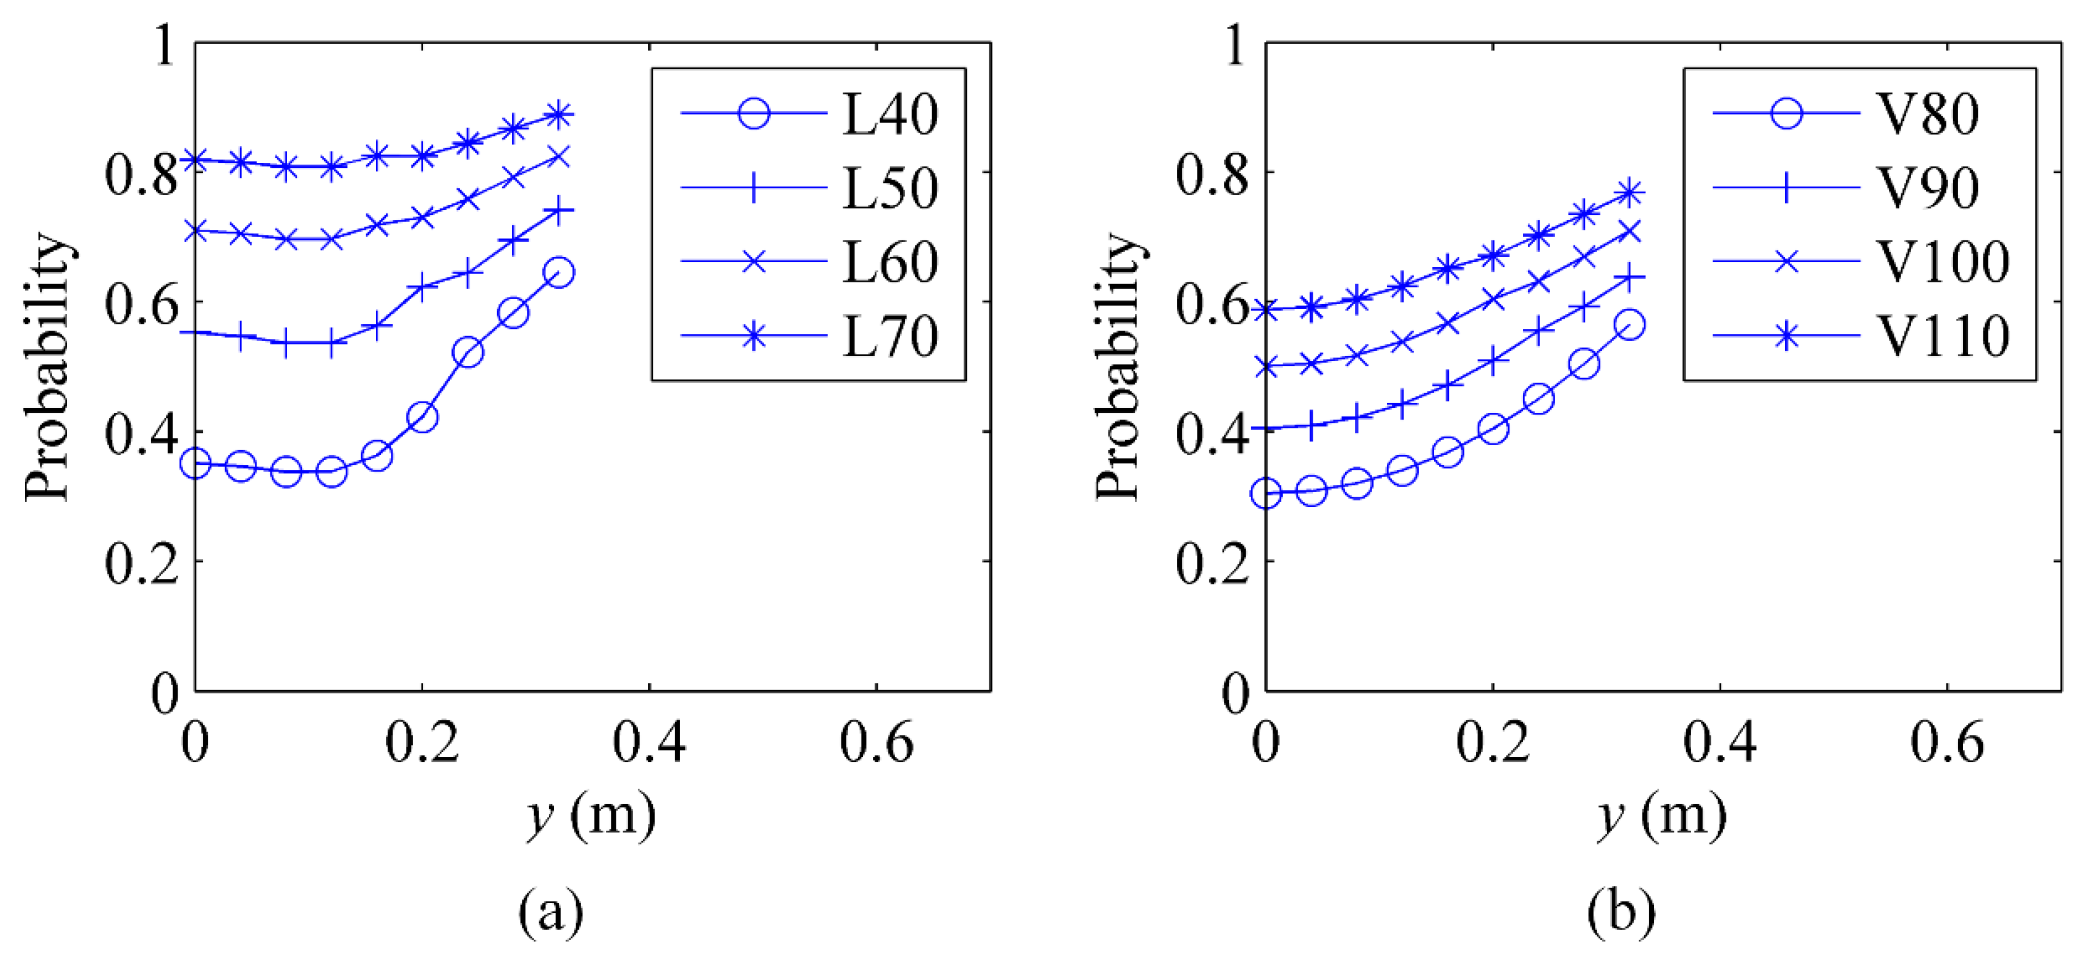
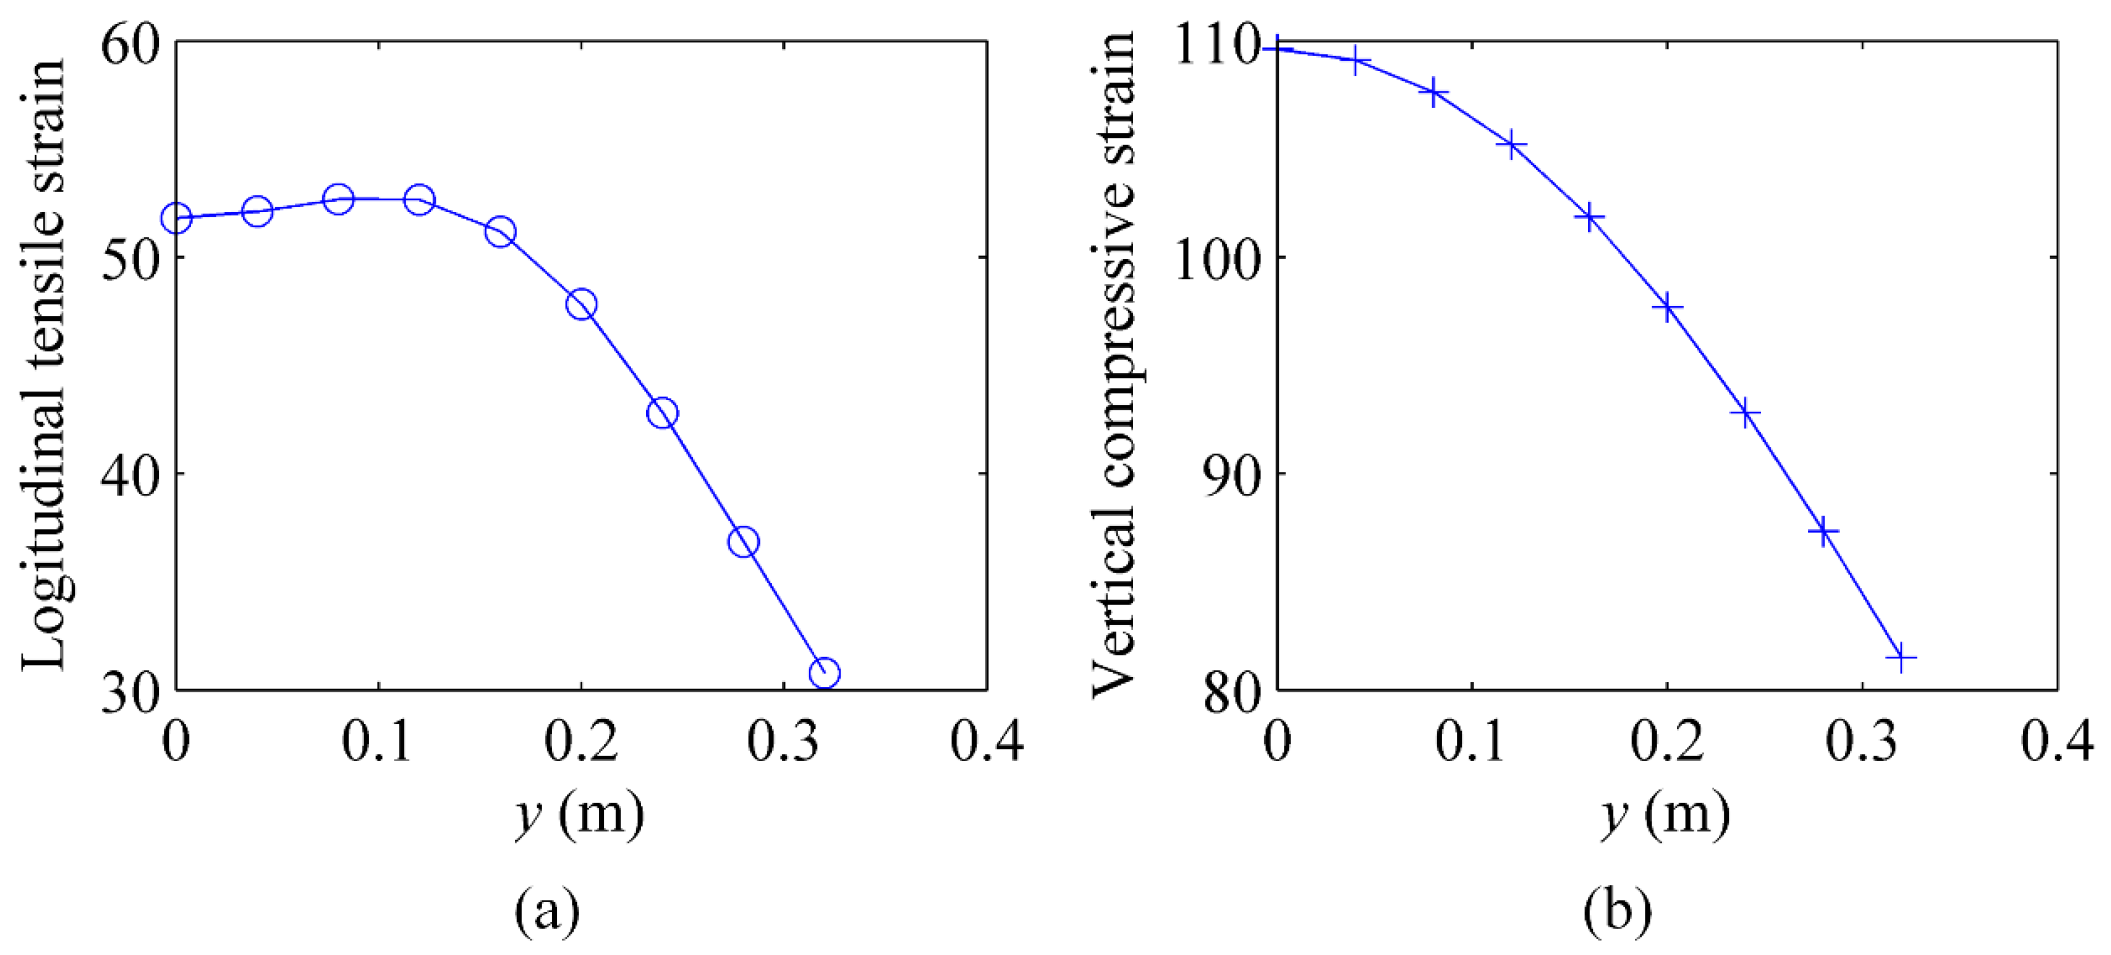
4.2. Probability Distributions of Mechanical Responses

The calculation points at the bottom of the asphalt layer (from A1 to A9) and on the top of the subgrade (from B1 to B9) are demonstrated in Figure 4. Only calculation points with y coordinates that are larger than zero were analyzed given the symmetry of the load pressure. The distance between each adjacent calculation point is 0.04 m. The probability distributions of the mechanical responses of these points were calculated based on the combined RSM and FORM and were verified by executing the MCS of 1000 random samples.
The results of the cumulative probability distributions of longitudinal tensile strain at A1 and vertical compressive strain at B1 are displayed in Figure 5. This figure presents the trends of the cumulative probability distributions of longitudinal tensile and vertical compressive strains calculated through the combined RSM and FORM, which are consistent with those using MCS. Thus, the combined RSM and FORM is proven to be validated for the probability calculation of mechanical responses. Compared with MCS, the probability calculation procedure based on the combined RSM and FORM is recommended for reasons of computational efficiency. Specifically, the calculation process for the probability of being less than the target mechanical response R t based on the combined RSM and FORM only takes approximately one minute, while the calculation process for the cumulative probability distribution of mechanical responses by utilizing the MCS of 1000 random samples requires more than one hour. Deterministic results may be acquired for the cumulative probability distributions of mechanical responses when standard deviations of the random variables equal zero (i.e., deterministic problem), and are also shown in Figure 5. These deterministic results could not fully reflect the random characteristics of pavement mechanical responses under realistic random moving loads.
The results of the probability of being less than the target mechanical responses for longitudinal tensile and vertical compressive strains at different calculation points are depicted in Figure 6. Figure 7 displays the deterministic results for longitudinal tensile and vertical compressive strains at different calculation points. As can be observed from Figure 6 and Figure 7, deterministic results are a special case of probabilistic results. Moreover, the probability that the point sustains a significant mechanical response is high when the probability of being less than a target mechanical response at a certain point is low. In this case, the large longitudinal tensile strain at the bottom of the asphalt layer could be captured with a high probability near the wheel tracks (A4), while the large vertical compressive strain on the top of the subgrade could be detected with a high probability in the middle of the double rectangular load (B1).

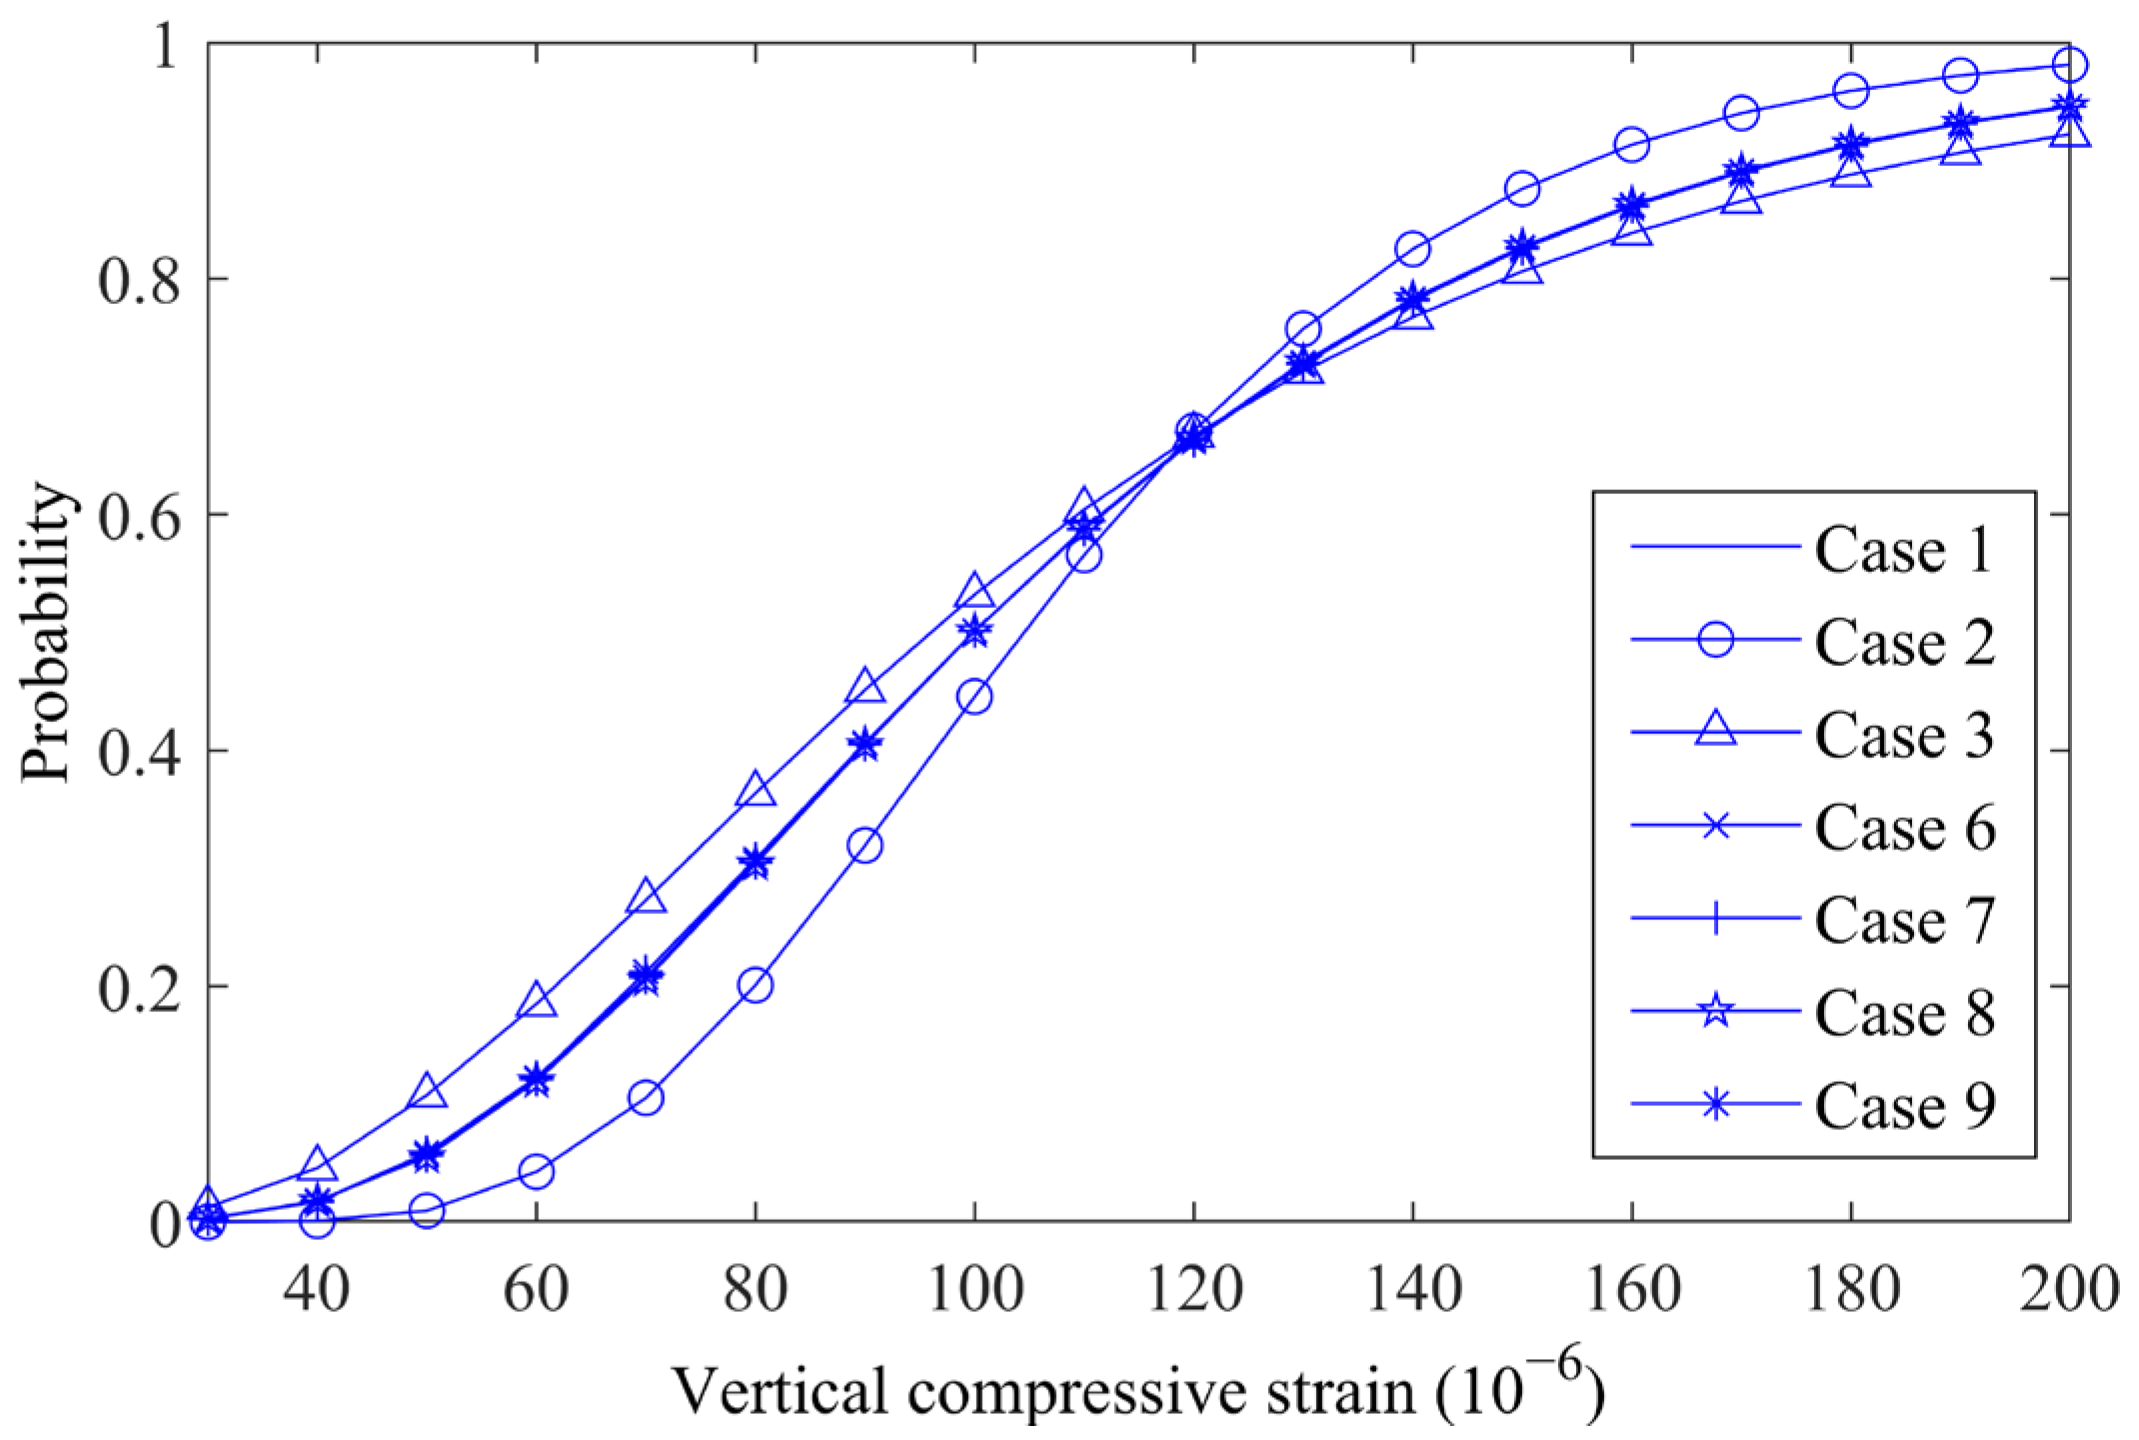
4.3. Effects of Random Variable Parameters

In order to discuss the effect of random variable parameters, random variables with different mean values and standard deviations listed in Table 5 and Table 6 were considered.
The results of the cumulative probability distributions of vertical compressive strain at B1 with different mean values of load pressure, speed, and temperature of the asphalt layer are presented in Figure 8. In this figure, the curve shapes of the cumulative probability distributions are basically the same. Additionally, when the mean value of load pressure becomes large, or the mean value of speed becomes small, or the mean value of temperature inside the asphalt layer becomes high, the curves of cumulative probability distributions are observed to shift to the positive direction of the horizontal axis (i.e., the probability of obtaining a large strain becomes high). The same laws could be found for different calculation points, whether vertical compressive or longitudinal tensile strains.
The results of the cumulative probability distributions of vertical compressive strain at B1 with different standard deviations of load pressure, speed, and temperature of the asphalt layer are displayed in Figure 9. In this figure, the standard deviation of the strain probability distribution is large when the standard deviation of load pressure is large. The standard deviation of load pressure has the most significant effect on the standard deviation of strain probability distribution, while the standard deviations of temperature and speed have a slight effect.
The effect of the standard deviations of vehicle wandering for the probability of being less than 100 με for vertical compressive strain at different calculation points (from B1 to B9) are exhibited in Figure 10. In this figure, the strain concentration in the load range becomes significant, and the probability that a calculation point outside the load range is subjected to the large strain is small when the standard deviation of vehicle wandering is small. Similar laws could be found for various calculation points, whether vertical compressive or longitudinal tensile strains.
Overall, the statistical characteristics of these random factors are the key to obtaining accurate probability distributions of mechanical responses and should be considered in pavement design and evaluation.

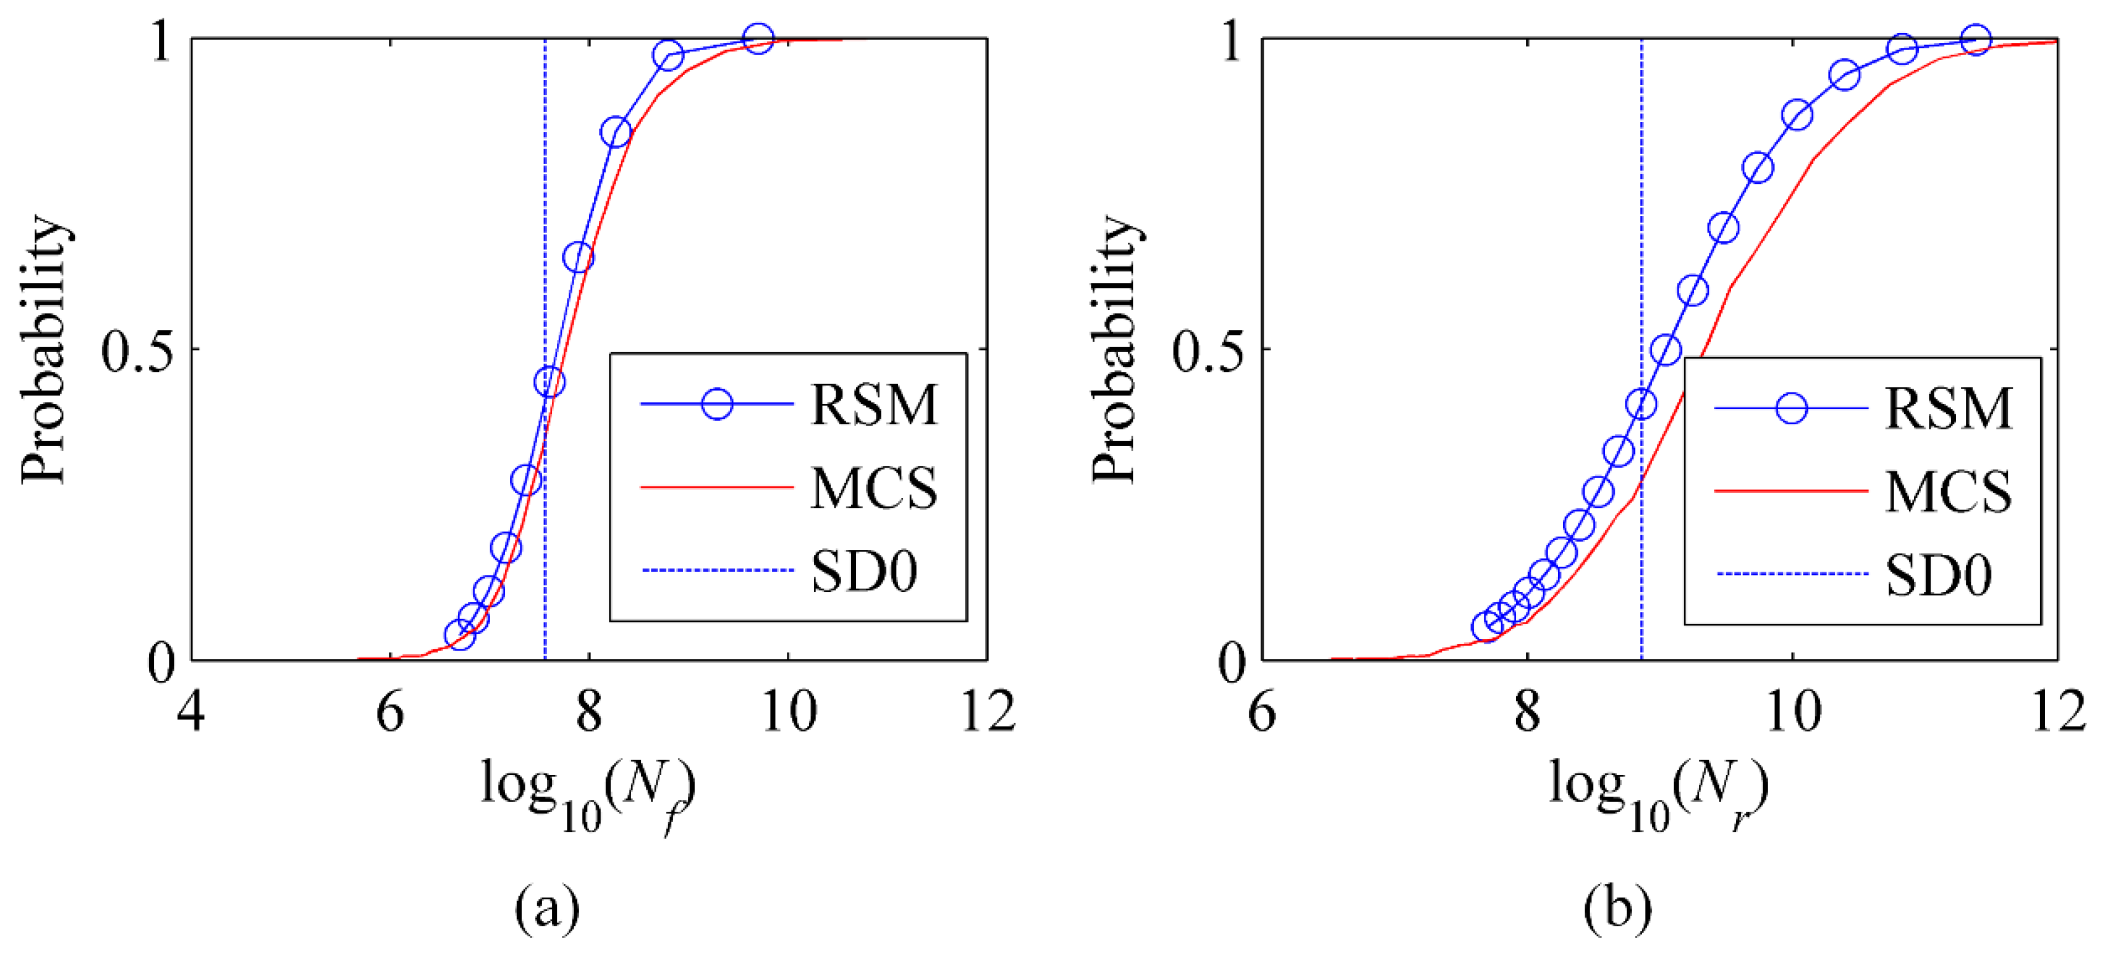
4.4. Probability Distributions of Pavement Performance

Transfer functions are utilized to evaluate the allowed number of load repetitions which damage the pavement. Although many transfer functions have been developed by researchers, the basic forms of the transfer functions, including the fatigue function and rutting model, can be generally expressed by Equations (16) and (17), respectively.
N f = q 1 ε t q 2 E 1 q 3
N r = q 4 ε v q 5
where, N f is the allowed number of load repetitions for fatigue failure; N r is the allowed number of load repetitions for rutting; ε t is the tensile strain at the bottom of the asphalt layer; ε v is the vertical strain on the top of the subgrade; and q 1 , q 2 , q 3 , q 4 , and q 5 are empirically determined constants. In Equation (16), E1 could be ignored because the magnitude is generally much larger in q 2 than in q 3 . The transfer functions established by the Illinois Department of Transportation for fatigue failure [16] and the Asphalt Institute for rutting [17] were adopted in this study, where q 1 = 5 × 10⁻⁶, q 2 = −3, q 4 = 1.365 × 10⁻⁹, q 4 = −4.477.
The mean values and standard deviations of random variables listed in Table 4 were used for further discussion. According to transfer functions, the cumulative probability distributions of the allowed number of load repetitions for fatigue failure and rutting could be easily converted from the cumulative probability distributions of the longitudinal tensile and vertical compressive strains (Figure 5). The results are illustrated in Figure 11, in which the cumulative probability distributions of the allowed number of load repetitions for fatigue failure and rutting calculated through the combined RSM and FORM are similar to those using MCS. Compared with MCS, the probability calculation procedure based on the combined RSM and FORM is suggested for reasons of computational efficiency. For the cumulative probability distributions of the allowed number of load repetitions with standard deviations of the random variables equal to zero (i.e., the deterministic problem), deterministic results could be acquired. It is worth mentioning that these deterministic results could not completely reflect the random characteristics of pavement performance under realistic random moving loads because the damage to the pavement varies with each random moving load and pavement temperature. Similarly, it can be found that large fatigue failure may appear with a high probability near the wheel tracks (A4) and large rutting may occur with a high probability in the middle of the double rectangular load (B1), according to Figure 6 and the transfer functions.
The damage of fatigue failure and rutting under a single random load can be generally expressed by Equations (18) and (19), respectively.
D f = 1 / N f
D r = 1 / N r
where, D f is damage of fatigue failure under a single random load; N r is damage of rutting under a single random load.
Therefore, the cumulative probability distributions for the damage of fatigue failure and rutting under a single random load could be easily converted from the cumulative probability distributions of longitudinal tensile and vertical compressive strains by using Equations (18) and (19). The cumulative probability distributions of longitudinal tensile strain at the bottom of the asphalt layer (A4) and vertical compressive strain on the top of the subgrade (B1) were used for analysis, because large fatigue failure appears with a high probability near the wheel tracks (A4) and large rutting occurs with a high probability in the middle of the double rectangular load (B1). Figure 12 shows cumulative probability distributions for the damage of fatigue failure (A4) and rutting (B1) under a single random load.
In order to calculate the probability distributions of pavement performance (i.e., probability density distributions of cumulative damage for fatigue failure and rutting after repeated random loads), convolution of the probability density distributions of damage under a single random load was applied. The probability density distributions of pavement performance are shown in Figure 13. As can be seen in Figure 13, cumulative damage for fatigue failure and rutting reaching 1 means that the pavement is at failure, thus the failure probability of the pavement after a given number of load repetitions can be obtained, as listed in Table 7. The failure probability of the pavement after a given number of load repetitions could be used for reliability-based pavement design.

5. Conclusions

This study explored the non-deterministic problem, namely, the probability distributions of asphalt pavement responses and performance (i.e., probability density distributions of cumulative damage for fatigue failure and rutting after repeated random loads) under random moving loads and pavement temperatures based on the combination of RSM and FORM.
(i) The results of probability distributions were validated by using MCS. The combination of RSM and FORM is more efficient and effective.
(ii) The deterministic results could not fully reflect the random characteristics of pavement mechanical responses under realistic random moving loads. The effects of the mean values and standard deviations of the random factors (load pressure, vehicle wandering, speed, and temperature inside the asphalt layer) on the probability distributions of mechanical responses are significant. The statistical characteristics of these random factors are the key to obtaining accurate probability distributions of mechanical responses and should be considered in pavement design and evaluation.
(iii) The probability density distributions of cumulative damage for fatigue failure and rutting after repeated random loads were calculated using transfer functions and the probability distributions of mechanical responses, and then the failure probability of the pavement after a given number of load repetitions was obtained, which can be used as a guide to reliability-based pavement design.
This research on the probability distributions of asphalt pavement responses and performance is conducive to a thorough understanding of pavement behavior under realistic traffic loads and can promote reliability-based pavement design. Future work will be conducted to evaluate the effects of random variables on mixture properties, pavement structures, vehicle types, and climate conditions for the reliability of pavement performance prediction.

Author Contributions

Conceptualization, X.M. and L.S.; methodology, X.M. and L.S.; software, C.S.; validation, L.S. and C.S.; formal analysis, X.M.; investigation, L.S.; resources, C.S.; data curation, C.S. and X.M.; writing—original draft preparation, X.M. and L.S.; writing—review and editing, C.S.; visualization, L.S.; supervision, X.M. and C.S.; project administration, C.S.; funding acquisition, X.M. All authors have read and agreed to the published version of the manuscript.

Funding

This work was supported by the open research fund of the State Key Laboratory of Mechanical Behavior and System Safety of Traffic Engineering Structures (KF2020-01).

Institutional Review Board Statement

Not applicable.

Informed Consent Statement

Not applicable.

Data Availability Statement

Not applicable.

Conflicts of Interest

The authors declare no conflict of interest.

References

  1. Wang, H.; Al-Qadi, I.L. Near-Surface Pavement Failure under Multiaxial Stress State in Thick Asphalt Pavement. Transp. Res. Rec. 2010, 2154, 91–99. [Google Scholar] [CrossRef]
  2. Wang, H.; Al-Qadi, I.L. Evaluation of Surface-Related Pavement Damage due to Tire Braking. Road Mater. Pavement Des. 2010, 11, 101–122. [Google Scholar] [CrossRef]
  3. Wang, H.; Al-Qadi, I.L.; Stanciulescu, I. Effect of Surface Friction on Tire-Pavement Contact Stresses during Vehicle Maneuvering. J. Eng. Mech. 2014, 140, 04014001. [Google Scholar] [CrossRef] [Green Version]
  4. ARA (Applied Research Associates). Guide for Mechanistic-Empirical Design of New and Rehabilitated Pavement Structures; Final Rep. 1-37A; National Cooperative Highway Research Program: Albuquerque, NM, USA, 2004. [Google Scholar]
  5. Huang, Y. Pavement Analysis and Design, 2nd ed.; Prentice Hall: Upper Saddle River, NJ, USA, 2004. [Google Scholar]
  6. Retherford, J.; McDonald, M. Reliability methods applicable to mechanistic-empirical pavement design method. Transp. Res. Rec. 2010, 2154, 130–137. [Google Scholar] [CrossRef]
  7. Tarefder, R.A.; Saha, N.; Stormont, J.C. Evaluation of subgrade strength and pavement designs for reliability. J. Transp. Eng. 2010, 136, 379–391. [Google Scholar] [CrossRef]
  8. Luo, Z.; Xiao, F.; Sharma, R. Efficient reliability-based approach for mechanistic-empirical asphalt pavement design. Constr. Build. Mater. 2014, 64, 157–165. [Google Scholar] [CrossRef]
  9. Timm, D.; Newcomb, D.; Galambos, T. Incorporation of reliability into mechanistic-empirical pavement design. Transp. Res. Rec. 2000, 1730, 73–80. [Google Scholar] [CrossRef]
  10. Maji, A.; Das, A. Reliability considerations of bituminous pavement design by mechanistic–empirical approach. Int. J. Pavement Eng. 2008, 9, 19–31. [Google Scholar] [CrossRef]
  11. Thyagarajan, S.; Muhunthan, B.; Sivaneswaran, N.; Petros, K. Efficient simulation techniques for reliability analysis of flexible pavements using the mechanistic-empirical pavement design guide. J. Transp. Eng. 2011, 137, 796–804. [Google Scholar] [CrossRef]
  12. Hu, S.; Zhou, F.; Scullion, T.; Leidy, J. Reliability-based mechanistic-empirical flexible pavement design. Transp. Res. Rec. 2014, 2456, 85–95. [Google Scholar] [CrossRef]
  13. Hall, K.; Xiao, D.; Pohl, E.; Wang, K. Reliability-based mechanistic-empirical pavement design with statistical methods. Transp. Res. Rec. 2012, 2305, 121–130. [Google Scholar] [CrossRef]
  14. Dinegdae, Y.H.; Birgisson, B. Reliability-based calibration for a mechanics-based fatigue cracking design procedure. Road Mater. Pavement Des. 2016, 17, 529–546. [Google Scholar] [CrossRef]
  15. Dong, Z.; Ma, X. Analytical solutions of asphalt pavement responses under moving loads with arbitrary non-uniform tire contact pressure and irregular tire imprint. Road Mater. Pavement Des. 2017, 19, 1887–1903. [Google Scholar] [CrossRef]
  16. Thompson, M.R. ILLI-PAVE Based Full-Depth Asphalt Concrete Pavement Design Procedure. In Proceedings of the 6th International Conference on Structural Design of Asphalt Pavements, Ann Arbor, MI, USA, 13–17 July 1987. [Google Scholar]
  17. AI (Asphalt Institute). Thickness Design-Asphalt Pavements for Highways and Streets, 9th ed.; Asphalt Institute: Lexington, KY, USA, 1999. [Google Scholar]
Figure 1. Viscoelastic three-layered system under a rectangular uniform moving load.
Applsci 13 00715 g001
Figure 2. Flowchart of the probability calculation.
Applsci 13 00715 g002
Figure 3. Double rectangular uniform moving load.
Applsci 13 00715 g003
Figure 4. Calculation points inside the pavement.
Applsci 13 00715 g004
Figure 5. Results of the cumulative probability distributions of (a) longitudinal tensile strain at A1 and (b) vertical compressive strain at B1 (SD0 = result for the random variables when standard deviations equal zero).
Applsci 13 00715 g005
Figure 6. Results of the probability of being less than the target mechanical responses for (a) longitudinal tensile strain at the bottom of the asphalt layer and (b) vertical compressive strain on the top of the subgrade (L40, L50, L60, L70 = target longitudinal tensile strain is 40, 50, 60, and 70 με, respectively; V80, V90, V100, V110 = target vertical compressive strain is 80, 90, 100, and 110 με, correspondingly).
Applsci 13 00715 g006
Figure 7. Deterministic results for (a) longitudinal tensile strain at the bottom of the asphalt layer and (b) vertical compressive strain on the top of the subgrade.
Applsci 13 00715 g007
Figure 8. Results of the cumulative probability distributions of vertical compressive strain at B1 with the different mean values of load pressure, speed, and temperature of the asphalt layer.
Applsci 13 00715 g008
Figure 9. Results of the cumulative probability distributions of vertical compressive strain at B1 with the different standard deviations of load pressure, speed, and temperature of the asphalt layer.
Applsci 13 00715 g009
Figure 10. Effect of the standard deviations of vehicle wandering for the probability of being less than 100 με for vertical compressive strain at different calculation points.
Applsci 13 00715 g010
Figure 11. Results of the cumulative probability distributions of the allowed number of load repetitions for (a) fatigue failure and (b) rutting (SD0 = result for the random variables when standard deviations equal zero).
Applsci 13 00715 g011
Figure 12. Results of the cumulative probability distributions for the damage of (a) fatigue failure (A4) and (b) rutting (B1) under a single random load.
Applsci 13 00715 g012
Figure 13. Results of the probability density distributions of cumulative damage for (a) fatigue failure and (b) rutting after repeated random loads.
Applsci 13 00715 g013
Table 1. Asphalt pavement material and structural parameters.
Modulus (MPa)Poisson’s RatioDensity (kg/m3)Depth (m)
Asphalt layer-0.3524000.2
Base layer10000.320000.4
Subgrade2000.41500-
Table 2. Prony series parameters of the asphalt layer.
τjgj
10000.017837
1000.022262
100.044653
10.066893
0.10.104727
0.010.105207
0.0010.164525
0.00010.002653
0.000010.451526
Table 3. WLF parameters of the asphalt layer.
Tref (°C) C1C2
2021.6170.1
Table 4. Mean values and standard deviations of random variables.
X1 (MPa)X2 (m)X3 (m/s)X4 (°C)
Mean value0.702520
Standard deviation0.10.235
Table 5. Random variables with different mean values.
X1 (MPa)X2 (m)X3 (m/s)X4 (°C)
Mean valueCase A0.702520
Case B0.502520
Case C0.902520
Case D0.701520
Case E0.703520
Case F0.702510
Case G0.702530
Standard deviation0.10.235
Table 6. Random variables with different standard deviations.
X1 (MPa)X2 (m)X3 (m/s)X4 (°C)
Mean value0.702520
Standard deviationCase 10.10.235
Case 20.050.235
Case 30.150.235
Case 40.10.135
Case 50.10.335
Case 60.10.21.55
Case 70.10.24.55
Case 80.10.232.5
Case 90.10.237.5
Table 7. Failure probability of the pavement after a given number of load repetitions.
Fatigue FailureRutting
Load RepetitionsFailure ProbabilityLoad RepetitionsFailure Probability
2.011 × 1070.00051.88 × 1080.0001
2.012 × 1070.01991.881 × 1080.0714
2.013 × 1070.21011.882 × 1080.7613
Disclaimer/Publisher’s Note: The statements, opinions and data contained in all publications are solely those of the individual author(s) and contributor(s) and not of MDPI and/or the editor(s). MDPI and/or the editor(s) disclaim responsibility for any injury to people or property resulting from any ideas, methods, instructions or products referred to in the content.

