Article

Probing the Interactions of LRP1 Ectodomain-Derived Peptides with Fibrillar Tau Protein and Its Impact on Cellular Internalization

by
E. Josephine Boder
,
Beatriz G. Goncalves
,
Charlotta G. Lebedenko
and
Ipsita A. Banerjee
*
Department of Chemistry, Fordham University, 441 East Fordham Road, Bronx, NY 10458, USA
*
Author to whom correspondence should be addressed.
These authors contributed equally to this work.
Appl. Sci. 2023, 13(2), 853; https://doi.org/10.3390/app13020853
Submission received: 15 November 2022 / Revised: 4 January 2023 / Accepted: 5 January 2023 / Published: 7 January 2023
(This article belongs to the Special Issue Recent Advances in Biological Science and Technology)

Abstract

:
Cellular internalization and the spreading of misfolded tau have become increasingly important for elucidating the mechanism of Tau pathology involved in Alzheimer’s disease (AD). The low-density lipoprotein-related receptor 1 (LRP1) has been implicated in the internalization of fibrillar tau. In this work, we utilized homology modeling to model the Cluster 2 domain of LRP1 and determined that a 23-amino-acid sequence is involved in binding to paired helical filaments (PHF) of Tau. Fourteen short peptide segments derived from this ectodomain region were then designed and docked with PHF Tau. Molecular dynamics studies of the optimal peptides bound to PHF Tau demonstrated that the peptides formed critical contacts through Lys and Gln residues with Tau. Based on the computational results, flow cytometry, AFM, SPR analysis and CD studies were conducted to examine binding and cellular internalization. The results showed that the peptide sequence TauRP (1–14) (DNSDEENCES) was not only associated with fibrillar Tau but was also able to mitigate its cellular internalization in LRP1-expressed HEK-293 cells. Preliminary docking studies with Aβ (1–42) revealed that the peptides also bound to Aβ (1–42). While this study focused on the CCR2 domain of LRP1 to design peptide sequences to mitigate Tau internalization, the work can be extended to other domains of the LRP1 receptor or other receptors to examine if the cellular internalization of fibrillar Tau can be deterred. These findings show that short peptides derived from the LRP1 receptor can alter the internalization of its ligands.

1. Introduction

Tau protein is a microtubule-associated protein known to stabilize microtubules in neurons and other cells, and it plays a major role in cellular differentiation, neurite outgrowth and polarization [1]. In a recent study, Goodson and co-workers showed through computational studies that Tau’s capacity to facilitate lateral interactions with microtubules plays a significant role in microtubule stabilization by crosslinking protofilaments. Furthermore, Tau competes with the microtubule-binding protein EB1 for binding to microtubules [2]. Additionally, Cavaco-Paulo and co-workers were able to computationally predict the three-dimensional structure of Tau protein both under simulated intracellular fluid and microtubule associated conditions. They showed that Tau can adopt different secondary structures depending on whether or not it is associated with microtubules. It was shown that tau adopts a more compact structure with few helical motifs closer to the microtubule-binding regions in simulated intracellular fluid, while when associated with microtubules, it adopts an extended conformation, with helical conformation at the microtubule-binding region, and the N- and C-terminals remain apart from each other [3]. In order to examine the mechanistic aspects involved in Tau binding to microtubules, and the impact of post-translational modifications, the group created acetylated Lys residues and phosphorylated Ser/Thr/Tyr residues and generated various acetylated and phosphorylated Tau analogs. Using molecular dynamics simulations, they demonstrated that the electrostatic changes due to the loss of positively charged Lys residues result in the disassociation from the microtubules [4]. While tau is found in healthy brain tissues, it is well-known that hyper-phosphorylated intracellular filamentous aggregates of tau lead to the formation of neurofibrillary tangles (NFTs). The formation of these aggregates has been implicated in several neurodegenerative diseases, including Alzheimer’s disease, Pick disease (PiD), progressive supranuclear palsy (PSP), corticobasal degeneration (CBD) and in dementia related to Parkinson’s disease [5]. Additionally, tau has been known to upsurge amyloid-β toxicity by modifying the activity of tyrosine kinase (Fyn), which plays a key role in tau aggregation [6]. Recent studies have also shown that in the case of synucleinopathies, in addition to the accumulation of α-synuclein, tau oligomers accumulate in diseased brains due to the formation of hybrid tau–alpha–synuclein aggregates [7]. Thus, several studies have been conducted to investigate the aggregation and spread of tau protein to elucidate neurological disease mechanisms and develop potential treatments. In one study, it was reported that changes in the microtubule-binding domain of tau protein due to hyperphosphorylation lead to its dysregulation and separation of tau from microtubules [8]. Upon separation, tau starts to misfold and aggregate intracellularly in neurons. Furthermore, the intracellular tau can not only aggregate within neurons, but those aggregates can also be transmitted between cells, leading to the spread of the aggregates. The major constituents of Tau NFTs are the paired helical filaments (PHF) and SF (straight filaments), both of which tend to form C-shaped structural subunits [9,10]. Studies using steered molecular dynamics simulations have demonstrated that the 306–311 segment of Tau that contains the sequence VQIVYK motif plays an important role in docking of soluble Tau to PHF fibrils, and further folding of Tau along the PHF fibrils occurs with the formation of β3, β4 and β5 regions [11]. Several studies have shown that tau is not only present in the cytoplasm of neurons, but it is also actively released into the extracellular regions. To that end, it has been shown that this cell-to-cell propagation of tau is promoted by the uptake of extracellular tau, which can act as a seed for soluble tau in cells and lead to the propagation and spread of tauopathies [12]. Thus, the targeting and mitigation of cellular internalization of extracellular tau is one of the therapeutic routes that may be utilized to combat the propagation of tau pathology.
Several mechanisms are involved in regulating the levels of extracellular tau, and internalization pathways have been put forward. Both monomeric and oligomeric tau have been shown to enter neurons through dynamin-dependent processes [13]. Studies have also shown that extracellular misfolded tau can be internalized through heparin sulfate proteoglycan (HSPGs) present on cell surfaces, in a similar manner as prion proteins [14]. Additionally, Tau monomers, dimers and trimers are also internalized through clathrin-mediated endocytosis and that internalization is also dependent upon HSPGs as Tau contains heparin-binding regions [15]. Several receptors such as alpha-amino-3-hydroxy-5-methyl-4-isoxazolepropionic acid (AMPA) [16] and muscarinic receptors (M1, M3) have been implicated in the internalization of tau [17]. Moreover, studies conducted by Gomez-Ramos et al. have demonstrated that soluble extracellular Tau can interact with muscarinic receptors, while PHF tau does not [18]. It has also been shown that there is an increase in microglia that express M1 and M3 muscarinic receptors in Alzheimer’s disease mice models, implicating their role in the clearance of Tau. Other proteins including leucine-rich repeat serine/threonine-protein kinase 2 (LRRK2) as well as phosphatidylinositol 3-kinase subunit type 4, which regulate endocytosis and autophagy, have also been shown to be involved in neuronal uptake of monomeric and fibrillar tau [19,20]. In another study, it was shown that over-expression of Rab-5, a Ras-related protein, also promotes tau internalization of vesicle-free tau, which subsequently accumulates in endosomes [21]. Furthermore, it has been demonstrated that beta amyloid (Aβ) peptide-induced signaling can bolster tau phosphorylation, leading to hyperphosphorylation and tau pathology [22]. In a contrasting study, however, Ittner et al. showed that site-specific phosphorylation of tau mediated by neuronal p38 mitogen activated protein kinase p38γ-mitigated Aβ toxicity [23]. In a recent study, it was also shown that tau interacts with cell membranes by binding to membrane proteins, which may lead to misfolding of tau, causing cellular dysfunction and disease [24]. While internalization of normal tau is necessary for regulated neuronal processes, the internalization of pathological forms of tau such as misfolded, pseudo-phosphorylated tau proteins disrupts normal neuronal processes and causes aggregation and propagation of tauopathies. Research focusing on the mechanisms by which healthy neurons uptake extracellular misfolded tau during trans-synaptic seeding has aimed to study both the cellular components and specific tau morphologies involved in this process. Anti-tau antibodies have been developed to deter the uptake and spread of pathological extracellular tau [25]. Antibodies that can distinguish between healthy and diseased tau and block the uptake of diseased tau have also been developed [26]. Furthermore, antibodies developed against the first-in-man tau vaccine, AADvac1, were shown to promote uptake of diseased tau proteins that that were subsequently removed by microglial cells.
In a pioneering study by Rauche, it was reported that the endocytic cell surface apo E receptor, low-density lipoprotein-related receptor protein 1 (LRP1), can regulate tau uptake and spread across cells [27], and that lysine residues in the microtubule-binding domain of tau play a key role in binding with LRP1. Because LRP1 is expressed not only in neurons, astrocytes, endothelial cells and microglia, but also other tissues such as liver, lungs and adipose tissue, it can recognize a variety of ligands, thus making the investigation of tau internalization processes through LRP1 highly significant [28]. In a recent study, Strickland and co-workers demonstrated that LRP1 had a high affinity toward the microtubule-binding domain of tau and internalized tau isoforms rapidly, which was then degraded by lysosomes. Furthermore, LRP1-expressing cells also showed lysosomal escape of post-translationally modified tau and promoted cytosolic seeding of tau, thus implying different uptake mechanisms due to changes in conformation [29].
The LRP1 receptor belongs to the LDLR family, and comprises five domains [30]. The extracellular α-chain contains four clusters (CCRs1 through 4) comprising complement-like repeats and EGF-like domains. Specifically, CCR2 and CCR4 contain 8 and 11 complement-like repeats (CRs) and have been shown to be involved in a majority of the ligand-binding activity [31,32,33], while CCR1 and CCR3 play a lesser role in ligand binding [34]. Recently, it was shown that the molecular chaperone RAP (receptor-associated protein) forms a complex with LRP1 through vital lysine residues present on RAP, which are critical for binding to complement repeat domains of LRP1 [35,36]. In a separate study, docking studies of ribosome-inactivating proteins alpha-momorcharin (α-MMC), trichosanthin (TCS) and Momordica anti-HIV protein (MAP30) with LRP1 revealed strong interactions with complement repeat CR56 subunit of Cluster 2 and CR17 subunit of Cluster 3 domains of LRP1 [37].
In this work, we sought to determine if short peptide sequences derived from LRP1 ectodomain could potentially be utilized for binding to paired helical fragments of Tau and mitigate its internalization into LRP1-expressed cells. As the crystal structure of LRP1 protein remains unsolved, we determined the structure of its Cluster 2 (CCR2) via homology modeling. Homology modeling has been used extensively to predict the 3D structures of proteins and is regarded as one the most accurate methods of protein structure prediction [38]. It has been used to predict the structures of proteins, including SARS-CoV [39], umami receptor T1R1/T1R3 [40] and many rhodopsin structures [41].
We first determined the structure of LRP1 Cluster 2 (CCR2) domain via homology modeling. The site of interaction between the homology-modeled region of LRP1 and the paired helical filament (PHF) (PDB ID: 5O3L) [42] of tau protein was then determined. The results showed that tau interacted with a 23-amino-acid segment (SKAWVCDGDNDCEDNSDEENCES) of LRP1 containing cysteine-rich complement-type domain of CR 3–10 region in Cluster 2 (CCR2), particularly making critical interactions with complement-type repeat 9 (CR9) region containing the segment DNDCEDNSDEE (residues 1128–1138). In previous studies, it has been shown that CR9, specifically GDNDSEDNSDEENC (residues 1127–1140) are also critical for LRP1-mediated internalization of aggregates of LDL (agLDL) [43].
We then designed fourteen different short peptide sequences each containing 10-amino-acid residue peptides from sections of the 23-amino-acid sequence of the LRP1 Cluster 2 (CCR2) to examine binding interactions with tau. Docking studies were first conducted with the 14 peptides. Seven of those peptides which showed binding interactions with PHF Tau were subjected to additional blind docking with increased exhaustiveness. We then conducted molecular dynamics (MD) simulations of four of the peptide sequences that showed optimal binding with PHF Tau. The sequences are referred to as (a) TauRP1-2 (KAWVCDGDND), (b) TauRP1-4 (WVCDGDNDCE), (c) TauRP1-8 (GDNDCEDNSD) and (d) TauRP1-14 (DNSDEENCES) that showed optimal binding. Of the four peptide sequences, TauRP1-14 (DNSDEENCES) showed the most stable binding according to MD simulations. Therefore, it was selected for further laboratory analysis as a proof of concept.
Binding interactions of the sequence DNSDEENCES (Tau RP1-14) with fibrillar tau were examined using circular dichroism (CD) spectroscopy. CD studies showed that the peptide caused tau to change its conformation, forming a relatively more disordered structure. This suggests that the TauRP1-14 peptide induces a conformational change in tau, which may limit its interaction with the LRP1 receptor. Additionally, SPR analysis was carried out to examine the impact of tau binding on LRP1 receptor expressing HEK 293 cells in the presence and absence of DNSDEENCES. Our results indicated that binding interactions with the cells were reduced in the presence of DNSDEENCES. In addition, flow cytometry studies confirmed that tau internalization was reduced. Overall, these results indicate that the sequence DNSDEENCES derived from the CCR2 portion of the ligand-binding region of LRP1 potentially has the capability of reducing fibrillary tau internalization in vitro.
While in this work, we modeled LRP1 subdomain 2 and utilized peptides derived from this region, and explored their effects on Tau binding and uptake, it can be potentially expanded to study the impact of other subdomains in tau uptake. Additionally, we also conducted preliminary docking studies of the four selected peptides (TauRP1-2, TauRP1-4, TauRP1-8 and TauRP1-14) with some of the other common ligands of LRP1, including the β-amyloid peptide Aβ (1–42), MMP-13, APOE4 and ADAMTS-4, to examine if the designed peptides could also interact with those ligands and either co-internalize or possibly act as competitors. This study represents an important step forward in the use of computational tools and in vitro studies to pre-screen peptides derived from LRP1 that may affect the tau–LRP1 interaction and could provide a template to mitigate LRP1-mediated internalization of fibrillar Tau.

2. Materials and Methods

2.1. Materials

The TauRP1-14 (DNSDEENCES) and Angiopep-2 (TFFYGGSRGKRNNFKTEEY) peptides were custom ordered from GenScript. Flow Cytometry Staining Buffer was obtained from Thermo Fisher Scientific (Waltham, MA, USA). N-hydroxysuccinimide (NHS), 1-ethyl-3-(3-dimethylaminopropyl) carbodiimide (EDAC), dimethylformamide (DMF), heparin sodium salt, gelatin from cold water fish skin and fibronectin were purchased from Sigma-Aldrich (St. Louis, MO, USA). Dulbecco’s modified eagle medium (DMEM) with L-glutamine, 1X Dulbecco’s phosphate-buffered saline (PBS) and HEK-293 cell line (CRL-1573) were purchased from ATCC (Manassas, VA, USA). Fetal bovine serum (FBS) was purchased from Neuromics (Edina, MN, USA), and 0.05% Trypsin-EDTA 1X, Lipofectamine 3000 Transfection Kit and PureLink HiPure Plasmid Filter Maxiprep Kit were purchased from Thermo Fisher Scientific (Waltham, MA, USA). The mammalian expression vector in glycerol stock was obtained from VectorBuilder (Chicago, IL, USA). The rabbit anti-chicken antibody DyLight 488-conjugated and chicken anti-tau antibody were purchased from Rockland (Gilbertsville, PA, USA). Tau-441 (Cat # T-1001-1) was obtained from rPeptide (Bogart, GA, USA), and the thioflavin T was obtained from Alfa Aesar (Haverhill, MA, USA). Luria agar high-salt formula was purchased from Research Products International (Mount Prospect, IL, USA), and Difco Super Optimal Broth medium was obtained from BD (Franklin Lakes, NJ, USA).

2.2. Methods

2.2.1. Homology Modeling of LRP1

We determined the structure of Cluster 2 (CCR2) of LRP1 via homology modeling using Phyre2 software [44]. First, the webserver UniProt was used to find the fully sequenced LRP1 human sequence (Uniprot # Q07954) [45]. The sequence was then downloaded as a .fasta file and input onto Phyre2 on the normal modeling mode for homology modeling. The results from Phyre2 ranked a total of 120 thread templates based on the raw alignment scores, which showed 626 residues (14% of sequence coverage) with >99% confidence and 34% coverage (1530 residues) with >90% confidence. Only those with >99% confidence (20 templates) were then modeled. The twenty template threads, confidence scores and % i.d. along with template information are shown in Supplementary Materials Table S1. Phyre2 uses computational homology detection methods to predict and model protein 3D structures through template-based modeling (TBM), which encompasses methods that compare a protein sequence of interest with sequence databases of proteins with known structures which are then aligned on the basis of evolutionary variation and undergo fold library scanning [46]. The top-ranked model generated from Phyre2 was then opened on PyMol (2.5.2) for further analysis.

2.2.2. ClusPro

ClusPro is a rigid body protein–protein docking server effective for docking multiple large protein constructs using the webserver ClusPro [47]. It performs rigid body docking using the docking algorithm PIPER by sampling through billions of conformations of both interacting proteins while recording the energies at each point and at the end minimizing the energy of the selected final docking structures [48]. We used ClusPro to determine the binding site of the homology modeled structure of LRP1 obtained from Phyre2 with PHF tau. Once the job was completed, it ranked 10 models based on the lowest energy of the clusters of the docked proteins. We then determined the binding site to be a 23-amino-acid sequence (SKAWVCDGDNDCEDNSDEENCES) on the LRP1 model.

2.2.3. PrankWeb

The webserver PrankWeb was used to further validate the binding of the LRP1 segment to PHF tau. PrankWeb is a web interface that uses machine learning models based on physico-chemical, structural and evolutionary features of a protein to detect ligand able points which are then output as a list of binding pockets [49]. Specifically, the PDB ID: 5O3L of the PHF tau was directly input into the web server, which generated a total of 36 possible binding pockets. The pocket with the highest binding score was then determined to define its location on the protein.

2.2.4. Peptide Design

To determine the most optimal sequence involved in binding to PHF Tau, we designed fourteen short peptide sequences each containing 10 amino acid residues from different sections of the 23-amino-acid sequence of the LRP1 Cluster 2 (CCR2), as determined by ClusPro. Beginning with the N-terminal of the 23-amino-acid sequence SKAWVCDGDNDCEDNSDEENCES, each peptide containing 10 amino acids was designed such that the first residue was cleaved for each consecutive peptide. Thus, 14 peptides were designed such that the final peptide (TauRP1-14) contained the C-terminal (DNSDEENCES), while the first peptide (TauRP1-1) contained the sequence SKAWCDGDND. This way, short segments of the entire 23-amino-acid sequence could be explored to determine the most optimal binding sequence with PHF Tau.

2.2.5. I-TASSER Studies

To determine the secondary structures of the 23-amino-acid sequence derived from the Cluster 2 domain of LRP1 as well as all that of the fourteen designed peptide sequences, I-TASSER studies were conducted. I-TASSER (Iterative threading assembly refinement) utilizes a multi-threading approach (LOMETS) from structural templates obtained from PDB. Then, re-threading is carried out to determine functional properties through 3D models obtained from BioLiP database [50,51,52]. The ten best templates of the highest significance in the threading alignments, as measured by Z-scores, were utilized. The template with the highest Z-score was selected from each threading program and compared to predict the secondary structures. Fasta files of each of the sequences were uploaded to the I-TASSER server, and the results obtained were then analyzed.

2.2.6. Molecular Docking

Molecular docking studies were carried out using AutoDock Vina v.1.2.0 [53,54]. Prior to initiating docking studies, the PHF tau (PDB ID: 5O3L) was first downloaded from the RCSB Protein Databank web server as .pdb file and opened on AutoDockTools (1.5.6). To examine if the peptides also interacted with additional ligands of LRP1, docking studies were carried out with β-amyloid peptide (Aβ (1–42)), apolipoprotein E4, MMP-13 and ADAMTS-4 using PDB IDs 5OQV, 1GS9, 1AYO, 2OW9 and 4WQI, respectively [55,56,57,58]. On the autodock tools interface, water molecules were deleted and polar hydrogen bonds and Kollman charges were added. The file was then saved as a .pdbqt file. The .pdb files of the each of the ligands mentioned above, including structures of fourteen different peptides generated by selection from the 23-amino-acid sequence of CCR2 LRP1, were generated on PyMOL (2.5.2) [59]. The ligand .pdb file was then opened on the AutoDockTools (1.5.6) workspace where the water molecules were deleted and were also saved as a .pdbqt file. The .pdbqt file for the receptor and ligand were then both opened on the AutoDockTools (1.5.6) workspace where a grid was created in the receptor indicative of the region where AutoDock Vina v.1.2.0 would perform the docking. For the fourteen peptides, two rounds of docking were conducted. The first round of blind docking conducted using Autodock Vina v.1.2.0 consisted of the peptides that were docked to PHF tau at an exhaustiveness of 8 with a grid box size of 126 Å × 126 Å × 100 Å centered at 155.334, 125.441, 142.729 (x, y, z). The second round of docking (7 peptides) was carried out using a grid box of size 90 Å × 90 Å × 100 Å and the exhaustiveness was increased to 16. At the end of those docking studies, a .txt file was generated with the binding affinities of the nine best conformations. The output structures displaying binding to the LRP1 pocket and with the highest binding affinities from Autodock Vina v.1.2.0 were used for further MD simulations. For docking with MMP-13, beta-amyloid peptide, ApoE4 and ADAMTS-4, a single round of docking was conducted with a grid box size of 90 Å × 90 Å × 90 Å with exhaustiveness of 16. The docked structures obtained were then transferred to PyMOL and analyzed.

2.2.7. Molecular Dynamics Simulations

The receptor–ligand MD studies were conducted using Desmond in Schrodinger Suites version 2021-4 and the OPLS4 force field for 100 ns with each of the receptor–ligand complexes [60,61,62,63]. The output receptor–ligand structures from AutoDock Vina were used as MD inputs. Maestro’s Protein Preparation Wizard was used to prepare the PHF tau (PDB ID: 5O3L) receptor structure by assigning bond orders with the CCD database, creating disulfide bonds, adding hydrogens and generating ionization states using Epik at pH 7.4 [64]. The system builder option on Maestro was used to define the simulation box boundary along with the buffer distance between the solute structures and the box. For this simulation, an orthorhombic box was used with distances (side lengths) of 10 Å away from the receptor–ligand structure along on all sides. For solvation, SPC water molecules were used, and the system was neutralized through the addition of either Na+ or Cl counter ions. The system was set up with a 0.15 M NaCl concentration. Each simulation began with Brownian Dynamics in the NVT ensemble (T = 10 K) with restraints on solute heavy atoms and small time steps of 100 ps. Next, NVT equilibration was run (T = 10 K) with restraints on solute heavy atoms and small time steps for 12 ps. Next, NPT equilibration was run (T = 10 K) with restraints on solute heavy atoms for 12 ps, followed by NPT equilibration (T = 300 K) with restraints on solute heavy atoms for another 12 ps. Finally, NPT equilibration was run (T = 300 K) with no restraints for 24 ps. The production MD was run in the NPT ensemble (T = 300 K) for 100 ns with a time step of 2 fs. We first simulated the system in NVT ensemble with Brownian dynamics at 10 K with solute heavy atoms restrained to ensure that the system does not become unstable. Furthermore, low temperatures facilitate constraining of the atoms in small time steps. Fixed volume was utilized to avoid abrupt changes in the volume due to strong attractive or repulsive forces. The initial NVT runs with backbone atoms constrained thus allowed side chain atoms to begin slow movement. After the system was equilibrated at a low temperature, we increased the temperature to the desired temperature (300 K) and used the preferred ensemble with no restraints [65]. This method also allows for initial minimizations to remove undesired contacts between solvating water molecules introduced into box. The Maestro simulation interactions diagram was used to summarize the stabilities and interactions of the structures for each simulation. Upon completion of the receptor–ligand MD studies, the Desmond Trajectory Frame clustering option on Maestro was utilized to perform clustering calculations on structures based on the RMSD matrix of trajectory files. The trajectory and frames for each run were specified via the –out.cms file that had been generated from the receptor–ligand MD studies. The RMSD of the backbone for the clustering was set to calculate at every tenth frame after 75 ns. Using the RMSD matrix, the affinity propagation clustering method [66] was then used to cluster the frames. Once the clustering job was completed, it generated a .cms file with a frame from each cluster as well as a log file containing the total number of clusters as well as their sizes.

2.2.8. MMGBSA Energy Calculations

The molecular mechanics/generalized Born surface area (MMGBSA) method was used to calculate and compare the relative binding free energies of each receptor–ligand combination [67]. The Prime tool in Schrodinger’s Maestro was used to calculate free energies from each MD trajectory using the thermal mmgbsa.py script [68,69]. Free energies were averaged over all 100 ns of each simulation and compared. The free energy of binding is calculated as ΔG (bind) = ΔG (solv) + ΔE (MM) + ΔG (SA), where ΔG solv is the difference in solvation energy of the ligand–receptor complex and the sum of the solvation energies for the free ligand and receptor. ΔE (MM) is the difference in minimized energies between receptor–ligand complex and the sum of the energies of the free ligands and receptor. Finally, ΔG (SA) is the difference in surface area energies of the ligand–receptor complex and the sum of the surface area energies of the free ligands and receptor. A generalized Born model with an external dielectric constant of 80 and an internal dielectric constant of 1 was used for the polar effect of free energy, and the solvent-accessible surface area (SASA) was used for the non-polar energy contribution.

2.3. Laboratory Methods

2.3.1. E. coli Culture

Super Optimal Broth medium was prepared by dissolving 28 g of the Super Optimal Broth powder in 1 L of deionized water. The medium was autoclaved at 250 °F for 15 min on the glassware cycle. To the liter of Super Optimal Broth medium, 0.5 mL of ampicillin stock (100 mg/mL) was added. This was then stored at 4 °C until usage.
For the culture of E. coli, the Luria Agar–Amp medium was prepared according to the instructions provided. Briefly, 40 g of the powdered medium was dissolved in 1 L of deionized water followed by heating to near boiling point to completely dissolve the agar. This mixture was then sterilized in the autoclave’s glass cycle for 15 min. Next, 0.5 mL of ampicillin stock was added (100 mg/mL). The Luria Agar–Amp medium was then poured into several Petri dishes where they solidified to agar consistency at room temperature for a day. The next day, E. coli expression vectors containing the plasmid with the LRP1 gene of interest were inoculated on the Luria Agar–Amp plates, wrapped in parafilm and allowed to form colonies in the Genie Temp-Shaker 300 at 37 °C for 14 h. The next day, the plates were stored at 4 °C to halt growth. This is because overgrowth of bacteria will acidify the media and potentially kill all the remaining E. coli [70]. One colony was then taken from a Petri dish to ensure that only one clone was used in the experiment.

2.3.2. DNA Purification and Extraction

Once a colony of transformed E. coli had been chosen, it was then inoculated using aseptic techniques in 3 mL of Super Optimal Broth–Amp media while shaking for 8 h at 250–300 rpm and 37 °C to further amplify the plasmid of interest. This culture was then used to inoculate 250 mL of pre-warmed Super Optimal Broth–Amp media which was incubated in the shaker at 37 °C, 250–300 rpm for 16 h, at which point the DNA was ready to be harvested and purified via a PureLink HiPure Plasmid Filter Maxiprep Kit. This is a common method that has been used to extract and purify plasmids from E. coli-transformed cells [71,72].
To begin DNA extraction from the E. coli, 30 mL of equilibration buffer was added to the combined filter and DNA binding column. As the column was emptying through gravity flow, the overnight Super Optimal Broth–Amp culture was centrifuged at 4000× g for 10 min, followed by decantation of the supernatant. The pellet was then re-suspended in 10 mL of a resuspension buffer containing RNase A, followed by 10 mL of lysis buffer. This was gently mixed and then incubated at room temperature for 5 min. Next, 10 mL of precipitation buffer containing acetic acid was added to the lysate and centrifuged at 9000× g for 20 min. Once the DNA-binding column had been drained and the column was equilibrated, the supernatant containing the plasmid of interest was passed through the column and retained in the filter. To harvest the plasmid, 15 mL of elution buffer was added to the column, which was drained into a sterile 50 mL centrifuge tube containing the purified DNA. The eluate was then washed with 10.5 mL of 2-Propanol and centrifuged at 9000× g for 45 min at 4 °C. The DNA pellet was then washed in 5 mL of 70% ethanol and was centrifuged once again at 9000× g for 10 min at 4 °C. The pellet was then air-dried and resuspended in 400 µL of Tris-EDTA (TE) buffer. The plasmid DNA was then stored at −20 °C until the day of usage.

2.3.3. DNA Quantification

To quantify the concentration of DNA plasmid that was obtained from the Maxiprep procedure, UV–Vis spectroscopy was used to determine the nucleic acid concentration and based on the intensity at a wavelength of 260 nm.

2.3.4. Mammalian Cell Culture

HEK-293 cells (ATCC-CRL-1573) were cultured in Dulbecco’s modified eagle medium (DMEM, Quality Biological, Gaithersburg, MD, USA) supplemented with 10% fetal bovine serum, 3 mL of antibiotic-antimycotic, and 100 µg/mL of penicillin/streptomycin. The cells were then incubated in humidified conditions at 37 °C and 5% CO2 levels. The medium was changed every 2–3 days; the cells were split twice a week.

2.3.5. Mammalian Cell Transfection

When the HEK-293 cells were confluent, 24 h prior to transfection, they were plated at a seeding density of 1 × 10⁶ cells/well in 5 wells of a 6-well Falcon polystyrene tissue culture plate with 2 mL of DMEM media. The following day, the cells were washed with 1X PBS, followed by the addition of 1 mL of serum-free DMEM media. The cells were thus prepared for transfection with the mammalian expression vector containing the entire cDNA sequence of LRP1 (Vector Builder ID: VB900000-1445uqu) using Lipofectamine 3000 (Thermo Fisher Scientific, MA, USA).
To begin transfection, Lipofectamine 3000 (30 µL) was diluted in 500 µL of serum-free media at 37 °C, followed by vortexing for 10 s. Then, lipofectamine (132 µL) was aliquoted into a separate centrifuge tube, followed by the addition of 125 µL serum-free media which was used as the mock transfection mixture. Next, 4.4 µL of the plasmid DNA extracted from E. coli was diluted in 375 µL serum-free media, followed by the addition of 15 µL of p3000 reagent. The entire diluted DNA solution was then added to the remaining volume of the diluted Lipofectamine mixture and mixed for 10 s. After an incubation period of 10–15 min, about 250 µL was added to each well; the mock transfection mixture, without the DNA plasmid, was added to a separate well as a control. The well plate was incubated for 24 h at 37 °C and 5% CO2 levels to allow for expression of recombinant protein.

2.3.6. Preparation of Tau Fibrils

In order to replicate the misfolding of tau that occurs in tauopathies such as Alzheimer’s disease, fibrillar tau was prepared using tau isoform (Tau-441). The isoform protein was initially diluted to a concentration of 10 µM in 1X PBS with 1 mM DTT and 0.05 mg/mL heparin, as described in previously established methods [73]. This was then incubated while shaking at 37 °C for 5 days in the Genie Temp-Shaker 300 at 110 rpm. Fibrils were then aliquoted and frozen at −20 °C until the day of use.

2.3.7. Thioflavin-T Assay

To confirm that fibrils had been formed, we conducted a Thioflavin-T Assay [74]. Thioflavin-T (ThT) is a dye whose fluorescence emission is largely enhanced upon binding with fibrillar compounds as a result of rotational immobilization of its benzylamine and benzathiole rings around the shared carbon bond [75]. For the assay, 500 μL of 1 mM ThT dye (in deionized water) was added to Tau samples (3.5 μg/mL, 500 μL). The sample was excited at 480 nm with emission at 510 to 600 nm at a slit of 3 nm.

2.3.8. Antibody Labeling

In order to label the tau fibrils for flow cytometric analysis for cellular uptake studies, chicken anti-tau was used as the primary antibody to bind to fibrillar tau. The secondary antibody, rabbit anti-chicken antibody DyLight 488-conjugated, was then attached to the primary antibody bound to Tau. Fluorochrome secondary labeled antibodies have been widely used for flow cytometric analysis as they reduce background fluorescence uptake and typically achieve better staining [76].
Before the tau internalization assay, 50 µL of tau fibril solution (30 µM) was thawed and treated with of TauRP1-14 peptide (40 µM) and incubated at 4 °C for 24 h to allow for binding. The mixture was then centrifuged to remove any unbound peptide. Then, 0.5 µL of the primary antibody was incubated with the Tau-RP1-14 bound to Tau protein and allowed to shake for 24 h at 4 °C. Then, the secondary antibody (50 μL) was added to the solution and shaken at 4 °C for another 24 h and centrifuged for an hour to remove any unbound antibody. For the control experiment, antibody labeling was carried out in a similar manner with 50 µL of fibrillar tau but without TauRP1-14. The antibody-bound Tau or Tau associated with TauRP1-14 was then incubated for an hour on ice in complete darkness and added to well plates containing the LRP1-expressed HEK-293 cells at a density of 1 × 10⁶ cells/well. The samples were incubated at 4 °C for 30 min. Another control containing non-transfected untreated cells was also created. Because angiopep-2 sequence is known to internalize cells through the LPR1 receptor, we created another well, where angiopep-2 was used as the positive control. For those solutions, angiopep-2 (40 μM) was added to the antibody-bound Tau fibrils associated with TauRP1-14 and incubated for 24 h at 4 °C. Then, those samples were also treated with LPR1-expressing HEK-293 cells and studied.

2.3.9. Tau Internalization Assay

A Tau internalization assay was conducted to confirm whether the TauRP1-14 peptide influenced LRP1-mediated internalization of fibrillar tau. To start, the well plates that had been incubating at 4 °C was transferred to the Genie-Shake Temp 300 at 37 °C for 30 min to trigger internalization of the labeled tau [77]. After incubation, the medium was removed and the cells from each sample were washed with 1X PBS. The cells were then trypsinized followed by the addition of 1 mL of media to neutralize the trypsin. The contents of each well were then transferred to individual Eppendorf tubes and spun at 500× g for 5 min. The supernatant was then removed, and the pellet was re-suspended in FACS buffer. Each sample was then transferred to a FACS tube by first being filtered through the filter caps. These were then analyzed using flow cytometry studies.

2.4. Characterization

2.4.1. Dynamic Light Scattering

To confirm the formation of aggregates of tau, dynamic light scattering analysis was performed using the Zetasizer Ultra from Malvern Panalytical [78]. The tau aggregates, 50 µL (40 µM), were diluted in water for the study. Samples were measured in triplicate and water was used as a control.

2.4.2. Surface Plasmon Resonance

Surface Plasmon Resonance (SPR) techniques have been widely explored to study real-time transient binding interactions with cells and analytes by measuring the refractive index changes on a gold chip [79]. To coat LRP1-expressed cells on the chip (Platypus Technologies, Fitchburg, WI, USA), they were immersed overnight at 4 °C with a mixture of 4 µg fibronectin and 200 µg gelatin (60 kDa) per mL of water. After 24 h, the chips were transferred into a 6-well polystyrene well plate where the LPR1-expressed transfected HEK-293 cells were added. The gold chips attached to cells were then submerged in media and incubated at 37 °C and 5% CO2 levels for 48 h to reach confluence. Once the cells were confluent, SPR analysis was carried out. We first tested the binding interactions of fibrillar Tau as analyte to examine if LRP1-mediated binding with cells occurred. Two different concentrations of Tau solution were used (40 μM and 30 μM). Samples were prepared in PBS buffer and were allowed to flow through the sample at flow rate of 50 μL/min. We then tested the binding interactions of samples with various concentrations of the peptide DNSDEENCES (TauRP1-14) pre-associated with 30 μM fibrillar Tau. The concentrations of DNSDEENCES utilized included 10 µM, 20 µM and 40 µM. Prior to running SPRs, samples were incubated at 4 °C for 72 h and shaken at 100 rpm to allow the peptide to associate with tau fibrils. Each tau-bound peptide solution was then allowed to flow thorough the Horizon SPRimager v2.0. The (%ΔR) over time in seconds for the region of interest selected on the chip was measured. The percent change in reflectivity indicates the measured response due to the bound analyte to the immobilized LRP-expressing cells [80], which was then examined.

2.4.3. Circular Dichroism Spectroscopy

Circular Dichroism (CD) spectroscopy was used to determine the impact of TauRP1-14 peptide association with Tau fibrils in a concentration-dependent manner [81]. The samples that were analyzed included 10 µM, 20 µM and 40 µM of TauRP1-14 peptide associated with 30 µM Tau fibrils. These were analyzed in the range of 190 to 260 nm using a Jasco J-1500 CD Spectrophotometer. The generated spectra were then opened as a text file and submitted to the webserver BeStSel with input units selected to be mean residue ellipticity/1000 at a scale factor of 1. BeStSel determines secondary structures and fold recognition of circular dichroism spectra [82].

2.4.4. Fluorescence Spectroscopy

Fluorescence Spectroscopy was conducted using the Jobin Yvon Fluoromax 3 fluorescence spectrometer. The samples were excited at 480 nm with emission at 510 to 600 nm at a slit of 3 nm. The results were plotted to show the emission spectra.

2.4.5. UV–Vis Spectroscopy

The Thermo Scientific NanoDrop 2000c Spectrophotometer on the nucleic acid setting was used to determine the final concentration of DNA. Tris-EDTA (TE) buffer was used as the blank sample. The concentration of the plasmid DNA obtained from E. coli was determined to be 1730.4 ng/µL.

2.4.6. AFM

To examine the morphologies of Tau aggregates before and after association with Tau-RP1-14, we imaged the samples using a Bruker multimode 8 atomic force microscope (AFM). Samples were placed on mica sheets and air-dried before analysis. Imaging was conducted in contact mode using a CONTV-A cantilever, with a frequency of 13 KHz, spring constant of 0.2 N/m and tip radius of 10 nm. Samples were imaged at various magnifications in at least five different positions for each sample. Additionally, the surface roughness was also measured to determine the maximum roughness depth, average roughness and RMS values.

2.4.7. Flow Cytometry Analysis

For flow cytometry experiments, we used the BD FACSMelody flow cytometer and the software FlowJo v10.8. for analysis. Gating was performed first on the FSC-A/SSC-A scatter plot to exclude dead cells and non-singlets, and on FSC-A/FSC-W and SSC-A/SSC-W for a more detailed exclusion of doublets and triplets, respectively. Samples were analyzed for DyLight 488 at an excitation wavelength of 493 nm and an emission of 518 nm. The data were plotted as a histogram with log scale.

3. Results and Discussion

3.1. Homology Modeling

The LRP1 receptor has been shown to bind to a large array of biologically significant ligands [83], making investigation of binding interactions with LRP1 critical [84]. Because the crystal structure of LRP1 has yet to be elucidated, we performed homology modeling to obtain a model of LRP1 using Phyre2. This program was able to generate a model structure based on the same region of the low-density lipoprotein receptor (LDL) ectodomain (PDB ID: 1N7D) [85] having a sequence identity of 36% and a confidence level of 100%. In previous work, Phyre2 also was used to predict the structure of wild-type carbonic anhydrase II with a sequence identity of 36% [86]. The sequence template homology of LRP1 found ranges from amino acid residues 933 to 1581 which contain the cysteine-rich complement-type repeat 3–10 (CR 3–10) of Cluster 2 (CCR2) of LRP1. The homology model agrees with previous studies that have identified LDL receptor to be structurally similar to LRPs [87]. The results are shown in Figure 1. As seen in Figure 1a, the original structure generated from Phyre2 is folded back. This is because this structure was modeled from LDLR at endosomal low pH levels where the receptor adopts a closed conformation. This causes the CRs to associate with the β-propeller region to release its bound LDL and prevent apolipoprotein E (ApoE) and other ligands from binding [88] Since the structure of the LRP1 receptor has not yet been fully elucidated, it is unknown whether it also adopts a closed conformation similar to the LDLR; however, studies have shown that the CRs are the most active regions for ligand binding, while the β-propeller region is mainly only essential in dissociation of ligands in endosomes. Since the aim of this work was to examine the interaction of tau protein with the LRP1 receptor, the β-propeller region that was arching over the CRs was truncated in order to allow binding of tau. The final structure, containing the CR 3–10 of CCR2 (Figure 1b), was then used to determine its affinity to the tau protein, since previous studies have shown that the LRP1 CCR2 cluster is involved in ligand binding.

3.2. Binding Interactions with PHF Tau

To explore the interactions between the CCR2 domain and paired helical tau filament (PHF) (PBD ID: 5O3L), we utilized ClusPro. The results from the highest ranked model were used, which revealed a 23-amino-acid segment (SKAWVCDGDNDCEDNSDEENCES) that appeared to be primarily involved in the interaction of PHF tau and the homology modeled structure of LRP1. In particular, the LRP1 CR9 in the CCR2 subunit (1128–1138, DNDCEDNSDEE) showed optimal interactions, suggesting that this region is implicated in LRP1–tau interaction, as seen in Figure 2. To further validate the binding site of LRP1 with PHF tau, we used PrankWeb to determine if the 23-amino-acid LRP1 sequence was in fact binding to the binding site of the PHF tau with the highest pocket score. The results obtained confirm the binding interactions, as shown in Figure 3 and in Table 1. These results further suggest that the LRP1 23-amino-acid segment binds to the highest pocket probability of PHF tau.
Several studies have shown that short peptide sequences often have critical molecular properties that can influence cellular pathways and binding abilities. Thus, short peptides are being widely studied not only to determine mechanistic details, but also for the development of novel peptide-based therapeutics due to their targeting abilities, among others [89,90,91]. Based on the results obtained from ClusPro and PrankWeb, we derived fourteen short peptide sequences by creating 10-amino-acid sections from the 23-amino-acid sequence binding region of LRP1. The goal in doing so was to explore the binding ability of each of these short peptide sequences toward PHF Tau and thereby competitively reduce LRP1-mediated tau internalization. In previous work, it has been shown that peptides derived from the extracellular domain of receptors can selectively inhibit the internalization ability of its own ligands [92]. The sequences designed are shown in Table 2.

3.3. I-TASSER Studies

To determine secondary structural elements of the 23-amino-acid sequence from the Cluster 2 domain of LRP1 as well as each of the fourteen designed peptides, we conducted I-TASSER studies. The results obtained are shown in Table 3. In general, the C-Score values are predicted in a range of −5 to +2. Based on the C-Scores obtained, the highest C-Score was seen for TauRP (1–10) and the lowest was seen for TauRP (1–12). The results were obtained from calculations from threading template proteins from the PDB in combination with the sequence profiles derived from sequence databases. The top ten threading templates of highest significance were selected for determining the secondary structures, as shown in Supplementary Materials Table S2. Overall, the results obtained predict mostly coiled structures for most of the peptides, with the exception of TauRP (1–2) and TauRP (1–1), which also showed the presence of β-strands, and TauRP (1–14), which included helices along with coils. The 23-amino-acid sequence showed the presence of coils, helices and beta-strands. In addition, the TM (template modeling) scores, which are usually in the range of 0 to 1, provided a quantitative comparison of the similarities between the predicted and template structures. The results obtained showed a TM score between 0.6 and 1.0.

3.4. Molecular Docking Studies

3.4.1. Docking Studies with PHF Tau

Blind docking studies were conducted to determine the binding interactions with PHF Tau, and those peptide sequences that did not bind to the PHF Tau binding sites were excluded after the first round of blind docking. The sequences that were excluded included SKAWVCDGDN (TauRP1-1), AWVCDGDNDC (TauRP1-3), VCDGDNDCED (TauRP1-5), DNDCEDNSDE (TauRP1-9), NDCEDNSDEE (TauRP1-10), DCEDNSDEEN (TauRP1-11) and CEDNSDEENC (TauRP1-12). We then performed a second round of blind docking using the seven remaining peptides and decreased the size of the grid box while increasing the exhaustiveness because it has been shown that increasing the exhaustiveness results in a more comprehensive search, which decreases the probability of missing the best docking conformation [93]. With these adjusted parameters, four of the seven peptides were found to bind within the tau binding pocket. The results are shown in Table 4 and Figure 4. These sequences included KAWVCDGDND (TauRP1-2), WVCDGDNDCE (TauRP1-4), GDNDCEDNSD (TauRP1-8) and DNSDEENCES (TauRP1-14). Of these, TauRP1-2 had a binding affinity of −4.3 kcal/mol and was almost fully folded on itself while in close proximity to amino acids R349 and K353 on the tau protein. TauRP1-4 binds within the pocket in binding modes 1 and 2 with binding affinities of −4.4 kcal/mol. The first binding pose is located close to Q351 and is also folded on itself, whereas the second binding pose, although in a similar binding position, is more spread out and in proximity to the K359 of the tau binding pocket. TauRP1-8 seems to be embedded in the pocket, as it appears to interact with tau with residues ranging from Q351 to K369. This corroborates with its comparatively higher binding affinity of −4.9 kcal/mol. Lastly, the TauRP1-14 peptide bound in a highly similar conformation to the corresponding 23-amino-acid peptide in LRP1 and demonstrated the highest binding affinity (−5.7 kcal/mol) in binding mode 2. This peptide also binds to the tau protein and is in close proximity to residues K353 to K369 of the tau protein. The residues K353 and K369 of Tau protein are particularly significant due to their role in glycation and are known to prevent binding with microtubules [94,95].
Given these results, we then performed molecular dynamics studies of the docked PHF complexes with the above four peptide sequences to determine the stability of the complexes.

3.4.2. Docking Studies with Additional Ligands Implicated in Alzheimer’s Disease

Because LRP1 is known to be a versatile receptor that has an affinity toward a variety of ligands [96], we also explored the binding interactions of the four designed peptides TauRP1-2, TauRP1-4, TauRP1-8 and TauRP1-14 with common LRP1 ligands including MMP13 (collagenase), ADAMTS-4 and APOE4. All of these ligands also play a role in Alzheimer’s disease, either inducing inflammatory processes [97,98] or in the internalization or clearance of beta-amyloid peptides [99]. Therefore, we also examined if the peptides interacted with Aβ (1–42). The results are given in Figure 5. In the case of MMP-13 (Figure 5a), for all four designed peptides, docking studies revealed that binding occurred primarily with hydrophobic and neutral residues, including N173, F86, A65 and P87, as well as Y155, except in the case of TauRP1-4, where a basic residue (H166) was involved. Because the binding sites appear to differ and no Lys residues are involved, competitive interaction with PHF-Tau is not expected. We also examined interactions of ADAMTS-4 (Figure 5b), which is a metalloprotease that recognizes Aβ sequence and facilitates the formation of Aβ4-x-truncated peptides commonly formed in the Alzheimer’s diseased brain [100]. The results showed that binding interactions of the TauRP peptides occurred within the binding pocket of ADAMTS-4, with the peptides making key interactions with residues such as M332, T329, D334 and A333. Interactions were also seen with P393, M395 and H371. These results indicate that it is likely that the peptides interact with ADAMTS-4, with some key interactions such as that seen for the inhibitors of ADAMTS-4 such as hydantoin [58]. However, further studies beyond the scope of this manuscript would be needed to explore those effects on ADAMTS-4. Since the binding pocket interactions did not involve lysine residues, it appears that interference with PHF Tau binding is unlikely. We also explored interactions of the peptides with ApoE4. It is well known that ApoE4 and soluble Aβ compete for LRP1-mediated uptake in astrocytes and that ApoE influences soluble Aβ metabolism [101]. In previous studies, it has been shown that ApoE residues from the receptor-binding domain ranging from residues 130 to 149, including residues E131, E132, V135, A138 and K143, bind to the cysteine-rich complements, such as the repeat IV region of the LRP1 region [102]. As shown in Figure 5c, TauRP1-2 appears to bind to R112, G105, D65 and Q58 residues, spanning multiple alpha helices of ApoE4. TauRP1-4, on the other hand, interacts with residues including K72, R25, A29 and A102, while TauRP1-8 interacts with E109, D65, A102 and R205. TauRP1-14 also interacts with A102 and D65, in addition to E109 and K146. Thus, it is likely that the peptides Tau RP1-14, TauRP1-4 and Tau RP1-8 may be able to bind to ApoE4 as well; however, further experimental studies would need to be conducted to examine if there would be any net effect in terms of sterol absorption or Aβ interactions with ApoE4. Because ApoE4 mainly binds through the Cluster 4 domain of LPR1, it appears to be unlikely that there would be an effect as the peptides derived in this work are obtained from the Cluster 2 domain of LRP1.
Figure 5d shows the binding interactions of the docked peptides with Aβ (1–42). As can be seen, Aβ (1–42) binds to TauRP (1–2) primarily through residues including S26, G25, A21 and F20 through H-bonding and hydrophobic interactions, while all the other peptides show interactions with K28 and residues such as E22, F19, V24, G29, I31 and N27. In previous work, it has been shown that Aβ (1–42) is a surface-active peptide; its hydrophilic parts encompass residues Asp1, Ala2, Arg5 and residues 24–28. Lys28 residue of Aβ (1–42) plays a critical role in binding to lipid membranes, while the C-terminal residues (29–42) consist primarily of hydrophobic residues [103]. These results indicate that the TauRP (1–4), TauRP (1-8) and TauRP (1–14) peptides may be able to bind to Aβ (1–42) and plausibly compete with its membrane interaction capabilities. In a study conducted by Lindberg and co-workers, it was shown that lipid membranes modulate the rate of Aβ (1–42) self-assembly, and that charged lipid vesicles such as 1,2-Dioleoyl-sn-glycero-3-phosphocholine (DOPC) vesicles expedite the growth and aggregation of Aβ (1–42) fibrils [104]. Therefore, if Aβ (1–42) can bind to TauRP peptides, it might reduce interactions with membranes and lower the aggregation of Aβ (1–42) fibrils. However, whether or not this affects Aβ (1–42) clearance would require additional studies beyond the scope of this manuscript, which primarily focuses on interactions with PHF Tau. In a study conducted by van Gool and co-workers, it was shown that endogenous LRP1 contributes to the generation of Aβ and simultaneously acts as a receptor for Aβ clearance. They found that if LRP1 expression was lessened, it may reduce Aβ clearance, but it also might upregulate non-amyloidogenic pathways for APP processing through alpha-secretase instead of beta-secretase, thereby culminating in the reduction in the formation of Aβ and leading to a decrease in amyloid beta plaque formation in the brain [105]. Thus, even if the TauRP peptides bind to Aβ and possibly reduce clearance, this may also trigger non-amyloidogenic pathways. However, a thorough study with Aβ peptides will be required to determine these possibilities.

3.5. Molecular Dynamics Studies

To further elucidate the binding interactions and ascertain the stability of the peptides upon binding to PHF tau, we carried out molecular dynamics studies. The four optimal peptides in their best binding modes were chosen based on the results of the docking studies. These include KAWVCDGDND (TauRP1-2), WVCDGDNDCE (TauRP1-4) (mode 2), GDNDCEDNSD (Tau RP1-8) and DNSDEENCES (TauRP1-14). The results obtained are shown in Figure 6.
The Cα RMSDs over 100 ns runs are shown in Figure 6a. Overall, the backbone protein RMSDs appeared to be stable and ranged from 0.35 nm to 0.6 nm, with the highest Cα RMSD seen upon binding to TauRP1-2. All others showed RMSD values between 0.35 nm and 0.45 nm, indicating stability. When bound to Tau RP1-4, the Cα RMSD showed a slight increase of 0.6 nm, observed between 20 ns and 25 ns, after which the RMSD values remained between 0.4 nm and 0.5 nm. The RMSDs of each of the peptides complexed with Tau are shown in Figure S1 of the Supplementary Materials. As can be seen in the figure, the most stable and lowest RMSD value was seen for the peptide GDNDCEDNSD (TauRP1-8), where the RMSD remained stable between 0.52 and 0.6 nm throughout the 100 ns run. For the peptide DNSDEENCES (TauRP1-14), the RMSD value showed a gradual increase from 0.3 nm to 0.85 nm within the first 25 ns and then gradually increased to 0.92 nm up to 72 ns, after which the RMSD was found to be stable at 0.86 nm for the rest of the simulation.
The KAWVCDGDND (TauRP1-2) and WVCDGDNDCE (TauRP1-4) peptides showed similar RMSD patterns after 25 ns. The RMSD value for the KAWVCDGDND peptide increased substantially to 1.1 nm within the first 15 ns and then remained fairly stable between 0.78 nm and 0.9 nm for the rest of the simulation. In the case of WVCDGDNDCE, the RMSD values increased at 23 ns and at 78 ns to 1.1 nm; however, once again, it stabilized to 0.82 nm by the end of the simulation. When compared to Cα values, the overall change in RMSD was found to be within 0.4 nm for TauRP1-2 and TauRP1-14 peptides, indicating that those peptides formed relatively more stable complexes compared to TauRP1-4 and TauRP1-8.
To further elucidate these results, we conducted clustering analysis of the trajectories over the course of the last 25 ns of the simulations. The top three preferred conformers of each of the TauRP peptides bound to PHF Tau are seen in Figure 6b. The tau filamentous structure consists of four microtubule-binding repeat regions with eight beta strand regions and a cross-β interface formed between β1–2 and β8 regions. The N-terminal end is formed by the hexapeptide VQIVYK between residues 306 and 311, which is well-known to be involved in the aggregation and formation of tau filaments [106]. The β2 and β8 strands pack against each other through a polar-zipper motif while hydrophobic residues L324, I326 and V353 form a cluster. The cross-β interface between β3 and β7 is stabilized by hydrogen bonds between the side-chains of hydrophilic residues H328 and T361. Overall, hydrophobic interactions and aromatic stacking (F346) stabilize the interior of the β-helix, while the charged residues E338 and R349 on the solvent-exposed surface of the β-helix provide intramolecular charge compensation. In the case of the (TauRP1-2) (KAWVCDGDND) peptide ligand, it appears to be settled between the B and the J chains, making critical contacts with Lys 353, Arg 349 and Gln 351 throughout the final 25 ns of the simulation, likely due to charge interactions with the aspartic acid residues of the peptide and H-bonding interactions. For TauRP1-4, interestingly, the peptide appears to move closer to the binding pocket of PHF Tau through similar interactions as TauRP1-2. For TauRP1-8, contacts were seen with His 362, Gln 351 and Lys 369 throughout the last 25 ns of the simulation. TauRP1-14 also becomes more compactly nestled in the binding pocket as the simulation progresses, making key contacts with Lys 353, His 362, Lys 369 and Gln 351. The total number of clusters obtained for the last 25 ns of each of the TaupRP with PHF Tau is shown in Supplementary Materials Figure S2. As seen in the figure, the least number of clusters was seen for TauRP1-14 (6 clusters), while TauRP (1–4) showed the formation of the highest number of clusters (16). TauRP (1–2) and TauRP (1–8) displayed 15 clusters. This indicates that the most stable binding interactions were found to be with TauRP (1–14) due to fewer changes occurring toward the end of the simulation.
The protein–ligand contacts are shown in Supplementary Materials Figure S3. As can be seen, in the case of TauRP1-2 (Figure S3a), the main contacts are with R349 of the D chain; Q351 of the B, D, F and H chains; and K353 of the H chain. The total number of contacts on average was found to be between 14 and 24, with the number of contacts showing an increase after 60 ns. The average number of contacts remained in the range of 22 to 24 after 60 ns. The highest interaction fraction (3.5) was seen with Q residue 351 at 3.5, indicating its role in stabilizing the interactions between Tau and TauRP1-2. For TauRP1-4, the number of interacting residues were found to be higher (Figure S3b), though the overall interaction fractions were found to be lower. The most significant difference observed between TauRP1-2 and TauRP1-4 interactions with PHF Tau was the increase in the number of ionic interactions with TauRP1-4, which was found to occur with K353 residue of the D, J, F and H chains of tau. Other significant interactions included H-bonds and water bridge formation with R349 of the H and J chains and with Q351 of the H chain. Overall, the total number of contacts was found to be on average 20, although around 10 ns, there was a dip in the number of contacts, after which the number of contacts remained between 16 and 20.
TauRP1-8 also showed a number of ionic interactions with tau protein (Figure S3c) with K353 and K369 residues of the D, F, H and J chains. Other prominent interactions included those seen with H362, Q351 and R359, which mostly interacted through H-bonds and water bridges. The interaction fractions were higher for this peptide compared to TauRP1-4, though it was found to be lower than TauRP1-2. The number of contacts remained fairly stable throughout the simulation, with an average of 20 contacts for most of the simulation, with fewer contacts observed for the first 5 ns (10). This indicates that the position of the ligand within the binding region was altered during the simulation process such that it was able to interact more favorably in the later part of the simulation. For TauRP1-14 (Figure S3d), ionic interactions and H-bonds were seen with R349 of the B chain (which also showed the highest interaction fraction at 2.5). Ionic interactions were also seen with K353 of the D, F and H chains; K369 of the F and H chains; and K375 of the J chain. Thus, the highest number of interactions with lysine residues was seen with TauRP1-14. Like the three previous peptides, Q351 from the B, F and H chains were found to interact with TauRP-14 through H-bonds and water bridges, implying its importance in stabilizing interactions with all the peptides. The total number of contacts was also found to be highest for TauRP1-14, with an average of 30 contacts over the 100 ns simulation. The number of contacts increased to 38 contacts by the end of the simulation, implying that this peptide remained in contact with higher numbers of residues throughout the entire simulation and had more binding interactions.
To further assess the interactions, we examined the root mean square fluctuations (RMSF), radius of gyration (Rg) and the solvent-accessible surface area (SASA) of the PHF Tau-bound peptides (Figure 7). The RMSF results are indicative of relative fluctuations of the tau protein backbone over the 100 ns simulation upon interacting with each of the ligands. Overall, tau protein showed fluctuations in the same regions for all four peptides, which included residues F378 in the C-terminal region, and T377, G323, L376, K311 and V306. Upon binding to the TauRP1-2 peptide, interactions are seen in the region between D348 and S352 from the B chain as well as R349 to K353 of the D and F chains. Large fluctuations are seen in the C-terminal region, and interactions with TauRP (1–2) are also seen in this region. It is to be noted that L376, F378 and T377 are at or near the C-terminal ends of the tau protein and therefore, higher fluctuations of those residues are expected. Interestingly, TauRP (1–4) binding resulted in similar regional fluctuations in addition to His 362. Upon binding to TauRP (1–8), as seen from the regions showing the vertical lines, binding occurs in the binding pocket making interactions with R349, Q351, K369, K353 and I371. Peptide TauRP (1–14) binding leads to fluctuations in similar regions as those of the other peptides; however, relatively fewer fluctuations are seen in the C-terminal region compared to TauRP (1–2) and TauRP (1–4).
To examine the compactness of the peptides upon interacting with the PHF Tau [107], we analyzed the changes in the radius of gyration over the entire 100 ns simulation. As seen in (Figure 7e), TauRP1-8 and TauRP1-2 showed higher compactness, and their Rgyr values showed very little variation during the simulation. In the case of TauRP1-2, the Rgyr changed from 0.54 nm to 0.58 nm, while for TauRP1-8, the Rgyr changed from 0.68 nm to 0.64 nm by the end of the simulation. For the TauRP1-14, the Rgyr value remained at 0.64 nm for the first 50 ns, after which there was a gradual increase in value to 0.72 nm up to 75 ns, and it remained constant up to 90 ns and showed a decrease to 0.64 nm at the end of the simulation. This implies that the TauRP1-14 underwent conformational changes between 50 ns and 75 ns but then returned to a relatively compact form by the end of the simulation. The highest Rgyr was seen for TauRP1-4 (0.74 nm initially), which increased to 0.83 nm for the first 20 ns and then came down to 0.7 nm for the rest of the simulation, once again implying that this particular peptide underwent conformation changes during the initial part of the simulation and returned to a stable, compact conformation.
All four peptides displayed low pI values due to the presence of several aspartate or glutamate groups. Of the four peptides, Tau RP1-2 had a relatively higher pI (3.53) due to the presence of lysine residue at the N-terminal, while all others displayed pI values in the range of 2.64 to 2.74. Because each of the peptides contain a number of charged groups, we also investigated the SASA (solvent-accessible surface area) values obtained over the course of the simulation. As seen in Figure 7f, the SASA value for TauRP1-4 was found to be the highest and showed very little change over time (100.1 nm2 initially to 99.8 nm2 at the end of the simulation). TauRP1-8, which displayed an initial SASA value of 50.8 nm2, showed a decrease to 38.8 nm2 by the end of the simulation. Similarly, both TauRP1-14 and TauRP1-2 also showed a decrease in SASA values over time. In the case of TauRP1-14, the value decreased from 59.0 nm2 to 40.0 nm2, while for TauRP1-2, the value remained steady at 77.2 nm2 up to 65 ns, after which the value decreased gradually to 50.3 nm2. The fact that TauRP1-2, TauRP1-14 and TauRP1-8 showed a decrease in SASA value over time is indicative that over the course of the simulation, those ligands interact more strongly with the tau protein and become buried relatively more deeply within the tau binding pocket [108]. However, for TauRP1-4, it appears that less interaction occurred over time with the tau protein, and therefore, it had the highest solvent-exposed surface area throughout the course of the simulation.

MMBGSA Studies

Molecular mechanics/generalized Born surface area (MMGBSA) studies provide a comprehensive scoring function for examining the binding interactions between a ligand–receptor complex over the course of the entire simulation, taking into account the binding poses and the free energy involved for various interactions [109]. As seen in Table 5, TauRP1-2 and TauRP1-14 showed higher overall ΔG binding energy at −75.71 kcal/mol and −70.7 kcal/mol, respectively, indicating that these two peptides had relatively stronger binding interactions with tau. The lowest ΔG binding energy was observed for TauRP1-8 at −42.05 kcal/mol. Overall, electrostatic interactions appeared to be a significant contributor for binding in each case in addition to van der Waals interactions. As expected, the most electrostatic interactions were seen for TauRP (1–14) due to the higher number of interactions with the lysine side chains, as explained earlier. Furthermore, compared to the other peptides, TauRP1-14 contains three glutamic acid residues and two aspartic acid residues, while all others have higher numbers of D and only one E residue. This may tend to increase electrostatic interactions with the positively charged groups such as K and R present in the tau protein and lead to higher electrostatic interactions due to the longer side chain of E that may allow it to delve deeper into the binding pocket of the tau protein.
Based on the results obtained from docking and molecular dynamics, as a proof of concept, we conducted laboratory experiments to validate the results obtained and to determine if there was an effect on LRP1-mediated internalization of Tau into LRP1-expressed cells in the presence of the Tau RP1-14 sequence. Thus, HEK293 cells were transfected with LRP1 protein and interactions with fibrillary Tau was examined. Furthermore, we also carried out CD and SPR analysis to confirm interactions with fibrillar Tau.

3.6. Formation of Tau Fibrils

To confirm the formation of Tau aggregates, we conducted dynamic light scattering (DLS). As seen in Supplementary Materials Figure S4, Tau aggregates were formed that were found to be in the size range of 100 to 200 nm. To further confirm fibril formation, we conducted the Thioflavin T assay. The results (Supplementary Materials Figure S5) revealed characteristic fluorescence seen at 490 nm. Having confirmed that aggregates were formed, we used these aggregates for the remaining in vitro studies, since they closely resemble the structure of tau in Alzheimer’s disease.

3.7. Binding Interactions of Fibrillar Tau with TauRP1-14 Peptide

3.7.1. AFM

We first examined the morphologies of the aggregates using AFM. The results are shown in Figure 8. As seen in Figure 8a, neat Tau fibrils showed the formation of fibrillary structures with short Tau oligomers packed together to form larger fibrillary structures (as shown in the inset). This corroborates with previous work, where it has been shown that Tau fibrils tend to form by self-assembly and by the organization of shorter protofibrils arranged side-by-side with a lateral packing forming polymorphic structures [110]. From the morphologies seen, the formation of fibrillar Tau was confirmed. The roughness average, Ra, which is indicative of the average of the absolute values of the profile heights, was found to be 0.224 nm, while the RMS roughness, Rq, which is the root mean square average of the profile heights, was found to be 0.280 nm. The Rz (indicative of the difference in height between the average of five highest peaks and the lowest values) was found to be 1.06 nm. The average diameter of the fibrils was found to be around 150 nm, which aligns with the results obtained from DLS. Upon binding to TauRP (1–14) (Figure 8b), large fibrillary structures were not observed. Instead, relatively shorter fibrils and spherical structures which aggregated together were seen. The Rq and Ra values were found to be 0.565 nm and 0.454 nm, respectively, while the Rz was found to be 1.95 nm, indicating an increase in roughness due to the incorporation of TauRP (1–14). These studies confirm the association of Tau fibrils with TauRP (1–14). It is likely that binding occurred due to interactions between the positively charged residues such as lysine and Arg present in Tau and the five negatively charged residues in TauRP (1–14), as predicted in the computational studies. Upon binding, there appears to be a change in the conformation of Tau protein, resulting in a change in morphology, as seen in the AFM images.

3.7.2. Circular Dichroism Studies

To gain insight into the secondary structural changes that occur in fibrillar Tau upon binding to the TauRP (1–14) peptide at varying concentrations, we conducted Circular Dichroism (CD) spectroscopy. The results can be seen in Table 6. Neat Tau fibrils revealed the presence of 44.3% β-sheet formation (comprising of both parallel and antiparallel beta sheets), 24.7% turns and 7.90% disordered structures. These data agree with previous studies showing that β-sheet formation was predominant in fibrillar tau [111]. Upon binding to the highest concentration of TauRP (1–14) (40 μM), it was revealed that the secondary structure of Tau protein was altered. There was a significant increase in the disordered structural component, concomitantly with a decrease in helical, antiparallel and parallel beta-sheet and turn components. Interestingly, however, at lower concentrations (10 µM and 20 µM of TauRP (1–14)), it was observed that while the parallel beta-sheet component disappeared, and an increase in disordered structural component was observed; there was also an increase in anti-parallel beta-sheets. These results imply that the higher concentration (40 µM) is likely the optimal concentration for disruption of the beta-sheet structures.
The corresponding CD spectra (Figure 9) corroborate these results, where the neat Tau fibrils show a strong positive peak at 199.7 nm and a broad negative peak between 201 nm and 230 nm, with a maximum around 211 nm, which aligns with previous work, for the formation of heparin-induced Tau fibrils [112]. Upon binding to TauRP1-14, a shift was observed. At the lowest concentration (10 μM), the positive peak was shifted to 197.6 nm, while the negative peak was seen at 202.1 nm. As the concentration of TauRP1-14 was increased, the intensity of the negative peak continued to increase. The positive peak disappeared at the highest concentration of TauRP1-14 (40 μM), indicative of the formation of increasingly disordered structures [113,114]. Overall, our results show that the TauRP1-14 peptide is able to alter the conformation of fibrillar tau, particularly at the higher concentration.

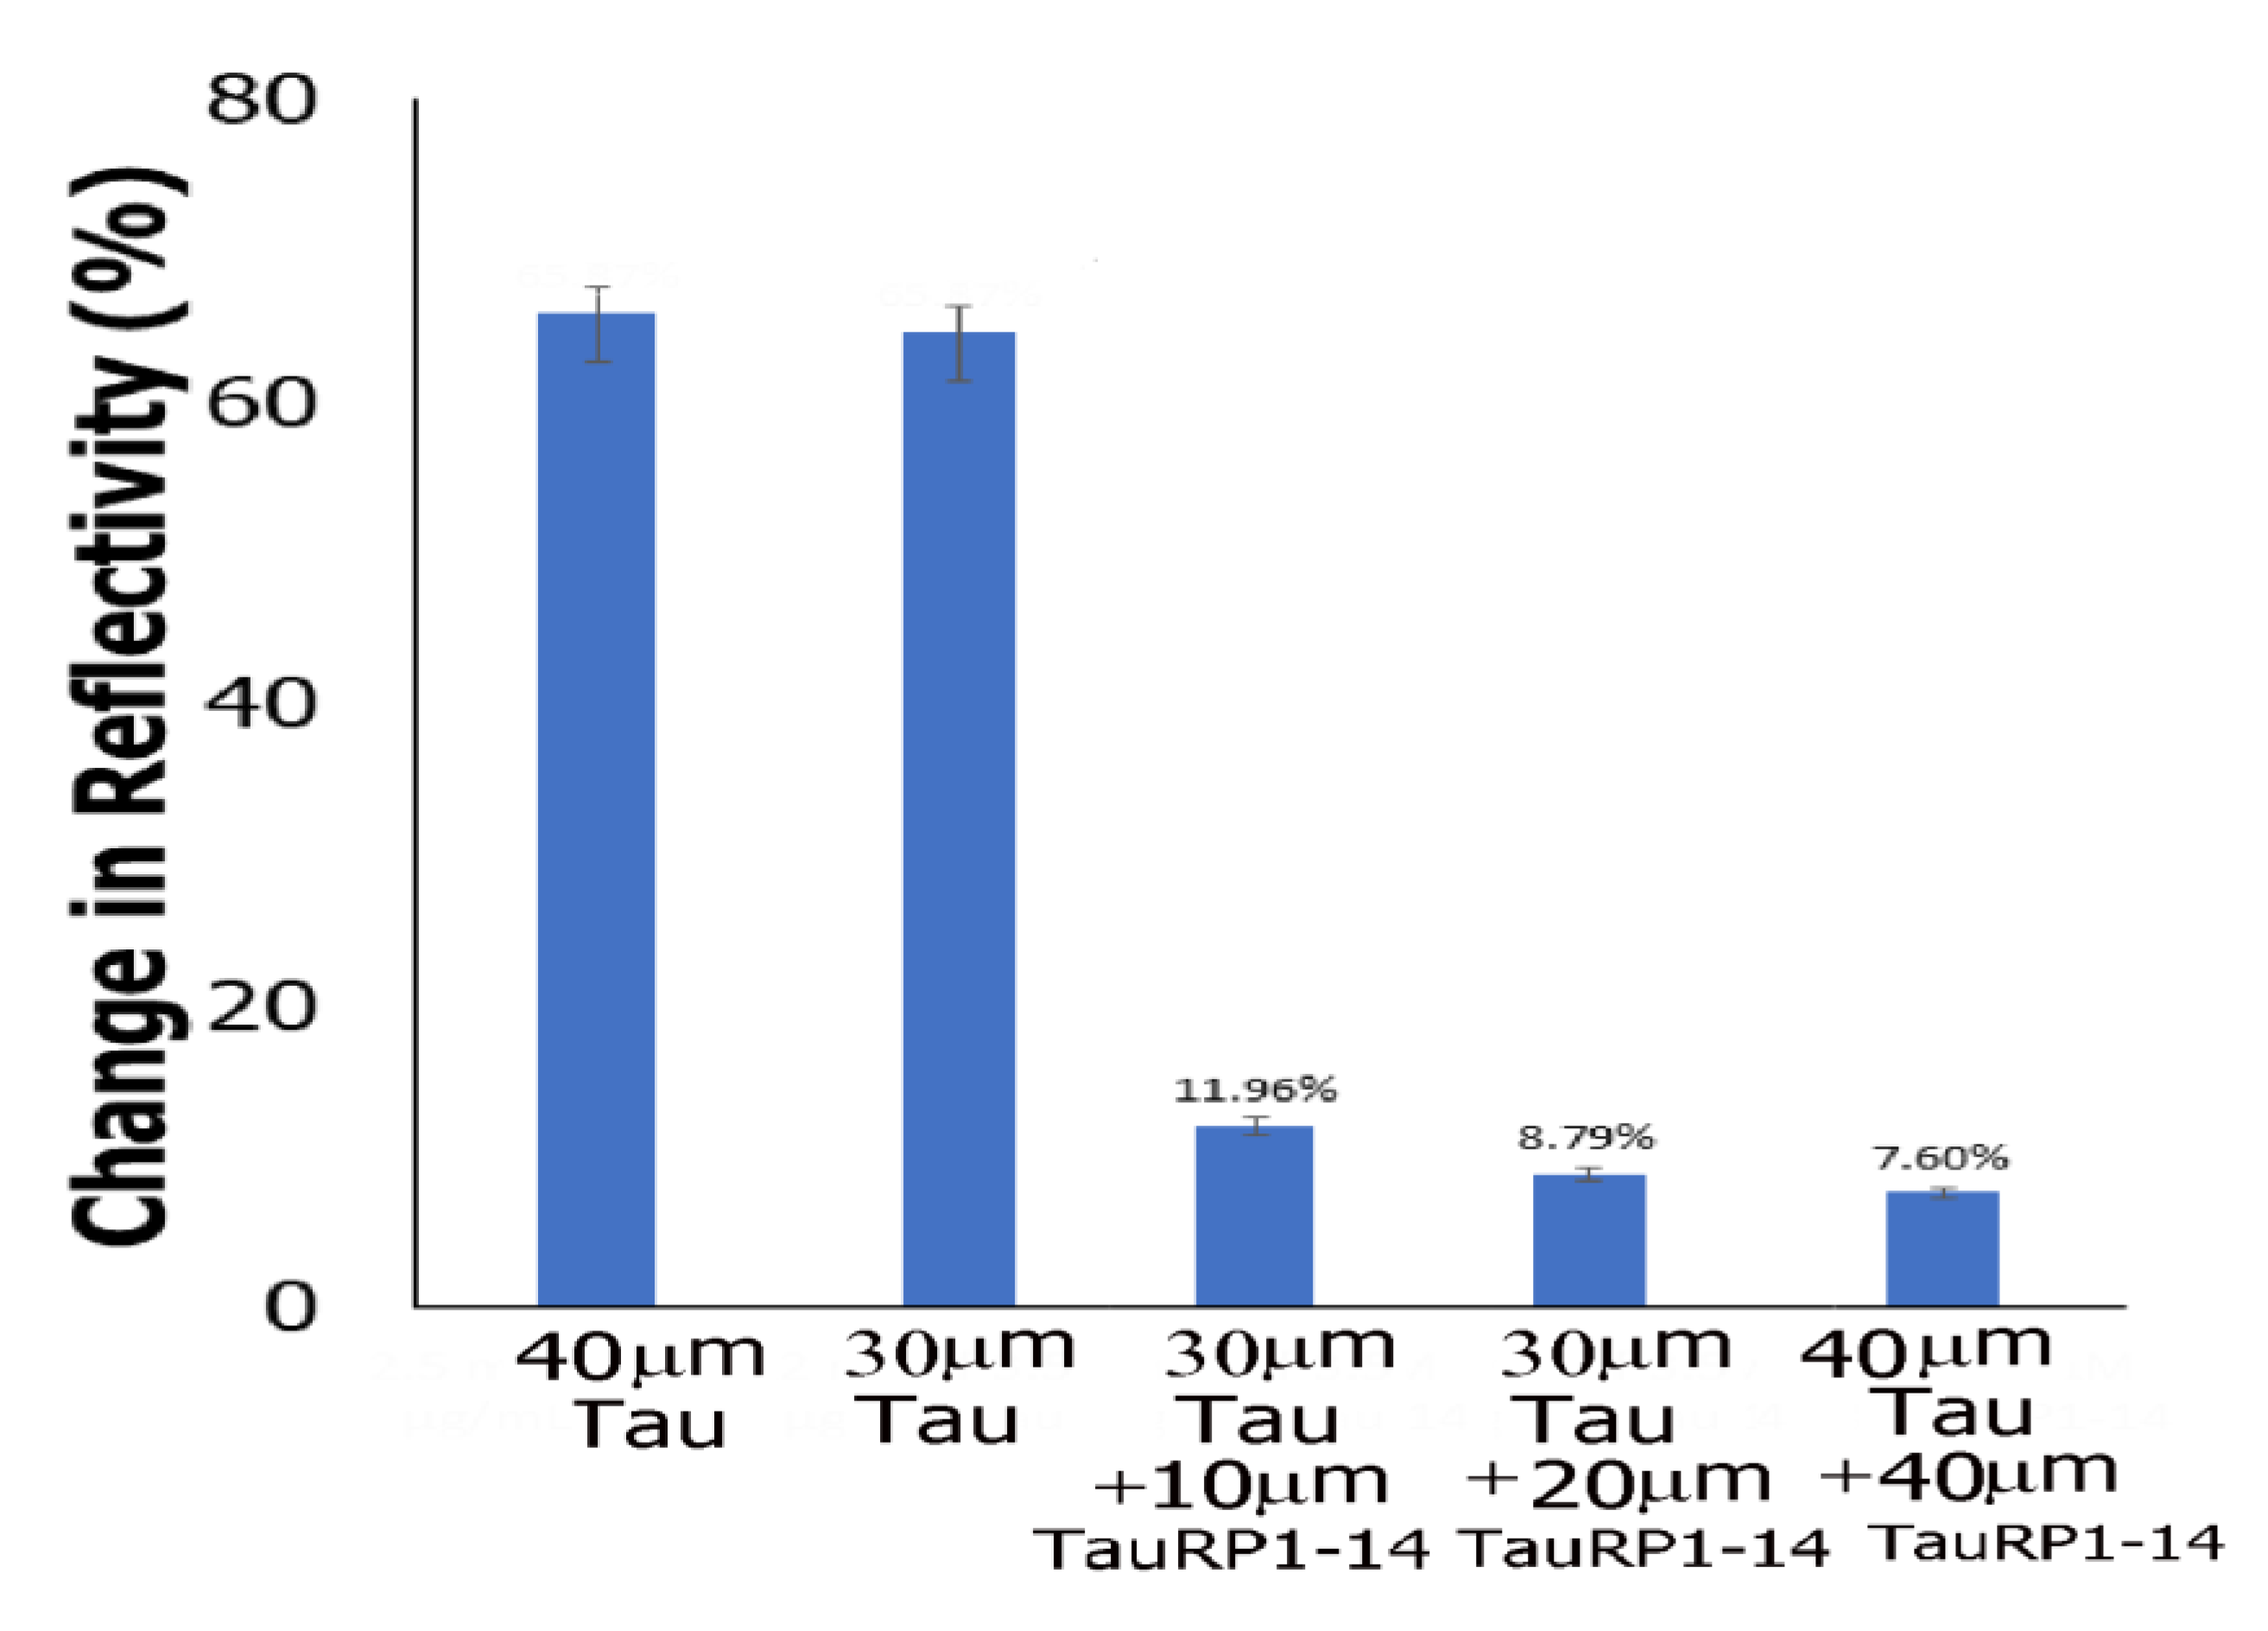
3.7.3. Surface Plasmon Resonance Studies

To examine real-time binding interactions of neat Tau as well as Tau bound to TauRP (1–14) peptide with LRP1-expressed HEK 293 cells, we conducted Surface Plasmon Resonance (SPR). The results can be seen in Figure 10. As shown, the average changes in reflectivity over a span of 1000 s reveal that neat fibrillar tau had strong binding interactions with LRP1-expressed cells. This is expected, given that LRP1 has a high affinity for Tau and is involved in the internalization of Tau fibrils into cells. The average % change in reflectivity was found to be 65.9% and 61.4%, indicating binding at both concentrations (30 μM and at 40 μM). In the presence of the TauRP (1–14) peptide pre-attached to Tau fibrils, however, a dramatic change was seen, where the percent change in reflectivity was found to be significantly lower. Furthermore, the decrease in percent change in reflectivity was found to be proportional to the concentration of fibrillar Tau-bound-TauRP (1–14) (DNSDEENCES) being used as the analyte. These results are indicative that fibrillar Tau, when pre-associated with the TauRP (1–14) peptide sequence, reduced the binding interactions with LRP1-expressed HEK-293 cells, possibly due to the mitigation of binding interactions with LRP1 as a result of conformation change of fibrillar Tau. These results suggest that TauRP (1–14) can influence LRP1-mediated Tau binding. In addition, these data further confirm that the TauRP1-14 peptide is effective in binding to fibrillar tau, and that this complex is successful in reducing LRP1-mediated uptake.

3.8. Flow Cytometry Studies

To further determine the effect of TauRP (1–14) peptide pre-associated with fibrillar Tau on the LRP1-mediated uptake of tau, we performed cellular internalization studies using flow cytometry. The results are shown in Figure 11. As shown in the figure, the highest uptake by the LRP1-expressing cells was seen for neat Tau fibrils. As seen from previous studies, these results further confirm that LRP1 receptor mediates the internalization of fibrillar tau [115]. In comparison, samples containing the TauRP (1–14) peptide showed a clear shift in fluorescence to the left, suggesting that internalization was reduced. A significantly lower uptake was observed for cells treated with TauRP (1–14) pre-associated with Tau fibrils, as revealed by the blue peak, which showed a lower intensity. To ensure that the uptake was LRP1-mediated, we also examined the effect of Tau uptake in the presence of a peptide, angiopep-2, which is known for its high affinity, internalization and interactions with LRP1 receptor and has shown LRP1-mediated cellular uptake in previous studies. Furthermore, angiopep-2 (TFFYGGSRGKRNNFKTEEY) is known to effectively cross the BBB through LRP1-mediated transcytosis [116]. Thus, the LRP1-expressing HEK293 cells were also treated with fibrillar tau pre-associated with TauRP-14 and angiopep-2. The results showed that in the presence of angiopep-2, the uptake of Tau fibrils was lower than that compared to neat fibrils, but slightly higher compared to those seen for TauRP1-14 pre-associated with Tau. This confirms that even in the presence of angiopep-2, slightly less internalization is observed when Tau fibrils are pre-associated with TauRP 1-14. This suggests that LRP1 may be potentially saturated by angiopep-2 [117], which reduced the transport efficiency of fibrillar tau in the presence of TauRP1-14. The peptide angiopep-2 has been shown to selectively target LRP1 [118]; therefore, the goal was to determine if the presence of this competitive ligand would reduce the uptake of tau. Untreated non-transfected cells were used as a control and showed the lowest fluorescence due to background cellular autofluorescence.
Overall, the results showed that in the absence of the TauRP (1–14) peptide, internalization of fibrillar tau was the highest, whereas in the presence of the TauRP (1–14) peptide, LRP1-mediated internalization of fibrillar tau was substantially reduced. This confirms that the peptide that the designed peptide (DNSDEENCES) effectively binds to fibrillar tau and inhibits its LRP1-mediated internalization.

4. Conclusions

In this work, we modeled the LRP1 subdomain 2 and examined its interactions with PHF Tau. Fourteen short segments containing 10 amino acids each were then designed based on the 23-amino-acid PHF binding region of the Cluster 2 subdomain of LRP1. Docking, molecular dynamics studies and clustering analysis of the trajectories revealed that of those fourteen peptides, two (TauRP (1–14) and TauRP (1–8)) showed suitable binding interactions with critical residues of PHF Tau, including Lys 353 and Lys 369 as well as Gln 351. As a proof of concept, we examined the binding interactions of Tau fibrils with the most optimal peptide (DNSDEENCES) obtained from computational studies. SPR analysis revealed that binding was significantly reduced when the Tau fibrils were pre-associated with DNSDEENCES. Additionally, CD spectra showed a change in conformation of the Tau fibrils. Flow cytometry studies confirmed that fibrillar Tau uptake was substantially reduced when pre-associated with Tau fibrils. Most importantly, it was revealed that the Tau RP1-14 (DNSDEENCES) sequence may be designed for further studies in vivo to explore its effects in mitigating tau uptake. Additionally, preliminary docking studies were conducted with Aβ (1–42) as well as the receptor-binding region of APOE4, MMP-13 and ADAMTS-4 to determine if the peptides also interact with additional LPR1 ligands. This work represents an important step forward in the use of computational tools such as docking studies and molecular dynamics to pre-screen peptides that may affect the tau–LRP1 interaction. Additionally, other receptor models that may be involved in Tau uptake can also be studied to generate short peptide sequences that may mitigate fibrillar Tau uptake. It would also be interesting to conduct further studies on short peptide segments from other regions of the ligand-binding domain of the LRP1 receptor.

Supplementary Materials

The following supporting information can be downloaded at: https://www.mdpi.com/article/10.3390/app13020853/s1, Table S1: Thread templates generated from Phyre2 with 100% confidence level that were modeled to determine the Cluster 2 subdomain structure of LRP1. Table S2: Top template threads obtained from I-TASSER studies to determine the secondary structures of the 23-amino-acid sequence of Cluster 2 domain and the fourteen designed peptides. Figure S1: Comparison of RMSDs of peptide bound complexes with PHF Tau over 100 ns simulations. Figure S2: Comparison of size and number of clusters formed for TauRP (1–2), TauRP (1–4), TauRP (1–8) and TauRP (1–14) based on clustering results obtained from the trajectory images of the last 25 ns of 100 ns MD simulations upon binding to PHF Tau calculated from the RMSD matrices. Figure S3: Protein–ligand contacts over 100 ns simulations between PHF Tau and (top row, left) TauRP (1–2) with total contacts; (top row, right) TauRP (1–4) with total contacts; (bottom row, left) TauRP (1–8) with total contacts; (bottom row, right) TauRP1-14 and total contacts. Figure S4: DLS analysis showing the formation of fibrillar Tau aggregates in the size range of 100 to 200 nm. Figure S5: Emission spectrum ThT bound to fibrillar tau aggregates at excitation of 450 nm.

Author Contributions

Conceptualization, E.J.B. and I.A.B.; methodology, E.J.B., B.G.G. and I.A.B.; validation, B.G.G. and I.A.B.; formal analysis, B.G.G. and I.A.B.; investigation, E.J.B., B.G.G., C.G.L. and I.A.B.; data curation, E.J.B., B.G.G. and C.G.L.; writing—original draft preparation, E.J.B., B.G.G. and I.A.B.; writing—review and editing, I.A.B.; supervision, I.A.B.; project administration, I.A.B.; funding acquisition, I.A.B. and B.G.G. All authors have read and agreed to the published version of the manuscript.

Funding

I.A.B. received funding from the NSF-MRI grant award no. 2117625 and NSF-MRI grant award no. 1626378 for the FACS and the AFM. B.G.G. received funding from the Clare Boothe Luce Scholarship. The authors also thank Fordham University’s research grants for financial support of this work.

Institutional Review Board Statement

Not applicable.

Informed Consent Statement

Not applicable.

Data Availability Statement

Not applicable.

Conflicts of Interest

The authors declare no conflict of interest.

References

  1. Cleveland, D.; Hwo, S.; Kirschner, M. Physical and chemical properties of purified tau factor and the role of tau in microtubule assembly. J. Mol. Biol. 1977, 116, 227–247. [Google Scholar] [CrossRef]
  2. Duan, A.R.; Jonasson, E.M.; Alberico, E.O.; Li, C.; Scripture, J.P.; Miller, R.A.; Alber, M.S.; Goodson, H.V. Interactions between Tau and different conformations of Tubulin: Implications of Tau function and mechanism. J. Mol. Biol. 2017, 429, 1424–1438. [Google Scholar] [CrossRef]
  3. Castro, T.G.; Muntenau, F.-D.; Cavaco-Pauolo, A. Electrostatics of Tau protein by molecular dynamics. Biomolecules 2019, 9, 116. [Google Scholar] [CrossRef] [Green Version]
  4. Castro, T.G.; Ferrerira, T.; Matama, T.; Munteanu, F.-D.; Cavaco-Paulo, A. Acetylation and phosphorylation processes modulate Tau’s binding to microtubules: A molecular dynamics study. Biochim. Biophys. Acta BBA-Gen. Subj. 2022, 1867, 130276. [Google Scholar] [CrossRef]
  5. Gao, Y.-L.; Wang, N.; Sun, F.-R.; Cao, X.-P.; Zhang, W.; Yu, J.-T. Tau in neurodegenerative disease. Ann. Transl. Med. 2018, 6, 175. [Google Scholar] [CrossRef] [PubMed]
  6. Briner, A.; Gotz, J.; Polanco, J. Fyn kinase controls Tau aggregation in vivo. Cell Rep. 2020, 32, 108045. [Google Scholar] [CrossRef] [PubMed]
  7. Sengupta, U.; Guerrero-Munoz, M.; Castillo-Carranza, D.; Lasagna-Reeves, C.; Gerson, J.; Paulucci-Holthauzen, A.; Krishnamurthy, S.; Farhed, M.; Jackson, J.; Kayed, R. Pathological interface between oligomeric alpha-synuclein and tau in synucleinophathies. Biol. Psychiatry 2015, 78, 672–683. [Google Scholar] [CrossRef] [PubMed]
  8. Fischer, D.; Mukrasch, M.; Bibow, J.; Blackledge, M.; Griesinger, C.; Mandelkow, E.; Zweckstetter, M. Conformational changes specific for pseudophosphorylation at serine 262 selectively impair binding of Tau to microtubules. Biochemistry 2009, 48, 10047–10055. [Google Scholar] [CrossRef]
  9. Kidd, M. Paired helical filaments in electron microscopy of Alzheimer’s disease. Nature 1963, 197, 192–193. [Google Scholar] [CrossRef]
  10. Crowther, R. Straight and paired helical filaments in Alzheimer disease have a common structural unit. Proc. Natl. Acad. Sci. USA 1991, 88, 2288–2292. [Google Scholar] [CrossRef] [PubMed]
  11. Leonard, C.; Phillips, C.; McCarty, J. Insight into seeded Tau fibril growth from molecular dynamics simulation of the Alzhiemer’s disease protofibril core. Front. Mol. Biosci. 2021, 8, 624302. [Google Scholar]
  12. Yamada, K. Extracellular Tau and its potential role in the propagation of tau pathology. Front. Neurosci. 2017, 11, 667. [Google Scholar] [CrossRef] [PubMed]
  13. Evans, L.D.; Wassmer, T.; Graser, G.; Smith, J.; Perkinton, M.; Billinton, A.; Livesey, F.J. Extracellular monomeric and aggregated Tau efficiently enter human neurons through overlapping but distinct pathways. Cell Rep. 2018, 22, 3612–3624. [Google Scholar] [CrossRef] [PubMed] [Green Version]
  14. Holmes, B.; DeVos, S.; Kfoury, N.; Li, M.; Jacks, R.; Yanamandra, K.; Ouidja, M.; Brodsky, F.; Marsa, J.; Bagchi, D.; et al. Heparan sulfate proteoglycans mediate internalization and propagation of specific proteopathic seeds. Proc. Natl. Acad. Sci. USA 2013, 110, E3138–E3147. [Google Scholar] [CrossRef] [Green Version]
  15. Takeda, S.; Wegmann, S.; Cho, H.; DeVos, S.L.; Commins, C.; Roe, A.D.; Nicholls, S.B.; Carlson, G.A.; Pitstick, R.; Bobuhara, C.K.; et al. Neuronal uptake and propagation of rare phosphorylated high-molecular weight tau derived from Alzheimer’s disease brain. Nat. Commun. 2015, 6, 1–15. [Google Scholar] [CrossRef] [Green Version]
  16. Jurado, S. AMPA receptor trafficking in natural and pathological aging. Front. Mol. Neurosci. 2017, 10, 446. [Google Scholar] [CrossRef] [Green Version]
  17. Morozova, V.; Cohen, L.; Makki, A.; Shur, A.; Pilar, G.; El Idrissi, A.; Alonso, A. Normal and pathological tau uptake mediated by M1/M3 muscarinic receptors promotes opposite neuronal changes. Front Cell Neurosci. 2019, 13, 403. [Google Scholar] [CrossRef] [Green Version]
  18. Gomez-Ramos, A.; Diaz-Hernandez, M.; Rubio, A.; Miras-Protugal, M.T.; Avila, J. Extracellular tau promotes intracellular calcium increase through M1 and M3 receptors in neuronal cells. Mol. Cell. Neurosci. 2008, 37, 673–681. [Google Scholar] [CrossRef]
  19. Herbst, S.; Lewis, P.A.; Morris, H.R. The emerging role of LRRK2 in taupathies. Clin. Sci. 2022, 136, 1071–1079. [Google Scholar] [CrossRef]
  20. Evans, L.D.; Strano, A.; Campbell, A.; Karakoc, E.; Lorio, F.; Bassett, A.R.; Livesey, F.J. Whole genome CRISPR screens identify LRRK2-regulated endocytosis as a major mechanism for extracellular tau uptake by human neurons. bioRxiv 2020. [Google Scholar] [CrossRef]
  21. Pensalfaini, A.; Kim, S.; Subbanna, S.; Bleiwas, C.; Goulbourne, C.N.; Stavrides, P.H.; Jiang, Y.; Lee, J.H.; Darji, S.; Pawlik, M.; et al. Endosomal dysfunction induced by directly overactivating Rab5 recapitulates prodromal and neurodegenerative features of Alzheimer’s disease. Cell Rep. 2020, 33, 108420. [Google Scholar] [CrossRef] [PubMed]
  22. Stancu, I.-C.; Vasconcelos, B.; Terwel, D.; Dewachter, I. Models of β-amyloid induced tau pathology: The long and “folded” road to understand the mechanism. Mol. Neurodegen. 2014, 9, 51. [Google Scholar] [CrossRef] [PubMed] [Green Version]
  23. Ittner, A.; Chua, S.W.; Bertz, J.; Vokkerling, A.; van der Hoven, J.; Gladbach, A.; Przybyla, M.; Bi, M.; van Hummel, A.; Stevens, C.H.; et al. Site specific phosphorylation of tau inhibits amyloid beta toxicity in Alzhiemer’s disease. Science 2016, 354, 904–908. [Google Scholar] [CrossRef] [PubMed] [Green Version]
  24. Bok, E.; Leem, E.; Lee, B.-R.; Lee, J.; Yoo, C.; Lee, E.; Kim, J. Role of the lipid membrane and membrane proteins in tau pathology. Front. Cell Dev. Biol. 2021, 9, 653815. [Google Scholar] [CrossRef] [PubMed]
  25. Sigurdsson, E.M. Tau immunotherapies for Alzheimer’s disease and related Tauopathies: Progress and potential pitfalls. J. Alzheimer’s Dis. 2018, 66, 855–856. [Google Scholar] [CrossRef] [PubMed] [Green Version]
  26. Zilkova, M.; Nolle, A.; Kovacech, B.; Konteskova, E.; Weisova, P.; Filipcik, P.; Skarbana, R.; Prcina, M.; Hromadka, T.; Cehlar, O.; et al. Humanized tau antiboides promote tau uptake by human microglia without any increase of inflammation. Acta Neuropathol. Commun. 2020, 8, 74. [Google Scholar] [CrossRef]
  27. Rauch, J.; Luna, G.; Guzman, E.; Audouard, M.; Challis, C.; Sibih, Y.; Leshuk, C.; Hernandez, I.; Wegmann, S.; Hyman, B.; et al. LRP1 is a master regulator of tau uptake and spread. Nature 2020, 580, 381–385. [Google Scholar] [CrossRef]
  28. Bres, E.; Faissner, A. Low density receptor-related protein 1 interactions with the extracellular matrix: More than meets the eye. Front. Cell Dev. Biol. 2019, 7, 31. [Google Scholar] [CrossRef] [Green Version]
  29. Cooper, J.; Lathuiliere, A.; Migliorini, M.; Arai, A.; Wani, M.; Dujardin, S.; Muraoglu, S.; Hyman, B.; Strickland, D. Regulation of tau internalization, degradation and seeding by LRP1 reveals multiple pathways of tau catabolism. J. Biol. Chem. 2021, 296, 100715. [Google Scholar] [CrossRef]
  30. Potere, N.; Del Buono, M.; Mauro, A.; Abbate, A.; Toldo, S. Low density lipoprotein receptor-related protein-1 in cardiac inflammation and infarct healing. Front. Cardiovasc. Med. 2019, 6, 51. [Google Scholar] [CrossRef]
  31. Neels, J.; van Den Berg, B.; Lookene, A.; Olivecrona, G.; Pannekoek, H.; van Zonneveld, A. The second and fourth cluster of class A cysteine-rich repeats of the low density lipoprotein receptor-related protein share ligand-binding properties. J. Biol. Chem. 1999, 274, 31305–31311. [Google Scholar] [CrossRef] [PubMed]
  32. Fouët, G.; Gout, E.; Wicker-Planquart, C.; Bally, I.; de Nardis, C.; Dedieu, S.; Chouquet, A.; Gaboriaud, C.; Thielens, N.; Kleman, J.; et al. Complement C1q Interacts With LRP1 Clusters II and IV Through a Site Close but Different From the Binding Site of Its C1r and C1s-Associated Proteases. Front. Immunol. 2020, 11, 583754. [Google Scholar] [CrossRef] [PubMed]
  33. Cooper, J.; Lathuiliere, A.; Migliorini, M.; Arai, A.; Wani, M.; Dujardin, S.; Muratoglu, S.; Hyman, B.; Strickland, D. LRP1 and SORL1 regulate tau internalization and degradation and enhance tau seeding. bioRxiv 2020, 11, 386581. [Google Scholar]
  34. Herz, J.; Hamann, U.; Rogneo, S.; Myklebost, O.; Gausepohl, H.; Stanley, K. Surface location and high affinity for calcium of a 500-kd liver membrane protein closely related to the LDL-receptor suggest a physiological role as lipoprotein receptor. Embo. J. 1988, 7, 4119–4127. [Google Scholar] [CrossRef]
  35. Marakasova, E.; Olivares, P.; Karnaukhova, E.; Chun, H.; Hernandez, N.; Kurasawa, J.; Hassink, G.; Shestopal, S.; Strickland, D.; Sarafanov, A. Molecular chaperone RAP interacts with LRP1 in a dynamic bivalent mode and enhances folding of ligand-binding regions of other LDLR receptors. J. Biol. Chem. 2021, 297, 100842. [Google Scholar] [CrossRef]
  36. Fisher, C.; Beglova, N.; Blacklow, S. Structure of an LDLR-RAP Complex Reveals a General Mode for Ligand Recognition by Lipoprotein Receptors. Mol. Cell 2006, 22, 277–283. [Google Scholar] [CrossRef]
  37. Liu, B.; Zhang, Z.; Lu, S.; He, Q.; Deng, N.; Meng, H.; Pan, C.; Li, H.; Liu, M.; Huang, A.; et al. In-silico analysis of ligand-receptor binding patterns of alpha-MMC, TCS and MAP30 protein to LRP1 receptor. J. Mol. Graph. Model. 2020, 98, 107619. [Google Scholar] [CrossRef]
  38. Muhammed, M.; Aki-Yalcin, E. Homology modeling in drug discovery: Overview, current applications, and future perspectives. Chem. Biol. Drug Des. 2019, 93, 12–20. [Google Scholar] [CrossRef] [Green Version]
  39. Dong, S.; Sun, J.; Mao, Z.; Wang, L.; Lu, Y.; Li, J. A guideline for homology modeling of the proteins from newly discovered betacoronavirus, 2019 novel coronavirus (2019-nCoV). J. Med. Virol. 2020, 92, 1542–1548. [Google Scholar] [CrossRef]
  40. Yu, Z.; Kang, L.; Zhao, W.; Wu, S.; Ding, L.; Zheng, F.; Liu, J.; Li, J. Identification of novel umami peptides from myosin via homology modeling and molecular docking. Food Chem. 2021, 344, 128728. [Google Scholar] [CrossRef]
  41. Nikolaev, D.; Shtyrov, A.; Panov, M.; Jamal, A.; Chakchir, O.; Kochemirovsky, V.; Olivucci, M.; Ryazantsev, M. A Comparative Study of Modern Homology Modeling Algorithms for Rhodopsin Structure Prediction. ACS Omega 2018, 3, 7555–7566. [Google Scholar] [CrossRef] [PubMed] [Green Version]
  42. Fitzpatrick, A.; Falcon, B.; He, S.; Murzin, A.; Murshudov, G.; Garringer, H.; Crowther, R.; Ghetti, B.; Goedert, M.; Scheres, S. Cryo-EM structures of tau filaments from Alzheimer’s disease. Nature 2017, 547, 185–190. [Google Scholar] [CrossRef] [PubMed]
  43. Costales, P.; Fuentes-Prior, P.; Castellano, J.; Revuelta-Lopez, E.; Corral-Rodríguez, M.; Nasarre, L.; Badimon, L.; Llorente-Cortes, V. K Domain CR9 of Low Density Lipoprotein (LDL) Receptor-related Protein 1 (LRP1) Is Critical for Aggregated LDL-induced Foam Cell Formation from Human Vascular Smooth Muscle Cells. J. Biol. Chem. 2015, 290, 14852–14865. [Google Scholar] [CrossRef] [PubMed] [Green Version]
  44. Abdelmonsef, A. Computer-aided identification of lung cancer inhibitors through homology modeling and virtual screening. Egypt. J. Med. Hum. Genet. 2019, 20, 6. [Google Scholar] [CrossRef] [Green Version]
  45. The UniProt Consortium. UniProt: The universal protein knowledgebase in 2021. Nucleic Acids Res. 2021, 49, D480–D489. [Google Scholar] [CrossRef]
  46. Kelley, L.; Mezulis, S.; Yates, C.; Wass, M.; Sternberg, M. The Phyre2 web portal for protein modeling, prediction and analysis. Nat. Protoc. 2015, 10, 845–858. [Google Scholar] [CrossRef] [Green Version]
  47. Comeau, S.; Gatchell, D.; Vajda, S.; Camacho, C. ClusPro: A fully automated algorithm for protein–protein docking. Nucleic Acids Res. 2004, 32, W96–W99. [Google Scholar] [CrossRef] [Green Version]
  48. Kozakov, D.; Hall, D.; Xia, B.; Porter, K.; Padhorny, D.; Yueh, C.; Beglov, D.; Vajda, S. The ClusPro web server for protein–protein docking. Nat. Protoc. 2017, 12, 255–278. [Google Scholar] [CrossRef] [PubMed]
  49. Jakubec, D.; Skoda, P.; Krivak, R.; Novotny, M.; Hoksza, D. PrankWeb 3: Accelerated ligand-binding site predictions for experimental and modelled protein structures. Nucleic Acids Res. 2020, 50, W593–W597. [Google Scholar] [CrossRef]
  50. Zheng, W.; Zhang, C.; Li, Y.; Pearce, R.; Bell, E.W.; Zhang, Y. Folding non-homology proteins by coupling deep-learning contact maps with I-Tasser assembly simulations. Cell Rep. Methods 2021, 1, 100014. [Google Scholar] [CrossRef] [PubMed]
  51. Yang, J.; Yan, R.; Roy, A.; Xu, D.; Poisson, J.; Zhang, Y. The I-TASSER suite: Protein structure and function predictions. Nat. Methods 2015, 12, 7–8. [Google Scholar] [CrossRef] [PubMed] [Green Version]
  52. Yang, J.; Zhang, Y. I-Tasser Server: New development for protein structure and function predictions. Nucleic Acids Res. 2015, 43, W174–W181. [Google Scholar] [CrossRef]
  53. Eberhard, J.; Santos-Martins, D.; Tillack, A.; Forli, S. AutoDock Vina 1.2.0: New Docking Methods, Expanded Force Field, and Python Bindings. Chem. Inf. Model. 2021, 61, 3891–3898. [Google Scholar] [CrossRef] [PubMed]
  54. Trott, O.; Olson, A. AutoDock Vina: Improving the speed and accuracy of docking with a new scoring function, efficient optimization and multithreading. J. Comput. Chem. 2010, 31, 455–461. [Google Scholar] [CrossRef] [PubMed] [Green Version]
  55. Gremer, L.; Scholzel, D.; Schenk, C.; Reinartz, E.; Labahn, J.; Ravelli, R.B.; Tusche, M.; Lopez-Iglesias, C.; Hoyer, W.; Heise, H.; et al. Fibril structure of amyloid-β (1-42) by cryo-electron microscopy. Science 2017, 358, 116–119. [Google Scholar] [CrossRef] [PubMed] [Green Version]
  56. Verderame, J.R.; Kantardjieff, K.; Segelke, B.; Weisgraber, K.; Rupp, B. Apolipoprotein E4, 22k Domain. Available online: https://www.rcsb.org/structure/1GS9 (accessed on 28 December 2022).
  57. Johnson, A.R.; Pavlovsky, A.G.; Ortwine, D.F.; Prior, F.; Man, C.F.; Bornemeier, D.A.; Bantoai, C.A.; Mueller, W.T.; McConnell, P.; Yan, C.; et al. Discovery and characterization of a novel inhibitor of matrix metalloprotease-13 that reduces cartilage damage in vivo without fibroplasia side effects. J. Biol. Chem. 2007, 282, 27781–27791. [Google Scholar] [CrossRef] [Green Version]
  58. Durham, T.B.; Klimkowski, V.J.; Rito, C.J.; Marimuthu, J.; Toth, J.L.; Liu, C.; Durbin, J.D.; Stot, S.L.; Adams, L.; Swearingen, C.; et al. Identification of Potent and Selective Hydantoin Inhibitors of Aggrecanase-1 and Aggrecanase-2 That Are Efficacious in Both Chemical and Surgical Models of Osteoarthritis. Med. Chem. 2014, 57, 10476–10485. [Google Scholar] [CrossRef]
  59. Schrödinger, L.; DeLano, W. PyMOL 2.1.1; Schrödinger, LLC.: New York, NY, USA, 2020. [Google Scholar]
  60. Bowers, K.; Chow, D.; Xu, H.; Dror, R.; Eastwood, M.; Gregersen, B.; Kleipeis, J.; Kolossvary, I.; Moraes, M.; Sacerdoti, F.; et al. Scalable Algorithms for Molecular Dynamics Simulations on Commodity Clusters. In Proceedings of the 2006 ACM/IEEE Conference on Supercomputing, Tampa, FL, USA, 11–17 November 2006; p. 43. [Google Scholar]
  61. Lu, C.; Wu, C.; Ghoreishi, D.; Chen, W.; Wang, L.; Damm, W.; Ross, G.; Dahlgren, M.; Russell, E.; Bergen, C.; et al. OPLS4: Improving Force Field Accuracy on Challenging Regimes of Chemical Space. J. Chem. Theory Comput. 2021, 17, 4291–4300. [Google Scholar] [CrossRef]
  62. Jorgensen, W.; Maxwell, D.; Tirado-Rives, J. Development and Testing of the OPLS All-Atom Force Field on Conformational Energetics and Properties of Organic Liquids. J. Am. Chem. Soc. 1996, 118, 11225–11236. [Google Scholar] [CrossRef]
  63. Jorgensen, W.; Tirado-Rives, J. The OPLS [Optimized Potentials for Liquid Simulations] Potential Functions for Proteins, Energy Minimizations for Crystals of Cyclic Peptides and Crambin. J. Am. Chem. Soc. 1988, 110, 1657–1666. [Google Scholar] [CrossRef]
  64. Sastry, M.; Adzhigirey, M.; Day, T.; Annabhimoju, R.; Sherman, W. Protein and Ligand Preparation: Parameters, Protocols, and Influence on Virtual Screening Enrichments. J. Comp. Aided Mol. Des. 2013, 27, 221–234. [Google Scholar] [CrossRef] [PubMed]
  65. Jung, J.; Kobayashi, C.; Sugita, Y. Optimal temperature evaluation in molecular dynamics simulations with large time step. J. Chem. Theory Comput. 2019, 15, 84–94. [Google Scholar] [CrossRef] [PubMed]
  66. Frey, B.J.; Dueck, D. Clustering by passing messages between data points. Science 2007, 315, 972–976. [Google Scholar] [CrossRef] [PubMed] [Green Version]
  67. Onufriev, A.; Case, D. Generalized Born Implicit Solvent Models for Biomolecules. Annu. Rev. Biophys. 2019, 48, 275–296. [Google Scholar] [CrossRef]
  68. Jacobson, M.; Friesner, R.; Xiang, Z.; Honig, B. On the Role of Crystal Packing Forces in Determining Protein Sidechain Conformations. J. Mol. Biol. 2002, 320, 597–608. [Google Scholar] [CrossRef]
  69. Jacobson, M.; Pincus, R.; Rapp, C.; Day, T.; Honing, B.; Shaw, D.; Friesner, R. A Hierarchical Approach to All-Atom Protein Loop Prediction. Proteins 2004, 55, 351–367. [Google Scholar] [CrossRef] [Green Version]
  70. Sánchez-Clemente, R.; Igeño, M.I.; Población, A.G.; Guijo, M.I.; Merchán, F.; Blasco, R. Study of pH Changes in Media during Bacterial Growth of Several Environmental Strains. Proceedings 2018, 2, 1297. [Google Scholar]
  71. Giufrè, M.; Monaco, M.; Accogli, M.; Pantosti, A.; Cerquetti, M.; PAMURSA Study Group; Farina, C.; Fazii, P.; Mattei, R.; Moro, M.L.; et al. Emergence of the colistin resistance mcr-1determinant in commensal Escherichia coli from residents of long-term-care facilities in Italy. J. Antimicrob. Chemother. 2016, 71, 2329–2331. [Google Scholar] [CrossRef] [Green Version]
  72. Malinen, M.; Ali, I.; Bezençon, J.; Beaudoin, J.; Brouwer, K. Organic solute transporter OSTα/β is overexpressed in nonalcoholic steatohepatitis and modulated by drugs associated with liver injury. Am. J. Physiol. Gastrointest. Liver Physiol. 2018, 314, G597–G609. [Google Scholar] [CrossRef]
  73. Rauch, J.; Chen, J.; Sorum, A.; Miller, G.; Sharf, T.; See, S.; Hsieh-Wilson, L.; Kampmann, M.; Kosik, K. Tau Internalization is Regulated by 6-O Sulfation on Heparan Sulfate Proteoglycans (HSPGs). Sci. Rep. 2018, 8, 6382. [Google Scholar] [CrossRef] [Green Version]
  74. Christine, X.; Yuwen, L.; Dennis, C.; Zhefeng, G. Thioflavin T as an amyloid dye: Fibril quantification, optimal concentration and effect on aggregation. R. Soc. Open Sci. 2017, 4, 160696. [Google Scholar]
  75. Biancalana, M.; Koide, S. Molecular Mechanism of Thioflavin-T Binding to Amyloid Fibrils. Biochim. Biophys. Acta 2010, 1804, 1405–1412. [Google Scholar] [CrossRef] [Green Version]
  76. Hunka, J.; Riley, J.; Debes, G. Approaches to overcome flow cytometry limitations in the analysis of cells from veterinary relevant species. BMC Vet. Res. 2020, 16, 83. [Google Scholar] [CrossRef] [PubMed] [Green Version]
  77. Li, Y.; Liu, P.; Shen, Y.; Snavely, M.; Hiraga, K. A Cell-Based Internalization and Degradation Assay with an Activatable Fluorescence-Quencher Probe as a Tool for Functional Antibody Screening. J. Biomol. Screen. 2015, 20, 869–875. [Google Scholar] [CrossRef] [PubMed]
  78. Minton, A. Recent applications of light scattering measurement in the biological and biopharmaceutical science. Anal. Biochem. 2016, 501, 4–22. [Google Scholar] [CrossRef] [Green Version]
  79. Yanase, Y.; Hiragun, T.; Ishii, K.; Kawaguchi, T.; Yanase, T.; Kawai, M.; Sakamoto, K.; Michihiro, H. Surface Plasmon Resonance for Cell-Based Clinical Diagnosis. Sensors 2014, 14, 4948–4959. [Google Scholar] [CrossRef]
  80. Wang, S.; Boussaad, S.; Tao, N. Surface plasmon resonance enhanced optical absorption spectroscopy for studying molecular adsorbates. Rev. Sci. Instrum. 2001, 72, 3055. [Google Scholar] [CrossRef] [Green Version]
  81. Frost, B.; Ollesch, J.; Wille, H.; Diamond, M. Conformational Diversity of Wild-type Tau Fibrils Specified by Templated Conformation Change. J. Biol. Chem. 2008, 284, 3546–3551. [Google Scholar] [CrossRef] [Green Version]
  82. Micsonai, A.; Moussong, É.; Wien, F.; Boros, E.; Vadászi, H.; Murvai, N.; Lee, Y.-H.; Molnár, T.; Réfrégiers, M.; Goto, Y.; et al. BeStSel: Webserver for secondary structure and fold prediction for protein CD spectroscopy. Nucleic Acids Res. 2022, 50, W90–W98. [Google Scholar] [CrossRef]
  83. Galliano, M.; Toulza, E.; Jonca, N.; Gonias, S.; Serre, G.; Guerrin, M. Binding of α2ML1 to the Low Density Lipoprotein Receptor-Related Protein 1 (LRP1) Reveals a New Role for LRP1 in the Human Epidermis. PLoS ONE 2008, 3, e2729. [Google Scholar] [CrossRef] [Green Version]
  84. Lillis, A.; van Duyn, L.; Murphy-Ullrich, J.; Strickland, D. LDL receptor-related protein 1: Unique tissue-specific functions revealed by selective gene knockout studies. Physiol. Rev. 2008, 88, 887–918. [Google Scholar] [CrossRef] [PubMed] [Green Version]
  85. Rudenko, G.; Henry, L.; Henderson, K.; Ichtchenko, K.; Brown, M.; Goldstein, J.; Deisenhofer, J. Structure of the LDL receptor extracellular domain at endosomal pH. Science 2002, 298, 2353–2358. [Google Scholar] [CrossRef] [Green Version]
  86. Ittisoponpisan, S.; Islam, S.; Khanna, T.; Alhuzimi, E.; David, A.; Sternberg, M. Can Predicted Protein 3D Structures Provide Reliable Insights into whether Missense Variants Are Disease Associated? J. Mol. Biol. 2019, 431, 2197–2212. [Google Scholar] [CrossRef] [PubMed]
  87. Yang, T.; Williams, B. Low-Density Lipoprotein Receptor-Related Proteins in Skeletal Development and Disease. Physiol. Rev. 2017, 97, 1211–1228. [Google Scholar] [CrossRef] [PubMed]
  88. Jeon, H.; Blacklow, S. Structure and physiologic function of the low-density lipoprotein receptor. Annu. Rev. Biochem. 2005, 74, 535–562. [Google Scholar] [CrossRef] [PubMed] [Green Version]
  89. Apostolopoulos, V.; Bojarska, J.; Chai, T.-T.; Elnagdy, S.; Kaczmarek, K.; Matsoukas, J.; New, R.; Parang, K.; Paredes Lopez, O.; Parhiz, H.; et al. A global review on short peptides: Frontiers and perspectives. Molecules 2021, 26, 430. [Google Scholar] [CrossRef]
  90. Hamley, I.W. Small bioactive peptides for biomaterials design and therapeutics. Chem. Rev. 2017, 117, 14015–14041. [Google Scholar] [CrossRef] [Green Version]
  91. Perlikowska, R. Whether short peptides are good candidates for future neuroprotective therapeutics? Peptides 2021, 140, 170528. [Google Scholar] [CrossRef]
  92. Naranda, T.; Wong, K.; Kaufman, R.; Goldstein, A.; Olsson, L. Activation of erythropoietin receptor in the absence of hormone by a peptide that binds to a domain different from the hormone binding site. Proc. Natl. Acad. Sci. USA 2021, 96, 7569–7574. [Google Scholar] [CrossRef] [Green Version]
  93. Hassan, N.; Alhossary, A.; Mu, Y.; Kwoh, C. Protein-Ligand Blind Docking Using QuickVina-W With Inter-Process Spatio-Temporal Integration. Sci. Rep. 2017, 7, 15451. [Google Scholar] [CrossRef] [Green Version]
  94. Nacharaju, P.; Ko, L.; Yen, S. Characterization of in vitro glycation sites of tau. J. Neurochem. 1997, 69, 1709–1719. [Google Scholar] [CrossRef] [PubMed]
  95. Avila, J.; Jiménez, J.; Sayas, C.; Bolós, M.; Zabala, J.; Rivas, G.; Hernández, F. Tau Structures. Front. Aging Neurosci. 2016, 8, 262. [Google Scholar] [CrossRef] [PubMed] [Green Version]
  96. Gonias, S.L.; Campana, W.M. LDL Receptor-related protein 1. Am. J. Pathol. 2014, 184, 18–27. [Google Scholar] [CrossRef] [PubMed] [Green Version]
  97. Ito, S.; Kimura, K.; Haneda, M.; Ishida, Y.; Sawada, M.; Isobe, K.-I. Induction of matrix metalloproteinases (MMP3, MMP12 and MMP13) expression in the microglia by amyloid-β stimulation via the PI3K/Akt pathway. Exp. Gerontol. 2007, 42, 532–537. [Google Scholar] [CrossRef] [PubMed]
  98. Guress, M.S.; Ural, M.N.; Gulec, M.A.; Akyol, O.; Akyol, S. Pathophysiological function of ADAMTS enzymes on molecular mechanisms of Alzheimer’s disease. Aging Dis. 2016, 7, 479–490. [Google Scholar] [CrossRef] [PubMed] [Green Version]
  99. Yamada, K.; Hashimoto, T.; Yabuki, C.; Nagae, Y.; Tachikawa, M.; Strickland, D.K.; Liu, Q.; Bu, G.; Basak, J.M.; Holtzman, D.M.; et al. The low density lipoprotein receptor-related protein 1 mediates uptake of amyloid beta peptides in an in vitro model of the blood-brain barrier cells. J. Biol. Chem. 2008, 283, 34554–34562. [Google Scholar] [CrossRef] [Green Version]
  100. Walter, S.; Jumpertz, T.; Hutternrauch, M.; Ogoerk, I.; Gerber, H.; Storck, S.E.; Zampar, S.; Dimitrov, M.; Lehmann, S.; Lepka, K.; et al. The metalloprotease ADAMTS4 generates N-truncated Aβ-x species and marks oligodendrocytes as a source of amyloidogenic peptides in Alzheimer’s disease. Acta Neuropathol. 2019, 137, 239–257. [Google Scholar] [CrossRef] [Green Version]
  101. Verghese, P.B.; Castellano, J.M.; Garai, K.; Wang, Y.; Jiang, H.; Shah, A.; Bu, G.; Frieden, C.; Holtzman, D.M. ApoE influences amyloid-β (Aβ) clearance despite minimal apoE/Aβ association in physiological conditions. Proc. Natl. Acad. Sci. USA 2013, 110, E1807–E1816. [Google Scholar] [CrossRef] [Green Version]
  102. Calandra, S.; Tarugi, P.; Speedy, H.; Dean, A.; Bertolini, S.; Shoulders, C. Mechanisms and genetic determinants regulating sterol absorption, circulating LDL levels and sterol elimination: Implications for classification and disease risk. J. Lipid Res. 2011, 52, 1885–1926. [Google Scholar] [CrossRef] [Green Version]
  103. Ahyayauch, H.; Raab, M.; Busto, J.V.; Andraka, N.; Arrondo, J.-L.R.; Masserini, M.; Tvaroska, I.; Goni, F.M. Binding of β-amyloid (1-42) peptide to negatively charged phospholipid membranes in the liquid-ordered state: Modeling and experimental studies. Biophys. J. 2012, 103, 453–463. [Google Scholar] [CrossRef] [Green Version]
  104. Lindberg, D.J.; Wesén, E.; Bjorkeroth, J.; Rocha, S.; Esbjorer, E.K. Lipid membranes catalyse the fibril formation of the amyloid-β (1-42) peptide through lipid-fibril interactions that reinforce secondary pathways. Biochim. Biophys. Acta. Biomembranes 2017, 1859, 1921–1929. [Google Scholar] [CrossRef] [PubMed]
  105. Van Gool, B.; Strock, S.E.; Reekmans, S.M.; Lechat, B.; Gordts, P.L.S.; Pradier, L.; Pietrzik, C.U.; Roebroek, A.J. LRP1 Has a Predominant Role in Production over Clearance of Aβ in a Mouse Model of Alzheimer’s Disease. Mol. Neurobiol. 2019, 56, 7234–7245. [Google Scholar] [CrossRef] [PubMed] [Green Version]
  106. Ganguly, P.; Do, T.; Larini, L.; LaPointe, N.; Sercel, A.; Shade, M.; Feinstein, S.; Bowers, M.; Shea, J.-E. Tau assembly: The dominant role of PHF6 (VQIVYK) in microtubule binding region repeat R3. J. Phys. Chem. B. 2015, 119, 4582–4593. [Google Scholar] [CrossRef] [Green Version]
  107. Lobanov, M.; Bogatyreva, N.; Galzitskaya, O. Radius of gyration is indicator of compactness of protein structure. Mol. Biol. 2008, 42, 701–706. [Google Scholar] [CrossRef]
  108. Durham, E.; Dorr, B.; Woetzel, N.; Staritzbichler, R.; Meiler, J. Solvent accessible surface area approximations for rapid and accurate protein structure prediction. J. Mol. Model. 2009, 15, 1093–1108. [Google Scholar] [CrossRef] [PubMed] [Green Version]
  109. Hou, T.; Wang, J.; Li, Y.; Wang, W. Assessing the performance of the MM/PBSA and MM/GBSA methods: II. The accuracy of ranking poses generated from docking. J. Comput. Chem. 2011, 32, 866–877. [Google Scholar] [CrossRef] [PubMed] [Green Version]
  110. Lippens, G.; Sillen, A.; Landrieu, I.; Amniai, L.; Sibille, N.; Barbier, P.; Leroy, A.; Hanoulle, X.; Wieruszeski, J. Tau aggregation in Alzheimer’s disease: What role for phosphorylation? Prion 2007, 1, 21–25. [Google Scholar] [CrossRef] [PubMed] [Green Version]
  111. Wegmann, S.; Jung, Y.J.; Chinnathambi, S.; Madelkow, E.-M.; Mandelkow, E.; Muller, D. Human Tau isoforms assemble into ribbon-like fibrils that display polymorphic structure and stability. J. Biol. Chem. 2010, 285, 27302–27313. [Google Scholar] [CrossRef] [Green Version]
  112. Maeda, S.; Sahara, N.; Saito, Y.; Murayama, M.; Yoshiike, Y.; Kim, H.; Miyasaka, T.; Murayama, S.; Ikai, A.; Takashima, A. Granular Tau Oligomers as Intermediates of Tau Filaments. Biochemistry 2007, 46, 3856–3861. [Google Scholar] [CrossRef]
  113. Morozova, O.A.; March, Z.M.; Robinson, A.S.; Colby, D.W. Conformational features of tau fibrils from Alzhiemer’s disease brain are faithfully propagated recombinant protein. Biochemistry 2013, 52, 6960–6967. [Google Scholar] [CrossRef] [Green Version]
  114. Chemes, L.B.; Alonso, L.G.; Noval, M.G.; de Prat-Gay, G. Circular dichroism techniques for the analysis of intrinsically disordered proteins and domains. Methods Mol. Biol. 2012, 895, 387–404. [Google Scholar] [PubMed]
  115. Sakamoto, K.; Shinohara, T.; Adachi, Y.; Asami, T.; Ohtaki, T. A novel LRP1-binding peptide L57 that crosses the blood brain barrier. Biochem. Biophys. Rep. 2017, 12, 135–139. [Google Scholar] [CrossRef] [PubMed]
  116. Cooper, J.; Migliorini, M.; Arai, A.; Catania, S.; Hyman, B.; Strickland, D. LRP1 mediates tau endocytosis in a process that is modulated by apolipoprotein E: Molecular and cell biology/receptors. Alzheimer’s Dement. 2020, 16, e045959. [Google Scholar] [CrossRef]
  117. Demeule, M.; Regina, A.; Poirier, J.; Béliveau, R.; Ché, C.; Nguyen, T.; Gabathuler, R.; Castaigne, J.-P. Identification and Design of Peptides as a New Drug Delivery System for the Brain. J. Pharmacol. Exp. Ther. 2007, 324, 1064–1072. [Google Scholar] [CrossRef]
  118. Demeule, M.; Currie, J.-C.; Bertrand, Y.; Ché, C.; Nguyen, T.; Régina, A.; Gabathuler, R.; Castaigne, J.-P.; Béliveau, R. Involvement of the low-density lipoprotein receptor-related protein in the transcytosis of the brain delivery vector Angiopep-2. J. Neurochem. 2008, 106, 1534–1544. [Google Scholar] [CrossRef]
Figure 1. Phyre2 model generated for CR3–10 region of CCR2 subunit of LRP1 receptor (a) before cleavage of the beta-propeller region (black); (b) after cleavage of beta-propeller region.
Applsci 13 00853 g001
Figure 2. Results from ClusPro modeling showing the interaction between PHF tau and LRP1 Cluster 2 (CCR2) domain. The 23-amino-acid segment SKAWVCDGDNDCEDNSDEENCES is shown in green. The LRP1 binding pocket identified from this model is outlined in pink. (a) Shows the interactions with the entire CCR2 domain with PHF Tau. (b) Close-up image showing residues of the binding pocket (in pink).
Applsci 13 00853 g002
Figure 3. PHF Tau structure with spheres representing the different binding pockets. Green spheres show pocket 1, red spheres represent pocket 2 and yellow spheres show pocket 3.
Applsci 13 00853 g003
Figure 4. Results obtained from docking studies showing the best binding modes for (a) TauRP1-2 (mode 6); (b) TauRP1-4 (mode1); (c) TauRP1-4 (mode 2); (d) TauRP1-8 (mode 3); (e) TauRP1-4 (mode 2) with PHF Tau.
Applsci 13 00853 g004
Figure 5. Left to right shows docked images of TauRP (1–2), TauRP (1–4), TauRP (1–8) and TauRP (1–14) with (a) MMP-13, (b) ADAMTS-4, (c) receptor-binding domain of ApoE4, (d) Aβ (1–42) fibrils.
Applsci 13 00853 g005
Figure 6. (a) Comparison of Cα RMSDs of PHF Tau upon binding to each of the TauRP peptides; (b) trajectory images of top three conformers based on clustering obtained at the last 25 ns of simulations from left to right for each ligand with PHF Tau. (i) TauRP1-2 with PHF Tau; (ii) TauRP 1–4 with PHF Tau; (iii) TauRP1-8 with PHF Tau; (iv) TauRP1-14 with PHF Tau.
Applsci 13 00853 g006
Figure 7. Comparison of RMSFs of the PHF Tau backbone upon binding with (a) TauRP1-2; (b) TauRP1-4; (c) TauRP1-8; (d) TauRP1-14. (Vertical lines show regions of interactions with PHF Tau.) (e) Comparison of radius of gyration of the selected four TauRP peptides upon binding with PHF Tau over 100 ns simulation. (f) Comparison of SASA values of the selected four TauRP peptides upon binding with PHF Tau over 100 ns simulation.
Applsci 13 00853 g007
Figure 8. (a) Tau fibrils grown at 37 °C. Scale bar = 1 μm (inset = 100 nm). (b) Tau fibrils after association with to TauRP1-14 for 24 h. Scale bar = 500 nm.
Applsci 13 00853 g008
Figure 9. Comparison of far UV CD spectra recorded for Tau fibrils before and after association with varying concentrations of TauRP (1–14).
Applsci 13 00853 g009
Figure 10. Comparison of change in percent reflectivity upon interaction of LRP1-expressed immobilized HEK-293 cells with neat Tau fibrils and Tau fibrils pre-associated with different concentrations of TauRP1-14 peptide.
Applsci 13 00853 g010
Figure 11. Flow cytometry analysis showing changes in uptake of fibrillar tau under various conditions. Red color represents LRP1-transfected cells treated with fibrillar tau. Green represents LRP1-transfected cells treated with tau fibrils in the presence of angiopep-2 and TauRP1-14 peptide. Blue represents transfected cells treated with fibrillar tau pre-associated with TauRP1-14 peptide. Orange represents untreated non-transfected cells.
Applsci 13 00853 g011
Table 1. Binding pocket scores for the LRP1 sequence obtained from PrankWeb.
PocketsRankScoreProbability
Pocket 1183.270.993
Pocket 2282.550.993
Pocket 3328.540.908
Table 2. Short peptide sequences designed derived from the 23-amino-acid sequence of the LPR1 binding segment.
Sequence AbbreviationSequence Designed
TauRP1-1SKAWVCDGDN
TauRP1-2KAWVCDGDND
TauRP1-3AWVCDGDNDC
TauRP1-4WVCDGDNDCE
TauRP1-5VCDGDNDCED
TauRP1-6CDGDNDCEDN
TauRP1-7DGDNDCEDNS
TauRP1-8GDNDCEDNSD
TauRP1-9DNDCEDNSDE
TauRP1-10NDCEDNSDEE
TauRP1-11DCEDNSDEEN
TauRP1-12CEDNSDEENC
TauRP1-13EDNSDEENCE
TauRP1-14DNSDEENCES
Table 3. Peptide secondary structures based on I-TASSER results.
PeptideSecondary StructureC-ScoreEstimated TM-Score
23-AA sequence from Cluster 2 Domain
SKAWVCDGDNDCEDN-SDEENCES
CCCSSSCCCCCCCCCCCHHHCCC0.350.76 ± 0.10
TauRP1-1 CCCSSCCCCC−0.590.64 ± 0.13
TauRP1-2 CCSSCCCCCC−0.330.67 ± 0.13
TauRP1-3 CCCCCCCCCC−0.150.69 ± 0.12
TauRP1-4 CCCCCCCCCC−0.160.69 ± 0.12
TauRP1-5CCCCCCCCCC−0.760.62 ± 0.14
TauRP1-6CCCCCCCCCC−0.050.71 ± 0.12
TauRP1-7CCCCCCCCCC−0.300.67 ± 0.12
TauRP1-8CCCCCCCCCC0.050.72 ± 0.11
TauRP1-9CCCCCCCCCC−0.600.64 ± 0.13
TauRP1-10CCCCCCCCCC0.480.78 ± 0.10
TauRP1-11CCCCCCCCCC0.070.72 ± 0.11
TauRP1-12CCCCCCCCCC−0.790.61 + 0.14
TauRP1-13CCCCCCCCCC−0.380.66 ± 0.13
TauRP1-14CCCCHHCCCC−0.300.67 ± 0.12
C = coil; S = beta strand; H = helix.
Table 4. Binding affinities and modes obtained by docking with the seven peptides selected based on results from the first round of docking.
Sequence AbbreviationMode 1Mode 2Mode 3Mode 4Mode 5Mode 6Mode 7Mode 8Mode 9
TauRP1-2Applsci 13 00853 i001
−4.6
Applsci 13 00853 i001
−4.5
Applsci 13 00853 i001
−4.5
Applsci 13 00853 i001
−4.4
Applsci 13 00853 i001
−4.4
Applsci 13 00853 i002
−4.3
Applsci 13 00853 i001
−4.2
Applsci 13 00853 i001
−4.2
Applsci 13 00853 i001
−4.1
TauRP1-4Applsci 13 00853 i002
−4.4
Applsci 13 00853 i002
−4.4
Applsci 13 00853 i001
−4.3
Applsci 13 00853 i001
−4.3
Applsci 13 00853 i001
−4.3
Applsci 13 00853 i001
−4.2
Applsci 13 00853 i001
−4.2
Applsci 13 00853 i001
−4.1
Applsci 13 00853 i001
−4.1
TauRP1-6Applsci 13 00853 i001
−4.9
Applsci 13 00853 i001
−4.9
Applsci 13 00853 i001
−4.8
Applsci 13 00853 i001
−4.8
Applsci 13 00853 i001
−4.8
Applsci 13 00853 i001
−4.8
Applsci 13 00853 i001
−4.7
Applsci 13 00853 i001
−4.7
Applsci 13 00853 i001
−4.7
TauRP1-7Applsci 13 00853 i001
−4.4
Applsci 13 00853 i001
−4.2
Applsci 13 00853 i001
−4.2
Applsci 13 00853 i001
−4.1
Applsci 13 00853 i002
−4.0
Applsci 13 00853 i001
−4.0
Applsci 13 00853 i001
−3.9
Applsci 13 00853 i001
−3.9
Applsci 13 00853 i001
−3.9
TauRP1-8Applsci 13 00853 i001
−5.3
Applsci 13 00853 i001
−5.3
Applsci 13 00853 i002
−5.2
Applsci 13 00853 i001
−5.2
Applsci 13 00853 i001
−5.1
Applsci 13 00853 i001
−5.0
Applsci 13 00853 i001
−5.0
Applsci 13 00853 i001
−4.9
Applsci 13 00853 i001
−4.8
TauRP1-13Applsci 13 00853 i001
−4.7
Applsci 13 00853 i001
−4.5
Applsci 13 00853 i001
−4.5
Applsci 13 00853 i001
−4.4
Applsci 13 00853 i001
−4.3
Applsci 13 00853 i001
−4.3
Applsci 13 00853 i001
−4.2
Applsci 13 00853 i001
−4.2
Applsci 13 00853 i001
−4.2
TauRP1-14Applsci 13 00853 i001
−5.8
Applsci 13 00853 i002
−5.7
Applsci 13 00853 i001
−5.7
Applsci 13 00853 i001
−5.6
Applsci 13 00853 i001
−5.5
Applsci 13 00853 i001
−5.4
Applsci 13 00853 i001
−5.3
Applsci 13 00853 i001
−5.3
Applsci 13 00853 i001
−5.3
Applsci 13 00853 i001 indicates that peptide was found outside the LRP1 binding pocket. Applsci 13 00853 i002 indicates modes where the peptide bound within the predicted binding pocket.
Table 5. MMGBSA studies.
Name of PeptideAverage ΔG Binding Energy (kcal/mol)Average
Electrostatic Energy (kcal/mol)
Average H-Bond Energy
(kcal/mol)
Average
Lipophilic Energy
(kcal/mol)
Average vdW Energy
(kcal/mol)
TauRP1-2−75.716.73−5.20−9.59−58.42
TauRP1-4−53.43−215.64−5.01−8.74−43.89
TauRP1-8−42.05−235.13−5.57−4.01−52.34
TauRP1-14−70.70−342.01−10.17−5.61−53.01
Table 6. Secondary elements detected in CD spectra upon interactions with TauRP (1–14) with fibrillar Tau.
Secondary StructureTau Fibrils without TauRP1-14Tau Fibrils Pre-Associated with 10 µM TauRP1-14Tau Fibrils Pre-Associated with 20 µM TauRP1-14Tau Fibrils Pre-Associated with 40 µM TauRP1-14
Helix23.1%1.50%0.00%17.8%
Antiparallel β-sheet17.8%31.5%37.5%14.6%
Parallel β-sheet26.5%0.00% 0.00%0.00%
Turn24.7%13.9%14.1%12.0%
Disordered7.9%53.1%48.3%55.6%
Disclaimer/Publisher’s Note: The statements, opinions and data contained in all publications are solely those of the individual author(s) and contributor(s) and not of MDPI and/or the editor(s). MDPI and/or the editor(s) disclaim responsibility for any injury to people or property resulting from any ideas, methods, instructions or products referred to in the content.

