Abstract
One of the components necessary to determine the width of a safe maneuvering area on two-way fairways is a safe passing distance. Existing methods do not consider modern model studies of interactions between passing vessels, additionally, they ignore the influence of the vessel’s position accuracy and navigators’ qualifications. This paper presents a method to determine the passing distance, which is free of the drawbacks of the methods used so far. The proposed method is based on simulation research carried out using an FMBS-type (Full Mission Bridge) simulator. The tests were carried out for three loaded vessels (bulk carrier, tanker, and sea ferry), on four sections of the fairway with different parameters and aids-to-navigation available. The results obtained allowed the modification of the authors’ previous, but still widely used, deterministic–probabilistic MTE (Marine Traffic Engineering) method for determining the width of a safe maneuvering area.
1. Introduction
There are several empirical methods for determining the width of safe maneuvering areas for ships on fairways [1,2,3,4]. In the case of two-way traffic, which improves the traffic flow and fairway capacity (and, thus, harbor turnovers and revenues by cost and energy savings), the basic problem is to determine the passing distance considering:
- Parameters of passing ships;
- Reservoir parameters (e.g., depth, cross-section);
- Ship-to-ship interactions;
- Parameters (e.g., accuracy) of the navigation positioning systems on site;
- Individual navigator characteristics (e.g., qualifications).
The most frequently used method for determining the parameters of safe maneuvering areas is the deterministic method, developed and recommended by PIANC [2,5] (World Association for Waterborne Transport Infrastructure). In this method, the passing distance () was determined using model studies of ship-to-ship interaction, and its value is expressed in the breadth (B) of the larger ship [2]:
- For speeds V ≤ 8 knots:
- For speeds V = 8–12 knots:
- For speeds V > 12 knots:
- The solution proposed by PIANC was adopted in the authors’ deterministic–probabilistic MTE (Marine Traffic Engineering) method [6], for which the differences relate to the methods of calculating the remaining components of the width of the safe maneuvering area.
Another method for determining the width of a two-way fairway is the method recommended by the Spanish company Puertos del Estado, responsible for the management of state-owned ports [3]. According to this method, the passing distance is calculated as a sum of two factors determined on the assumption that the operation is undertaken with pilots or captains experienced in the site under consideration. The values of the factors are presented in Table 1.

Table 1.
Factors for passing distance calculation (Spanish method) [3].
- A further method used to determine the width of a two-way waterway is the method developed by the Japan Institute of Navigation [4]. In this solution, it is recommended to assume the value of the passing distance based on the type of the ship. The values range from 0.67B for fully loaded tankers to 1.95B for container ships.
- In view of the above, it can be concluded that the solutions proposed by the PIANC (and MTE) method as well as Spanish and Japanese methods do not take into account neither the results of contemporary model studies of ship-to-ship interactions regarding the particularly limited speeds at which the ships travel on fairways when passing, nor the accuracy of their positioning and the qualifications of navigators.
- The article attempts to determine, on the basis of the results of simulation studies, a safe and efficient distance between passing vessels considering the shortcomings of the above methods. The main assumptions of the proposed solution are:
- The simulation (mathematical) models of the movement of the studied ships consider the results of contemporary model studies on ship-to-ship interaction;
- The simulation experiment is carried out on a specific sections of the Świnoujście-Szczecin (Poland) waterway with existing visual navigation markings (aids-to-navigation) implemented on a FMBS-type simulator;
- The simulation experiment involves navigators experienced in maneuvering ships on investigated fairway (captains and pilots).
2. Materials and Methods
- Simulation studies of three passing, identically loaded ships (bulk carrier, tanker, and sea ferry) with lengths of 220 m, 103.6 m and 228 m, respectively, were carried out. The research was conducted on four sections of the Świnoujście-Szczecin waterway with different parameters and different navigational (optical) markings. The results of these studies were used to determine the distance between the passing ships on the fairway considering the accuracy of position determination.
- The distance between the passing vessels determined by a simulation method considers the accuracy of determining the position of passing vessels. This allows a modification of the deterministic–probabilistic MTE method that determines the width of the safe maneuvering area on the fairway for two-way traffic.
2.1. Ship-to-Ship Interaction in Model and Simulation Studies
The magnitude of the mutual hydrodynamic interaction between two vessels directly depends on their absolute speeds as well as their relative speeds, and on the lateral distance between the vessels. Ship-to-ship interactions are also very much affected by the simultaneous restriction of the body of water by depth. Other important factors in the phenomenon are the mutual relationship of dimensions and shape of the vessels, and the type of encounter:
- Passing, i.e., parallel movement on opposite courses (the subject of this article);
- Overtaking, i.e., similar movement, but on the equal courses and with different speeds;
- Passing a stopped or moored vessel—for methodological and application reasons, this case is treated independently, especially from the point of view of the danger to the moored vessel.
Ship-to-ship reactions are a fast-varying phenomenon. The instantaneous values of the individual components of the ship-to-ship effect interactions, the most important of which are the transverse force and moment, depend directly on the actual longitudinal position (stagger) of the vessels. Other factors are treated as parameters of these relationships. Due to the number of arguments and the vast variety of possible conditions, especially related to the arbitrariness of the target vessel, it is difficult, at the current stage of scientific development, to describe mathematically the occurring process in a universal way. This poses a major scientific challenge despite the significant progress in ongoing and published research in recent years, both theoretical and, above all, experimental (model) methods on ship-ship interaction (see, among others, the series of six MASHCON conferences from 2009 to the present on ship maneuvering in shallow and restricted waters especially [7]). Most data are on the interaction forces themselves, either measured on captive models or computed numerically via CFD (Computational Fluid Dynamics) methods. Especially, there is an insufficient amount of research on ship-to-ship interaction, either through model tests of free-running (self-propelled) models or through motion simulation. In the latter method, the acquired data on interaction forces must be combined with the hydrodynamic characteristics of the hull, propeller, and rudder, which also need to be identified.
Passing in a restricted area is widely regarded as safer than overtaking. This is due to the high relative speed of the target vessel and the short time the vessels are in each other’s vicinity. It can be concluded that the order of magnitude of the lateral force and moment of the ship-to-ship effect at similar speeds and lateral distances of the vessels is similar for passing and overtaking. However, during passing, this will translate into comparatively small changes in lateral distance (due to lateral suction/push forces) and heading angle of both vessels (due to moments), since the magnitude of vessel displacement (linear and angular) according to Newton’s law, depends on the square of the interaction time.
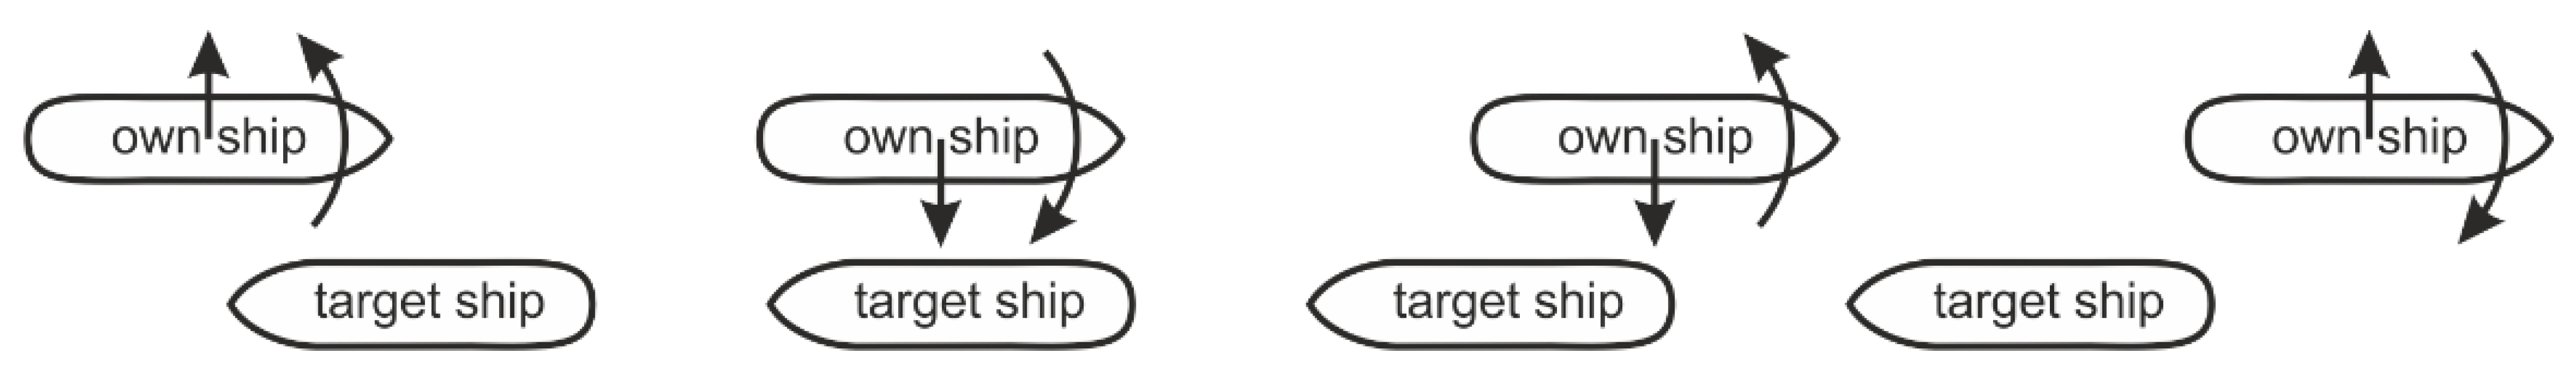
Qualitative changes in the lateral force and moment of the ship-to-ship effect, and, thus, the tendencies of movement in the absence of control, are shown in the case of passing ships in Figure 1. These are based on the consideration of identical vessels with longitudinal symmetry. However, in the encounters of real vessels often of different types (shapes) and dimensions, the various phases may shift or even disappear.
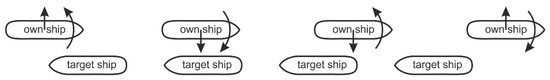
Figure 1.
Phases of ship-to-ship effect during passing.
The number of factors necessary to consider and the complexity of the ship-to-ship interaction phenomenon for the passing case is relatively large. This dictates extreme caution in the interpretation and application (extrapolation) of existing results. Extensive systematic model studies of the ship-to-ship effect in terms of forces published in [8], among others, became the basis for our motion simulations. From the point of view of interaction forces acting on the own-ship, the transverse force and moment of the ship-ship effect were modelled in simulations as:
where:
| ρ | – | water density |
| L | – | length (between perpendiculars) of the ship |
| T | – | draft of the ship |
| vo, vt | – | longitudinal velocity of the own and target ship |
| cfy_SS, cmz_SS | – | dimensionless coefficients of transverse force and moment, which are functions of six arguments:
|
The measurements of [8] for ships of similar size (length) were fitted into the above model of forces and their dimensionless coefficients—Figure 2 and Figure 3. These were the tanker ‘E’ (according to the original designations, L = 287 m) as own-ship and the container ship ‘D’ (L = 290 m) as a target ship. The range of tested speeds in [8] for both vessels was 12, 10, 8, and 6 kn.
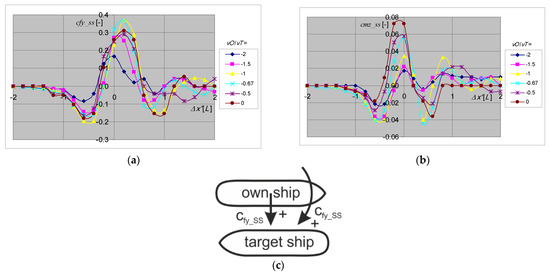
Figure 2.
Dimensionless coefficients cfy_SS (a), cmz_SS (b) and sign convention (c) (side-to-side distance = 0.5B, ycc_B = 1.5B, and h/T = 1.2, data based on [8]).
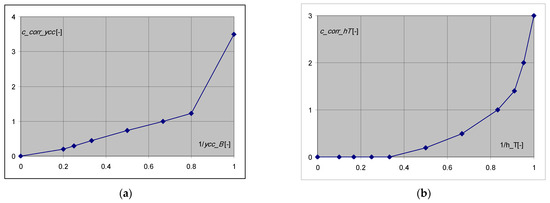
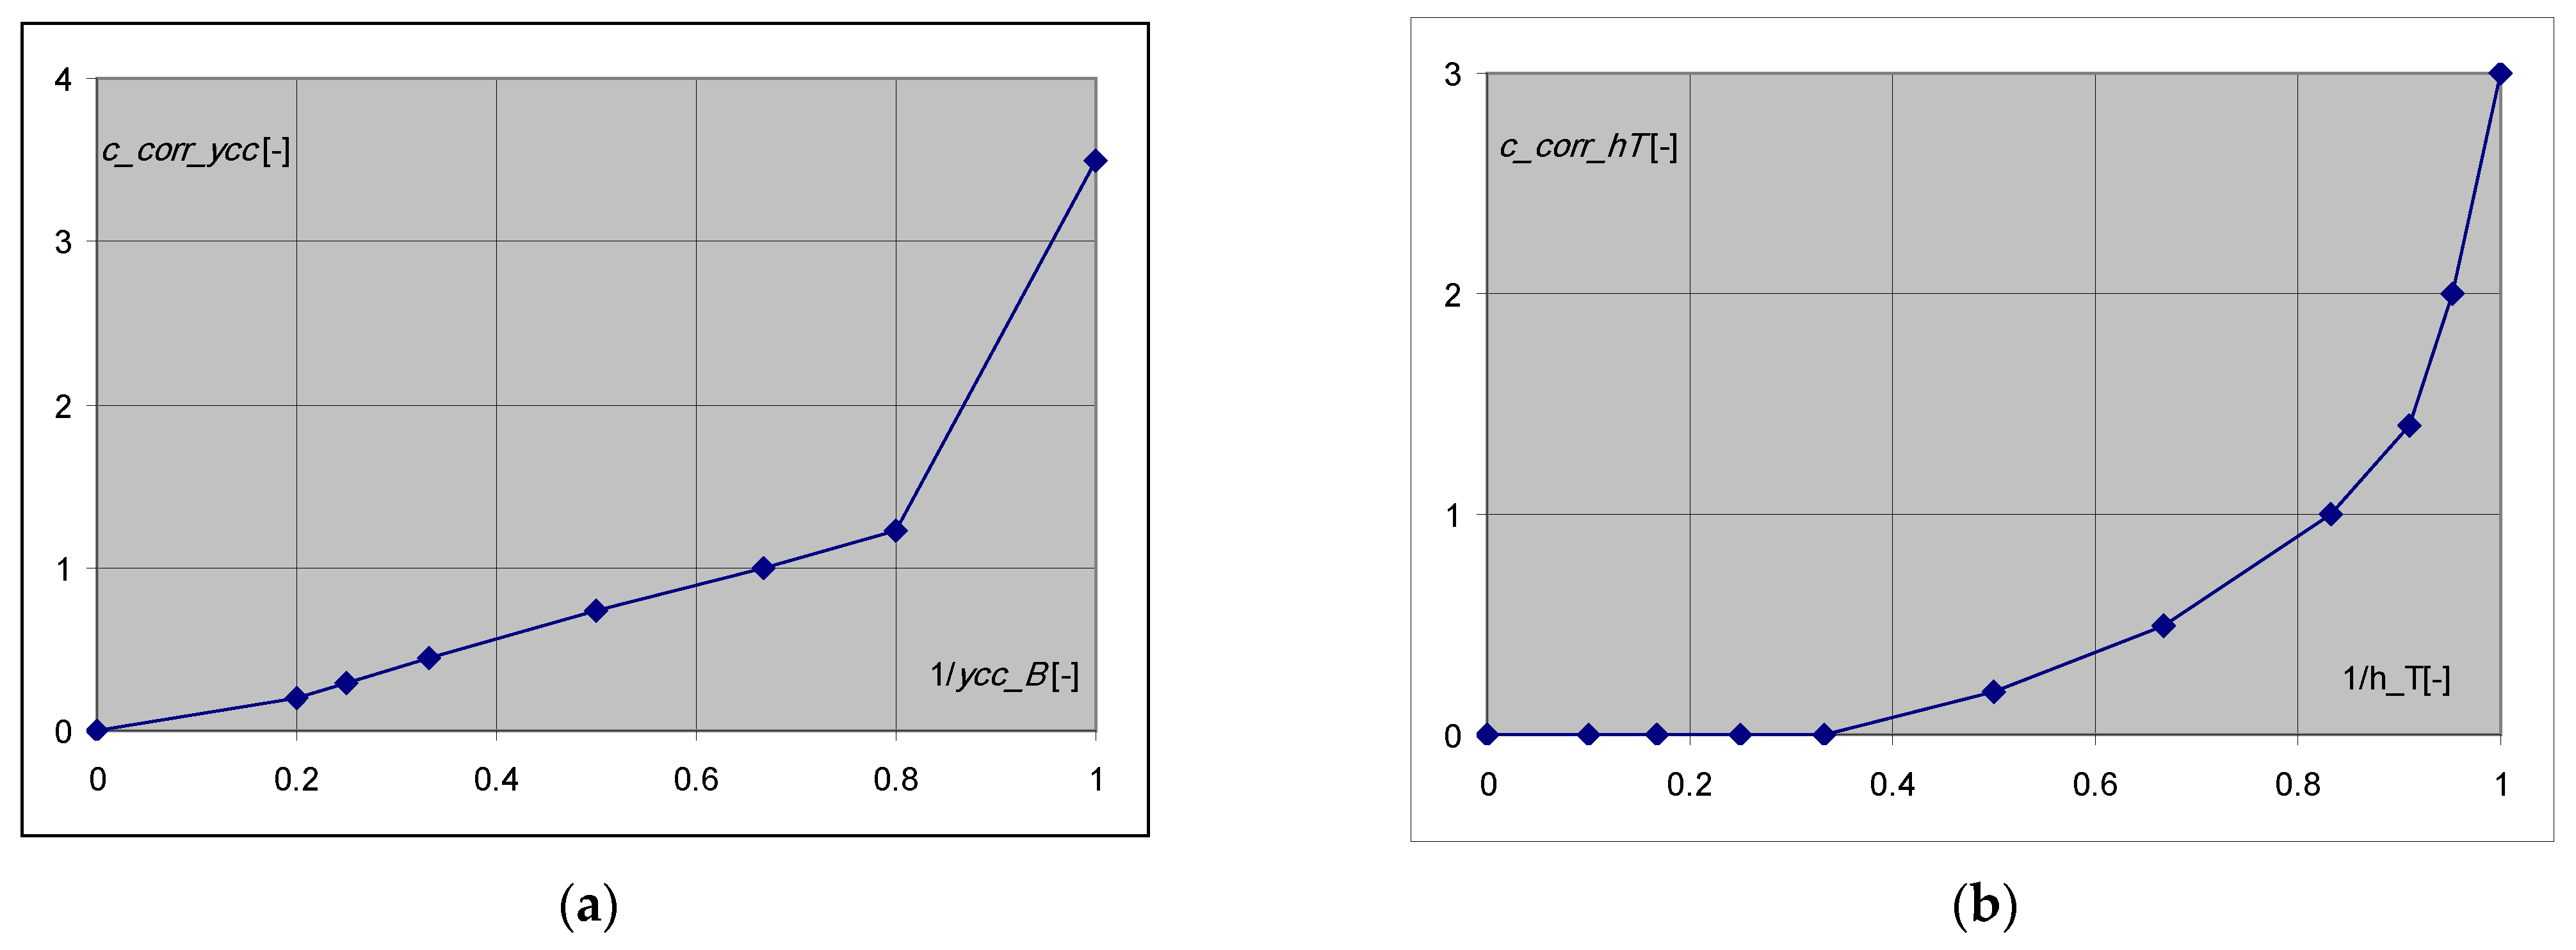
Figure 3.
Correction multipliers (to Figure 2) for the effect of actual lateral distance (a) and shallow water ratio h/T (b) (own approximations based on [8]).
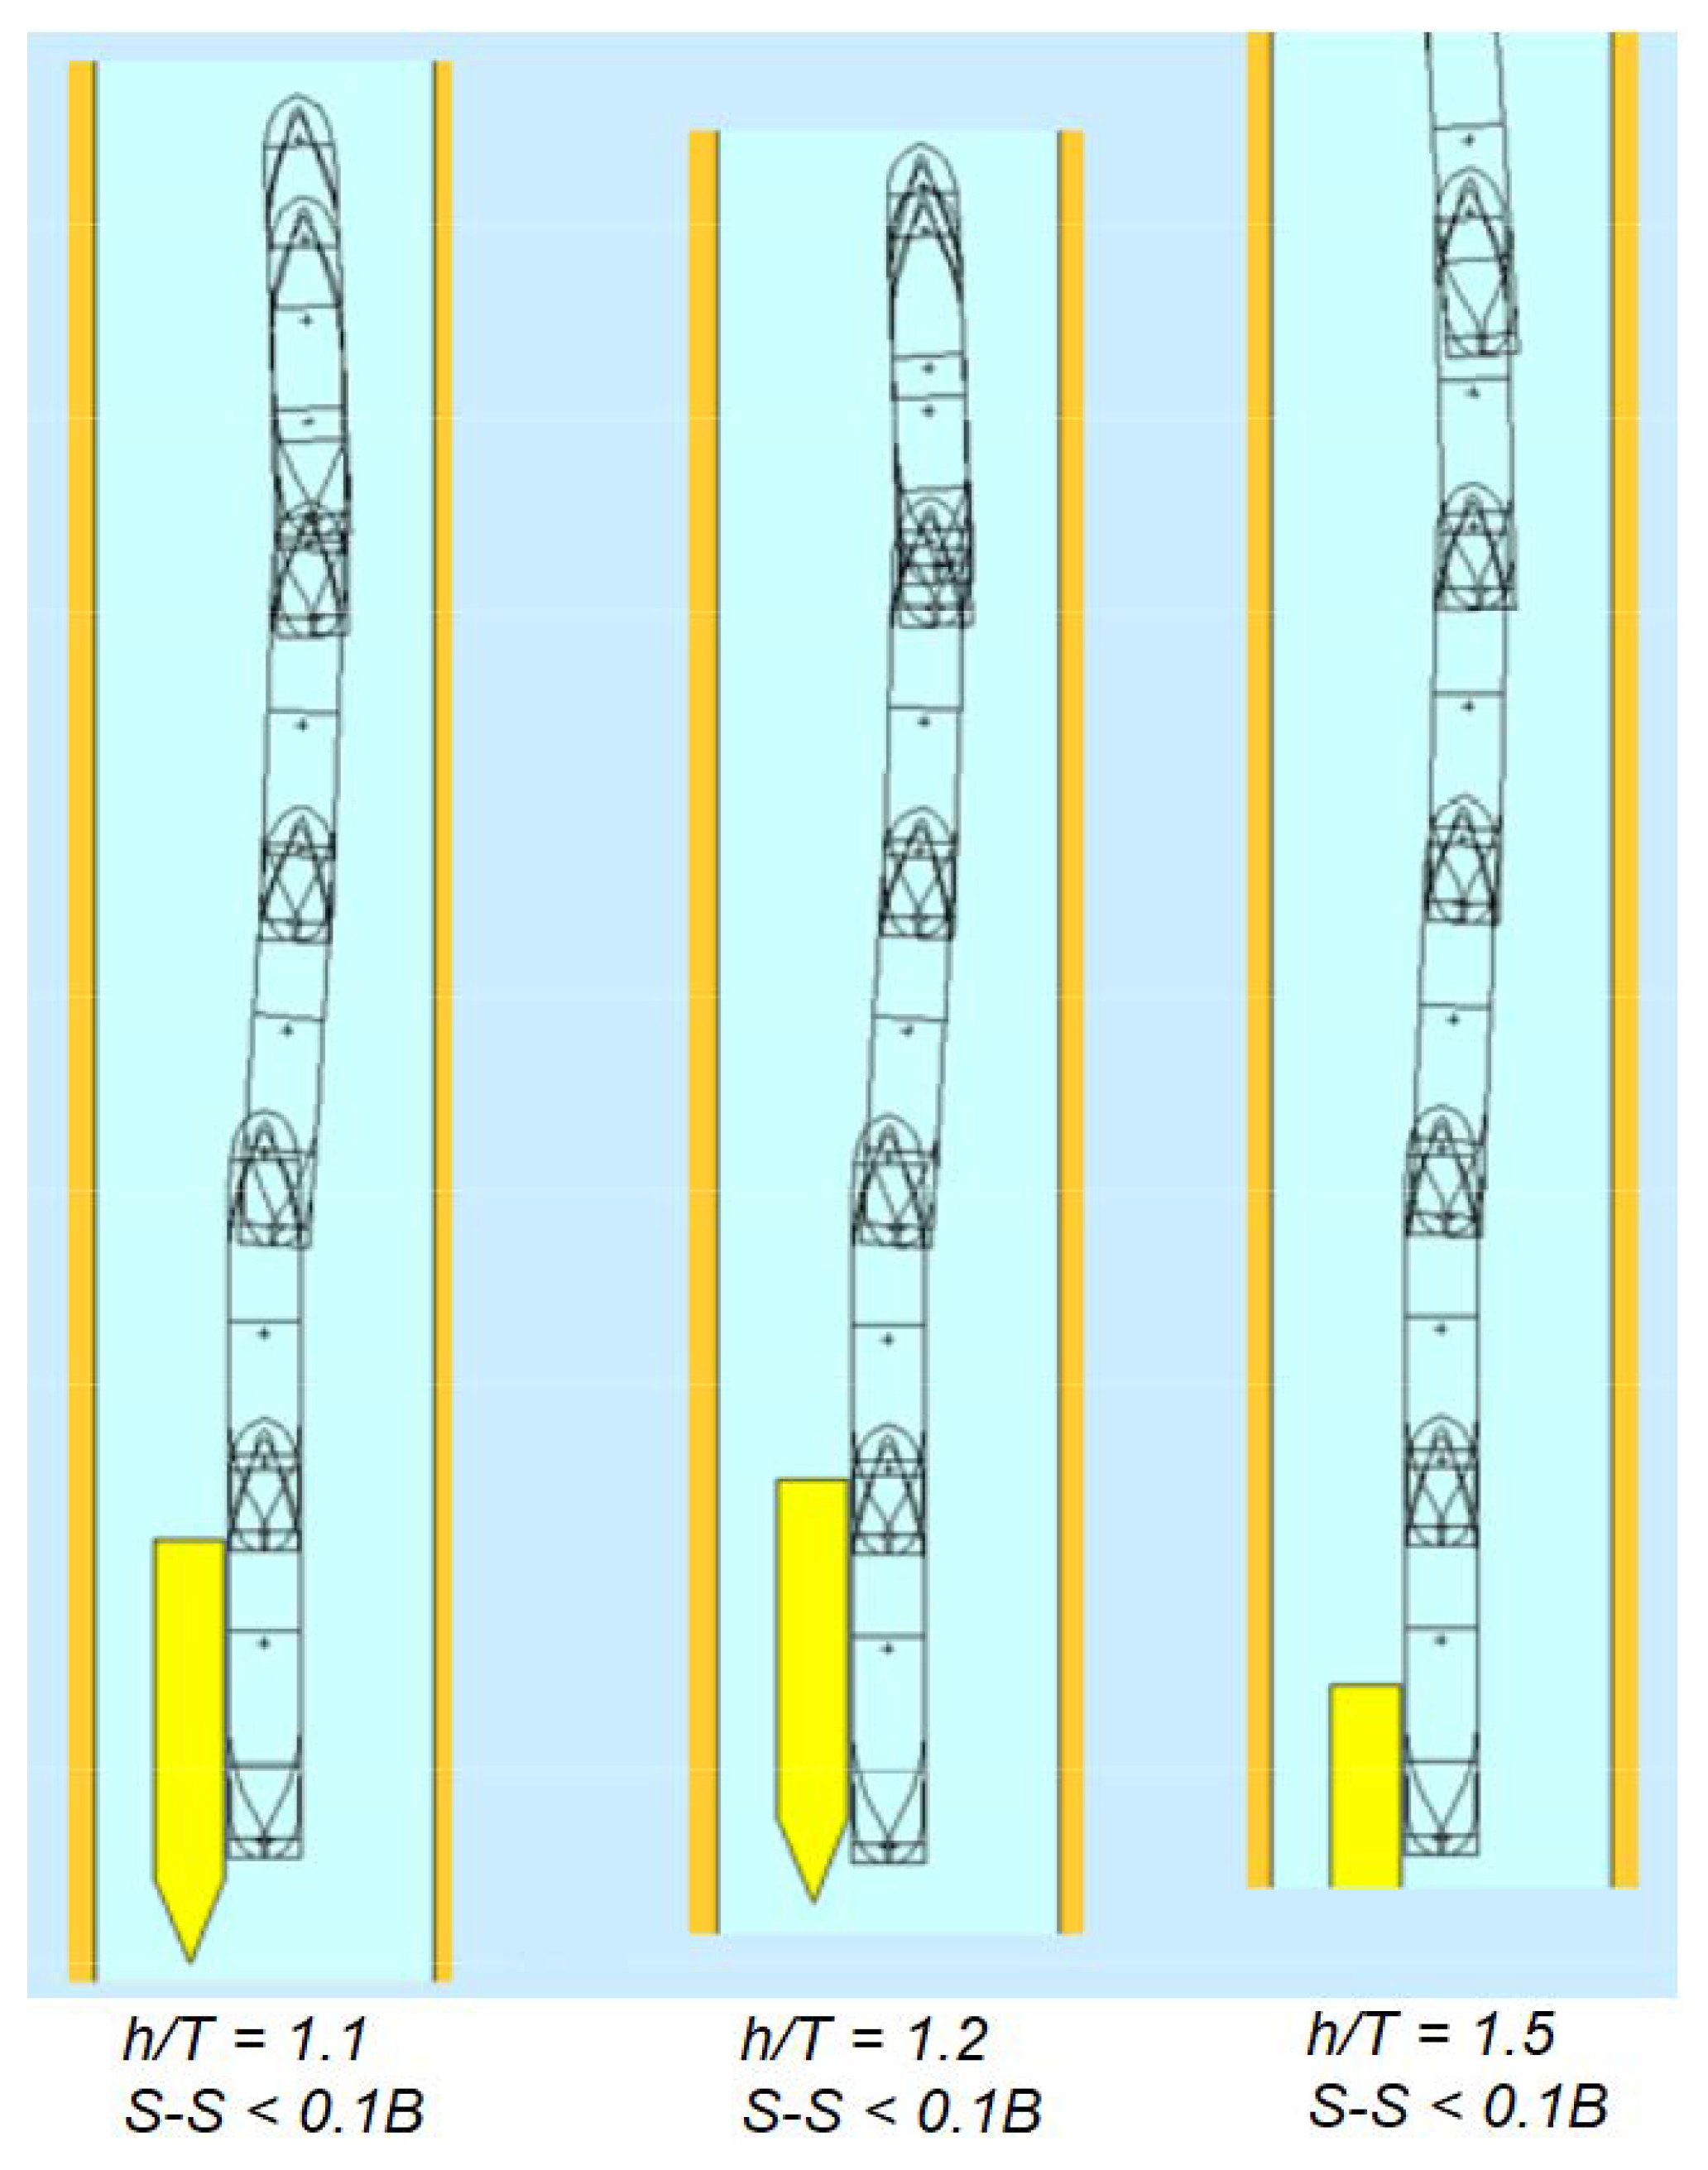
Verification of ship-to-ship interaction was carried out for a tanker model L = 103.6 m on the desktop simulator (called SMART) of the Maritime University of Szczecin for the following conditions:
- Side-to-side distance: <0.1B, 0.25B;
- vo, vt = 8, 10 kn and vo = 8, 10 kn and vt = 0 kn (stopped);
- h/T = 1.1, 1.2, 1.5.
The hydrodynamic characteristics of hull, propeller and rudder of the tanker model were identified and calibrated (against full-scale trials and existing free-running model tests) in the authors’ past research.
Exemplary results of simulated passing at vt = 0 kt and vo = 10 kn are shown in Figure 4, while Figure 5 shows the results of passing at vo = vt = 10 kn. In these simulations, the initial bow-to-bow distance of own and target ships (both of equal size) was equal to 1 ship length for Figure 4, and 2 ship lengths for Figure 5. Ship contours are plotted every 5 s, Figure 4, or 15 s, Figure 5. The own-ship is without any active control in these scenarios, with her engine running ahead and rudder amidships, and the bank effect from either bank is switched off. The SMART software is a single own-ship simulator, at which the target ship in motion (moving at constant speed and heading/course) or in rest cannot have her dynamics like the own-ship. This is a certain drawback of the software, especially while testing the interaction at very close distance, e.g., corresponding to less than 0.1B, mostly in both Figure 4 and Figure 5. However, the first steps to implement the second own-ship (and even more own-ships) within SMART software have already started. The second own-ship can then keep the role of interactive target ship in ship-to-ship interaction simulation studies.
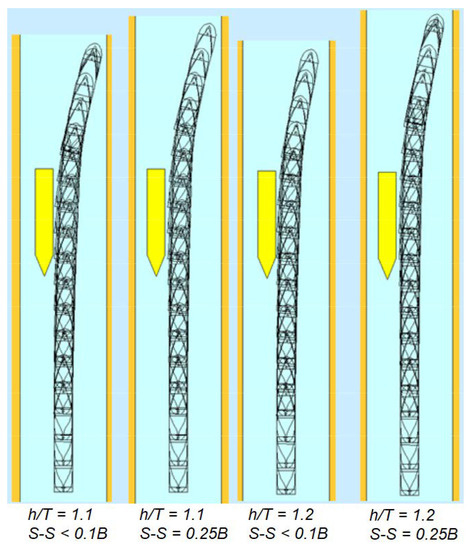
Figure 4.
Passing with a stopped target vessel (vt = 0 kt, vo = 10 kt) (where S-S means side-to-side distance).
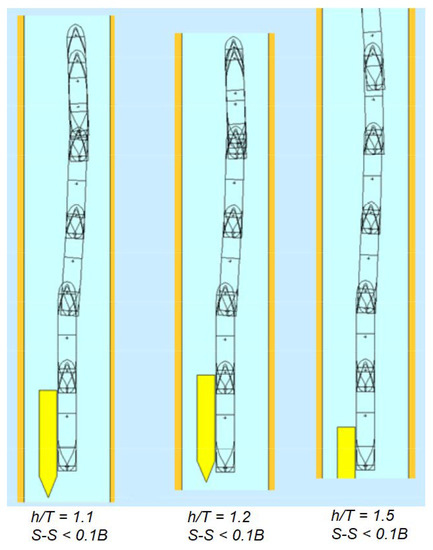
Figure 5.
Passing with same speed (vt = vo = 10 kt).
The lateral distance case 0.25B in Figure 4 is only given for rough comparison. One can find out therein that the contour track is almost identical for both lateral distances. The own-ship is able to be kept with the null rudder practically within the fairway limits and the own-ship is diverted, surprisingly, in heading starboard for the stagger position stern-to-stern. After a while, the ship can return safely with her rudder steering back to the fairway centerline.
The kinematic behavior, in terms of the track composed of own-ship contours in relation to the stationary target ship, at speed 8 kn (not shown in the paper), is very similar to the case of 10 kn in Figure 4, likely because of the same level of decrease in ship-to-ship forces versus the counteracting hull forces due to drift and yaw. The time scale (and density of ship’s contours) is only slightly different in this case. In Figure 4, the distance 0.1B between the ships’ sides seems to be geometrically/physically the minimum distance. If less, both ships should collide.
Figure 5 displays that the ship (without rudder control), after the interaction-excited initial brief and small disturbance, is naturally stabilizing her heading. This is an interesting feature. The navigator needs no counteraction in this situation. The marked target ship position in Figure 5 represents her position when the simulation terminates.
Although Figure 4 and Figure 5 are based on a small ship (~100 m in length), the Froude similitude laws enable the extrapolation of the results to smaller or larger ships of equal size. It is just sufficient to scale/multiply the x-y coordinates by the ship length variation and the time by the inverse of the ship length square root. Thus, the tracks in ship length (or breadth) units are the same.
2.2. Simulation Experiment of Passing Ships on Waterways
The simulation study procedure used in the design of marine waterways and the determination of conditions for their safe operation is carried out in the following order [9,10]:
- Formulation of the research problem, including identification of the design goal, the simulation methods used and the type of simulators;
- Construction of ship movement models on a selected simulator and their verification, as well as construction of a basin model;
- Designing the experimental setup and conducting the experiment;
- Development and statistical analysis of research results.
The purpose of the simulation study was to determine the distance between passing vessels of equal size on different straight sections of the Świnoujście-Szczecin waterway with existing navigation markings. The research was conducted on a Kongsberg Polaris- FMBS type simulator at the Maritime University of Szczecin, where the above model of ship-ship interaction was also implemented.
The distance was determined for passing vessels of equal size with the parameters presented in Table 2:
Table 2.
Parameters of the examined vessels.
Simulation models of the motion of these ships were built and verified. The verification of the motion models was based on the maneuvering characteristics of existing ships. The simulation models consider the ship-to-ship interaction described in the previous chapter (Section 2.1).
The simulation experiment consisted of performing four series of passing maneuvers of identical ships (12 passing maneuvers in a series). One of the passing ships (a target ship) moved on an assumed course parallel to the track axis. On the second ship (own-ship), the passing maneuver was performed by navigators with maneuvering experience on specific types of ships (captains, including sea ferry captains) each with one passing maneuver in the series.
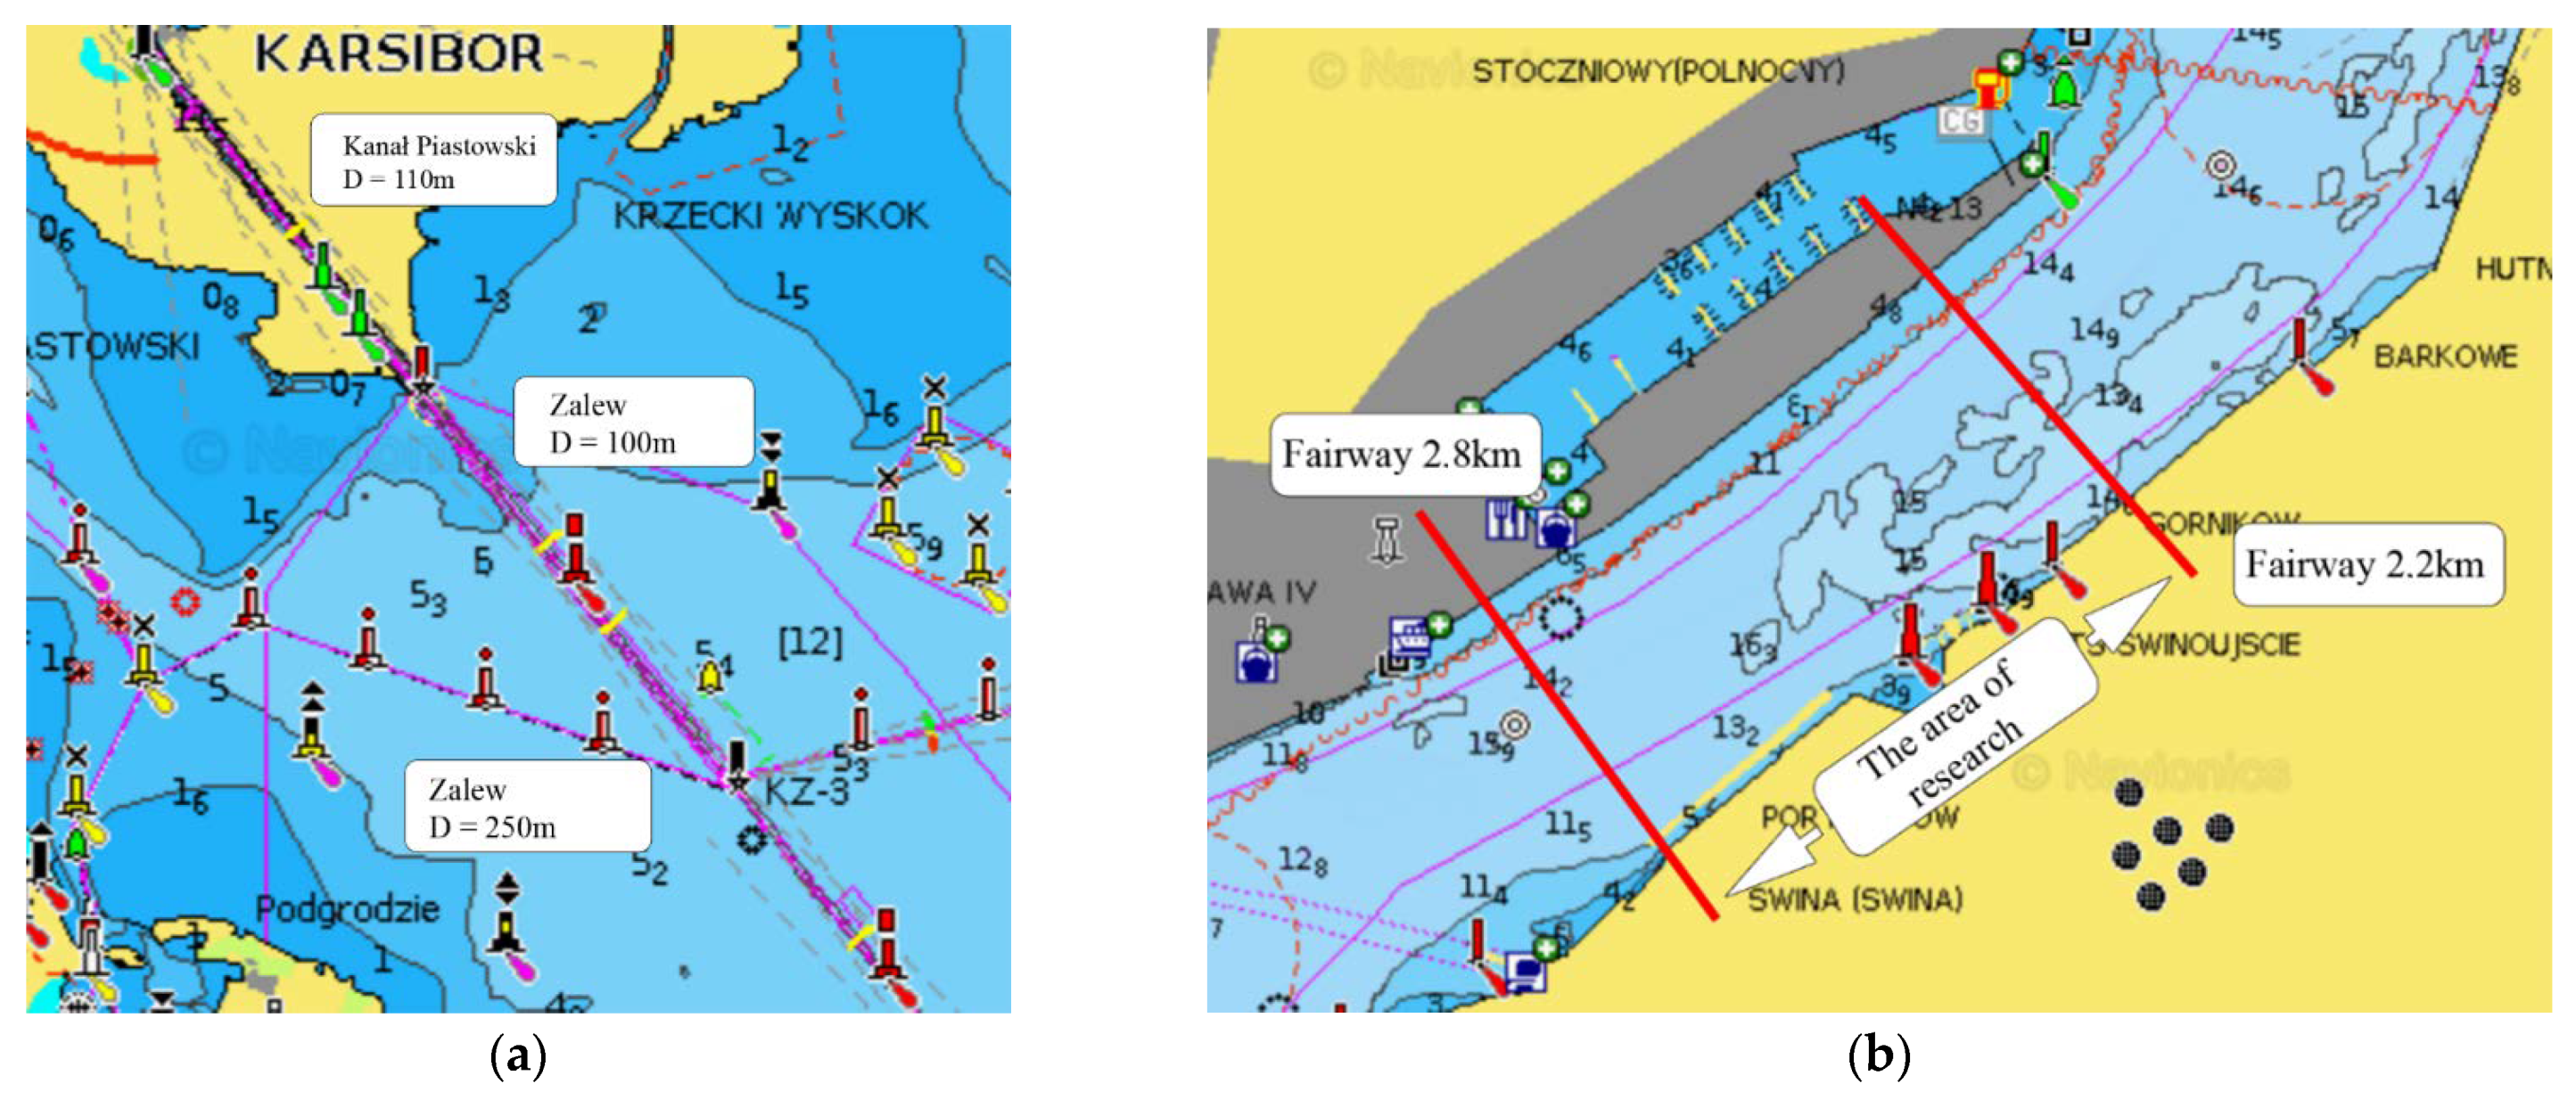
Maneuvers were performed on the Świnoujście-Szczecin waterway on the following straight sections (Figure 6)

Figure 6.
Research area, sections 1, 2, 3 (a) and section 4 (b).
- Kanał Piastowski (Piast Canal) (bottom width D = 110 m, depth h = 12.5 m)—passing ships LOA = 103.6 m;
- Zalew Szczeciński (Szczecin Lagoon) between the Brama Torowa (Fairway Gate) I and II (bottom width D = 100 m, depth h = 12.5 m)—passing ships LOA = 103.6 m;
- Zalew Szczeciński (Szczecin Lagoon) between the Brama Torowa (Fairway Gate) II and III (bottom width D = 250 m, depth h = 12.5 m)—passing ships LOA = 220 m;
- Świnoujście Port—Kanał Zbiorczy (Zbiorczy Canal) (bottom width D = 200 m, depth h = 8.0 m)—passing ships LOA = 228 m.
Navigators performing simulated passing maneuvers used visual navigation methods, using existing navigation markings. The Kanał Piastowski is an artificial inland canal, bounded by banks approx. 200 m wide. The fairway in the Zalew Szczeciński has a lateral navigation marking system: paired buoys and beacons. At the same time, in the simulation studies, the buoys were treated as the beacons due to the lack of drift of the buoys on their anchor chains. The spacing of the buoys between Brama Torowa I and II is r = 150 m, while between Brama Torowa II and III it is r = 250 m. In the Port of Świnoujście, the Kanał Zbiorczy is the part of Odra River bound by built-up banks with a width 275 m—295 m. The speed of the ships when passing was about 8 knots.
3. Results
The results of the simulation studies were statistically processed by determining the minimum distances between the sides of passing ships for each series of maneuvers. The minimum distances between the sides of passing vessels determined at the confidence level (1−α) = 0.95 for the four series of tests are respectively:
- Kanał Piastowski: dmin1 = 26.4 m;
- Zalew Szczeciński between the Brama Torowa I and II: dmin2 = 20.8 m;
- Zalew Szczeciński between the Brama Torowa II and III: dmin3 = 37.9 m;
- Świnoujście Port—Kanał Zbiorczy: dmin4 = 41.9 m.
The simulation results obtained clearly show that for the minimum passing distances of ships on the fairways, chosen/judged by navigators to be safe, direct ship-to-ship interaction is insignificant. The minimum passing distances determined by the simulation method are larger than the breadth of the passing ships. At such lateral distances and ship speeds (8 knots), the magnitude of the mutual hydrodynamic interaction between ships is small and does not affect the movement of passing ships. This low interaction, in terms of a kinematic effect—linear/angular displacements produced by suction and repulsion phenomena, is basically due to brief time (high relative speed) as stated in the previous section. Considering the assumptions and conditions of the study and analyzing the results, it can be concluded that the minimum passing distances of identical loaded vessels with the block coefficient CB = 0.67–0.8 (bulk carriers, tankers, sea ferries) under good hydrometeorological conditions depend solely on:
- Parameters of passing ships (i.e., their breadth);
- Parameters of the navigation systems used (accuracy of position determination).
The parameters of the navigation systems are considered by the deterministic–probabilistic MTE method developed at the Maritime University of Szczecin [6]. In this method, the maneuvering component of the width of the safe maneuvering area (lane) dm is determined deterministically, while the navigational component of the width of the safe maneuvering area dn(1−α) is probabilistic, and determined at a certain confidence level. The passing distance determined by the simulation method is also probabilistic and its inclusion modifies the MTE method for two-way traffic on fairways.
4. Discussion
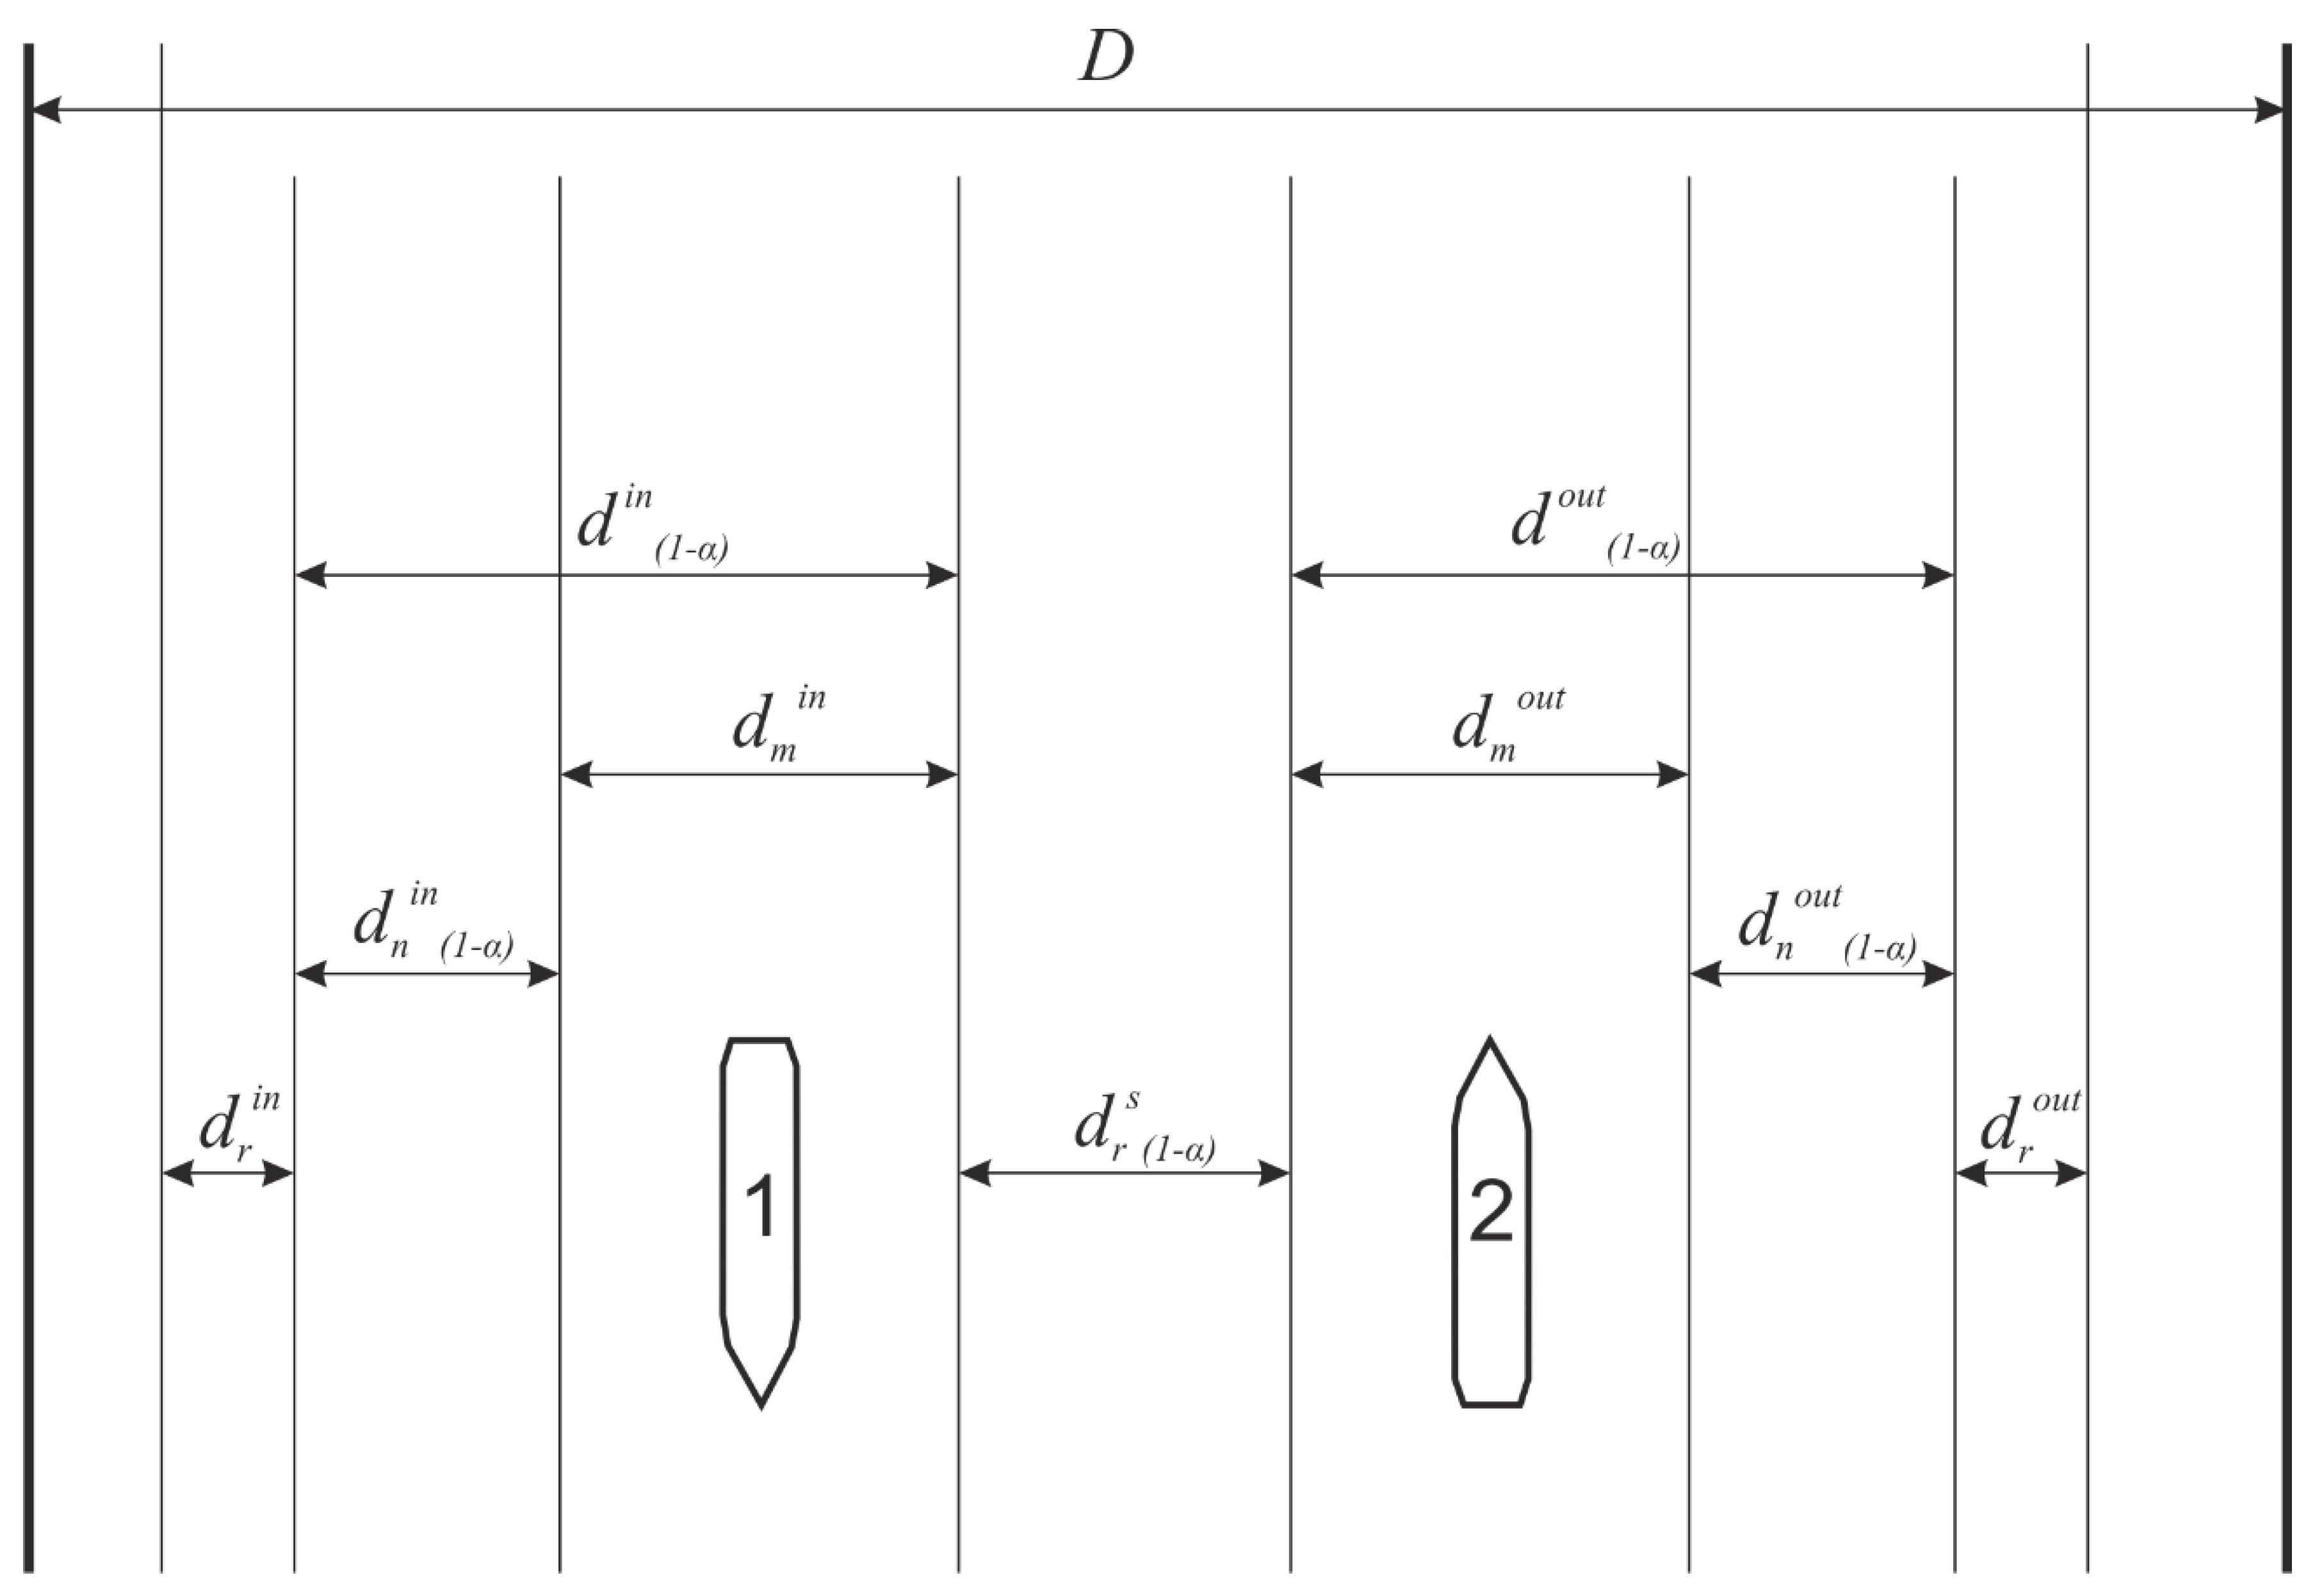
The MTE method assumes that to ensure the safe passage of ships, the following condition must be met:
where:
| D | – | width of the available maneuvering area |
| – | width of the safe maneuvering area of the ingoing ship at the specified confidence level (1-α) | |
| – | width of the safe maneuvering area of the outgoing ship at the specified confidence level (1-α) | |
| – | reserve of the width of the maneuvering area on the outer side of the ingoing ship | |
| – | reserve of the width of the maneuvering area on the outer side of the outgoing ship | |
| – | passing distance |
In the modified MTE method, the general condition (5) remains the same, but the method of calculating its components changes. The widths of the safe maneuvering areas of ships take into account the navigational component only on the outer sides of the passing ships, since from the inner sides (from the side of the passing ship) the accuracy of determining the position is taken into account by the passing distance determined at the same level of confidence.
where:
| – | maneuvering component of the width of the safe maneuvering area | |
| – | navigational component of the width of the safe maneuvering area determined at the confidence level (1-α) |
Accordingly, the safe width of the maneuvering area on a two-way fairway must meet the following condition (Figure 7):
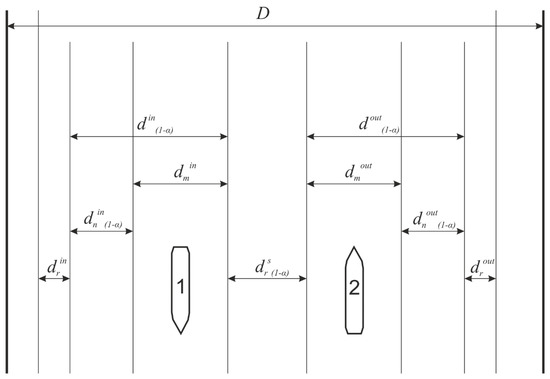
Figure 7.
Safe width of the maneuvering area at a certain confidence level (two-way fairway).
The navigational component of the width of the safe maneuvering area on fairways is a function of the directional error of position determination perpendicular to the axis of the fairway [6]:
where:
| – | directional error of the ship’s position perpendicular to the axis of the fairway determined at the confidence level (1-α) |
Directional errors of the ship’s position perpendicular to the axis of the fairway determined at the confidence level (1-α) = 0.95 depend on the navigation marking system used [11]. When using visual position determination systems, they can be calculated as:
Outer fairway, straight section, during the day, side marking by pairs of beacons (distance assessment method):
where:
| – | transverse distance between beacons |
Inner fairway (channel) bounded by banks, straight section, during the day:
for the observer’s eye height greater than 0.15b:
where:
| – | distance between the banks of the channel |
The directional errors of the ship’s position perpendicular to the axis of the fairway, determined at a confidence level of (1-α) = 0.95 on the various sections of the fairway studied, are respectively:
- Kanał Piastowski: py(0.95) = 20 m;
- Zalew Szczeciński between Brama Torowa I and II Gate: py(0.95) = 15 m;
- Zalew Szczeciński between the Brama Torowa II and III: py(0.95) = 25 m;
- Port of Świnoujście (Kanał Zbiorczy): py(0.95) = 30 m.
Using the results of the simulation studies and referring to their layout presented in the PIANC recommendation [2], the passing distances for equal vessels at a speed of 8 knots were determined:
The proposed relationships are confirmed by the results of the simulation studies summarized in Table 3.
Table 3.
The passing distance determined by simulation and empirical methods.
5. Conclusions
In this paper, the distance of passing ships on waterways was determined using the simulation method of ship traffic. The simulation experiment was carried out on the FMBS simulator for passing loaded ships of equal size with overall lengths LOA = 103.6 m, 220 m, 228 m, and block coefficients CB = 0.76, 0.8 and 0.67 (tanker, bulk carrier, sea ferry), respectively.
The research was conducted for four straight sections of the Świnoujście-Szczecin waterway with different parameters and different navigation marking systems.
The results show that the minimum safe passing distances of ships on fairways at speeds up to 8 knots do not practically depend on ship-to-ship interaction, but on the breadth of the ships and the accuracy of position determination, i.e., directional error perpendicular to the axis of the fairway.
Based on the analysis of the results of simulation tests, it was found that the passing distances of ships are:
- For the vessel breadth B ≥ 30 m
- For the vessel breadth B < 30 m
The passing distance, determined by the simulation method at the confidence level (1-α) = 0.95, takes into account the navigational components of the width of the safe maneuvering area (accuracy of position determination) on the side of passing ships. This allows for the modification of the deterministic–probabilistic MTE method.
A simulation method for determining the passing distance can be used to design two-way fairways and determine the conditions for their safe operation using the deterministic–probabilistic MTE method. The modified deterministic–probabilistic MTE method presented in the article considers the accuracy of position determination at a certain confidence level. It makes it possible to reduce the width of the required safe maneuvering area or to allow larger vessels to pass each other while ensuring the required level of safety and efficiency and, as a result, improves the traffic flow and fairway capacity (and thus harbor turnovers and revenues). The next step in follow-up research to the present study, which is being planned by the authors in the near future, will be a quantitative investigation on the influence of the two factors found (the ship breadths and the directional/lateral positioning accuracy). This will involve a different simulation experimental design and regression analysis towards an analytical model that describes the input/output relationships.
Author Contributions
Conceptualization, S.G., J.A., R.G. and M.P.; methodology, S.G., J.A., R.G. and M.P.; software, J.A. and R.G.; validation, S.G. and J.A.; formal analysis, S.G., J.A., R.G. and M.P.; investigation, R.G. and M.P.; resources, J.A., R.G. and M.P.; data curation, J.A., R.G. and M.P.; writing—original draft preparation, S.G.; writing—review and editing, J.A., R.G. and M.P.; visualization, R.G. and M.P.; supervision, S.G.; project administration, S.G. and J.A.; funding acquisition, R.G. and M.P. All authors have read and agreed to the published version of the manuscript.
Funding
This research received no external funding.
Institutional Review Board Statement
Not applicable.
Informed Consent Statement
Not applicable.
Data Availability Statement
Not applicable.
Conflicts of Interest
The authors declare no conflict of interest.
References
- Artyszuk, J.; Bilewski, M.; Gralak, R.; Gucma, L.; Gucma, M.; Gucma, S.; Marcjan, K.; Ślączka, W.; Zalewski, P. Marine Traffic Engineering. Guidelines for the Design of Marine Waterways and Ports and Conditions for Their Safe Operation; Foundation for the Promotion of the Shipbuilding Industry and the Maritime Economy: Gdansk, Poland, 2017. (In Polish) [Google Scholar]
- PIANC. Setting the Course, Harbour Approach Channels; Design Guidelines Report no 121–2014; PIANC: Brussel, Belgium, 2014. [Google Scholar]
- ROM 3.1-99; Design of the Maritime Configuration of Ports, Approach Channels and Harbour Basins; Spanish National Ports and Harbours Authority: Madrid, Spain, 2007.
- Ohtsu, K.; Yoshimura, Y.; Hirano, M.; Takahashi, H.; Tsugane, M. Design Standard for Fairway in Next Generation. Korean Inst. Navig. Port Res. 2006, 2, 230–239. [Google Scholar]
- PIANC Approach Channels. A Guide for Designs; PTC II-30 Final Report for the Joint Working Group, Supplement to Bulletin, No. 95; PIANC and IAPH in Cooperation with IMPA and IALA: Brussel, Belgium, 1997. [Google Scholar]
- Gucma, S. Marine Waterways. Design and Operation in Terms of Traffic Engineering; Foundation for the Promotion of the Shipbuilding Industry and the Maritime Economy: Gdansk, Poland, 2015. (In Polish) [Google Scholar]
- RINA. Proceedings of the 2nd International Conference on Ship Manoeuvring in Shallow and Confined Water (MASHCON): Ship to Ship Interaction, Trondheim, Norway, 18–20 May 2011; Pettersen, B., Berg, T.E., Eloot, K., Vantoree, M., Eds.; RINA: Trondheim, Norway, 2011; ISBN 978-1-905040-83-4. [Google Scholar]
- Vantorre, M.; Verzhbitskaya, E.; Laforce, F. Model Test-Based Formulations of Ship-Ship Interaction Forces. Ship Technol. Res. 2002, 49, 124–141. [Google Scholar]
- Gutenbaum, J. Mathematical Modeling of Systems; Polish Scientific Publishers (PWN): Warsaw, Poland, 2003. (In Polish) [Google Scholar]
- Gucma, S.; Gucma, L.; Zalewski, P. Simulation Research Methods in Marine Traffic Engineering; Maritime University of Szczecin Press: Szczecin, Poland, 2008. (In Polish) [Google Scholar]
- Dzwonkowski, J.; Gucma, M.; Gucma, S.; Kowalski, A. Pilot Navigation. Navigation in Restricted Waters; Maritime University of Szczecin Press: Szczecin, Poland, 2019. (In Polish) [Google Scholar]


Disclaimer/Publisher’s Note: The statements, opinions and data contained in all publications are solely those of the individual author(s) and contributor(s) and not of MDPI and/or the editor(s). MDPI and/or the editor(s) disclaim responsibility for any injury to people or property resulting from any ideas, methods, instructions or products referred to in the content. |
© 2023 by the authors. Licensee MDPI, Basel, Switzerland. This article is an open access article distributed under the terms and conditions of the Creative Commons Attribution (CC BY) license (https://creativecommons.org/licenses/by/4.0/).