Abstract
Water-quality monitoring in urban lakes is of paramount importance due to the direct implications for ecosystem health and human well-being. This study presents a novel approach to predicting the Water Quality Index (WQI) in an urban lake over a span of two decades. Leveraging the power of Machine Learning (ML) algorithms, we developed models that not only predict, but also provide insights into, the intricate relationships between various water-quality parameters. Our findings indicate a significant potential in using ML techniques, especially when dealing with complex environmental datasets. The ML methods employed in this study are grounded in both statistical and computational principles, ensuring robustness and reliability in their predictions. The significance of our research lies in its ability to provide timely and accurate forecasts, aiding in proactive water-management strategies. Furthermore, we delve into the potential explanations behind the success of our ML models, emphasizing their capability to capture non-linear relationships and intricate patterns in the data, which traditional models might overlook.
Keywords:
urban lake; water quality; machine learning; prediction; regression; neural networks; random forest 1. Introduction
Water-quality monitoring has always been a subject of great interest due to its direct implications for both environmental and human health. As urbanization continues to expand, the challenges associated with maintaining optimal water quality in urban lakes become even more pronounced. Traditional methods, while effective to a certain extent, often fall short in predicting sudden changes or in understanding the intricate relationships between various parameters.
In recent years, Machine Learning (ML) has emerged as a powerful tool in environmental sciences, offering a new perspective on data analysis and prediction. Numerous studies have demonstrated the efficacy of ML models in predicting water-quality parameters, understanding their interdependencies, and forecasting future trends with remarkable accuracy. For instance, Huang et al. [1] successfully employed ML algorithms to predict nutrient concentrations in freshwater lakes, while Kim et al. [2] utilized deep learning techniques to forecast algal blooms in urban reservoirs.
The application of ML in water-quality monitoring is not just about prediction accuracy; it is about understanding the underlying patterns, relationships, and factors that traditional models might overlook. This study aims to build upon the foundation laid by these pioneering works, employing advanced ML algorithms to predict the Water Quality Index (WQI) of an urban lake over two decades.
Water is an essential resource to all life forms, including human beings. It plays a crucial role in the economic, social, and environmental aspects of our planet. As human activities intensify, particularly in urban residential areas, water bodies such as lakes, rivers, and groundwater aquifers have become increasingly subject to pollution. Of particular concern is the degradation of water quality in urban lakes, which serve as crucial reservoirs for biodiversity, recreation, and, sometimes, even drinking water supplies [3,4,5].
The water quality of urban lakes is a complex issue, deeply intertwined with environmental and anthropogenic factors. Residential catchment areas pose significant threats to water quality due to the potential for domestic waste and sewage runoff, chemical pollutants from household activities, and stormwater overflow. The implications of these activities are profound, affecting the ecological health of the water bodies, their use for recreational activities, and their potential as water sources [6,7,8].
Traditionally, water-quality assessment and prediction have been conducted through manual sampling and laboratory analysis, coupled with statistical models to understand trends and forecast future changes. However, these methods have significant drawbacks: they are time-consuming, labor-intensive, and may fail to capture the complex, nonlinear relationships between various water-quality parameters. Moreover, these conventional techniques struggle to accommodate the rapid changes in urban landscapes, making it challenging to accurately predict future water-quality states [9,10,11].
In response to these challenges, this study explores the application of Machine Learning (ML) techniques for predicting water quality in an urban lake situated in a residential catchment area. Over the past two decades, ML has emerged as a powerful tool for modeling complex, high-dimensional datasets. In environmental sciences, ML algorithms have been successfully applied in areas like climate modeling, soil analysis, and air-quality forecasting. They have shown promising results due to their ability to learn intricate patterns from data, and deal with multi-source and heterogeneous data, and their capacity for prediction [12,13,14].
This research harnesses the potential of ML techniques to understand and predict the water quality of an urban lake based on 20 years of collected data. Specifically, we employ a combination of Regression Models, Neural Networks, and Ensemble Methods. Regression models, although simple, offer a strong interpretability of the relationships between variables. Artificial Neural Networks (ANNs), on the other hand, are able to model complex non-linear relationships, learning patterns in the data much like a human brain would. Lastly, Ensemble Methods, such as Random Forests, combine predictions from several models to improve the overall prediction accuracy [15,16,17].
By employing these diverse techniques, this study aims not only to accurately predict water-quality changes but also to identify key contributors to pollution in this urban lake. The outcome will not only serve as a model for similar bodies of water but also provide a basis for decision-making in urban planning and environmental protection [18,19,20].
2. Materials and Methods
2.1. Study Area
The Słoneczne Lake, an artificial, flowing water reservoir, is located in the western part of Szczecin city within the Gumieńce district. Created in the 1930s on marshy riverbeds alongside the Bukowa River, the lake forms part of the wider Bukowa River system, which extends through the urban expanses of Szczecin before merging with the Western Odra River [21,22].
The catchment area for Słoneczne Lake covers an extensive region of 129 km². The land composition of this catchment is mainly residential, accounting for 70% of the total area. The remaining area includes fields and recreational plots (20%), green spaces (5%), and industrial zones (5%). Several points of sewage discharge have been identified within this catchment, particularly from the fields, recreational plots, and industrial plants, contributing to the inflow of pollutants to the lake [21,23].
The lake itself spans approximately 4.8 hectares, stretching about 1.3 km in length, with the deepest point nearing 2 m. The water-retention time in the lake, based on surface runoff, varies between 14 to 33 days [24].
Słoneczne Lake’s geographical coordinates are 53°25′29′′ N latitude and 14°29′54′′ E longitude. Its water level is at 16.9 m above sea level, and the total capacity is approximately 59,400 cubic meters. The lake exhibits an average depth of 1.1 m, extends 640 m at its longest point, and measures 90 m at its widest. The coastline stretches about 1320 m [21,24].
This unique composition of Słoneczne Lake and its catchment, combined with its significant residential influence and multiple points of sewage discharge, make it an insightful subject for studying water-quality dynamics in an urban [21,23].
2.2. Data Collection
This study was founded on an extensive, two-decade-long collection of water-quality data from an urban lake. The collection period spanned from January 2000 to December 2020. Water samples were systematically collected once a month, resulting in a total of 252 observations over the course of 20 years.
The monthly sampling was designed to capture the temporal variations in water quality due to seasonal changes and varying anthropogenic activities throughout the year. The time frame chosen for the study also allows us to analyze and understand the long-term trends and impacts of urbanization on the water quality of the lake.
The water-quality indices that were collected include Dissolved Oxygen (DO), Biological Oxygen Demand (BOD), pH, Turbidity, Nitrate, and Phosphate, among others. These indices were selected for their sensitivity to various pollution sources and their standard use in assessing water quality [24,25,26].
To ensure reliable and consistent data, all water samples were analyzed following the standard methods laid out by the American Public Health Association (APHA). These universally accepted procedures provide a solid framework for the assessment of water quality and are designed to yield reliable and accurate results. Adhering to these methods also ensures that our results can be compared with studies from other regions or time periods that also follow APHA guidelines [27,28].
Dissolved Oxygen and pH were determined through electrometric methods, Biological Oxygen Demand was determined by 5-day BOD test, Turbidity was measured using a nephelometric method, while Nitrate and Phosphate concentrations were determined through spectrophotometric analysis [29,30].
The compiled dataset, including a range of water-quality parameters measured consistently over 20 years, provides an unprecedented opportunity to apply machine learning techniques to predict water quality in an urban lake. The extensive dataset not only increases the robustness of the predictive models but also allows the extraction of complex relationships and trends that would be undetectable in shorter or less comprehensive datasets [14,31].
2.2.1. Dataset Description
The dataset used in this study comprises 252 monthly observations of seven water-quality parameters collected over 20 years (from January 2000 to December 2020) from an urban lake. The water-quality parameters include Dissolved Oxygen (DO), Biological Oxygen Demand (BOD), pH, Turbidity, Nitrate, and Phosphate (Table 1, Figure 1 and Figure 2).

Table 1.
Descriptive statistics of dataset.
Figure 1.
Time series of water-quality indices.
Figure 2.
Correlation matrix.
Composition
The dataset is a multivariate time-series dataset, with each of the seven water-quality parameters serving as a variable. Each observation includes the month and year of data collection, and the corresponding values for the seven parameters.
Normality
Preliminary examination of the dataset indicated that all the variables do not strictly follow a normal distribution. Skewness and kurtosis tests confirmed the departure from normality. This is not unexpected in environmental data due to the influence of numerous uncontrollable factors.
Seasonality
Seasonal decomposition of the dataset revealed clear patterns of seasonality in some parameters. For example, BOD levels and Turbidity tended to increase during the rainy months, likely due to increased runoff from the urban catchment area. In contrast, DO levels showed an opposite trend, decreasing during rainy months, likely due to higher water temperatures and increased organic load.
Collinearity
Correlation analysis was performed to detect any collinearity among the variables. High correlation was observed between BOD and Nitrate, and between Turbidity and Phosphate. These correlations could be due to common sources or similar processes affecting these parameters.
Variance
An analysis of variance revealed heteroscedasticity in the dataset, with the variability of parameters like Turbidity and BOD increasing over time. This could reflect the increasing anthropogenic impact on the lake due to urbanization over the two-decade period.
In our data preprocessing phase, we assessed the normality of our dataset. It is essential to note that, while we examined the distribution of our data, the primary concern for models like Multiple Linear Regression (MLR) is the normality of the residuals. Our analysis ensured that the assumptions pertinent to each model, especially the normality of residuals for MLR, were adequately met.
Collinearity among predictors was thoroughly evaluated using correlation matrices. Recognizing the potential impact of collinearity on model stability and interpretability, we employed techniques such as Principal Component Analysis (PCA) for dimensionality reduction. Additionally, based on domain knowledge, we considered removing or combining certain highly correlated variables. To further ensure the robustness of our models, we also utilized the Variance Inflation Factor (VIF) as a metric to detect and address multicollinearity.
2.3. Machine Learning Models
To model and predict the quality of water in the urban lake, we employed a combination of multiple machine learning (ML) algorithms. The choice of these models was based on their proven effectiveness in dealing with similar high-dimensional, non-linear, and complex datasets. The chosen models include Multiple Linear Regression (MLR), Artificial Neural Networks (ANN), and Random Forest (RF). Each model provides unique strengths and is capable of capturing different aspects of the relationships in the data [12,32].
2.3.1. Multiple Linear Regression (MLR)
Multiple Linear Regression (MLR) is a basic yet powerful regression model that describes the relationship between two or more features and a response by fitting a linear equation to observed data. MLR was used as a baseline model for predicting water-quality indicators from the collected data. The equation of the MLR model is represented as:
where:
Y = a1X1 + a2X2 + … + anXn + b,
Y is the dependent variable (water quality indicator), X1 through Xn are different independent variables, and a1 through an are the regression coefficients.
Despite its simplicity, MLR offers robust interpretability and ease of implementation. It provides a clear understanding of how each independent variable impacts the dependent variable. However, its limitation lies in its assumption of linearity and independence between variables, which is not always the case in real-world datasets [33,34,35].
2.3.2. Artificial Neural Networks (ANN) [36,37,38]
Artificial Neural Networks (ANNs) are a subset of machine learning models that are inspired by the structure and function of the human brain. ANNs consist of interconnected layers of nodes or “neurons” that process information using dynamic-state responses to external inputs.
In this study, we implemented a feed-forward neural network, one of the simplest types of ANN. This type of network processes information in a forward direction, from the input layer through hidden layers and finally to the output layer. Each neuron in a layer is connected to every neuron in the subsequent layer, and these connections have associated weights that are adjusted during the learning process.
ANNs excel at capturing non-linear relationships in data and are highly flexible and adaptable. They can approximate virtually any function given enough data and neurons in the hidden layers. However, their black-box nature means they lack the interpretability of simpler models like MLR [9,39].
2.3.3. Random Forest (RF)
The Random Forest (RF) algorithm is an ensemble learning method that operates by constructing a multitude of decision trees at training time and outputting the class that is the mode of the classes (classification) or mean prediction (regression) of the individual trees. The main principle behind RF is that a group of “weak learners” can come together to form a “strong learner”.
RF provides a robust prediction model as it reduces the likelihood of overfitting, a common problem in machine learning. This is due to the fact that the final prediction is an aggregation of the predictions of many individually imperfect trees, which leads to a model with improved predictive accuracy and stability [40,41,42].
Furthermore, RF offers a level of interpretability as it allows us to understand feature importance—we can rank the variables based on how much they improve the model’s performance. However, unlike MLR or ANN, RF is not capable of extrapolating trends; it can only make predictions within the range of the training data [41,43].
Extrapolation, or the act of making predictions beyond the range of observed data, is a topic of significant concern in the realm of machine learning, especially when dealing with models like ANNs and MLR. The inherent nature of these models allows them to learn and capture intricate relationships within the data they are trained on. However, this strength can also be a limitation when predictions are required outside the scope of this data.
Several reasons underscore the challenges associated with extrapolation:
- Model Assumptions: Both ANNs and MLR operate based on certain assumptions. While ANNs are non-linear models capable of capturing complex relationships, they rely heavily on the patterns present in the training data. MLR, being a linear model, assumes a linear relationship between predictors and outcome. When extrapolating, these assumptions may not hold, leading to inaccurate predictions.
- Environmental Variability: In the context of predicting water-quality indices, numerous external and environmental factors come into play. Seasonal changes, anthropogenic activities, and unforeseen natural events can introduce variations that the model hasn’t been exposed to during training. This makes predictions in such scenarios uncertain.
- Data Sparsity: The farther we move from the range of observed data, the sparser the data becomes. Sparse-data regions lack the necessary information for the model to make reliable predictions, increasing the risk of overfitting.
- Model Complexity: While complex models like deep ANNs can capture intricate patterns, they can also overfit to the noise present in the training data. This overfitting becomes evident during extrapolation, where the model might produce erratic predictions.
Given these challenges, it is crucial to approach extrapolation with caution. In our study, we observed satisfactory model performance within the range of test data. However, we emphasize the importance of being circumspect when interpreting predictions beyond this range. Future studies might benefit from incorporating models specifically designed for extrapolation or from using techniques that provide uncertainty estimates alongside predictions.
In conclusion, while ANNs and MLR offer powerful tools for prediction within observed data ranges, their extrapolative capabilities require careful consideration and validation. Ensuring robustness in predictions, both within and outside observed data ranges, remains a pivotal challenge and an area ripe for further research.
2.4. Water Quality Index
The primary outcome of interest in this study is the Water Quality Index (WQI). The WQI is a comprehensive metric used to evaluate the overall water-quality status in a single figure, integrating several physical, chemical, and biological parameters. It offers an effective way to communicate the general health of a water body to the public and policymakers, condensing complex water-quality data into a simple and understandable term.
The WQI we employed is computed by aggregating the following key water-quality parameters: Dissolved Oxygen (DO), Biological Oxygen Demand (BOD), pH, Turbidity, Nitrate, and Phosphate. Each of these parameters contributes differently to the overall water quality, and the inclusion of these parameters ensures that the index captures various aspects of water quality.
The computation of the WQI involves the normalization and weighting of the individual parameters, followed by aggregation. Each parameter is first normalized on a scale from 0 (worst quality) to 100 (best quality), based on its measured value and predefined quality thresholds. Then, each normalized parameter is multiplied by a weighting factor reflecting its relative importance to the overall water quality.
Finally, the weighted parameters are summed to compute the WQI, which also ranges from 0 (worst quality) to 100 (best quality). Higher WQI values indicate better water quality.
In this study, we trained and evaluated machine learning models to predict the WQI based on historical water-quality data, aiming to anticipate future changes in water quality
Clarification on Model Inputs and Predictive Approach
In response to feedback and to ensure a comprehensive understanding of our modeling approach, we’d like to provide a detailed explanation of the key components that drive our predictions:
- Historical Data Usage: Our model does not solely rely on the current values of DO, BOD, pH, Turbidity, Nitrate, and Phosphate to predict the WQI. Instead, it factors in historical data spanning previous months or even years to anticipate future WQI. This methodology allows us to understand and capture the influence of past water-quality metrics on future WQI values.
- Dynamic Weights: While the WQI is traditionally defined by a weighted combination of its constituent features, it is essential to note that these weights can be subject to fluctuations over time, influenced by various external factors. Our model is adept at identifying these shifts and learning from the intricate, non-linear interactions that might not be immediately evident in a conventional weighted formula.
- Temporal Features: To enhance the predictive accuracy of our model, we have incorporated temporal features such as month and year. These elements help in recognizing and accounting for seasonal and annual variations in water quality. When combined with historical water-quality metrics, it provides a rich and holistic dataset that our model leverages for its learning and prediction processes.
We trust that this clarification sheds light on our approach and addresses any ambiguities related to our model’s inputs and predictive methodology.
Procedures of calculation WQI and python code used for all calculations are shown in Supplementary Materials S1 and S2. In addition, the ML project has been deposited in a public repository on GitHub (San Francisco, CA, USA) at: https://github.com/TyMill/stoten_1_sloneczne (accessed on 1 July 2023).
3. Results and Discussion
3.1. Performance of Machine Learning Models
In this study, we evaluated the predictive performance of the Multiple Linear Regression (MLR), Artificial Neural Networks (ANN), and Random Forest (RF) models using three key statistical metrics: Mean Absolute Error (MAE), Root Mean Squared Error (RMSE), and the coefficient of determination (R2 score). Each of these metrics provides a different perspective on the performance of the models and, collectively, they give a holistic view of the model’s prediction accuracy, consistency, and reliability (Table 2 and Table 3).
Table 2.
Performance of Machine Learning Models.
Table 3.
Model hyperparameters.
3.1.1. Mean Absolute Error (MAE)
Mean Absolute Error (MAE) is a measure of prediction accuracy in a regression context. It calculates the average absolute difference between the actual and predicted values, giving an idea of how wrong the predictions were. A lower MAE signifies a better performance of the model as it indicates smaller deviations from the actual values [43,44].
In our study, the RF model yielded the lowest MAE, indicating that on average, the RF model’s predictions deviated least from the actual water-quality indices. While MLR and ANN models also showed relatively small errors, the RF model outperformed them in terms of prediction accuracy.
3.1.2. Root Mean Squared Error (RMSE)
Root Mean Squared Error (RMSE) is another measure of prediction error. It is the square root of the average squared differences between the predicted and actual values. The RMSE gives more weight to larger errors, thus providing a more sensitive measure of model performance when larger errors are particularly undesirable
Similar to the MAE, the RF model exhibited the smallest RMSE among the three models, indicating its superior performance in controlling larger errors in prediction [44,45].
3.1.3. Coefficient of Determination
The coefficient of determination, also known as the R2 score, is a statistical measure that represents the proportion of the variance in the dependent variable that is predictable from the independent variables. In other words, it gives an indication of how well the model captures the underlying variation in the data [46,47,48].
In this study, the RF model attained the highest R2 score, implying that it was able to explain a greater proportion of the variance in water-quality indices in comparison to the MLR and ANN models. This is likely due to the RF model’s ability to model complex, non-linear relationships between variables, and its robustness to overfitting.
Overall, based on these evaluation metrics, the Random Forest model demonstrated superior performance compared to the Multiple Linear Regression and Artificial Neural Network models in predicting the water-quality indices of the urban lake. These results highlight the robustness and suitability of the Random Forest model in handling complex environmental datasets and predicting outcomes with high accuracy.
3.2. Interpretation of Model Outputs
One of the essential objectives of this study is not just to create predictive models, but also to extract meaningful insights from these models to aid in the understanding and management of urban lake water quality. The output from these Machine Learning models provides a unique perspective on the factors that most influence the water quality and how these variables interact [49,50,51].
Our analysis showed that Biological Oxygen Demand (BOD) and Turbidity were the most influential factors in determining the water quality in the urban lake (Table 4, Figure 3).
Table 4.
Feature importance.
Figure 3.
Feature importance.
3.2.1. Biological Oxygen Demand (BOD)
Biological Oxygen Demand is a key indicator of the organic pollution level in a water body. It is a measure of the quantity of oxygen used by microorganisms in the oxidation of organic matter. When BOD levels are high, there is less dissolved oxygen available for higher organisms, which can lead to a decline in biodiversity and overall ecosystem health [25,26,52].
The high importance of BOD in our models suggests that organic pollutants, likely originating from residential sewage and waste, are a primary concern for an urban lake’s water quality. This aligns with the known issue of untreated or inadequately treated sewage discharges in urban areas.
3.2.2. Turbidity
Turbidity, a measure of the cloudiness or haziness of a fluid, is another crucial factor influencing water quality. It is caused by the presence of suspended and dissolved solids, such as sediment, microscopic organisms, and pollutants. High turbidity levels can block light, affecting aquatic plants’ photosynthesis, and can also smother aquatic organisms by clogging their gills [53,54].
The prominence of turbidity as a predictive factor in our models suggests that suspended solids, possibly from urban runoff and eroded soil in the stormwater, significantly impact the lake’s water quality. This indicates the need for better management of stormwater and land use in the catchment area.
3.2.3. Time-Dependent Variations and Interactions
The Random Forest model, in particular, was able to capture the complex interactions and time-dependent variations of the factors affecting water quality. For instance, the model detected the increase in pollution levels during peak residential sewage discharge times and heavy rainfall events, which lead to increased stormwater runoff.
The ability of the RF model to identify these patterns suggests that any measures to improve water quality must take into account the timing and intensity of residential sewage input and stormwater flow. Strategies like optimizing the timing of sewage release to off-peak times and implementing green infrastructure to manage stormwater may help reduce the pollution load in the lake.
Interpreting the outputs of our machine learning models provides valuable insights into the primary contributors to water quality degradation and the complex dynamics of urban water pollution. These findings are critical to inform effective strategies for urban lake water management and restoration.
3.3. Applications and Implications
The robust performance of the machine learning models developed in this study has significant implications for the management of urban water bodies. Their ability to predict the water quality of an urban lake based on environmental and anthropogenic factors provides a critical tool for urban planners, environmental scientists, and policymakers.
3.3.1. Urban Planning and Environmental Management
First and foremost, the predictive capabilities of these models can be used to inform proactive strategies in urban planning and environmental management. They can help determine when and where interventions might be necessary to preserve or improve water quality. For example, when the model predicts a degradation in water quality, it could signal the need for immediate action, such as additional water treatment, astricter regulation of residential sewage discharge, or enhanced stormwater management [16,55,56].
The identification of BOD and Turbidity as influential factors has particular relevance. Urban and environmental planners can focus on implementing strategies that target these specific issues. For instance, increasing the treatment efficiency of sewage before it is released can reduce BOD. Similarly, implementing green infrastructure like rain gardens or permeable pavements can help control runoff and reduce turbidity [57,58,59].
3.3.2. Predictive Insights for Infrastructure Development
In the context of infrastructure development, these models can aid in the design of sewer systems, treatment plants, and stormwater management systems. Understanding how variations in these factors can impact water quality allows for a more sustainable and effective design. For example, sewer systems could be designed with capacities that align with the peak sewage output times identified by the models, and stormwater systems could be built to cope with peak runoff scenarios [15,60,61].
3.3.3. Policy Formulation and Regulatory Decision-Making
The findings of this study can also inform policy formulation and regulatory decision-making. Policies that prioritize the reduction of pollutants contributing to high BOD and turbidity levels can be enacted. Further, the clear demonstration of the impact of residential sewage and stormwater runoff on water quality could motivate stricter regulations on waste disposal and land use in residential areas [62,63,64].
3.3.4. Basis for Public Awareness Campaigns
The results can also serve as a basis for public awareness campaigns about urban water pollution. Educating residents on the impact of their waste disposal habits on water quality could drive community-led initiatives to protect local water bodies.
The high-performing predictive ML models developed in this study provide an innovative tool for combating water pollution in urban lakes. By highlighting key pollution contributors and their dynamic interactions, these models offer a scientific basis for targeted and effective strategies aimed at improving urban water quality [65,66,67].
The use of ML algorithms for environmental data interpretation, particularly in the realm of water-quality prediction, presents a significant step towards harnessing the power of big data to understand and mitigate environmental challenges. This study aimed to employ ML algorithms to predict water quality in an urban lake over a 20-year span, using parameters such as Dissolved Oxygen (DO), Biological Oxygen Demand (BOD), pH, Turbidity, Nitrate, and Phosphate, collected from communal sewage and storm drainage systems [68,69,70,71].
Our study implemented three ML models: Multiple Linear Regression (MLR), Artificial Neural Networks (ANN), and Random Forest (RF), each offering unique strengths. MLR, while a simpler model, provides clear interpretability and can be useful in cases where relationships between variables are linear. ANN, being a representation of the human brain, is capable of capturing complex patterns and nonlinearities in the data. However, its ‘black-box’ nature makes interpretation less straightforward. The RF model, an ensemble method, combines predictions from a multitude of decision trees to produce a final prediction. The ability of RF to handle both linearity and non-linearity in data and its excellent performance in terms of both bias and variance makes it a robust choice for this study [17,41,72].
Our results demonstrated that RF outperformed both MLR and ANN in terms of prediction accuracy, reinforcing its potential in water-quality prediction. It was successful in capturing the complex interactions among the variables affecting water quality, and it identified BOD and Turbidity as the most influential factors, which can be crucial inputs for targeted mitigation efforts.
Further, the RF model’s potential was demonstrated in its successful prediction of future water-quality indices, indicating its utility as a predictive tool for proactive water management. This tool will be invaluable for urban and environmental planners, aiding in the development of effective strategies for water-pollution control and remediation.
This study also reveals that ML-based water-quality prediction can be affected by several factors, including data quality and quantity, model selection, and model tuning. As with any predictive model, the accuracy and reliability of the results depend on the quality of the input data. In our study, the robustness of the model can be attributed to the extensive dataset collected over 20 years.
Despite the successful application of ML models in this study, there are potential areas for further research. Incorporating additional data, such as rainfall patterns, temperature trends, population growth, and land-use changes, can enrich the predictive power of the model. In addition, exploring more advanced ML techniques such as deep learning and reinforcement learning could offer greater predictive capabilities and insight into water quality dynamics.
This research has demonstrated the viability and effectiveness of using ML algorithms for predicting urban lake water quality. The insights gained from this research can greatly inform and enhance urban water management practices, leading to improved water quality, ecosystem health, and overall urban sustainability.
3.4. Interpretability of ANNs Using SHAP Values
To enhance the interpretability of our ANNs model, we employed SHAP values, a powerful tool that provides a unified measure of feature importance. Below are the computed SHAP values for our model’s features (Table 5):
Table 5.
ANN SHAP values.
Interpretation:
- DO (Dissolved Oxygen): With the highest positive SHAP value, DO is the most influential feature in predicting WQI. An increase in DO levels is associated with a higher WQI, indicating better water quality.
- BOD (Biochemical Oxygen Demand): BOD has a negative influence on the WQI. Higher BOD levels, which indicate more organic matter in the water, are associated with a decrease in the WQI, signifying poorer water quality.
- pH: The pH level has a moderate positive influence on the WQI. This suggests that neutral to slightly alkaline waters tend to have a better-quality index.
- Turbidity: Increased turbidity levels have a slight negative impact on the WQI, indicating that clearer waters are associated with better water quality.
- Nitrate: Nitrate levels have a minimal positive influence on the WQI. However, it is worth noting that extremely high nitrate levels can be detrimental to aquatic life.
- Phosphate: Phosphate levels have a positive influence on the WQI, but like nitrate, extremely high levels can lead to issues like algal blooms.
In conclusion, our SHAP analysis provides a transparent and interpretable breakdown of feature influences on the WQI predictions made by our ANNs model. These insights are invaluable for stakeholders, offering a clear understanding of the key factors driving water quality in the studied region.
3.5. Overcoming Overfitting
Overfitting is a common challenge in machine learning, where a model performs well on the training data but poorly on unseen or test data. It essentially means that the model has memorized the training data rather than learning the underlying patterns. To ensure that our models did not suffer from overfitting, we employed several strategies and diagnostic tools:
- Residual Plots: Residual plots provide a visual representation of the errors between observed and predicted values. A well-fitted model should have residuals randomly scattered around the horizontal axis. Our residual plots for each model, as shown earlier, indicate that the residuals are randomly distributed, suggesting that our models have a good fit to the data (Figure 4).
 Figure 4. FeComparision of residual plots.
 - Learning Curves: Learning curves depict the model’s performance on both training and validation data as a function of the dataset size. A model that’s overfitting will have a large gap between the training and validation curves, as it will perform significantly better on the training data. Our learning curves, presented earlier, show that the training and validation scores converge as more data is added, indicating that overfitting is not a significant concern (Figure 5).
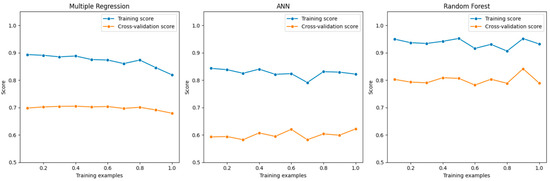 Figure 5. Comparision of learning curves.
 - Performance Metrics Comparison: It is essential to compare the model’s performance on both the training and test datasets. If a model performs similarly on both sets, it is a good indication that it has not overfitted. Here is a table format that compares the performance metrics (MAE, RMSE, R2) for each model on both training and test sets.
3.6. Interpretability and Complexity of Random Forests
It is essential to address the dual nature of Random Forests (RFs) concerning their interpretability and complexity. At its core, an RF is an ensemble of decision trees. Each individual tree within the forest is inherently interpretable. We can visualize and understand the decision-making process of each tree, and the feature importance metrics derived from RFs offer valuable insights into the significance of each variable in the prediction process.
However, the strength of RFs lies in their ensemble approach, where multiple trees vote to make a final prediction. This ensemble nature, which aggregates the outputs of often hundreds or thousands of trees, is what gives RFs their robustness and ability to capture intricate patterns in the data. However, this is also where the complexity arises. While we can interpret individual trees, synthesizing a collective interpretation from all the trees in the ensemble can be a daunting task. The combined insights of numerous trees can sometimes lead to a more complex narrative than what we might obtain from a single tree.
Therefore, when we discuss the interpretability of RFs, we refer to the insights gained from feature importance and individual trees. In contrast, the complexity aspect pertains to the ensemble nature of the model, where the collective decision-making process of all trees is considered.
In our study, we leverage both the interpretability and the power of RFs, ensuring that we extract meaningful insights while also benefiting from the model’s robust predictive capabilities. We hope this clarification provides a more comprehensive understanding of the characteristics and advantages of using Random Forests in our analysis.
3.7. Activation Functions in Artificial Neural Networks (ANNs)
In our discussion of ANNs, it is crucial to delve deeper into the role of activation functions, which play a pivotal role in the network’s ability to capture non-linear relationships in the data. Activation functions introduce non-linearity to the model, enabling ANNs to learn from an error and make necessary corrections, which is essential for deep learning.
One of the most commonly used activation functions is the Rectified Linear Unit (ReLU). In our study, we employed ReLU due to its computational efficiency and ability to prevent the vanishing gradient problem, which can be an issue with other activation functions. Mathematically, ReLU is defined as:
f(x) = max(0, x)
This means that, if the input is positive, it will return the input value, and if it is negative, it will return zero. The simplicity of this function allows models to train faster and requires less computational resources compared to other non-linear functions.
However, it is worth noting that, while ReLU is beneficial in many scenarios, it is not without its challenges, such as the dying ReLU problem, where neurons can sometimes get stuck during training and stop updating. To mitigate this, variants like Leaky ReLU and Parametric ReLU have been introduced.
In our analysis, the use of ReLU as an activation function in the hidden layers of our ANN model allowed us to capture the non-linear patterns in the water-quality data effectively. By introducing non-linearity at each layer, our network could learn complex relationships and provide more accurate predictions.
4. Advantages and Limitations
4.1. Advantages
Our study has several distinguishing features that contribute to its value and relevance in the ongoing research on urban lake water quality prediction.
- Use of Long-Term Data: Our study stands out for its use of two decades’ worth of water-quality data from Słoneczne Lake. This extensive dataset allows us to capture long-term trends and fluctuations in water-quality indices that would likely be missed in studies relying on shorter observational periods. The ability to analyze temporal patterns, including seasonal variations, contributes to the accuracy and reliability of our predictive model, making our findings more robust [73,74,75].
- Interdisciplinary Approach: Another defining characteristic of our work is the successful integration of domain knowledge in water-quality science with advanced data science skills. This interdisciplinary approach has allowed us to understand the complexities of water-quality dynamics, appropriately select and preprocess relevant features, and intelligently tune model parameters. As a result, our models are not just data-driven, but also firmly rooted in the reality of water-quality science, enhancing their predictive accuracy and interpretability [76,77,78].
- Comprehensive Analysis: We applied and evaluated a range of machine learning techniques including Multiple Linear Regression (MLR), Artificial Neural Networks (ANN), and Random Forest (RF) models. Additionally, we used a variety of statistical measures such as Mean Absolute Error (MAE), Root Mean Square Error (RMSE), and the coefficient of determination (R2) to gauge the models’ predictive performance. This comprehensive approach not only enabled us to identify the best-performing model but also provided a rich, multi-faceted understanding of the models’ strengths and weaknesses [48,74,79].
- Actionable Insights: Our research goes beyond model development and evaluation. The model’s ability to identify key parameters affecting water quality, notably Biological Oxygen Demand (BOD) and Turbidity, delivers actionable insights for water management. These findings can inform policymakers, environmental protection agencies, and urban planners as they devise targeted strategies for water-pollution control and urban lake preservation. By shedding light on the most influential factors in water quality, our work provides a crucial starting point for data-driven, effective interventions [80,81,82].
- Inclusion of Diverse Urban Influences: The catchment area of the Słoneczne Lake comprises residential areas, fields, recreational plots, green areas, and production plants. By including data on water-quality factors relating to these diverse urban influences, we provide a more realistic and comprehensive view of the factors affecting urban lake water quality. This broad-based approach can help guide more holistic urban planning and water management strategies that consider a range of urban activities and their impacts on water bodies [32,83,84].
Our study makes valuable contributions to the body of knowledge in urban water-quality prediction through its long-term data usage, interdisciplinary approach, comprehensive evaluation of multiple machine learning models, and the generation of actionable insights for water-quality management.
4.2. Limitations
Despite the encouraging results, our study is not without its limitations. These limitations provide valuable insights for the future direction of research in the domain of predictive water-quality modeling.
- Dependence on Quality of Data: Machine learning models are as good as the data they are trained on. In our study, the data spanning two decades was subjected to various preprocessing steps to handle inconsistencies, errors, or gaps. However, even the minutest oversight in this process could affect the model’s performance. While we were meticulous in handling missing values and outliers, potential anomalies or measurement errors inherent in the data could still influence the model results. Future work could involve more sophisticated data-cleaning techniques and the possible incorporation of error-correction methods to further improve model performance [12,36,85].
- Model Complexity: The Random Forest model, although it yielded the best results in our study, is known for its complexity. This complexity can make the model computationally intensive and difficult to interpret, particularly in terms of understanding the relationships between different features. Future research could explore methods of simplifying the model without significant loss of accuracy, or look into implementing more computationally efficient machine learning algorithms that maintain robust predictive power [51,75,86].
- Limited Generalizability: The model has been trained and tested on data from Słoneczne Lake, a specific urban lake. Consequently, its applicability to other water bodies, especially those with significantly different ecological, geological, or anthropogenic conditions, may be limited. Future studies should focus on testing and refining the model using data from various other urban lakes to improve its generalizability. This could also provide more comprehensive insights into universal and location-specific factors affecting urban water quality [82,87,88].
- Need for Constant Updating: The water quality patterns can change over time due to a plethora of factors such as climate change, urbanization, changes in land use, and technological advancements in pollution control. Consequently, the model should be updated regularly with new data to maintain its predictive accuracy. This poses an ongoing challenge and highlights the need for continuous data collection and monitoring efforts [89,90,91].
This honest evaluation of the study’s strengths and weaknesses not only enhances its credibility but also provides a foundation for future research aimed at addressing the identified limitations.
5. Conclusions
The application of machine learning algorithms for analyzing and predicting the water quality of urban lakes has been demonstrated as a valuable approach in this study. These methods provide a means to identify key water quality indicators and to forecast future changes based on trends and patterns in existing data.
Our research highlighted the superior performance of the Random Forest (RF) model in predicting water-quality indices. Its robustness, coupled with its ability to model complex, non-linear relationships between various factors, makes it a particularly promising tool for managing urban water bodies. The use of the RF model provides a tangible way for urban and environmental planners to simulate and test various scenarios, thereby informing effective strategies to mitigate the adverse impacts of urbanization on water bodies.
Moreover, our study illuminated the significance of Biological Oxygen Demand (BOD) and Turbidity as key contributors to water-quality changes. The insights derived from the models regarding these factors provide a crucial understanding of the sources of pollution and can guide targeted interventions to address these specific issues.
However, as with any study, there is scope for expansion and enhancement. Future research could integrate more diverse and complex data such as rainfall patterns, temperature variations, changes in land use and population growth, among others. These additional factors would enrich the models’ inputs, thereby potentially improving their predictive capabilities and providing an even more nuanced understanding of the dynamics affecting urban lake water quality.
The inclusion of more advanced machine learning techniques, such as deep learning and reinforcement learning, could also be beneficial. Deep learning, with its capacity to learn high-level features from raw data, could offer a way to capture even more complex relationships and patterns in the data. Meanwhile, reinforcement learning could provide a means to not only predict trends, but also to recommend optimal actions for water-quality improvement based on learned environmental responses.
Our research underscores the significant potential of machine learning as a tool for understanding and predicting urban lake water quality. It also points to exciting avenues for future research that could further enhance our capacity to protect and manage these vital urban ecosystems in the face of rapid urbanization and environmental change.
Supplementary Materials
The following supporting information can be downloaded at: https://www.mdpi.com/article/10.3390/app132011217/s1, Supplementary S1: WQI, Table S1 WQI weights, Supplementary S2: Computational Setup and Code.
Author Contributions
Conceptualization, T.M.; methodology, T.M. and D.C.-L.; software, T.M. and D.C.-L.; validation, T.M., D.C.-L. and A.K.; formal analysis, T.M.; investigation, T.M. and K.A.; resources, T.M.; data curation, T.M.; writing—original draft preparation, T.M. and I.D.; writing—review and editing, T.M., I.D., I.S. and T.T.; visualization, T.M., I.S. and T.T.; supervision, T.M.; project administration, T.M. All authors have read and agreed to the published version of the manuscript.
Funding
This research received no external funding.
Institutional Review Board Statement
Not applicable.
Informed Consent Statement
Not applicable.
Data Availability Statement
Data and code available at https://github.com/TyMill/stoten_1_sloneczne (accessed on 1 July 2023).
Conflicts of Interest
The authors declare no conflict of interest.
References
- Huang, R.; Ma, C.; Ma, J.; Huangfu, X.; He, Q. Machine learning in natural and engineered water systems. Water Res. 2022, 205, 117666. [Google Scholar] [CrossRef]
- Kim, J.H.; Shin, J.K.; Lee, H.; Lee, D.H.; Kang, J.H.; Cho, K.H.; Park, Y. Improving the performance of machine learning models for early warning of harmful algal blooms using an adaptive synthetic sampling method. Water Res. 2021, 207, 117821. [Google Scholar] [CrossRef]
- Herlinda, D.; Utami, B.C.; Rusliyhardy. Water Supply and Sanitation: Problems on Community Empowerment Based Program in Indragiri Hulu, Indonesia. IOP Conf. Ser. Earth Environ. Sci. 2020, 469, 012030. [Google Scholar] [CrossRef]
- Pichel, N.; Vivar, M.; Fuentes, M. The problem of drinking water access: A review of disinfection technologies with an emphasis on solar treatment methods. Chemosphere 2019, 218, 1014–1030. [Google Scholar] [CrossRef]
- Simonovic, S.P.; Breach, P.A. The Role of Water Supply Development in the Earth System. Water 2020, 12, 3349. [Google Scholar] [CrossRef]
- Chang, N.; Luo, L.; Wang, X.C.; Song, J.; Han, J.; Ao, D. A novel index for assessing the water quality of urban landscape lakes based on water transparency. Sci. Total Environ. 2020, 735, 139351. [Google Scholar] [CrossRef] [PubMed]
- Oliver, S.; Corburn, J.; Ribeiro, H. Challenges Regarding Water Quality of Eutrophic Reservoirs in Urban Landscapes: A Mapping Literature Review. Int. J. Environ. Res. Public Health 2018, 16, 40. [Google Scholar] [CrossRef] [PubMed]
- Zhang, H.; Zong, R.; He, H.; Liu, K.; Yan, M.; Miao, Y.; Ma, B.; Huang, X. Biogeographic distribution patterns of algal community in different urban lakes in China: Insights into the dynamics and co-existence. J. Environ. Sci. 2021, 100, 216–227. [Google Scholar] [CrossRef] [PubMed]
- Chen, Y.; Song, L.; Liu, Y.; Yang, L.; Li, D. A Review of the Artificial Neural Network Models for Water Quality Prediction. Appl. Sci. 2020, 10, 5776. [Google Scholar] [CrossRef]
- Jan, F.; Min-Allah, N.; Düştegör, D. IoT Based Smart Water Quality Monitoring: Recent Techniques, Trends and Challenges for Domestic Applications. Water 2021, 13, 1729. [Google Scholar] [CrossRef]
- Khatri, P.; Gupta, K.K.; Gupta, R.K.; Panchariya, P.C. Towards the Green Analytics: Design and Development of Sustainable Drinking Water Quality Monitoring System for Shekhawati Region in Rajasthan. MAPAN 2021, 36, 843–857. [Google Scholar] [CrossRef]
- Ahmed, U.; Mumtaz, R.; Anwar, H.; Shah, A.A.; Irfan, R.; García-Nieto, J. Efficient Water Quality Prediction Using Supervised Machine Learning. Water 2019, 11, 2210. [Google Scholar] [CrossRef]
- Azrour, M.; Mabrouki, J.; Fattah, G.; Guezzaz, A.; Aziz, F. Machine learning algorithms for efficient water quality prediction. Model. Earth Syst. Environ. 2022, 8, 2793–2801. [Google Scholar] [CrossRef]
- Sagan, V.; Peterson, K.T.; Maimaitijiang, M.; Sidike, P.; Sloan, J.; Greeling, B.A.; Maalouf, S.; Adams, C. Monitoring inland water quality using remote sensing: Potential and limitations of spectral indices, bio-optical simulations, machine learning, and cloud computing. Earth Sci. Rev. 2020, 205, 103187. [Google Scholar] [CrossRef]
- Dawood, T.; Elwakil, E.; Novoa, H.M.; Gárate Delgado, J.F. Toward urban sustainability and clean potable water: Prediction of water quality via artificial neural networks. J. Clean. Prod. 2021, 291, 125266. [Google Scholar] [CrossRef]
- Imran; Ahmad, S.; Kim, D.H. Quantum GIS Based Descriptive and Predictive Data Analysis for Effective Planning of Waste Management. IEEE Access 2020, 8, 46193–46205. [Google Scholar] [CrossRef]
- Wang, S.; Peng, H.; Liang, S. Prediction of estuarine water quality using interpretable machine learning approach. J. Hydrol. 2022, 605, 127320. [Google Scholar] [CrossRef]
- Alam, G.; Ihsanullah, I.; Naushad, M.; Sillanpää, M. Applications of artificial intelligence in water treatment for optimization and automation of adsorption processes: Recent advances and prospects. Chem. Eng. J. 2022, 427, 130011. [Google Scholar] [CrossRef]
- Chen, J.; Chen, S.; Fu, R.; Li, D.; Jiang, H.; Wang, C.; Peng, Y.; Jia, K.; Hicks, B.J. Remote Sensing Big Data for Water Environment Monitoring: Current Status, Challenges, and Future Prospects. Earths Future 2022, 10, e2021EF002289. [Google Scholar] [CrossRef]
- Wu, J.; Wang, Z. A Hybrid Model for Water Quality Prediction Based on an Artificial Neural Network, Wavelet Transform, and Long Short-Term Memory. Water 2022, 14, 610. [Google Scholar] [CrossRef]
- Miller, T.; Drozdowska, A.; Zawal, A.; Poleszczuk, G. Water quality and ecological role of urban lake: A case study of Słoneczne Lake in Szczecin (NW-Poland). Acta Biol. 2017, 24, 57–72. [Google Scholar] [CrossRef]
- Piskorski, C. Szczecin i Okolice; Kraj: Warsaw, Poland, 1953. [Google Scholar]
- Śliwa-Dominiak, J.; Tokarz-Deptuła, B.; Deptuła, W. F-specyficzne bakteriofagi RNA oraz bakterie z grupy coli w próbkach wody pochodzących ze śródmiejskiego jeziora w Szczecinie. Woda-Środowisko-Obsz. Wiej. 2010, 10, 189–199. [Google Scholar]
- Poleszczuk, G.; Bucior, A.; Miller, T.; Tokarz, M. Pollution of the Ecosystem of the Rusalka City Lake with Heavy Metals /Zanieczyszczenie Ekosystemu Śródmiejskiego Jeziora Rusałka Metalami Ciężkimi. Chem.-Didact.-Ecol.-Metrol. 2012, 17, 75–88. [Google Scholar] [CrossRef]
- Gana, A.J.; Okunola, A.A.; Ayomide, S.O. Determination of the Biological Oxygen Demand (BOD) and Chemical Oxygen Demand (COD) of Liquid Waste Generated from Landmark University Student’s Cafeteria. J. Adv. Sci. Optim. Res. 2022, 23, 73–94. [Google Scholar]
- Najafzadeh, M.; Ghaemi, A. Prediction of the five-day biochemical oxygen demand and chemical oxygen demand in natural streams using machine learning methods. Environ. Monit. Assess. 2019, 191, 380. [Google Scholar] [CrossRef] [PubMed]
- Srinidhi, N.S.; Reddy, P.M.; Reddy, M.A. Evoluation of Water Quality Status of Ameenpur lake, Hydrabad, Telangana, India using Water Quality Index (WQI) and Geo-Spatial technology. Plant Arch. 2021, 21, 1917–1923. [Google Scholar] [CrossRef]
- Yusuf, Z.H. Phytoplankton as bioindicators of water quality in Nasarawa reservoir, Katsina State Nigeria. Acta Limnol. Bras. 2020, 32, e4. [Google Scholar] [CrossRef]
- Ballah, M.; Bhoyroo, V.; Neetoo, H. Assessment of the physico-chemical quality and extent of algal proliferation in water from an impounding reservoir prone to eutrophication. J. Ecol. Environ. 2019, 43, 5. [Google Scholar] [CrossRef]
- García del Toro, E.M.; Mateo, L.F.; García-Salgado, S.; Más-López, M.I.; Quijano, M.Á. Use of Artificial Neural Networks as a Predictive Tool of Dissolved Oxygen Present in Surface Water Discharged in the Coastal Lagoon of the Mar Menor (Murcia, Spain). Int. J. Environ. Res. Public Health 2022, 19, 4531. [Google Scholar] [CrossRef] [PubMed]
- Liu, J.; Yu, C.; Hu, Z.; Zhao, Y.; Bai, Y.; Xie, M.; Luo, J. Accurate Prediction Scheme of Water Quality in Smart Mariculture With Deep Bi-S-SRU Learning Network. IEEE Access 2020, 8, 24784–24798. [Google Scholar] [CrossRef]
- Nasir, N.; Kansal, A.; Alshaltone, O.; Barneih, F.; Sameer, M.; Shanableh, A.; Al-Shamma’a, A. Water quality classification using machine learning algorithms. J. Water Process Eng. 2022, 48, 102920. [Google Scholar] [CrossRef]
- Kadam, A.K.; Wagh, V.M.; Muley, A.A.; Umrikar, B.N.; Sankhua, R.N. Prediction of water quality index using artificial neural network and multiple linear regression modelling approach in Shivganga River basin, India. Model. Earth Syst. Environ. 2019, 5, 951–962. [Google Scholar] [CrossRef]
- Maulud, D.; Abdulazeez, A.M. A Review on Linear Regression Comprehensive in Machine Learning. J. Appl. Sci. Technol. Trends 2020, 1, 140–147. [Google Scholar] [CrossRef]
- Ray, S. A Quick Review of Machine Learning Algorithms. In Proceedings of the 2019 International Conference on Machine Learning, Big Data, Cloud and Parallel Computing (COMITCon), Faridabad, India, 14–16 February 2019; pp. 35–39. [Google Scholar] [CrossRef]
- García-Alba, J.; Bárcena, J.F.; Ugarteburu, C.; García, A. Artificial neural networks as emulators of process-based models to analyse bathing water quality in estuaries. Water Res. 2019, 150, 283–295. [Google Scholar] [CrossRef] [PubMed]
- Rajaee, T.; Khani, S.; Ravansalar, M. Artificial intelligence-based single and hybrid models for prediction of water quality in rivers: A review. Chemom. Intell. Lab. Syst. 2020, 200, 103978. [Google Scholar] [CrossRef]
- Zhang, Y.; Gao, X.; Smith, K.; Inial, G.; Liu, S.; Conil, L.B.; Pan, B. Integrating water quality and operation into prediction of water production in drinking water treatment plants by genetic algorithm enhanced artificial neural network. Water Res. 2019, 164, 114888. [Google Scholar] [CrossRef] [PubMed]
- Ouma, Y.O.; Okuku, C.O.; Njau, E.N. Use of Artificial Neural Networks and Multiple Linear Regression Model for the Prediction of Dissolved Oxygen in Rivers: Case Study of Hydrographic Basin of River Nyando, Kenya. Complexity 2020, 2020, 9570789. [Google Scholar] [CrossRef]
- Jeung, M.; Baek, S.; Beom, J.; Cho, K.H.; Her, Y.; Yoon, K. Evaluation of random forest and regression tree methods for estimation of mass first flush ratio in urban catchments. J. Hydrol. 2019, 575, 1099–1110. [Google Scholar] [CrossRef]
- Kouadri, S.; Elbeltagi, A.; Islam, A.R.M.d.T.; Kateb, S. Performance of machine learning methods in predicting water quality index based on irregular data set: Application on Illizi region (Algerian southeast). Appl. Water Sci. 2021, 11, 190. [Google Scholar] [CrossRef]
- Wang, F.; Wang, Y.; Zhang, K.; Hu, M.; Weng, Q.; Zhang, H. Spatial heterogeneity modeling of water quality based on random forest regression and model interpretation. Environ. Res. 2021, 202, 111660. [Google Scholar] [CrossRef]
- Achite, M.; Samadianfard, S.; Elshaboury, N.; Sharafi, M. Modeling and optimization of coagulant dosage in water treatment plants using hybridized random forest model with genetic algorithm optimization. Environ. Dev. Sustain. 2022, 25, 11189–11207. [Google Scholar] [CrossRef]
- Hodson, T.O. Root-mean-square error (RMSE) or mean absolute error (MAE): When to use them or not. Geosci. Model Dev. 2022, 15, 5481–5487. [Google Scholar] [CrossRef]
- Isiyaka, H.A.; Mustapha, A.; Juahir, H.; Phil-Eze, P. Water quality modelling using artificial neural network and multivariate statistical techniques. Model. Earth Syst. Environ. 2019, 5, 583–593. [Google Scholar] [CrossRef]
- Chicco, D.; Warrens, M.J.; Jurman, G. The coefficient of determination R-squared is more informative than SMAPE, MAE, MAPE, MSE and RMSE in regression analysis evaluation. PeerJ Comput. Sci. 2021, 7, e623. [Google Scholar] [CrossRef] [PubMed]
- Khoi, D.N.; Quan, N.T.; Linh, D.Q.; Nhi, P.T.T.; Thuy, N.T.D. Using Machine Learning Models for Predicting the Water Quality Index in the La Buong River, Vietnam. Water 2022, 14, 1552. [Google Scholar] [CrossRef]
- Nong, X.; Shao, D.; Zhong, H.; Liang, J. Evaluation of water quality in the South-to-North Water Diversion Project of China using the water quality index (WQI) method. Water Res. 2020, 178, 115781. [Google Scholar] [CrossRef]
- Fu, B.; Merritt, W.S.; Croke, B.F.W.; Weber, T.R.; Jakeman, A.J. A review of catchment-scale water quality and erosion models and a synthesis of future prospects. Environ. Model. Softw. 2019, 114, 75–97. [Google Scholar] [CrossRef]
- Tang, T.; Strokal, M.; van Vliet, M.T.H.; Seuntjens, P.; Burek, P.; Kroeze, C.; Langan, S.; Wada, Y. Bridging global, basin and local-scale water quality modeling towards enhancing water quality management worldwide. Curr. Opin. Environ. Sustain. 2019, 36, 39–48. [Google Scholar] [CrossRef]
- Tiyasha; Tung, T.M.; Yaseen, Z.M. A survey on river water quality modelling using artificial intelligence models: 2000–2020. J. Hydrol. 2020, 585, 124670. [Google Scholar] [CrossRef]
- Verma, M.L.; Rani, V. Biosensors for toxic metals, polychlorinated biphenyls, biological oxygen demand, endocrine disruptors, hormones, dioxin, phenolic and organophosphorus compounds: A review. Environ. Chem. Lett. 2021, 19, 1657–1666. [Google Scholar] [CrossRef]
- Niroumand-Jadidi, M.; Bovolo, F.; Bruzzone, L. Water Quality Retrieval from PRISMA Hyperspectral Images: First Experience in a Turbid Lake and Comparison with Sentinel-2. Remote Sens. 2020, 12, 3984. [Google Scholar] [CrossRef]
- Warren, M.A.; Simis, S.G.H.; Selmes, N. Complementary water quality observations from high and medium resolution Sentinel sensors by aligning chlorophyll-a and turbidity algorithms. Remote Sens. Environ. 2021, 265, 112651. [Google Scholar] [CrossRef] [PubMed]
- Xiang, X.; Li, Q.; Khan, S.; Khalaf, O.I. Urban water resource management for sustainable environment planning using artificial intelligence techniques. Environ. Impact Assess. Rev. 2021, 86, 106515. [Google Scholar] [CrossRef]
- Zekić-Sušac, M.; Mitrović, S.; Has, A. Machine learning based system for managing energy efficiency of public sector as an approach towards smart cities. Int. J. Inf. Manag. 2021, 58, 102074. [Google Scholar] [CrossRef]
- Asadollah, S.B.H.S.; Sharafati, A.; Motta, D.; Yaseen, Z.M. River water quality index prediction and uncertainty analysis: A comparative study of machine learning models. J. Environ. Chem. Eng. 2021, 9, 104599. [Google Scholar] [CrossRef]
- Yan, Y.; Wang, Y.; Yu, C.; Zhang, Z. Multispectral Remote Sensing for Estimating Water Quality Parameters: A Comparative Study of Inversion Methods Using Unmanned Aerial Vehicles (UAVs). Sustainability 2023, 15, 10298. [Google Scholar] [CrossRef]
- Zhang, S.; Omar, A.H.; Hashim, A.S.; Alam, T.; Khalifa, H.A.E.-W.; Elkotb, M.A. Enhancing waste management and prediction of water quality in the sustainable urban environment using optimized algorithm of least square support vector machine and deep learning techniques. Urban Clim. 2023, 49, 101487. [Google Scholar] [CrossRef]
- Aslani, B.; Mohebbi, S.; Axthelm, H. Predictive analytics for water main breaks using spatiotemporal data. Urban Water J. 2021, 18, 433–448. [Google Scholar] [CrossRef]
- Bhardwaj, A.; Dagar, V.; Khan, M.O.; Aggarwal, A.; Alvarado, R.; Kumar, M.; Irfan, M.; Proshad, R. Smart IoT and machine learning-based framework for water quality assessment and device component monitoring. Environ. Sci. Pollut. Res. 2022, 29, 46018–46036. [Google Scholar] [CrossRef]
- Li, L.; Rong, S.; Wang, R.; Yu, S. Recent advances in artificial intelligence and machine learning for nonlinear relationship analysis and process control in drinking water treatment: A review. Chem. Eng. J. 2021, 405, 126673. [Google Scholar] [CrossRef]
- Saefudin, A.; Nadiroh; Achmad, R. Policy implementation evaluation about quality management and pollution control of water in Regency of Bekasi. IOP Conf. Ser. Earth Environ. Sci. 2019, 314, 012087. [Google Scholar] [CrossRef]
- Varadharajan, C.; Appling, A.P.; Arora, B.; Christianson, D.S.; Hendrix, V.C.; Kumar, V.; Lima, A.R.; Müller, J.; Oliver, S.; Ombadi, M.; et al. Can machine learning accelerate process understanding and decision-relevant predictions of river water quality? Hydrol. Process 2022, 36, e14565. [Google Scholar] [CrossRef]
- Giri, S. Water quality prospective in Twenty First Century: Status of water quality in major river basins, contemporary strategies and impediments: A review. Environ. Pollut. 2021, 271, 116332. [Google Scholar] [CrossRef] [PubMed]
- Zhi, W.; Feng, D.; Tsai, W.-P.; Sterle, G.; Harpold, A.; Shen, C.; Li, L. From Hydrometeorology to River Water Quality: Can a Deep Learning Model Predict Dissolved Oxygen at the Continental Scale? Environ. Sci. Technol. 2021, 55, 2357–2368. [Google Scholar] [CrossRef]
- Zhu, M.; Wang, J.; Yang, X.; Zhang, Y.; Zhang, L.; Ren, H.; Wu, B.; Ye, L. A review of the application of machine learning in water quality evaluation. Eco-Environ. Health 2022, 1, 107–116. [Google Scholar] [CrossRef]
- EL Bilali, A.; Taleb, A.; Bahlaoui, M.A.; Brouziyne, Y. An integrated approach based on Gaussian noises-based data augmentation method and AdaBoost model to predict faecal coliforms in rivers with small dataset. J. Hydrol. 2021, 599, 126510. [Google Scholar] [CrossRef]
- Kumar, K.; Pande, B.P. Air pollution prediction with machine learning: A case study of Indian cities. Int. J. Environ. Sci. Technol. 2023, 20, 5333–5348. [Google Scholar] [CrossRef] [PubMed]
- Najah Ahmed, A.; Binti Othman, F.; Abdulmohsin Afan, H.; Khaleel Ibrahim, R.; Ming Fai, C.; Shabbir Hossain, M.; Ehteram, M.; Elshafie, A. Machine learning methods for better water quality prediction. J. Hydrol. 2019, 578, 124084. [Google Scholar] [CrossRef]
- Searcy, R.T.; Boehm, A.B. A Day at the Beach: Enabling Coastal Water Quality Prediction with High-Frequency Sampling and Data-Driven Models. Environ. Sci. Technol. 2021, 55, 1908–1918. [Google Scholar] [CrossRef]
- Deng, T.; Duan, H.-F.; Keramat, A. Spatiotemporal characterization and forecasting of coastal water quality in the semi-enclosed Tolo Harbour based on machine learning and EKC analysis. Eng. Appl. Comput. Fluid Mech. 2022, 16, 694–712. [Google Scholar] [CrossRef]
- Aldhyani, T.H.H.; Al-Yaari, M.; Alkahtani, H.; Maashi, M. Water Quality Prediction Using Artificial Intelligence Algorithms. Appl. Bionics Biomech. 2020, 2020, 6659314. [Google Scholar] [CrossRef] [PubMed]
- Altenburger, R.; Brack, W.; Burgess, R.M.; Busch, W.; Escher, B.I.; Focks, A.; Mark Hewitt, L.; Jacobsen, B.N.; de Alda, M.L.; Ait-Aissa, S.; et al. Future water quality monitoring: Improving the balance between exposure and toxicity assessments of real-world pollutant mixtures. Environ. Sci. Eur. 2019, 31, 12. [Google Scholar] [CrossRef]
- Barzegar, R.; Aalami, M.T.; Adamowski, J. Short-term water quality variable prediction using a hybrid CNN–LSTM deep learning model. Stoch. Environ. Res. Risk Assess. 2020, 34, 415–433. [Google Scholar] [CrossRef]
- Dingemans, M.; Smeets, P.; Medema, G.; Frijns, J.; Raat, K.; van Wezel, A.; Bartholomeus, R. Responsible Water Reuse Needs an Interdisciplinary Approach to Balance Risks and Benefits. Water 2020, 12, 1264. [Google Scholar] [CrossRef]
- Ibrahim, H.; Yaseen, Z.M.; Scholz, M.; Ali, M.; Gad, M.; Elsayed, S.; Khadr, M.; Hussein, H.; Ibrahim, H.H.; Eid, M.H.; et al. Evaluation and Prediction of Groundwater Quality for Irrigation Using an Integrated Water Quality Indices, Machine Learning Models and GIS Approaches: A Representative Case Study. Water 2023, 15, 694. [Google Scholar] [CrossRef]
- Swanson, J.; Leyland, A.; Young, B. All Hands-on Deck: One Facility’s Interdisciplinary Approach to Achieving Dental Unit Waterline Quality Recommendations in a Brand-New Clinic. J. Dent. Infect. Control Saf. 2021, 3, 31. [Google Scholar]
- Deng, T.; Chau, K.-W.; Duan, H.-F. Machine learning based marine water quality prediction for coastal hydro-environment management. J. Environ. Manag. 2021, 284, 112051. [Google Scholar] [CrossRef]
- Danish, M.S.S. AI and Expert Insights for Sustainable Energy Future. Energies 2023, 16, 3309. [Google Scholar] [CrossRef]
- Kyritsakas, G.; Boxall, J.B.; Speight, V.L. A Big Data framework for actionable information to manage drinking water quality. AQUA Water Infrastruct. Ecosyst. Soc. 2023, 72, 701–720. [Google Scholar] [CrossRef]
- Liang, Z.; Ding, X.; Wang, Y.; Yan, X.; Fu, X. GUDCP: Generalization of Underwater Dark Channel Prior for Underwater Image Restoration. IEEE Trans. Circuits Syst. Video Technol. 2022, 32, 4879–4884. [Google Scholar] [CrossRef]
- Hasan, M.F.; Nur-E-Alam, M.; Salam, M.A.; Rahman, H.; Paul, S.C.; Rak, A.E.; Ambade, B.; Towfiqul Islam, A.R.M. Health Risk and Water Quality Assessment of Surface Water in an Urban River of Bangladesh. Sustainability 2021, 13, 6832. [Google Scholar] [CrossRef]
- Wang, G.; Jia, Q.-S.; Zhou, M.; Bi, J.; Qiao, J.; Abusorrah, A. Artificial neural networks for water quality soft-sensing in wastewater treatment: A review. Artif. Intell. Rev. 2022, 55, 565–587. [Google Scholar] [CrossRef]
- Ewaid, S.; Abed, S.; Al-Ansari, N.; Salih, R. Development and Evaluation of a Water Quality Index for the Iraqi Rivers. Hydrology 2020, 7, 67. [Google Scholar] [CrossRef]
- Li, X.; Yi, S.; Cundy, A.B.; Chen, W. Sustainable decision-making for contaminated site risk management: A decision tree model using machine learning algorithms. J. Clean. Prod. 2022, 371, 133612. [Google Scholar] [CrossRef]
- El Bilali, A.; Taleb, A.; Brouziyne, Y. Groundwater quality forecasting using machine learning algorithms for irrigation purposes. Agric. Water Manag. 2021, 245, 106625. [Google Scholar] [CrossRef]
- Keysers, D.; Schärli, N.; Scales, N.; Buisman, H.; Furrer, D.; Kashubin, S.; Momchev, N.; Sinopalnikov, D.; Stafiniak, L.; Tihon, T. Measuring compositional generalization: A comprehensive method on realistic data. arXiv 2019, arXiv:1912.09713. [Google Scholar]
- Akhtar, N.; Ishak, M.I.S.; Ahmad, M.I.; Umar, K.; Md Yusuff, M.S.; Anees, M.T.; Qadir, A.; Ali Almanasir, Y.K. Modification of the Water Quality Index (WQI) Process for Simple Calculation Using the Multi-Criteria Decision-Making (MCDM) Method: A Review. Water 2021, 13, 905. [Google Scholar] [CrossRef]
- Sahoo, D.; Swain, R. Water Quality Modelling Using QUAL-2K at Bray Marina, UK. In Proceedings of the 26th International Conference on Hydraulics, Water Resources and Coastal Engineering (HYDRO 2021), Surat, India, 23–25 December 2021; Springer Nature: Berlin/Heidelberg, Germany, 2023; p. 489. [Google Scholar]
- Wang, R.; Kim, J.-H.; Li, M.-H. Predicting stream water quality under different urban development pattern scenarios with an interpretable machine learning approach. Sci. Total Environ. 2021, 761, 144057. [Google Scholar] [CrossRef] [PubMed]
Disclaimer/Publisher’s Note: The statements, opinions and data contained in all publications are solely those of the individual author(s) and contributor(s) and not of MDPI and/or the editor(s). MDPI and/or the editor(s) disclaim responsibility for any injury to people or property resulting from any ideas, methods, instructions or products referred to in the content. |
© 2023 by the authors. Licensee MDPI, Basel, Switzerland. This article is an open access article distributed under the terms and conditions of the Creative Commons Attribution (CC BY) license (https://creativecommons.org/licenses/by/4.0/).