Abstract
An automated segmentation method for computed tomography (CT) images of liver tumors is an urgent clinical need. Tumor areas within liver cancer images are easily missed as they are small and have unclear borders. To address these issues, an improved liver tumor segmentation method based on U-Net is proposed. This involves incorporating attention mechanisms into the U-Net’s skip connections, giving higher weights to important regions. Through dynamically adjusting the attention recognition characteristics, the method achieves accurate localization that is focused on and discriminates target regions. Testing using the LiTS (liver tumor segmentation) public dataset resulted in a Dice similarity coefficient of 0.69. The experiments demonstrated that this method can accurately segment liver tumors.
1. Introduction
In the human body, the liver is the most vital organ, playing a crucial and complex role in both physiological and pathological processes. Hepatocellular carcinoma (HCC) is a malignant tumor with the highest mortality rate in the world [1]. In addition, cancers originating from other abdominal organs such as the colon, rectum, and pancreas, as well as distant organs such as the breast and lungs, often metastasize to the liver during the course of the disease [2]. Therefore, accurate lesion segmentation is essential for cancer diagnosis, treatment planning, and monitoring treatment responses, making it necessary to assist physicians in rational surgical treatment [3,4].
Computed tomography (CT) images allow us to see the liver and lesions while also helping radiologists develop appropriate diagnostic and treatment plans [5,6]. At present, there are generally three types of segmentation studies of medical images. Among them, manual segmentation is very dependent on experts, and the subjective judgment of experts will seriously affect the results of manual segmentation [7]. Semiautomatic cutting still requires human intervention, resulting in low practicality. Therefore, the fully automated segmentation of medical images has become the first choice in this field and has been widely studied [8,9,10,11].
The U-Net [12] structure (Ronneberger et al., 2015) shows excellent performance in biological image segmentation, and many researchers usually begin with the U-Net structure as the model structure to improve the performance of segmentation. Res-U-Net [13] (Han, 2017) uses two U-shaped structural models, the first to roughly segment the liver and the second to segment the liver, but multi-segment cascade processing is used to gradually refine the process, resulting in redundant models that are not easy to deploy. Li et al. [9] combined U-Net and Dense-Net [14] to design a dense U-Net model for liver and tumor segmentation to fuse features between images, which reduced the computational cost and extracted more feature information. Zhang et al. [15] (2019) proposed a synergic deep learning (SDL) model, which includes multiple deep convolutional neural networks (DCNNs) (Litjens et al., 2017) to address the issues of intraclass variability and inter-class similarity in image recognition. In this model, the image features extracted from each group of DCNNs are concatenated and used as the input for an SDL. A fully connected layer is then employed to predict whether the input features belong to the same category. If any one of the DCNNs in a group classifies correctly while the other one classifies incorrectly, it results in a synergic error, which is used as additional information to update the model. Ghoneim et al. [16] (2020) utilized images as inputs to a convolutional neural network for extracting deep image features. These features were then classified using an extreme learning machine (ELM) classifier, followed by the fine-tuning of the network. A U-Net based on a fully convolutional network model, an improved ResUNet network, was proposed by R.V. Manjunath et al. [17] in 2022 for liver and tumor segmentation. However, convolutional networks extract many redundant features from the image, which often come from the background or other objects and are irrelevant to our task. These redundant features can interfere with the segmentation results and degrade the performance of the model. To address this issue, Vaswani et al. [18] proposed a fully attention-based network in 2017, which has been successfully applied in the field of NLP and brought profound insights to scholars in the CV field. We can introduce attention mechanisms that selectively process convolutional features by learning which features to emphasize or suppress, effectively helping information propagation in the network and achieving the purpose of feature selection. By introducing attention mechanisms, we can enhance the focus of the model on key features and reduce the reliance on redundant features, thereby improving the performance of the model. Wang et al. [19] proposed the non-local attention mechanism, which requires obtaining more information from the original image in some tasks. To achieve this goal, they expanded the receptive field of the network by stacking convolutional layers, so it was no longer limited to the local region of a single convolutional kernel size, thereby introducing global information and providing richer information for the neural network. Qiao et al. [20] proposed the FSF-U-Net model based on feature selection and residual fusion for liver tumor segmentation in 2021. Through improved attention mechanisms and an optimized U-Net model structure, the segmentation results for liver tumors are made more accurate. However, this model relies on bottleneck features, and if the bottleneck features are not processed, they will bring additional redundant information to each layer of the network, increasing the overall learning burden. Dosovitskiy et al. [21] directly used a Transformer in a sequence of image blocks to perform image classification tasks, achieving state-of-the-art performance on multiple image recognition benchmarks and successfully applying the Transformer to the field of computer vision. Lingyun Li et al. [22] proposed RDCTrans U-Net, which is based on ResNeXt50, expands the receptive field with complementing dilated convolutions, and introduces the Transformer part in the encoder to improve feature extraction efficiency. However, the internal structure of the model is complex and difficult to understand, and the Transformer part cannot represent positional information in the semantic space well.
For a 2D network, it is difficult to utilize the 3D spatial information of liver slices and automatically segment liver 3D images such as CT and MRI [23]. To address this issue, Iek, Zgün et al. [24] proposed a 3D U-Net in 2016, which replaces all 2D operations in the U-Net architecture with corresponding 3D operations to generate 3D segmentation images, effectively utilizing the spatial information between adjacent liver slices and achieving better segmentation results. Li et al. proposed a H-Dense U-Net in 2018, which combines the features of the 2D Dense U-Net and the 3D Dense U-Net, accelerating the convergence of the 3D Dense U-Net. Meanwhile, dense connection blocks were embedded in the U-Net, further improving the segmentation accuracy for the liver and tumor. Wang et al. [25] added a 3D attention module to the 3D segmentation model, improving the efficiency of the 3D model. Ma et al. [26] generalized the 3D model for many image segmentation tasks. However, the 3D model requires a large number of parameters, which puts relatively high demands on computer memory and performance. With the same computational resources, 2D models can have deeper network structures and larger filter receptive fields.
Although the abovementioned methods have achieved effective detection, they have not effectively utilized the contextual information of the lesion area during network training. They only extract the global features of the image, failing to learn the deep features of different lesion areas. Moreover, the local features of the lesion area are not emphasized, and they are heavily influenced by irrelevant information, neglecting the auxiliary diagnostic information in the image. Due to the inconsistent shape of liver tumors, small lesion area proportions, and difficulty in distinguishing lesions in the edge region, it is challenging to extract features and achieve accurate segmentation. Focusing on the lesion area itself and utilizing the contextual information from the surrounding region to enhance and complement the lesion features involves comprehensive and thorough extraction of both the global and local features of the lesion area while minimizing the influence of background noise. This approach aims to prevent the loss of details and features in the boundary region of the lesion, making it a promising research direction. In this study, we propose a liver tumor segmentation model that improves the performance of the U-Net. The model accurately localizes lesions and enhances the segmentation performance.
2. The Traditional U-Net
As shown in the figure above, the ReLU function can convert negative values to 0, while positive values are unchanged; such a unilateral suppression operation can make neurons have sparse activation activity and can better explore features after sparseness. In addition, the ReLU function is more powerful than other excitation functions, and because its slope in the nonnegative interval is constant, there is no problem of slope elimination.
U-Net is a new approach based on an FCN (fully convolutional networks for semantic segmentation) proposed by Ronneberge et al.
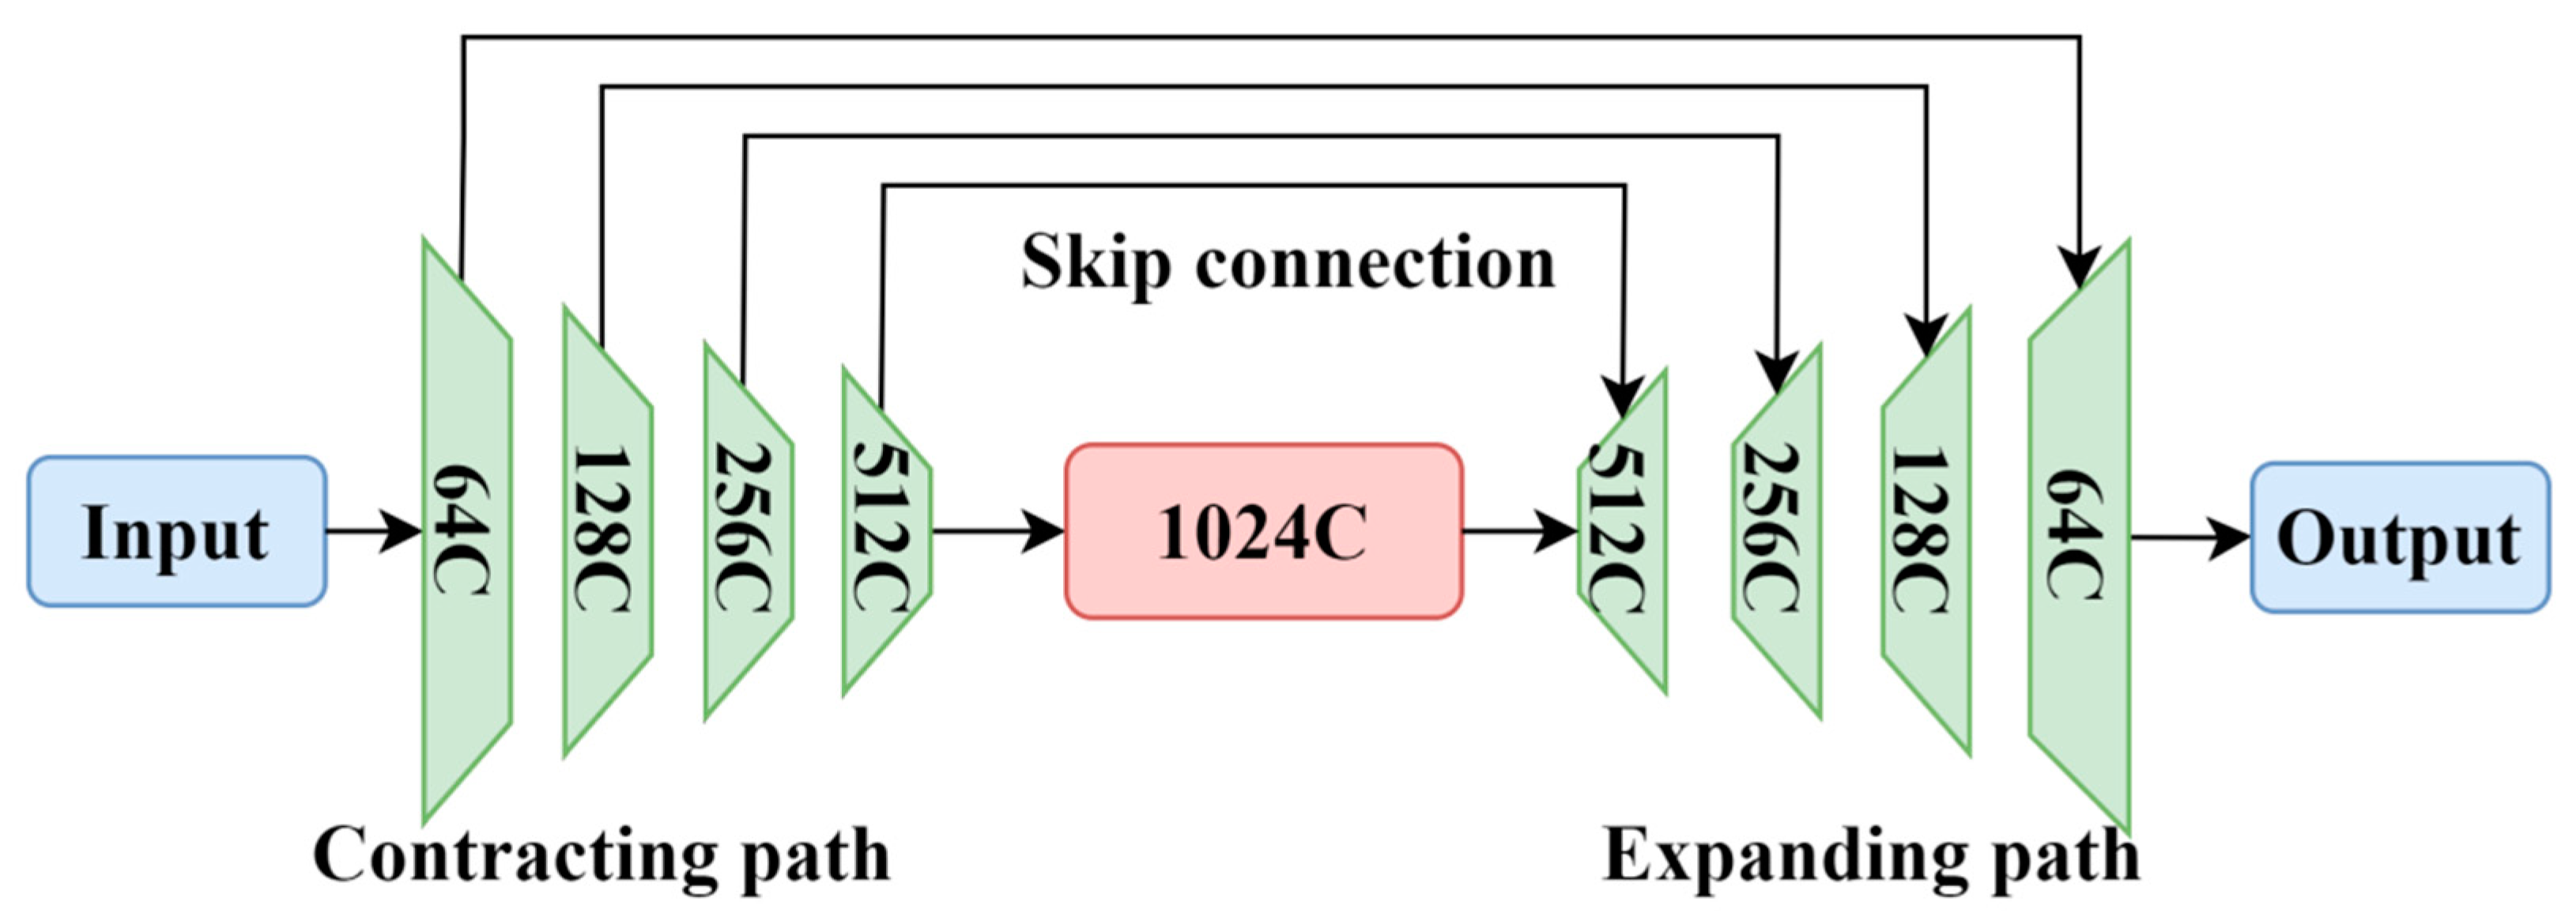
U-Net is a symmetric neural network with an encoder–decoder architecture, resembling the letter “U”, hence its name. Figure 1 shows a typical U-Net network. The network consists of operations such as convolution, downsampling, upsampling, and concatenation. The left half of the network is the contracting path, while the right half is the expanding path. The contracting path is responsible for extracting important features from the image and reducing its resolution, composed of four blocks. Each block includes two 3×3 convolutions, ReLU activation, and one downsampling operation. The use of 3×3 convolutional kernels aims to reduce the complexity of the neural network while maintaining segmentation accuracy. U-Net performs mirror edge padding on the input image, adding symmetric edges that mirror the edge pixels. This mirror operation helps to handle edge information better. Then, two 3 × 3 convolutions and ReLU activation are applied. The ReLU activation function accelerates the convergence and prevents the gradient from vanishing. Subsequently, downsampling is performed using 2 × 2 max pooling to reduce the image resolution while preserving important information, although pooling may lead to some loss of features. After each downsampling operation, the dimensions of the image increase to twice the original dimensions, halving the size. By repeating these four operations, the dimension of the feature map increases from the initial 64 to 512, and the size of the feature map becomes 32 × 32 pixels.
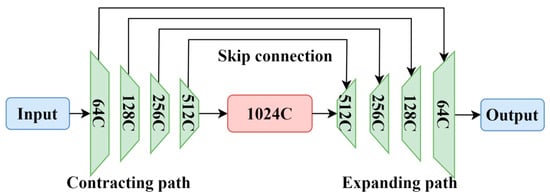
Figure 1.
U-Net model.
The expanding path of the U-Net is used to gradually restore the image details for the precise localization of lesions and to restore the image to the size of the input image. The expanding path also consists of four blocks, each containing two 3 × 3 convolutions, ReLU activation, and one upsampling operation. The upsampling operations decode the abstract features obtained through downsampling back to the original size of the image. After each upsampling operation, the size of the feature map doubles, while the number of channels halves, and the final output feature map has the same size as the input. Skip connections are added between the contracting and expanding paths for pixel-level localization. Unlike the summation operation used in an FCN, the U-Net uses concatenation to crop the feature maps from the same layer of the contracting path to match the size of the expanding path and then performs concatenation. This helps to recover information lost during the downsampling process.
3. Image Segmentation Evaluation Metrics
In this experiment, the Dice similarity coefficient (DSC), recall, and precision were selected as the evaluation metrics to assess the performance of the network. The formulas for calculating these evaluation metrics are as follows:
where TP represents the true positives, which denotes the locations where the predicted results overlap with the manually annotated ground truth. FP represents false positives, which refer to the locations where the predicted results are not present in the ground truth. FN represents false negatives, which indicate the locations that are present in the ground truth but not in the predicted results. The Dice coefficient is used to measure the similarity between the predicted results and the ground truth, with values ranging from 0 to 1. A higher value indicates a higher similarity between the predicted results and the ground truth. Recall is the ratio of true positives to the sum of true positives and false negatives, while precision is the ratio of true positives to the sum of true positives and false positives. Both the recall and precision range from 0 to 1, with a higher value indicating a lower under-segmentation rate and over-segmentation rate for the predicted results.
Due to the imbalanced nature of positive and negative samples in the data images, this study employs a combination of Dice Loss (DL) and weighted binary cross entropy (BCE) loss. This is because the Dice Loss (DL) can potentially lead to abrupt gradient changes, thereby affecting the backpropagation process and making training difficult. Hence, the weight of the DL is appropriately reduced. The calculation formula for the loss function is as follows:
In the equation, y represents the true label values, and ŷ represents the corresponding predicted values by the model. ω is the weight assigned to the two losses, set to 0.3. ε is a smoothing parameter introduced to avoid division by zero, and it is set to 1.0.
4. Improved U-Net for Liver Tumor Segmentation
4.1. Improved U-Net Segmentation Model
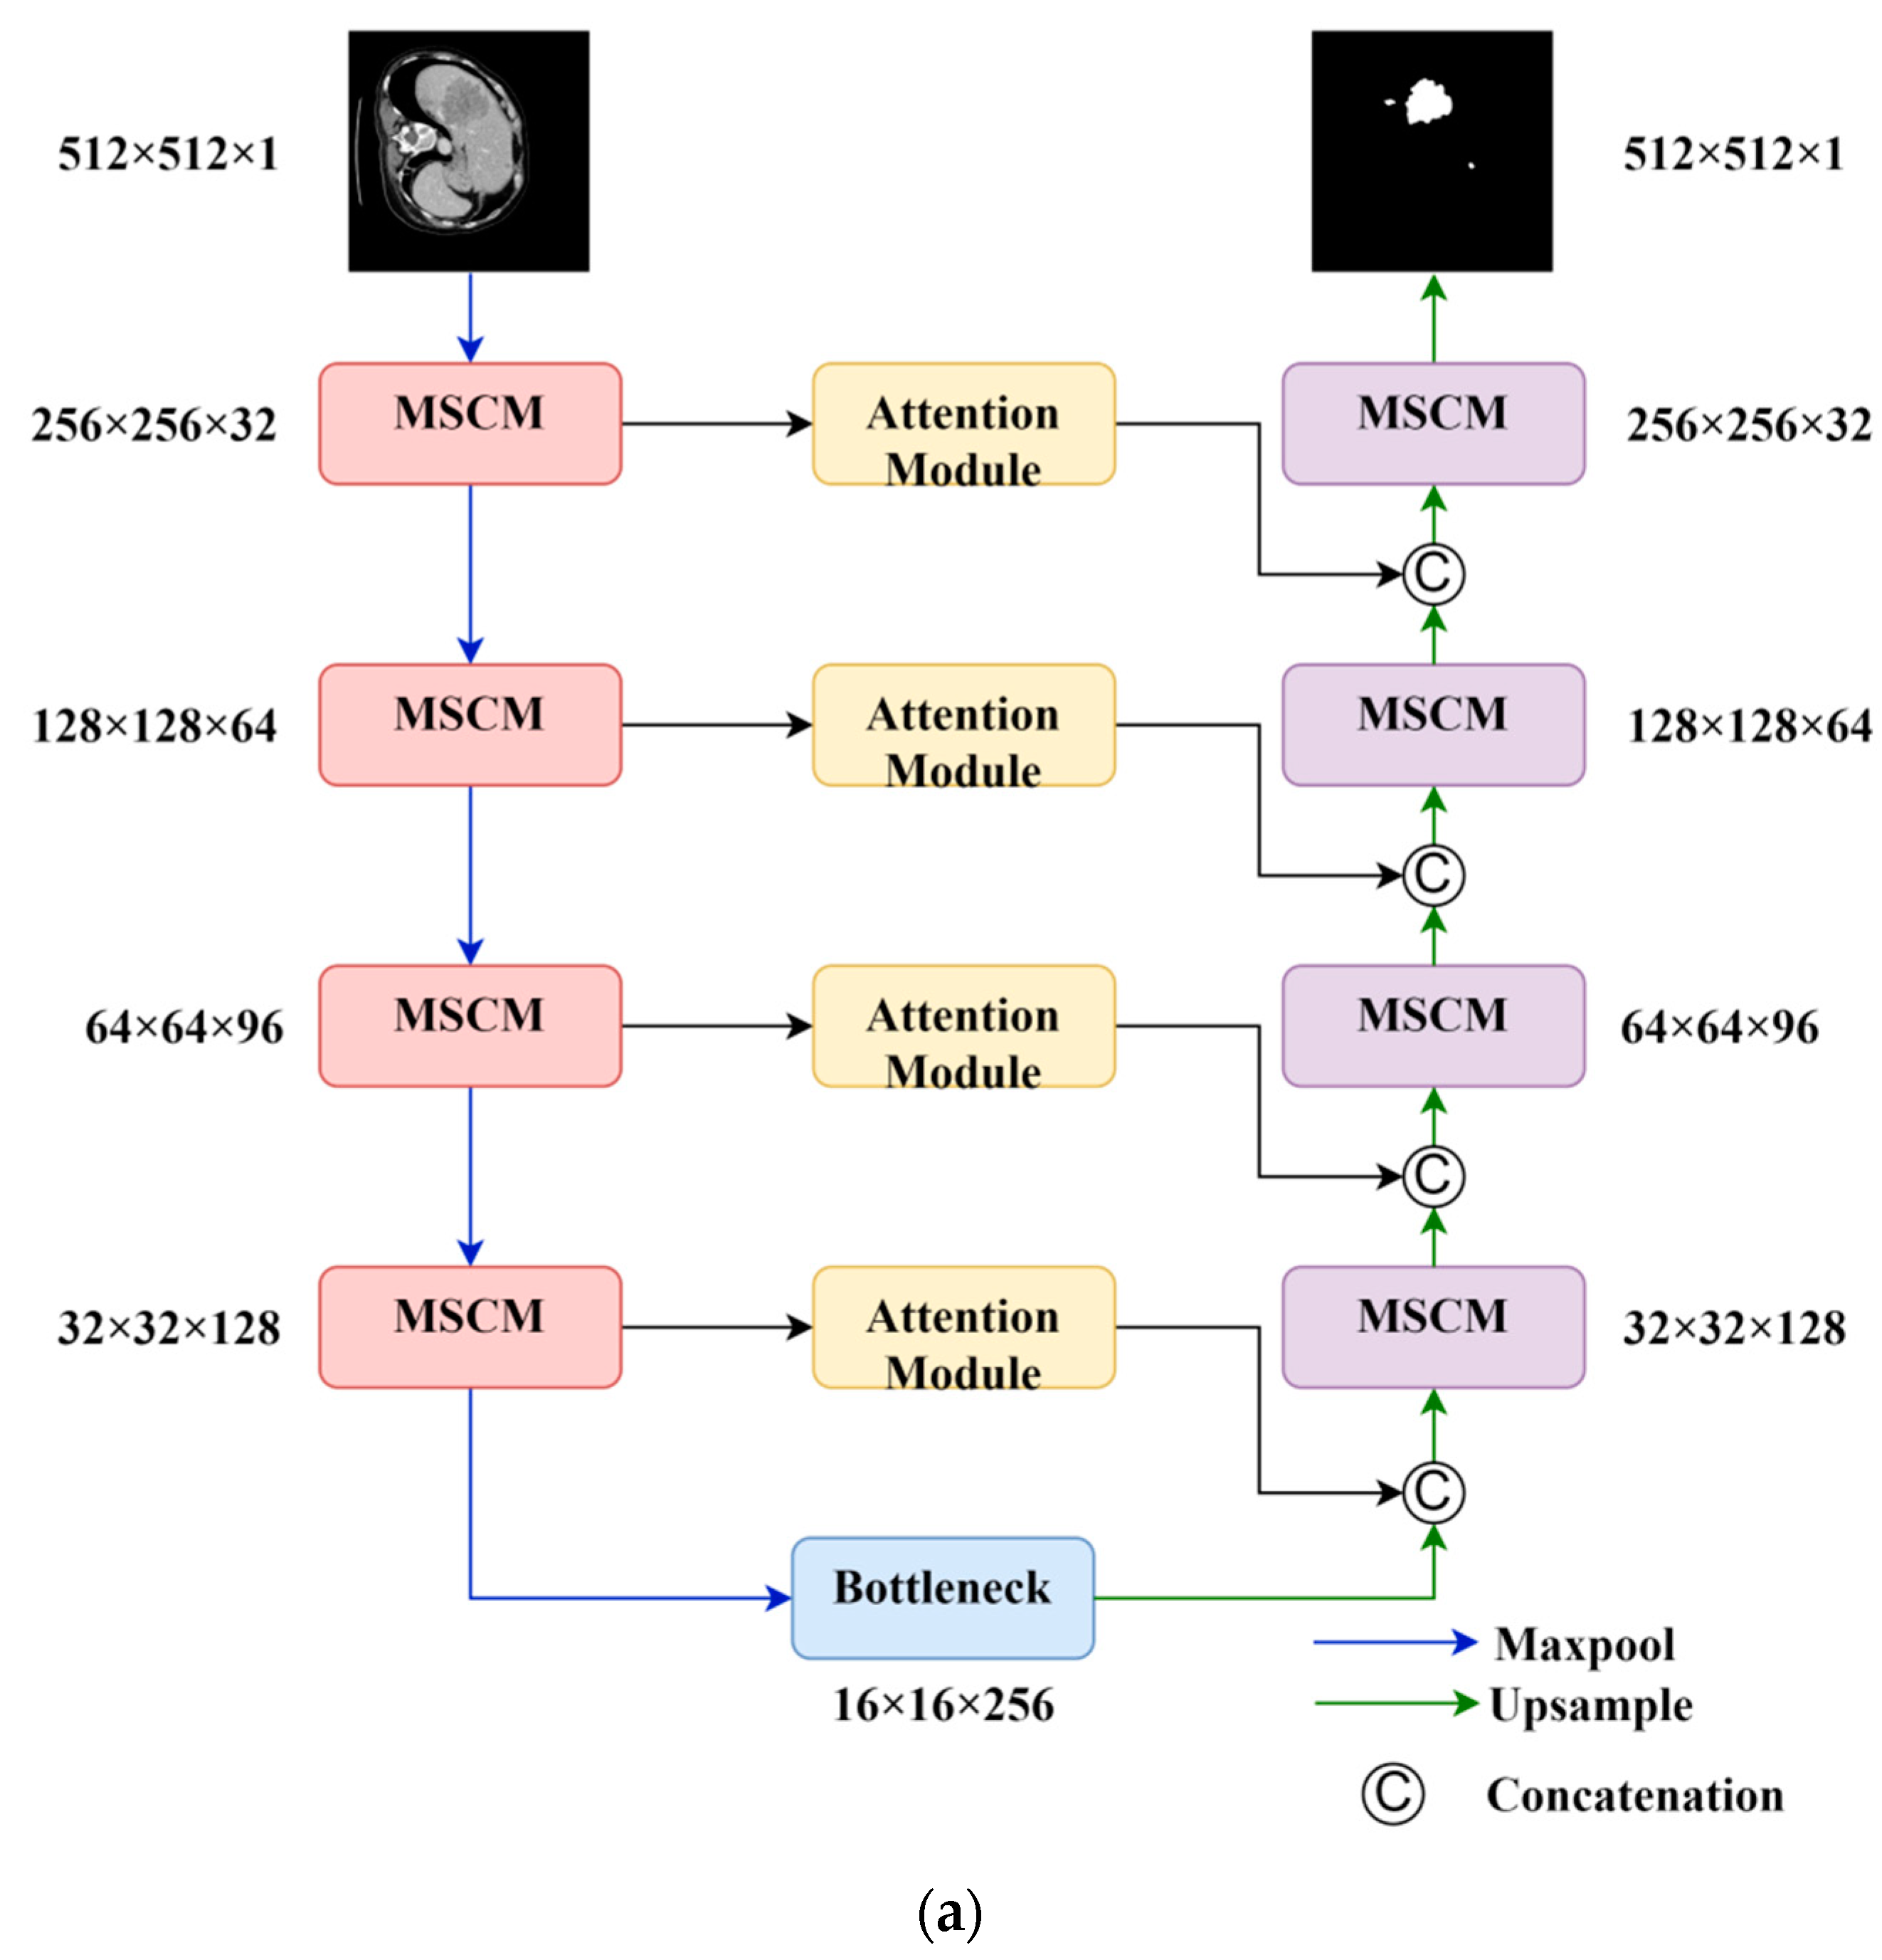
In this section, we take full advantage of the attention mechanism in neural networks, which gives greater weight to focused areas, to address the issues of missing small targets and unclear target boundaries in CT images. We propose an image segmentation method based on the U-Net architecture, incorporating residual [27] as the foundation and multi-scale convolution. We propose a new attention module that combines the attention mechanism and the residual network, effectively increasing the weight of small tumor objects in the image. The network architecture is shown in Figure 2.

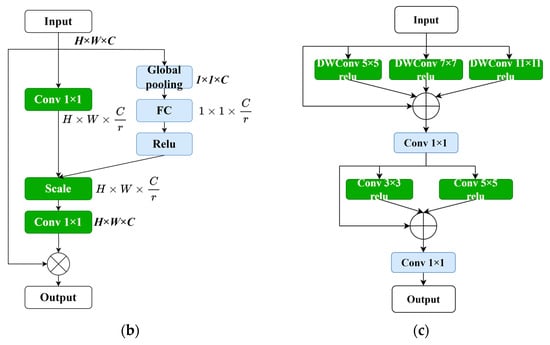
Figure 2.
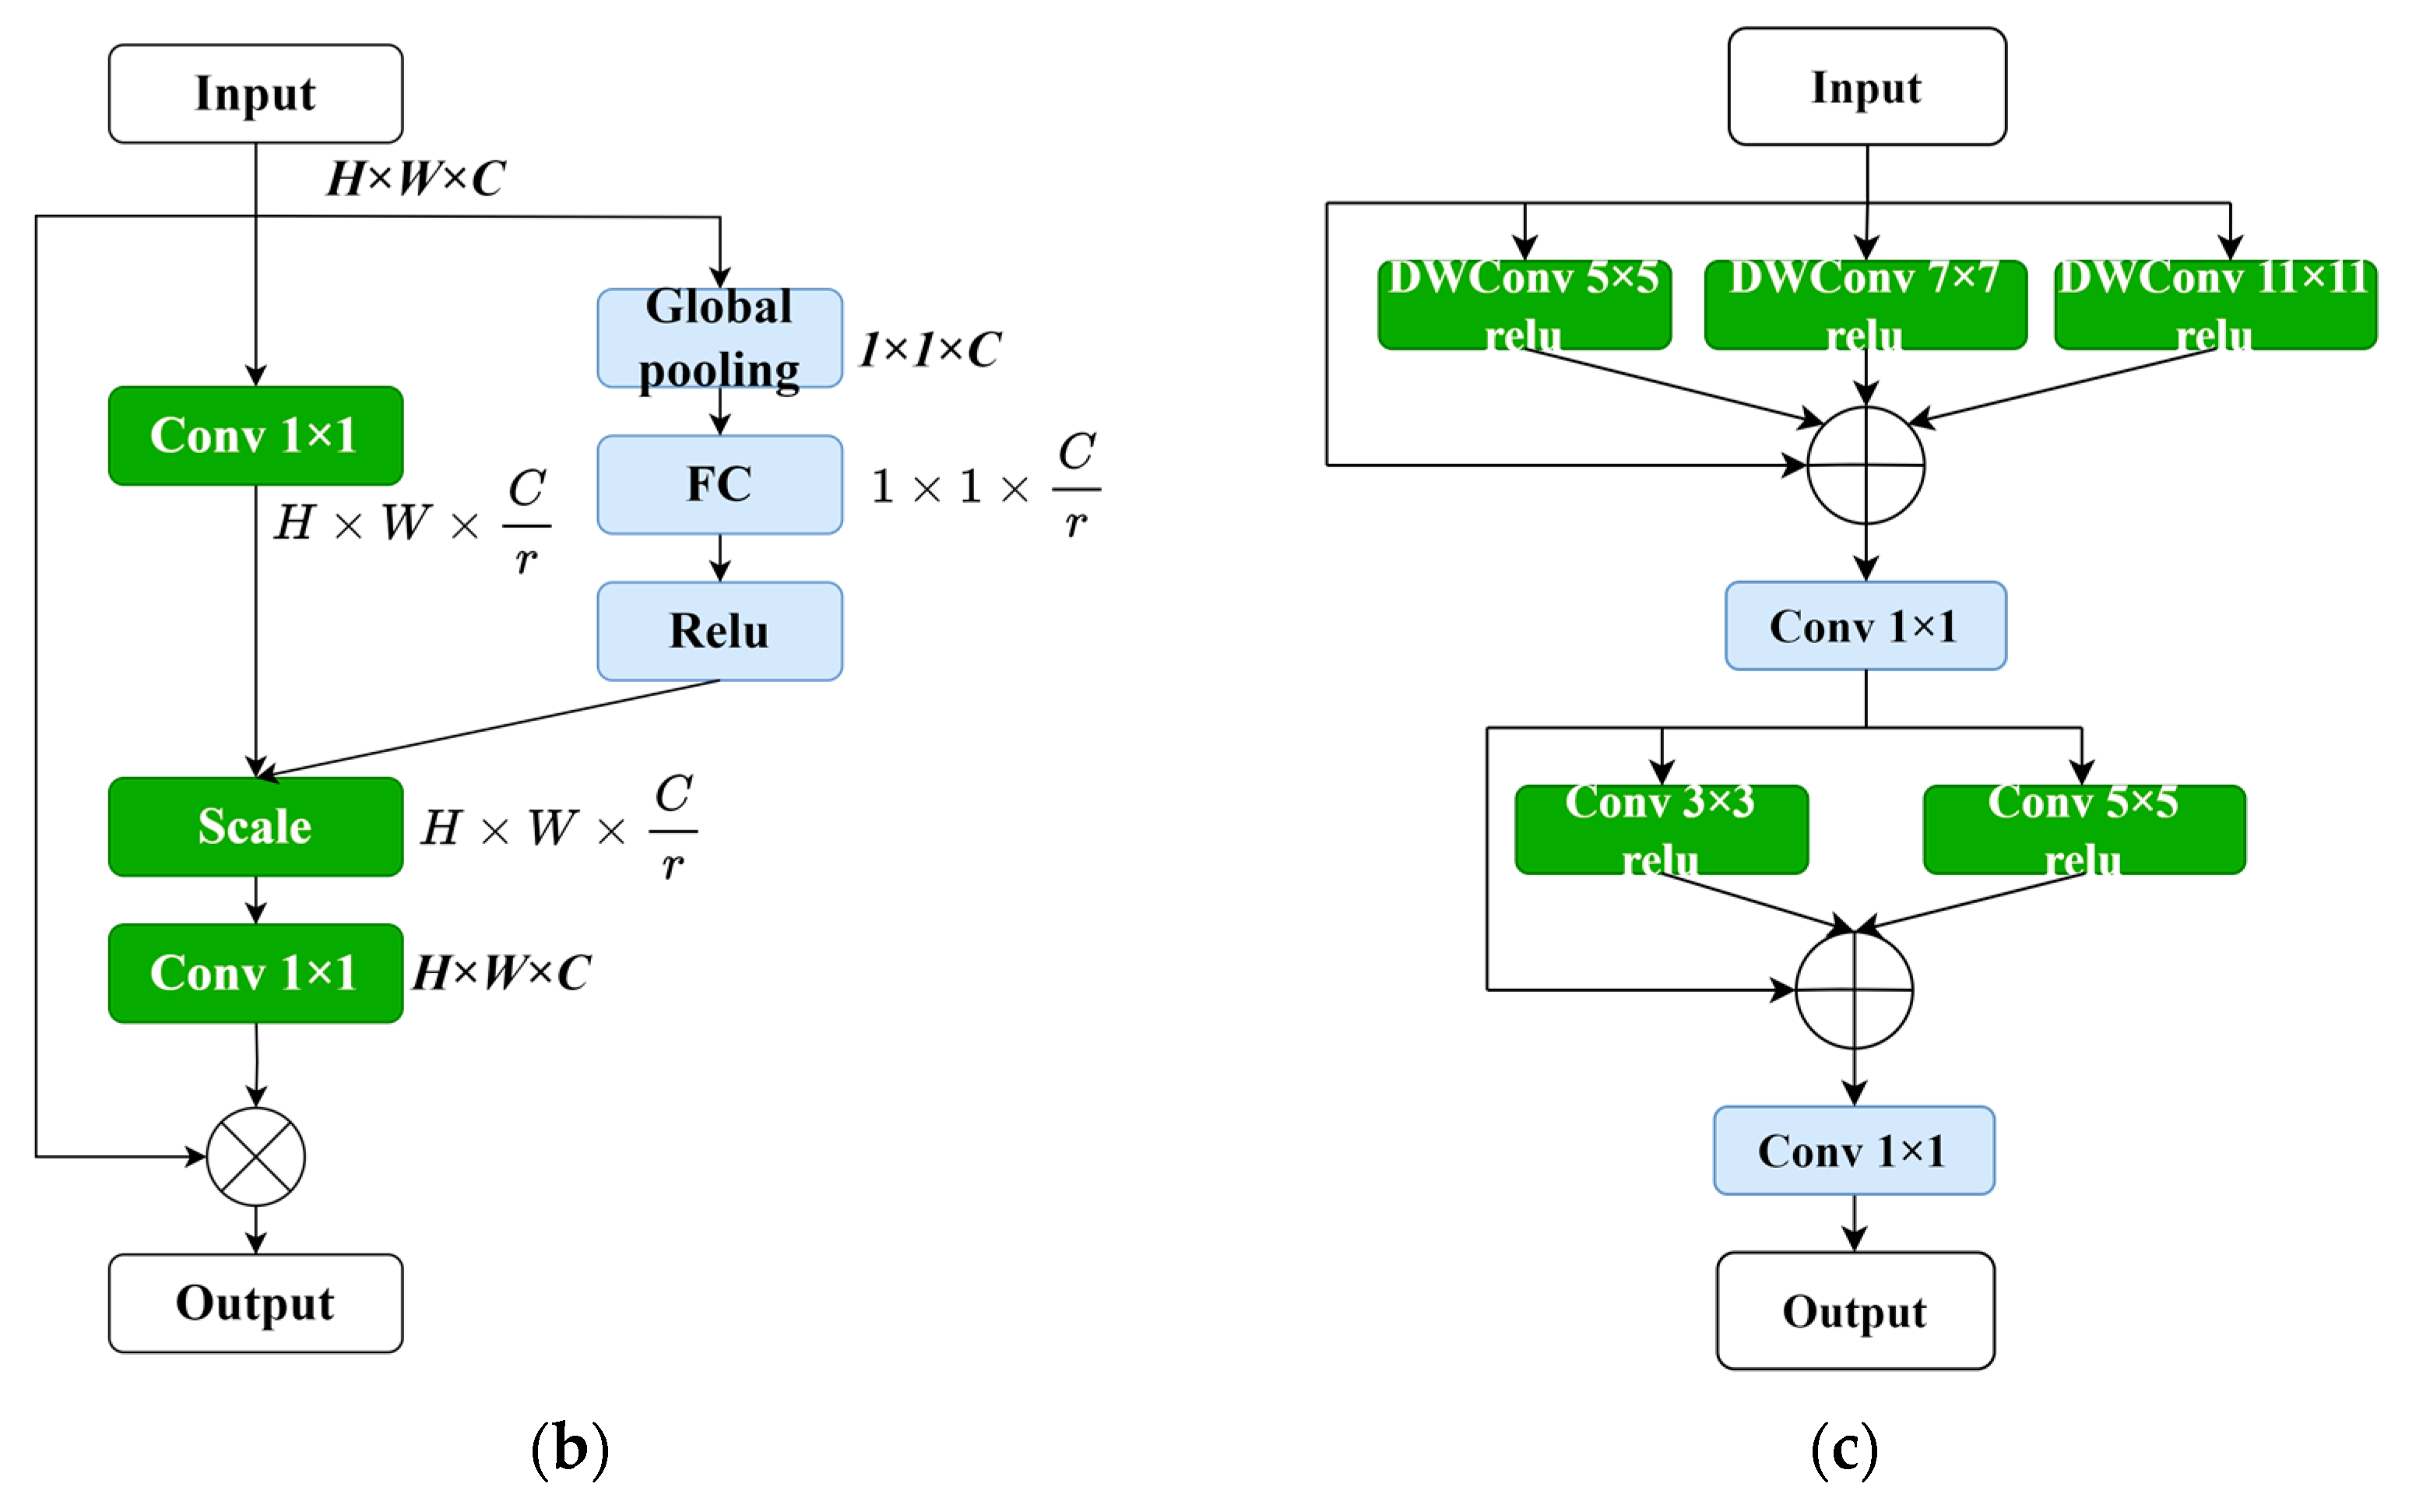
Overall model and key components of this study. (a) Overall structure; (b) attention module; (c) multi-scale convolution module (MSCM).
The model consists of a four-layer contraction path and a symmetric expansion path. As the number of layers in the model increases, the number of feature channels increases, while the dimension of the feature maps decreases. The bottommost layer of the contraction path serves as the bottleneck feature. Each layer in the path is composed of residual convolutional modules (Figure 2c). This module splits the input into two branches. The main branch extracts features at deeper levels, allowing active pixels to reflect the focused region. Then, the outputs of the main branch and the side branch are merged. This process assigns a new weight to each pixel value, enhancing meaningful features and suppressing irrelevant features. The residual structure of the side branch also simplifies the learning process and improves the gradient propagation, thereby enhancing the network’s expressiveness and generalization ability.
The skip connections utilize attention modules (Figure 2b) to extract spatially informative features and address the feature gap problem. The attention module employs a low-complexity yet highly effective structure. It first compresses the channel dimension of the feature map to learn the importance of different spatial locations. Then, it multiplies the compressed feature map with the activation from a 1 × 1 convolutional layer to recalibrate the importance of spatial features, laying the foundation for subsequent feature fusion. Additionally, residual connections are used to accelerate the expressive power of the network.
4.2. Attention Module
There exists a special information processing mechanism in the human brain known as a visual attention mechanism. When humans view a photograph, their eyes quickly scan the entire image, selecting the areas they want to focus on. The attention intensity is then enhanced in those selected regions, highlighting the important information of the objects they wish to pay attention to and filtering out the irrelevant details. Machine vision also operates with a similar attention mechanism, aiming to extract the most important and useful information from massive amounts of data. Building models based on attention mechanisms is crucial in deep neural networks as it allows for the self-regulation of attention and perception of the external world.
Since the introduction of the squeeze-and-excitation network (SENet) [28] and its channel attention (CA) mechanism, subsequent attention mechanisms such as the concurrent spatial and channel squeeze and excitation (scSE) (Roy et al., 2018) and the convolutional block attention module (CBAM) (Woo et al., 2018) have been proposed, incorporating spatial attention mechanisms. The attention module used in this study first captures the importance of each channel through channel attention, and then adaptively adjusts the output through element-wise multiplication with the input features. This approach recalibrates the importance of feature maps, suppressing relatively irrelevant locations, and has a positive effect on fine-grained image segmentation. The calculation formula for the attention module in this paper is as follows:
where represents the input feature map, C represents the number of channels, and H and W represent the height and width of the feature map, respectively. denotes the convolutional matrix, and r represents the compression ratio for feature compression, which was set to two in this study. represents the global average pooling operation. represents the convolutional matrix used to restore the channel dimension to its original size, C. Relu represents the activation function that converts negative values to 0, enabling the neurons to have sparse activation. The symbol represents the shape expansion, making the two parameters on the right side match the shape of the left parameter and then performing element-wise multiplication. The ⊗ operator represents the element-wise multiplication of matrices. In summary, this module controls the flow of information across different levels in the pipeline. It performs feature transformation, suppressing irrelevant features and allowing only useful information to pass through the network layers. This enables each level to focus on complementary details with other levels, enhancing the overall performance of the network. Through this module, we can delve deeper into the effective information in medical images, improve the network’s expressiveness, and reduce interference from background noise. This allows us to focus on the deep-level features of the desired lesion and accurately classify it.
4.3. Multi-Scale Convolution Module
The improvement in the multi-scale convolution module replaces the original two-layer convolution with three DWConv (Depthwise Convolution) operations with kernel sizes of 5 × 5, 7 × 7, and 11 × 11. DWConv is a lightweight convolution operation that achieves comparable results to traditional convolutions with fewer parameters and computations. Since liver tumors can vary in shape and size, using different kernel sizes facilitates the representation of information from images of different scales while increasing the receptive field of the network. After the residual connection, two additional convolutions with kernel sizes of 3 × 3 and 5 × 5 are applied to aggregate local information and capture a more detailed multi-scale context. Therefore, the multi-scale convolution module enhances the generalization and expressive power of the entire model. The calculation formula for the residual convolutional module is as follows:
where represent the convolution matrices.
5. Experimental Results
In this work, the experimental setup consisted of the Windows 10 operating system and the use of a NVIDIA GeForce RTX 2080ti GPU for computational acceleration. The coding environment was python3.6, with the development tool being Spyder. The TensorFlow framework was utilized to build a neural network, which was trained and tested in the experiments.
5.1. Dataset
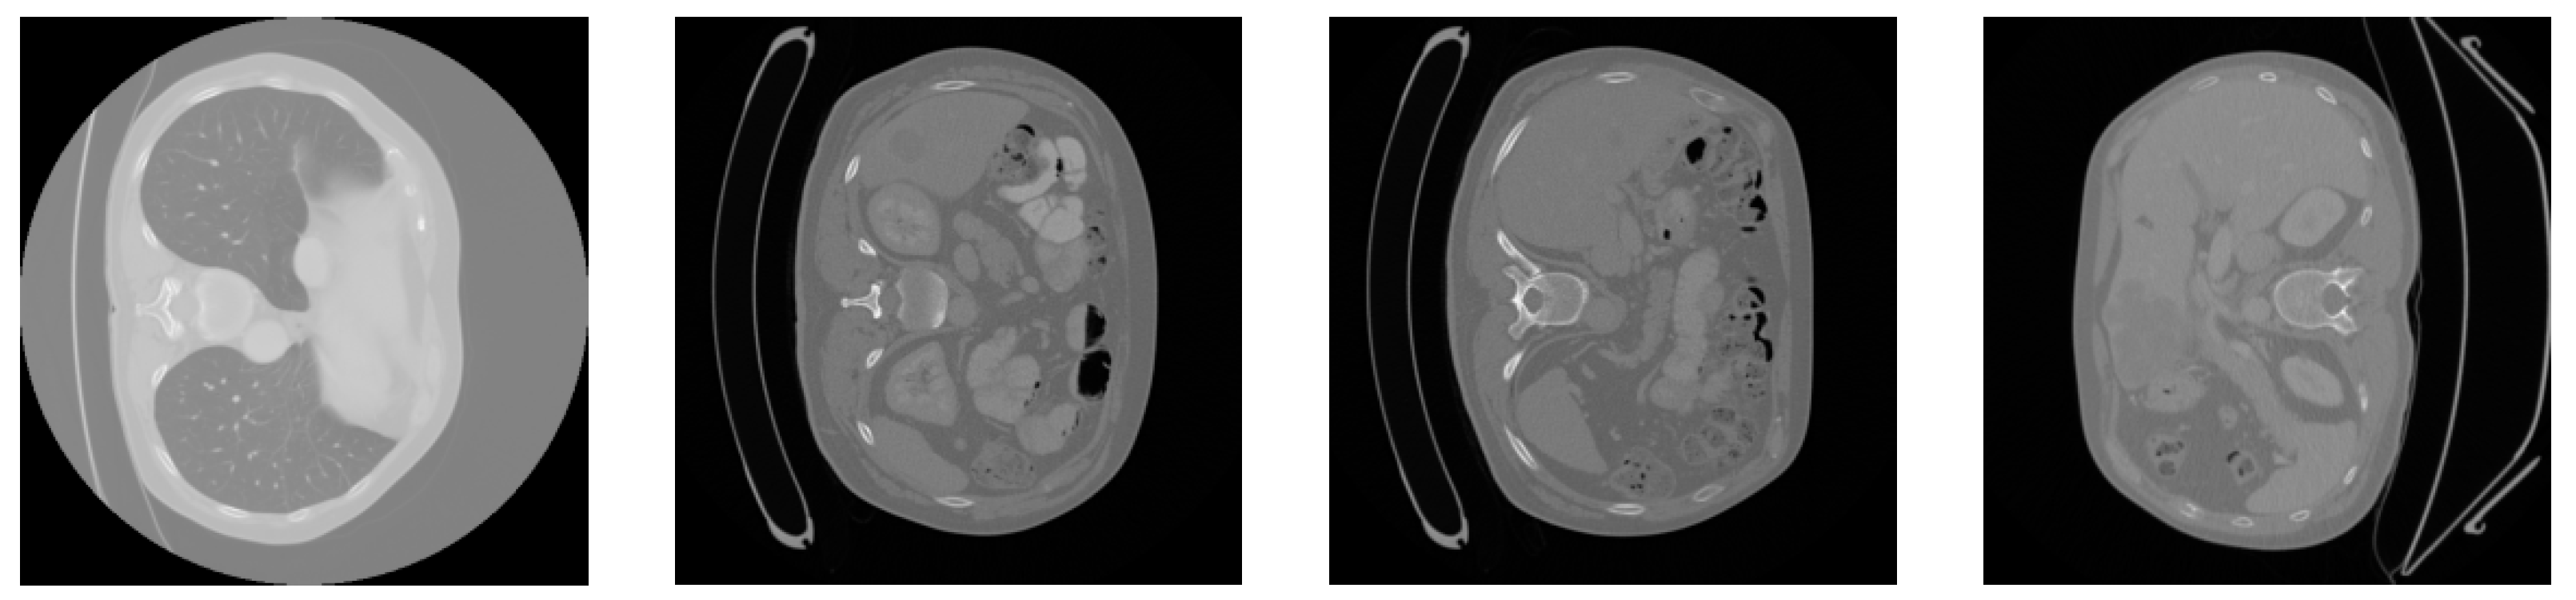
We used the dataset from the 2017 MICCAI Liver Tumor Segmentation Challenge (LiTS) for the experiments. The 2017 MICCAI Liver Tumor Segmentation Challenge collected 131 abdominal CT images from multiple medical institutions in China. The volumes of the livers present a normal distribution similar to the known type, ranging from 0 to 75 in number and from 38 to 349 in size. The subjects include liver cancer, primary liver cancer, secondary liver cancer, colorectal cancer, breast cancer, lung cancer, etc. The contrast of the lesions varies, such as with high- and low-contrast enhancements. Due to the differences in the CT scanning equipment and acquisition standards, there is a significant variation in the resolution and image quality of the CT images. The in-plane resolution ranges from 0.6 mm × 0.6 mm to 1.0 mm × 1.0 mm, and the slice thickness ranges from 0.45 mm to 6.0 mm. All axial slices have a size of 512 × 512 pixels, and the number of slices obtained in each scan ranges from 42 to 1026. Figure 3 shows four samples from the LiTS dataset.
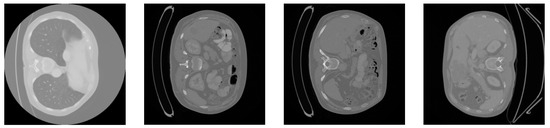
Figure 3.
Slices of the original LiTS dataset.
5.2. Data Preprocessing
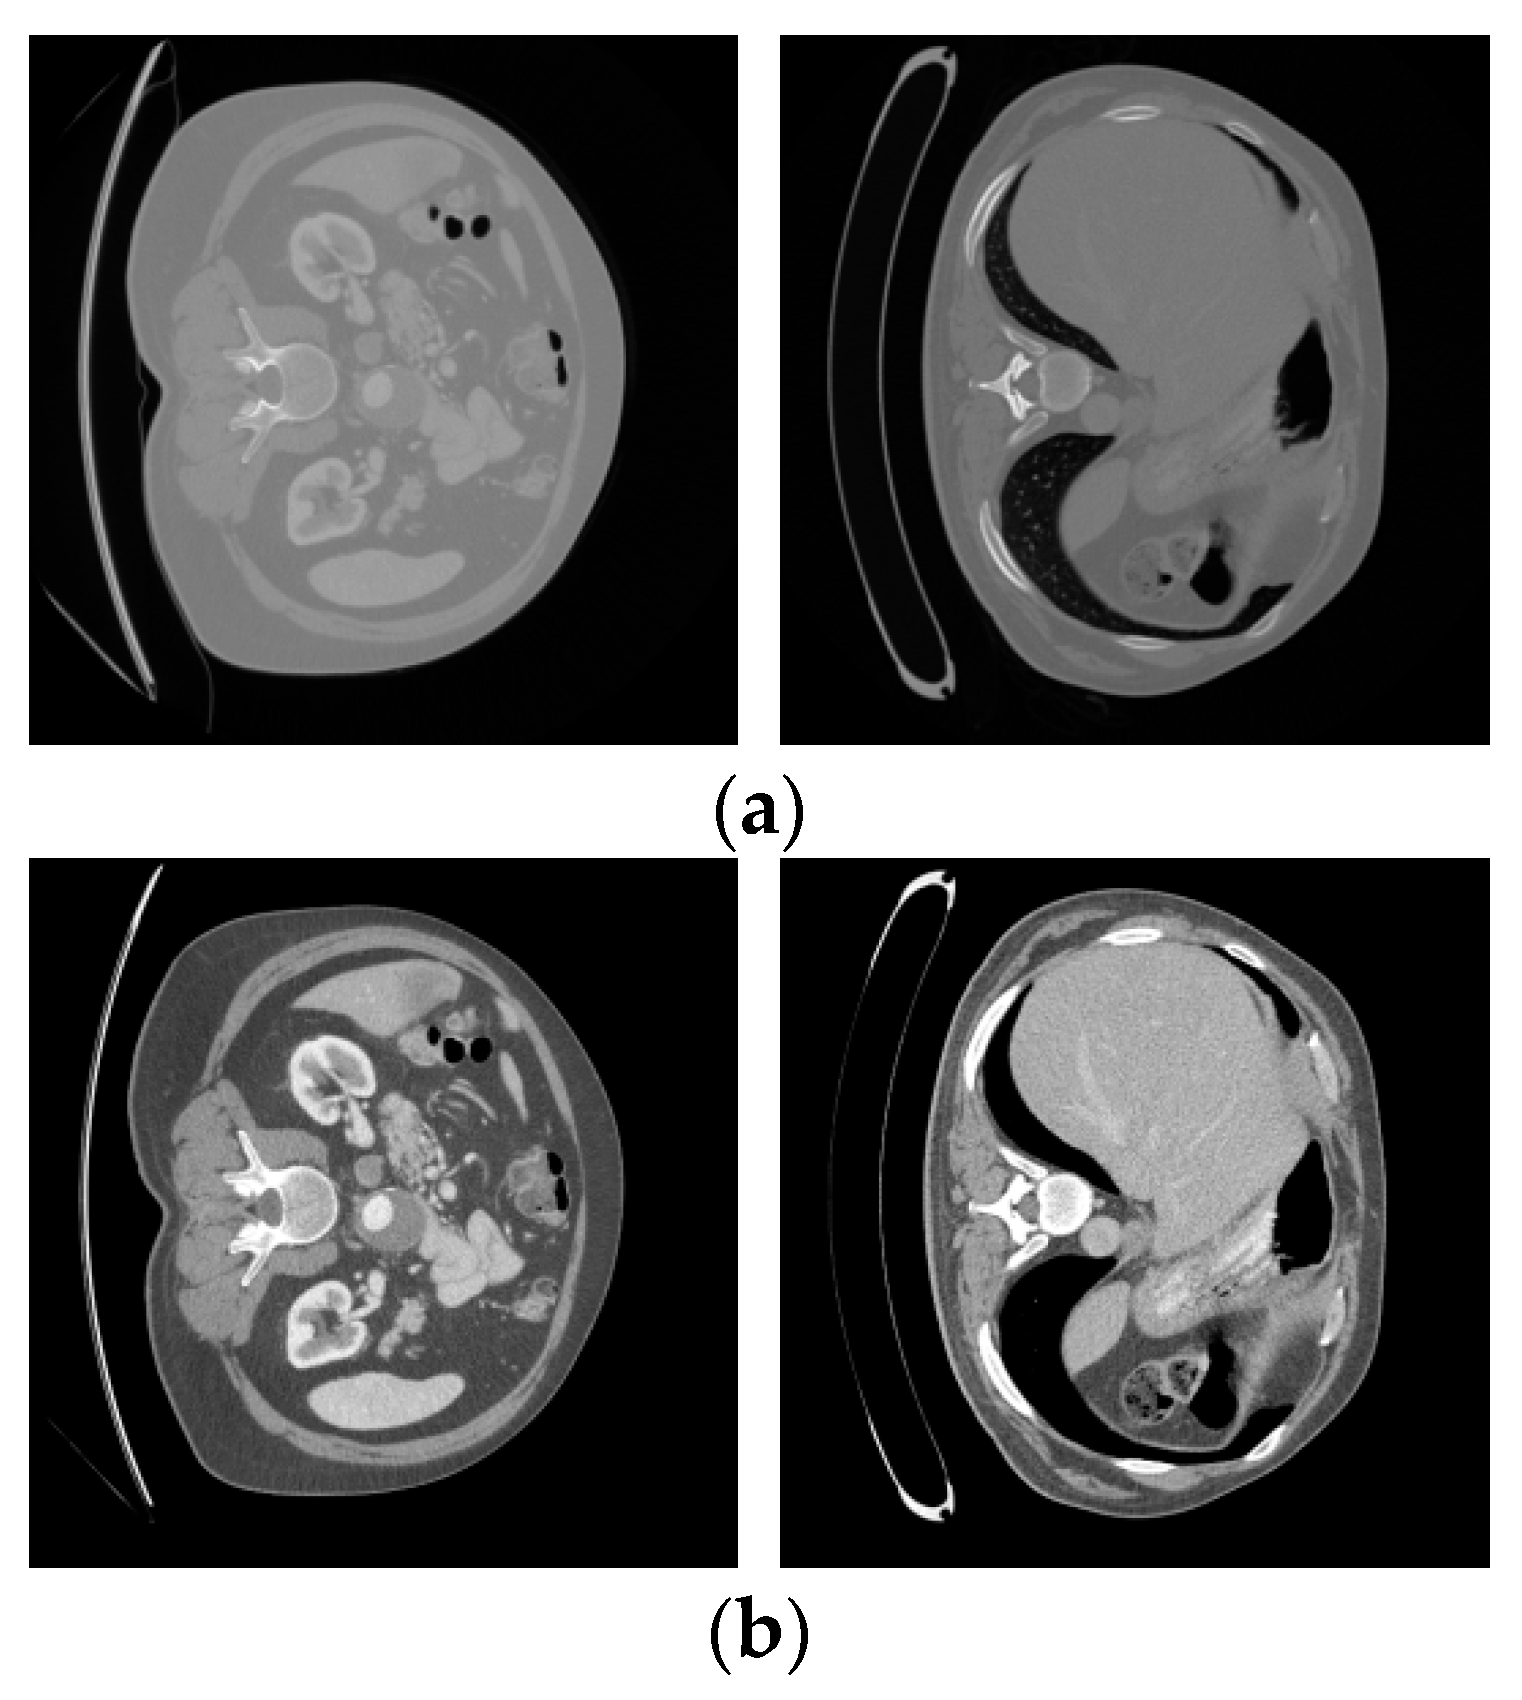
Firstly, the dataset was divided into a training set and a validation set in an 8:2 ratio, resulting in 131 images. These images were then converted into PNG format. By improving the grayscale, contrast, data augmentation, and standardization of the images, the accuracy of the feature extraction can be further enhanced. Table 1 presents the range of CT values for different anatomical regions in the abdominal CT scans. Based on this, we narrowed down the range of CT values to [−250, 250] Hounsfield Units (HU), setting all values outside this range to 0, eliminating many regions unrelated to liver tissue, such as shadows caused by air or water, while preserving the original image.

Table 1.
CT value range distribution of major tissues in abdominal CT.
The results after adjusting the Hounsfield Unit (HU) values are shown in Figure 4. The upper part displays the original LiTS data slices, while the lower part shows the processed results.

Figure 4.
LiTS original slices and preprocessed images. (a) LiTS original slices; (b) preprocessed images.
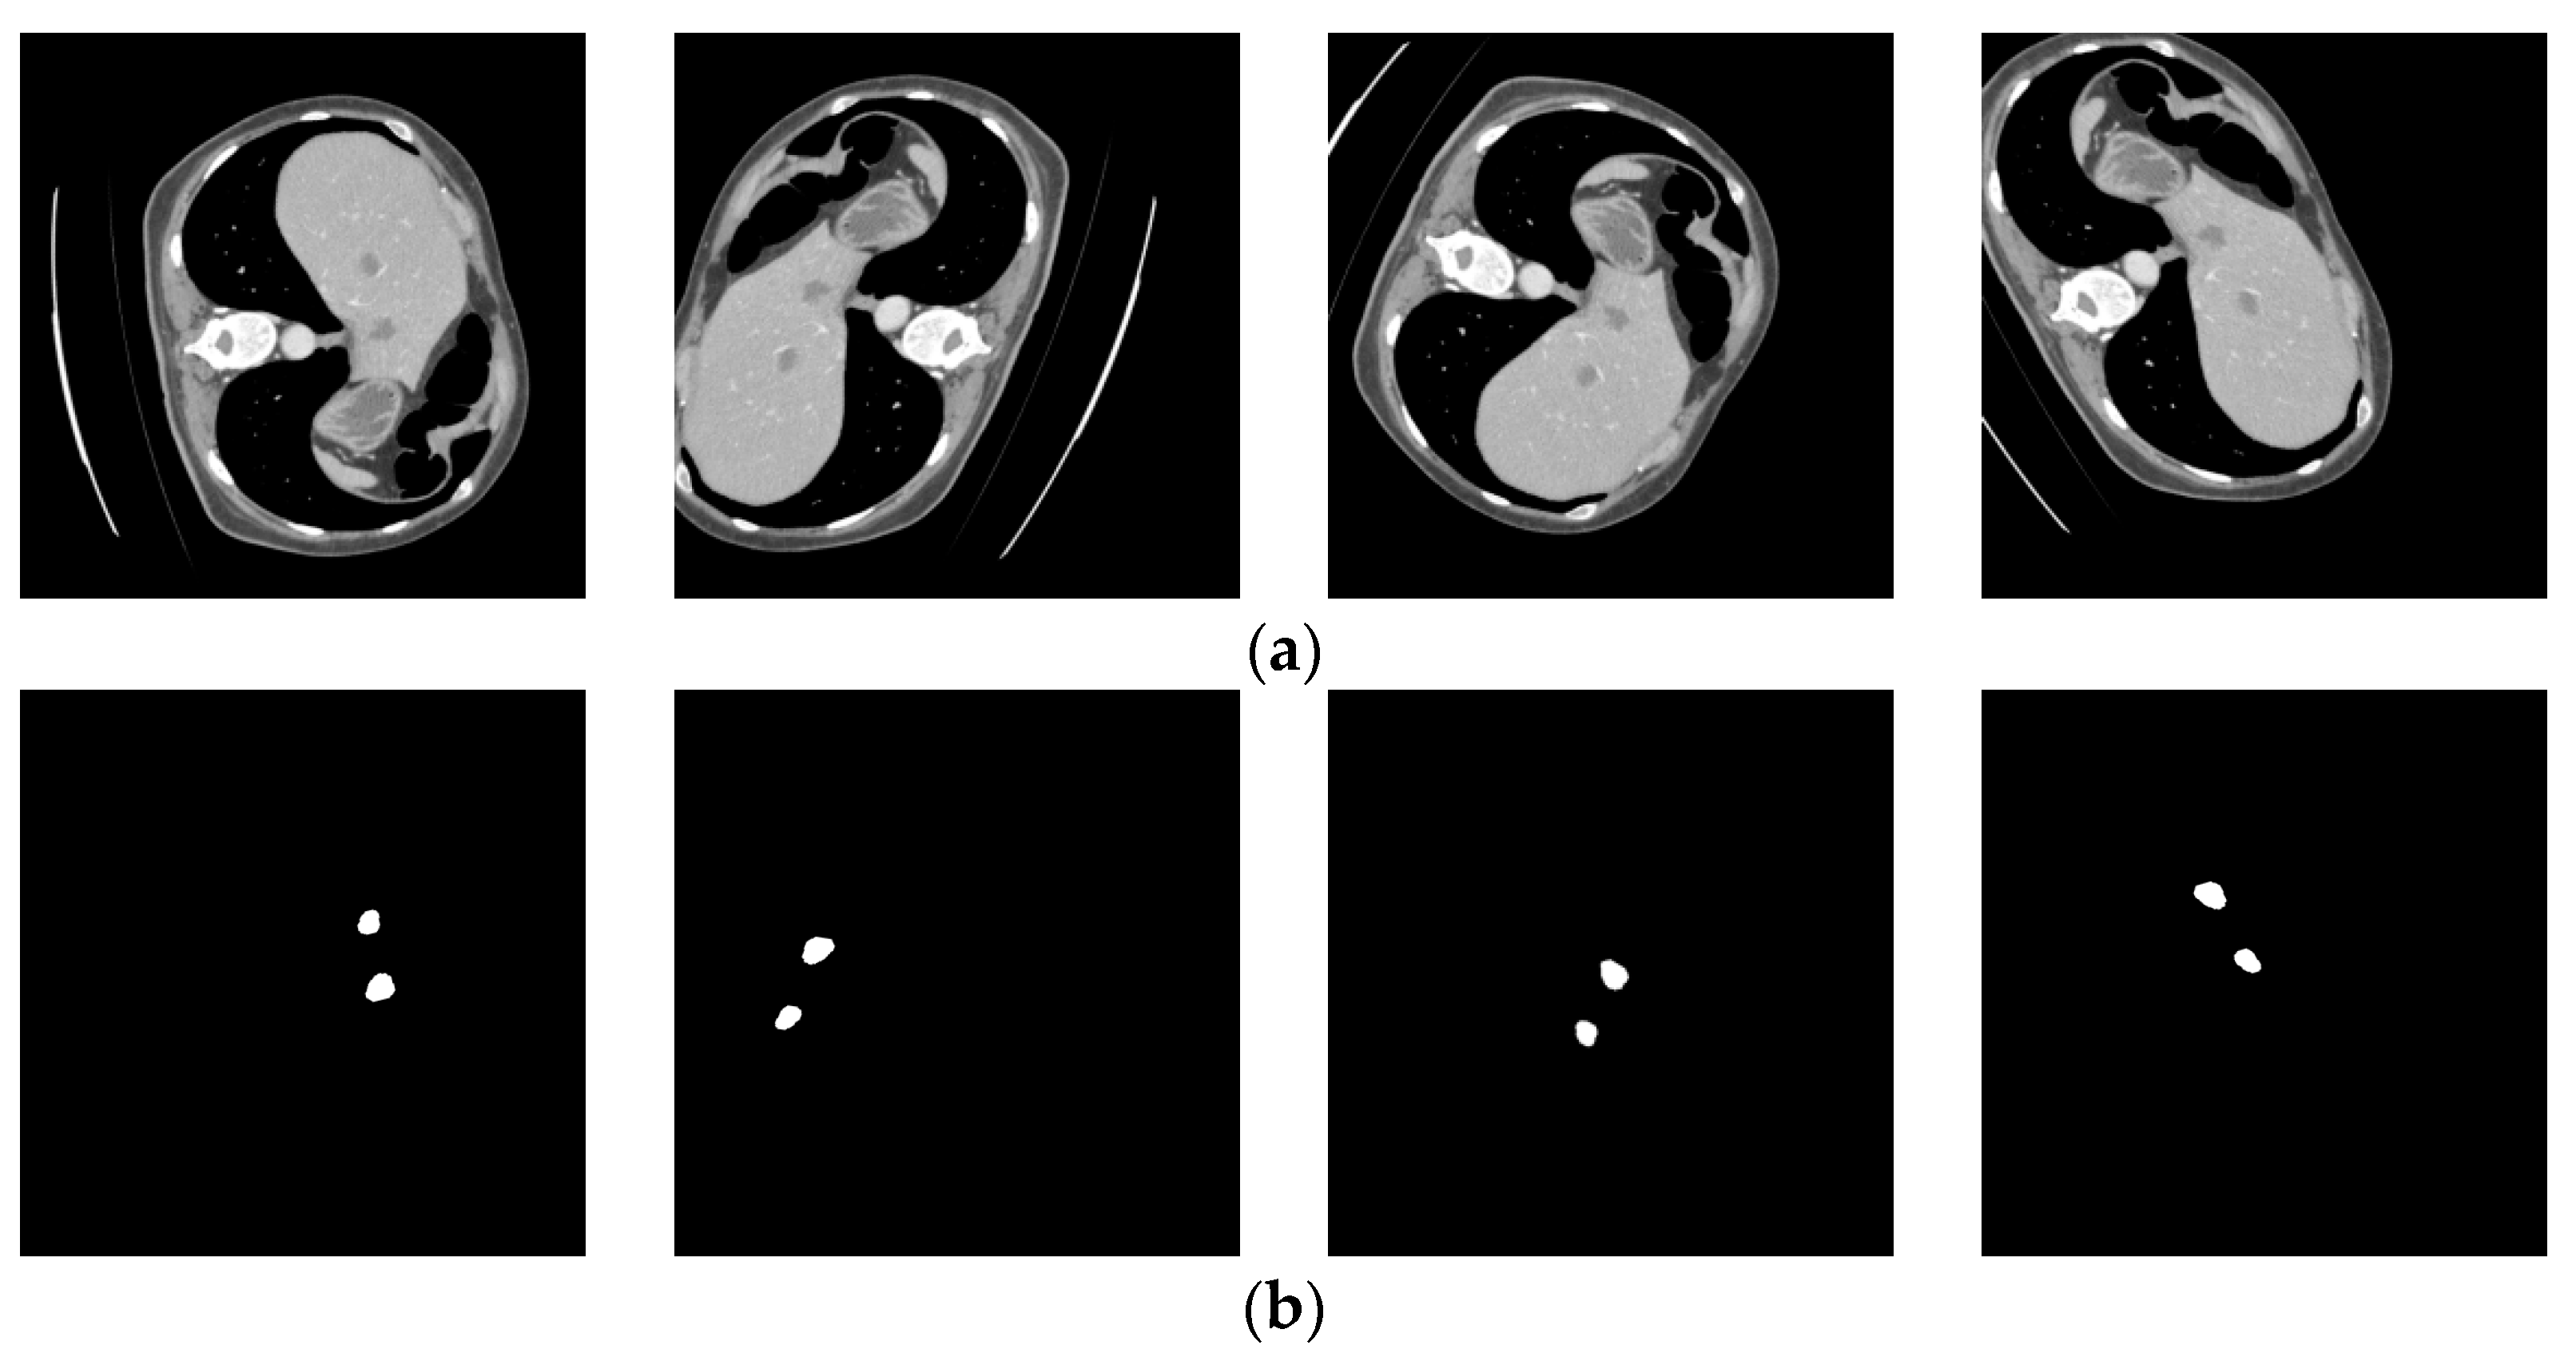
The benefit of data augmentation is that it increases the quantity of training data. Due to the unique nature of CT images, acquiring a large number of CT images is challenging. However, the image features often consist of hundreds or thousands of slices, which are manually delineated by experienced surgeons, making it time-consuming and laborious and posing great difficulties for surgeons. Therefore, obtaining a large number of CT images and image annotations as a training dataset for neural networks is quite challenging. Additionally, the volume of the CT images is relatively small compared to the liver. To enhance the generalization ability of the model and avoid overfitting, this study employed various data augmentation techniques such as rotation, flipping, stretching, and width shifting. The training dataset was expanded through data augmentation, resulting in a final set of 18,181 training images and 1033 testing images, all resized to 512 × 512 pixels. Figure 5 illustrates the geometrically transformed liver cancer data with corresponding annotated images after the data augmentation process.

Figure 5.
Geometrically transformed liver images and corresponding label images. (a) Liver images; (b) labelled images.
5.3. Experiments
After completing the preprocessing of the image data, the 131 image samples were divided into a training set and a validation set in an 8:2 ratio. In the training experiments, a crucial model in Keras, called Keras.callbacks, was used to prevent overfitting. The monitored value selected was “val_loss” and set to minimize. If the monitored value did not continue to decrease, the training was stopped after 20 epochs without improvement. The learning rate was reduced when the evaluation metric no longer improved, with the number of epochs without improvement set to 20 and the learning rate decay rate set to 0.1. The total number of epochs was set to 100, with a batch size of 4. The Adam optimizer was used, and the learning rate followed the Stochastic Gradient Descent (SGD) algorithm.
The model is based on the U-Net architecture and incorporates residual convolutional modules and attention modules. To further validate the performance of our proposed method, experiments were conducted on the same dataset and compared with the current state-of-the-art methods for liver tumor segmentation. We obtained the segmentation results shown in Table 2 for different network configurations.
Table 2.
Comparison with published mainstream methods.
From Table 2, it can be observed that the model showed an overall improvement when the attention modules and multi-scale convolution modules were added, with liver tumor segmentation achieved with a Dice score of over 0.69. Among them, the addition of attention modules alone showed limited improvement, but the highest Dice score was achieved when both the attention and multi-scale convolution modules were added, with a 9.5% improvement compared to the original U-Net. The results of different attention module variants are shown in Table 3, indicating a significant improvement in the model’s performance compared to the baseline U-Net after incorporating the proposed modules.
Table 3.
Denoising experimental results under different attention modules.
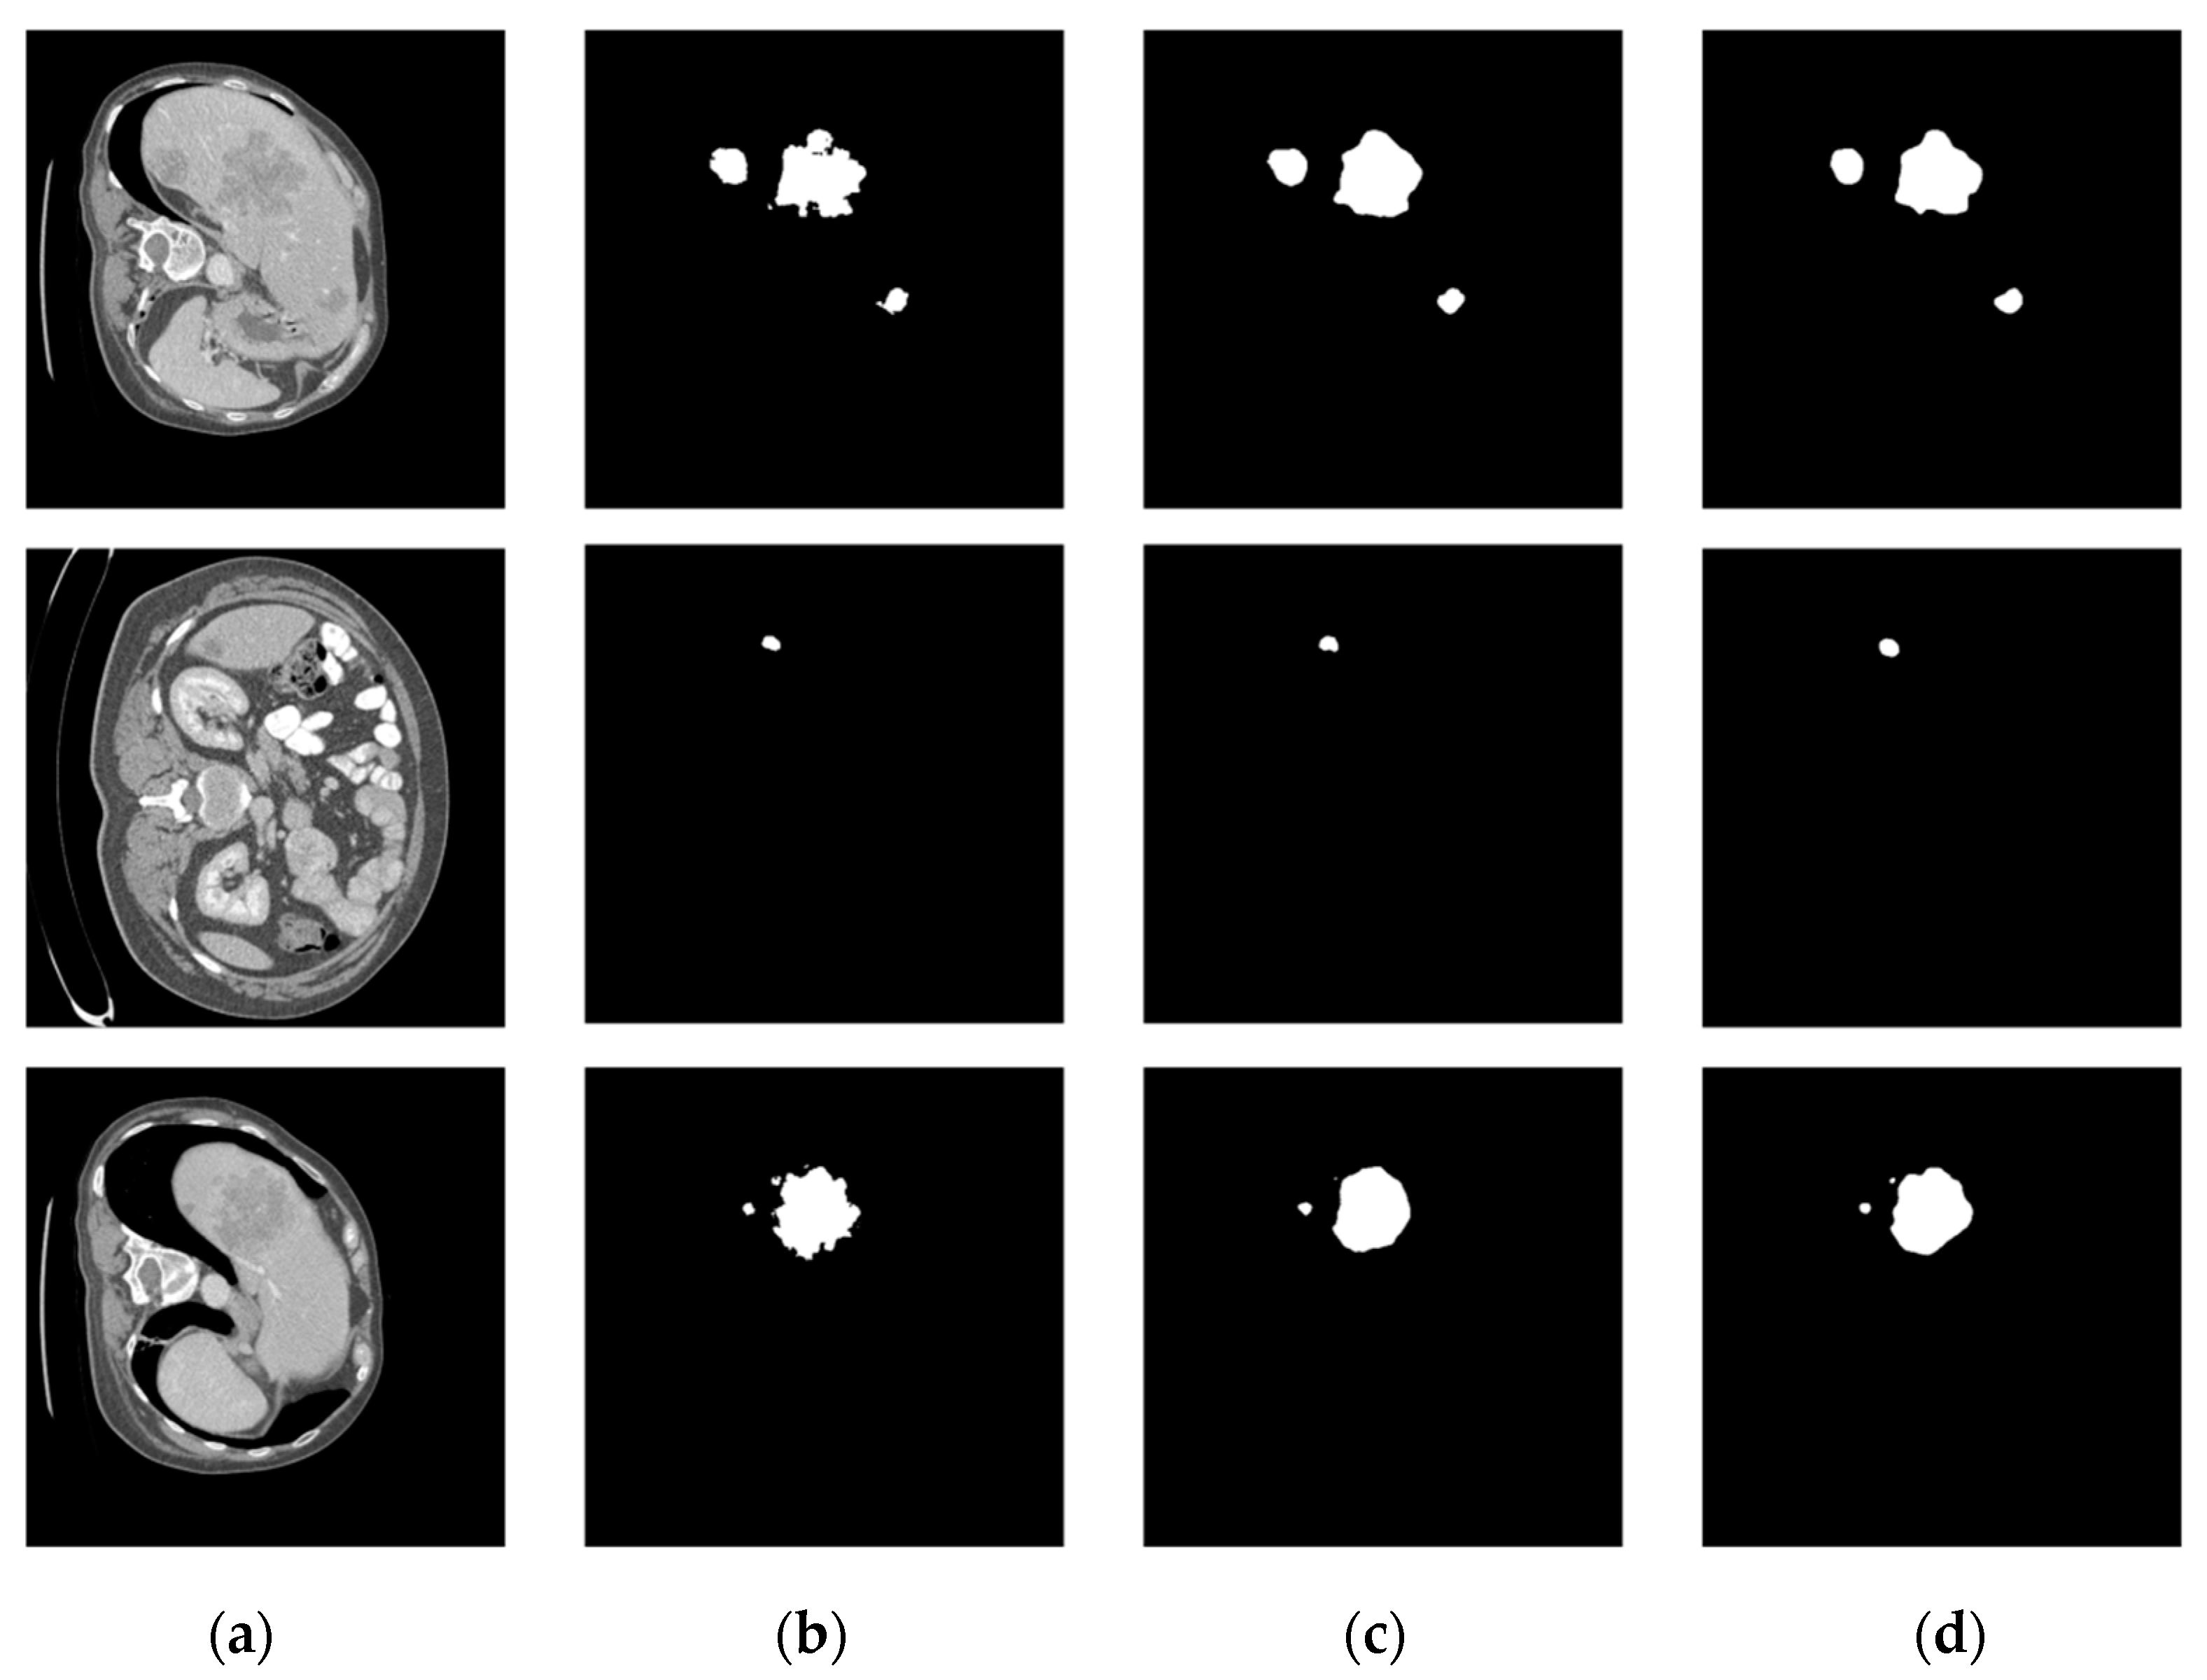
The comparison of the liver tumor segmentation results between the U-Net model and our proposed algorithm is shown in Figure 6. The displayed results were obtained from the same test case data. Both models accurately identified the target for segmentation, but our algorithm achieved better segmentation results by accurately covering a larger area of the true segmentation. From Figure 7, it can be seen that the proposed method achieves segmentation results closer to the ground truth labels compared to other U-Net variants (the last group of data in the figure show that our method has a dice value of 0.925, while the Hy-CompNet and MS-DG methods have dice values of 0.904 and 0.881, respectively). The experimental results demonstrated that our newly proposed attention module effectively captured the spatial information and addressed the semantic gap problem by enhancing the meaningful features and suppressing the irrelevant features. Our algorithm outperformed other models on the LiTS dataset.

Figure 6.
Segmentation results of the LiTS liver tumor dataset. (a) CT Image. (b) Label Image. (c) U-Net. (d) Ours.
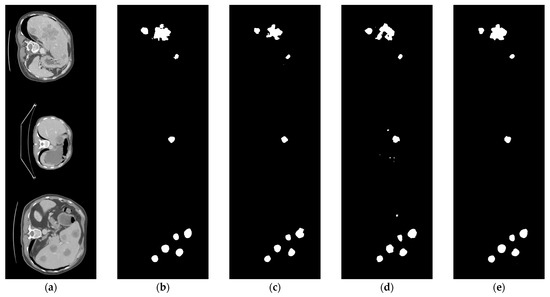
Figure 7.
Segmentation results of LiTS liver tumor dataset using different models. (a) CT Image. (b) Label Image. (c) Hy-CompNet. (d) MS-DG. (e) Ours.
This study primarily focused on addressing issues such as the omission of small objects and unclear boundaries in liver CT images. We proposed an improved liver tumor segmentation method based on the modified U-Net architecture. We designed a novel attention mechanism to enhance the importance of relevant features in the U-shaped neural network. By utilizing residual connections, we reduced the number of parameters in the model and overcame the “vanishing gradient” phenomenon. We evaluated our proposed liver tumor segmentation method using the LiTS dataset to demonstrate its effectiveness.
6. Conclusions
The paper proposes an improved liver tumor image segmentation method based on U-Net. It utilizes a multi-scale convolution module to mitigate the “gradient” phenomenon, enhance computational efficiency, and accelerate model learning. Additionally, a novel attention module was designed to leverage the “focus” feature based on the attention mechanism. By stacking the attention modules, the “focus” functionality is enhanced, reinforcing the weight of important features and overcoming issues of “ignoring” or “unclear” regions. The experimental results demonstrate that the average Dice score of the modified network reaches 0.69, a 9.5% improvement compared to the original U-Net segmentation method. This indicates a significant enhancement in the accuracy of liver segmentation achieved by the improved network model. However, in practical applications, the proposed method in this study has lower segmentation efficiency due to the increase in parameters with the addition of convolution functions in the network. In the future, we aim to reduce the parameter count while ensuring accurate segmentation.
Author Contributions
Conceptualization, formal analysis, and writing—original draft preparation, H.L.; methodology and supervision, B.L. All authors have read and agreed to the published version of the manuscript.
Funding
This research received no external funding.
Institutional Review Board Statement
Not applicable.
Informed Consent Statement
Not applicable.
Data Availability Statement
Not applicable.
Conflicts of Interest
The authors declare no conflict of interest.
References
- Bray, F.; Ferlay, J.; Soerjomataram, I.; Siegel, R.L.; Torre, L.A.; Jemal, A. Global cancer statistics 2018: GLOBOCAN estimates of incidence and mortality worldwide for 36 cancers in 185 countries. CA Cancer J. Clin. 2018, 68, 394–424. [Google Scholar] [CrossRef] [PubMed]
- Bilic, P.; Christ, P.; Li, H.B.; Vorontsov, E.; Ben-Cohen, A.; Kaissis, G.; Szeskin, A.; Jacobs, C.; Mamani, G.E.; Chartrand, G.; et al. The liver tumor segmentation benchmark (lits). Med. Image Anal. 2023, 84, 102680. [Google Scholar] [CrossRef] [PubMed]
- Zheng, Z.; Zhang, X.; Xu, H.; Liang, W.; Zheng, S.; Shi, Y. A Unified Level Set Framework Combining Hybrid Algorithms for Liver and Liver Tumor Segmentation in CT Images. BioMed Res. Int. 2018, 2018, 3815346. [Google Scholar] [CrossRef] [PubMed]
- Anter, A.M.; Hassenian, A.E. CT liver tumor segmentation hybrid approach using neutrosophic sets, fast fuzzy c-means and adaptive watershed algorithm—ScienceDirect. Artif. Intell. Med. 2019, 97, 105–117. [Google Scholar] [CrossRef] [PubMed]
- Zheng, Z.; Zhang, X.; Zheng, S.; Shi, Y. CT liver image segmentation based on regional growth and unified levelset. J. Zhejiang Univ. 2018, 52, 15. [Google Scholar]
- Liu, T.; Liu, J.; Ma, Y.; He, J.; Han, J.; Ding, X.; Chen, C.T. Spatial feature fusion convolutional network for liver and liver tumor segmentation from CT images. Med. Phys. 2021, 48, 264–272. [Google Scholar] [CrossRef]
- Fei, W. Liver Tumor Segmentation Algorithm Based on Improved V-Net Model. Mod. Comput. 2021, 27, 64–70. [Google Scholar]
- Zhou, L.; Wang, L.; Li, W.; Lei, B.; Xu, Z. An automatic liver segmentation method based on optimized tree model. Comput. Eng. 2019, 45, 226–232. [Google Scholar]
- Li, X.; Chen, H.; Qi, X.; Dou, Q.; Fu, C.W.; Heng, P.A. H-DenseUNet: Hybrid Densely Connected UNet for Liver and Tumor Segmentation From CT Volumes. IEEE Trans. Med. Imaging 2018, 37, 2663–2674. [Google Scholar] [CrossRef]
- Song, T.; Meng, F.; Rodriguez-Paton, A.; Li, P.; Zheng, P.; Wang, X. U-Next: A novel convolution neural network with an aggregation U-Net architecture for gallstone segmentation in CT images. IEEE Access 2019, 7, 166823–166832. [Google Scholar] [CrossRef]
- Zhang, Z.; Wu, C.; Coleman, S.; Kerr, D. DENSE-INception U-net for medical image segmentation. Comput. Methods Programs Biomed. 2020, 192, 105395. [Google Scholar] [CrossRef] [PubMed]
- Ronneberger, O.; Fischer, P.; Brox, T. U-Net: Convolutional Networks for Biomedical Image Segmentation; Springer International Publishing: Berlin/Heidelberg, Germany, 2015. [Google Scholar] [CrossRef]
- Han, X. Automatic Liver Lesion Segmentation Using A Deep Convolutional Neural Network Method. Med. Phys. 2017, 44, 1408–1419. [Google Scholar] [CrossRef] [PubMed]
- Huang, G.; Liu, Z.; Van Der Maaten, L.; Weinberger, K.Q. Densely Connected Convolutional Networks. In Proceedings of the IEEE Conference on Computer Vision and Pattern Recognition, Honolulu, HI, USA, 21 July 2017–26 July 2017; pp. 4700–4708. [Google Scholar]
- Zhang, J.P.; Xie, Y.T.; Wu, Q.; Xia, Y. Medical image classification using synergic deep learning. Med. Image Anal. 2019, 54, 10–19. [Google Scholar] [CrossRef] [PubMed]
- Ghoneim, A.; Muhammad, G.; Hossain, M.S. Cervical cancer classification using convolutional neural networks and extreme learning machines. Futur. Gener. Comput. Syst. 2019, 102, 643–649. [Google Scholar] [CrossRef]
- Manjunath, R.V.; Kwadiki, K. Automatic liver and tumour segmentation from CT images using Deep learning algorithm. Results Control. Optim. 2022, 6, 100087. [Google Scholar] [CrossRef]
- Vaswani, A.; Shazeer, N.; Parmar, N.; Uszkoreit, J.; Jones, L.; Gomez, A.N.; Kaiser, Ł.; Polosukhin, I. Attention Is All You Need. arXiv 2017, arXiv:1706.03762. [Google Scholar] [CrossRef]
- Wang, X.; Girshick, R.; Gupta, A.; He, K. Non-local Neural Networks. In Proceedings of the IEEE Conference on Computer Vision and Pattern Recognition, Salt Lake City, UT, USA, 18–23 June 2018; pp. 7794–7803. [Google Scholar]
- Qiao, W.C.; Huang, M.; Liu, L.J.; Huang, Q.S. Feature selection and residual fusion segmentation network for liver tumor. J. Image Graph. 2022, 27, 838–849. [Google Scholar]
- Dosovitskiy, A.; Beyer, L.; Kolesnikov, A.; Weissenborn, D.; Zhai, X.; Unterthiner, T.; Dehghani, M.; Minderer, M.; Heigold, G.; Gelly, S.; et al. An Image is Worth 16 × 16 Words: Transformers for Image Recognition at Scale. arXiv 2020, arXiv:2010.11929. [Google Scholar] [CrossRef]
- Li, L.; Ma, H. RDCTrans U-Net: A Hybrid Variable Architecture for Liver CT Image Segmentation. Sensors 2022, 22, 2452. [Google Scholar] [CrossRef]
- Siddique, N.; Paheding, S.; Elkin, C.P.; Devabhaktuni, V. U-Net and Its Variants for Medical Image Segmentation: A Review of Theory and Applications. IEEE Access 2021, 9, 82031–82057. [Google Scholar] [CrossRef]
- Çiçek, Ö.; Abdulkadir, A.; Lienkamp, S.S.; Brox, T.; Ronneberger, O. 3D U-Net: Learning Dense Volumetric Segmentation from Sparse Annotation; Springer: Cham, Switzerland, 2016. [Google Scholar] [CrossRef]
- Wang, X.; Han, S.; Chen, Y.; Gao, D.; Vasconcelos, N. Volumetric Attention for 3D Medical Image Segmentation and Detection. In Proceedings of the International Conference on Medical Image Computing and Computer-Assisted Intervention, Lima, Peru, 4–8 October 2020. [Google Scholar] [CrossRef]
- Ma, J. Cutting-edge 3D Medical Image Segmentation Methods in 2020: Are Happy Families All Alike? arXiv 2021, arXiv:2101.00232. [Google Scholar] [CrossRef]
- He, K.; Zhang, X.; Ren, S.; Sun, J. Deep residual learning for image recognition. In Proceedings of the IEEE Computer Society Conference on Computer Vision and Pattern Recognition (CVPR), Las Vegas, NV, USA, 27–30 June 2016. [Google Scholar] [CrossRef]
- Hu, J.; Shen, L.; Sun, G. Squeeze-and-Excitation Networks. In Proceedings of the IEEE Conference on Computer Vision and Pattern Recognition (CVPR), Salt Lake City, UT, USA, 18–23 June 2018. [Google Scholar] [CrossRef]
- Dey, R.; Hong, Y. Hybrid cascaded neural network for liverlesion segmentation. In Proceedings of the 17th IEEE International Symposium on Biomedical Imaging(ISBI), Iowa City, IA, USA, 3–7 April 2020; IEEE: New York, NY, USA, 2020; pp. 1173–1177. [Google Scholar]
- Sinha, A.; Dolz, J. Multi-scale self-guided attention for medical image segmentation. IEEE J. Biomed. Health Inform. 2021, 25, 121–130. [Google Scholar] [CrossRef] [PubMed]

Disclaimer/Publisher’s Note: The statements, opinions and data contained in all publications are solely those of the individual author(s) and contributor(s) and not of MDPI and/or the editor(s). MDPI and/or the editor(s) disclaim responsibility for any injury to people or property resulting from any ideas, methods, instructions or products referred to in the content. |
© 2023 by the authors. Licensee MDPI, Basel, Switzerland. This article is an open access article distributed under the terms and conditions of the Creative Commons Attribution (CC BY) license (https://creativecommons.org/licenses/by/4.0/).