Article

Development of an IoT-Based SCADA System for Monitoring of Plant Leaf Temperature and Air and Soil Parameters

by
Aryuanto Soetedjo
1,* and
Evy Hendriarianti
2
1
Department of Electrical Engineering, National Institute of Technology (ITN), Malang 65145, Indonesia
2
Department of Environmental Engineering, National Institute of Technology (ITN), Malang 65145, Indonesia
*
Author to whom correspondence should be addressed.
Appl. Sci. 2023, 13(20), 11294; https://doi.org/10.3390/app132011294
Submission received: 4 September 2023 / Revised: 24 September 2023 / Accepted: 12 October 2023 / Published: 14 October 2023

Abstract

:
Plant leaf temperature and its environmental parameters provide valuable information on plant growth. This paper presents the development of a plant monitoring system using an IoT-based SCADA (Supervisory Control and Data Acquisition). The developed SCADA system monitors the leaf temperature and the air parameters of temperature and humidity, as well as the soil parameters of temperature, moisture, pH, electrical conductivity, nitrogen, phosphorous, and potassium. A novel method is proposed for measuring the leaf temperature using a low-cost 8 × 8 array thermal camera. The sensor systems in the field are developed to wirelessly communicate with the Hawell IoT Cloud HMI via a Modbus TCP protocol. To visualize the thermal image on the HMI dashboard, a novel approach is proposed wherein the data are transferred using the Modbus TCP protocol. The HMI is connected to a cloud server and can be accessed by the users using the web browser or mobile application on a smartphone. The experimental results show that the proposed hardware, software, and communication protocol are reliable for real-time and continuous plant monitoring. Further, the evaluation of sensor data shows that the data from the thermal camera and air parameters sensor can be independently interpreted. However, the data from the soil sensor should be interpreted in consideration of the other parameters.

1. Introduction

Recently, research on the Internet of Things (IoT) applications in agriculture has significantly increased [1,2,3,4]. IoT-based agriculture can be categorized into [1]: smart irrigation, soil monitoring, nutrient management, precision farming, smart livestock management, crop monitoring, and farm produce storage. In smart irrigation, intelligent systems are developed for providing sufficient water to crops while minimizing water waste. These processes can be remotely monitored and controlled via the IoT. In soil monitoring, IoT sensors measure soil parameters such as pH, soil moisture, and nutrients. In nutrient management, usage of the soil nutrients nitrogen, phosphorus, and potassium (NPK) is controlled such that an appropriate dosage is provided in consideration of the economic and environmental costs. The IoT collects and analyzes data in precision farming to increase efficiency and productivity. Multi-sensors monitor a cow’s body temperature and movement in smart livestock management. Data analysis is then performed to maximize milk production. In crop monitoring, the IoT sensors can detect plant diseases. In farm produce storage, the temperature and humidity of storage units are monitored by sensors placed within.
This work deals with some of the previously described categories, namely monitoring of plant leaf temperature and environmental parameters. Both leaf temperature and environmental parameters (air and soil) are essential for plant growth. Leaf temperature is indicative of the photosynthesis rate, leaf water loss, and stomatal conductance of a plant [5]. Leaf temperature can be measured using invasive and non-invasive sensors [6]. Since invasive sensors are impractical, a non-invasive method, such as using thermal cameras, is preferred [7,8,9,10,11,12,13]. A FLIR Vue Pro R thermal camera was used to measure the grapevine’s leaf temperature for calculating the crop water stress index (CWSI) [7]. The system added an RGB camera to capture the visible image, in which the image processing technique was employed to extract the leaf area. Then, the average temperature measured by the thermal camera was computed in the leaf area to calculate the CWSI. In [8], a FLIR P660 thermal camera was used for measuring the strawberry leaf surface temperature to define the temperature difference with the ambient air temperature in the night frost conditions. In [9], the FLIR C2 thermal camera was used to measure the leaf temperature of the cowpea plant. The temperature of the centric trifoliate leaf was extracted using the camera software to create the datasets. The datasets were compared with the data from the leaf porometer sensor to measure the leaf stomatal conductance.
The thermal cameras in [7,8,9] are standalone or hand-held thermal cameras that are suitable for offline leaf temperature measurement, where the thermal images taken by the cameras are processed using a personal computer in an offline manner. The embedded thermal cameras are suitable for online leaf temperature monitoring, where the cameras are interfaced with the embedded processing for data collecting and processing. In [10], an embedded thermal camera FLIR Lepton 3.5 combined with the RGB camera was used to measure the canopy temperature of almond trees. Both cameras were connected to a Raspberry Pi module, which performed the image segmentation of the RGB image to find the leaf area and calculate the leaf temperature from the corresponding pixels in the thermal camera. The thermopile array was used to measure the leaf temperature of tomato plants in a smart greenhouse [12]. The leaf temperature was used to control the windows and heating of the smart greenhouse for minimizing the crop temperature stress. In [13], a low-cost MLX90620 thermal camera was used to measure the olive tree canopy temperature for estimating the water status. The thermal camera was connected to an Arduino Mega, which processed and displayed the temperature.
The most common parameters in air monitoring are ambient temperature and humidity [14,15,16,17,18,19,20,21,22,23]. The air temperature and humidity are essential factors in the plant growth. The air temperature and humidity can be used to indicate the watering status in the farm automation system [1,19]. The plant cannot grow when the air temperature and humidity are not in the specific range. For instance, the range of air temperature and humidity of the onion plant are 25–32 °C and 50–70%, respectively [15]. The plant may die in extreme air temperature and humidity conditions [22]. Several works have considered other additional parameters such as gas pressure, hydrogen (H2), liquid petroleum gas (LPG), methane (CH4), carbon monoxide (CO), alcohol, smoke [17], carbon dioxide (CO2) [18,22], light [21,22]. The high concentration of the gases in the air may affect the photosynthesis of the plants [18,22]. The work in [21] showed that the supplementary LED’s lighting affects the rocket plant’s growth.
In soil monitoring, the most common parameters are soil moisture [14,15,16,18,19,20,22,24,25,26], temperature [16,18,20,22,23], pH [20,24,26], nitrogen, phosphorus, and potassium/kalium (NPK) [23,24,25,26,27,28], and electrical conductivity (EC) [26]. The soil moisture represents the water content in the soil. It can be used to manage the watering system of the plant. The soil moisture affects plant growth, leaf health, and photosynthesis process, and indicates the occurrence of plant diseases [16]. The work in [16] also showed that the soil temperature affects grapevine growth, where temperature should be 9 to 50 °C. The soil pH represents the soil acidity and alkalinity. The typical value is between 5.5 and 7.5. The violation of this range affects plant health and ant leaf discoloration [1]. The concentration of NPK indicates the soil fertility. The NPK are the essential nutrients for plant growth [1,24,26]. The information on NPK can be used to control fertilizer usage in the soil. The EC represents the soil dielectric constant related to soil moisture [26].
The sensors for measuring the above parameters are easily interfaced with popular embedded processors such as Arduino or Raspberry Pi and thus suitable for IoT-based monitoring systems. The literature survey of the existing plant monitoring systems described above is summarized in Table 1, where the monitored parameters, sensor hardware, and IoT implementation are shown.
Supervisory Control and Data Acquisition (SCADA) is a well-known and established technology in remote monitoring systems. SCADA is a technology for controlling and monitoring remote devices. The SCADA system consists of remote terminal units (RTUs), a master terminal unit (MTU), and a human–machine interface (HMI). The RTU is a microcontroller system connected to field devices such as sensors and actuators. The RTUs communicate with the MTU via a communication network using a specific communication protocol. The MTU is a central unit of the SCADA system that processes and displays to the HMI for easy monitoring and control by the operator. The human–machine interface (HMI) is a valuable feature of the SCADA system that provides a user or operator with an informative display when monitoring the plant [29]. It is common for the developer to utilize the SCADA software bundled with the HMI designer tools for developing the SCADA user interface, due its easy and fast development.
SCADA architecture has evolved from the monolithic, distributed, networked, and IoT-based SCADA system [30,31]. In the monolithic SCADA, the RTUs connect to the MTU via a wide area network (WAN) with a proprietary network protocol. The system is standalone and cannot be accessed by anyone. In the distributed SCADA, the RTUs connect to a communication server using WAN with a proprietary network protocol. The data are then distributed to the operation stations via a local area network (LAN). In the networked SCADA, open protocols are offered the using the internet protocol (IP). In the system, the SCADA MTU communicates with the networked RTUs using the IP via WAN. The IoT-based SCADA integrates SCADA with the IoT and cloud environment, which offers more flexibility, scalability, and efficiency. There are two approaches to move to the IoT-based SCADA system [32]. The first approach involves developing the system from scratch, where the SCADA is designed based on the IoT or cloud technology. The second approach involves migrating the existing SCADA system to the cloud or other IoT-compatible element.
The recent applications of IoT-based SCADA cover many areas, such as plant monitoring [17], electricity [33,34], electric power plants [35,36,37,38], industrial applications [39], wastewater treatment plant [40], telecommunication system [41], traffic control [42], education [43], oil production [44], and Smarthome [45]. The literature survey of the IoT-based SCADA systems is summarized in Table 2, where the field of application, RTU hardware, protocol, and MTU software and hardware are shown.
As listed in Table 1, most IoT-based plant monitoring systems use air and soil parameters as the monitored parameters. There are no IoT systems dealing with leaf temperature monitoring, especially those that employ thermal cameras. Table 2 shows that most IoT-based SCADA systems are developed from scratch using a Raspberry embedded system as the MTU hardware and popular IoT platforms such as ThingsBoard, Node-Red, and Thinger.IO. The IoT-based SCADA in [46] is used for migration of the existing SCADA, an open source SCADA called EclipseSCADA, to the cloud. From Table 1 and Table 2, it can be seen that the application of SCADA (IoT-based SCADA) for plant monitoring is rare. Most works are implemented using the common IoT platforms or developing web applications for these. The drawbacks of these approaches are that (a) compared with the SCADA HMI, the display in the dashboard of the typical IoT platform is usually limited in appearance; (b) developing a custom dashboard requires a specialist web programmer.
The previous discussions motivated us to develop an IoT-based SCADA for use in a plant monitoring system, where the main objectives are to provide a low-cost instrument, easy and fast development, and multi-parameter measurements. The main contributions of our proposed systems are as follows:
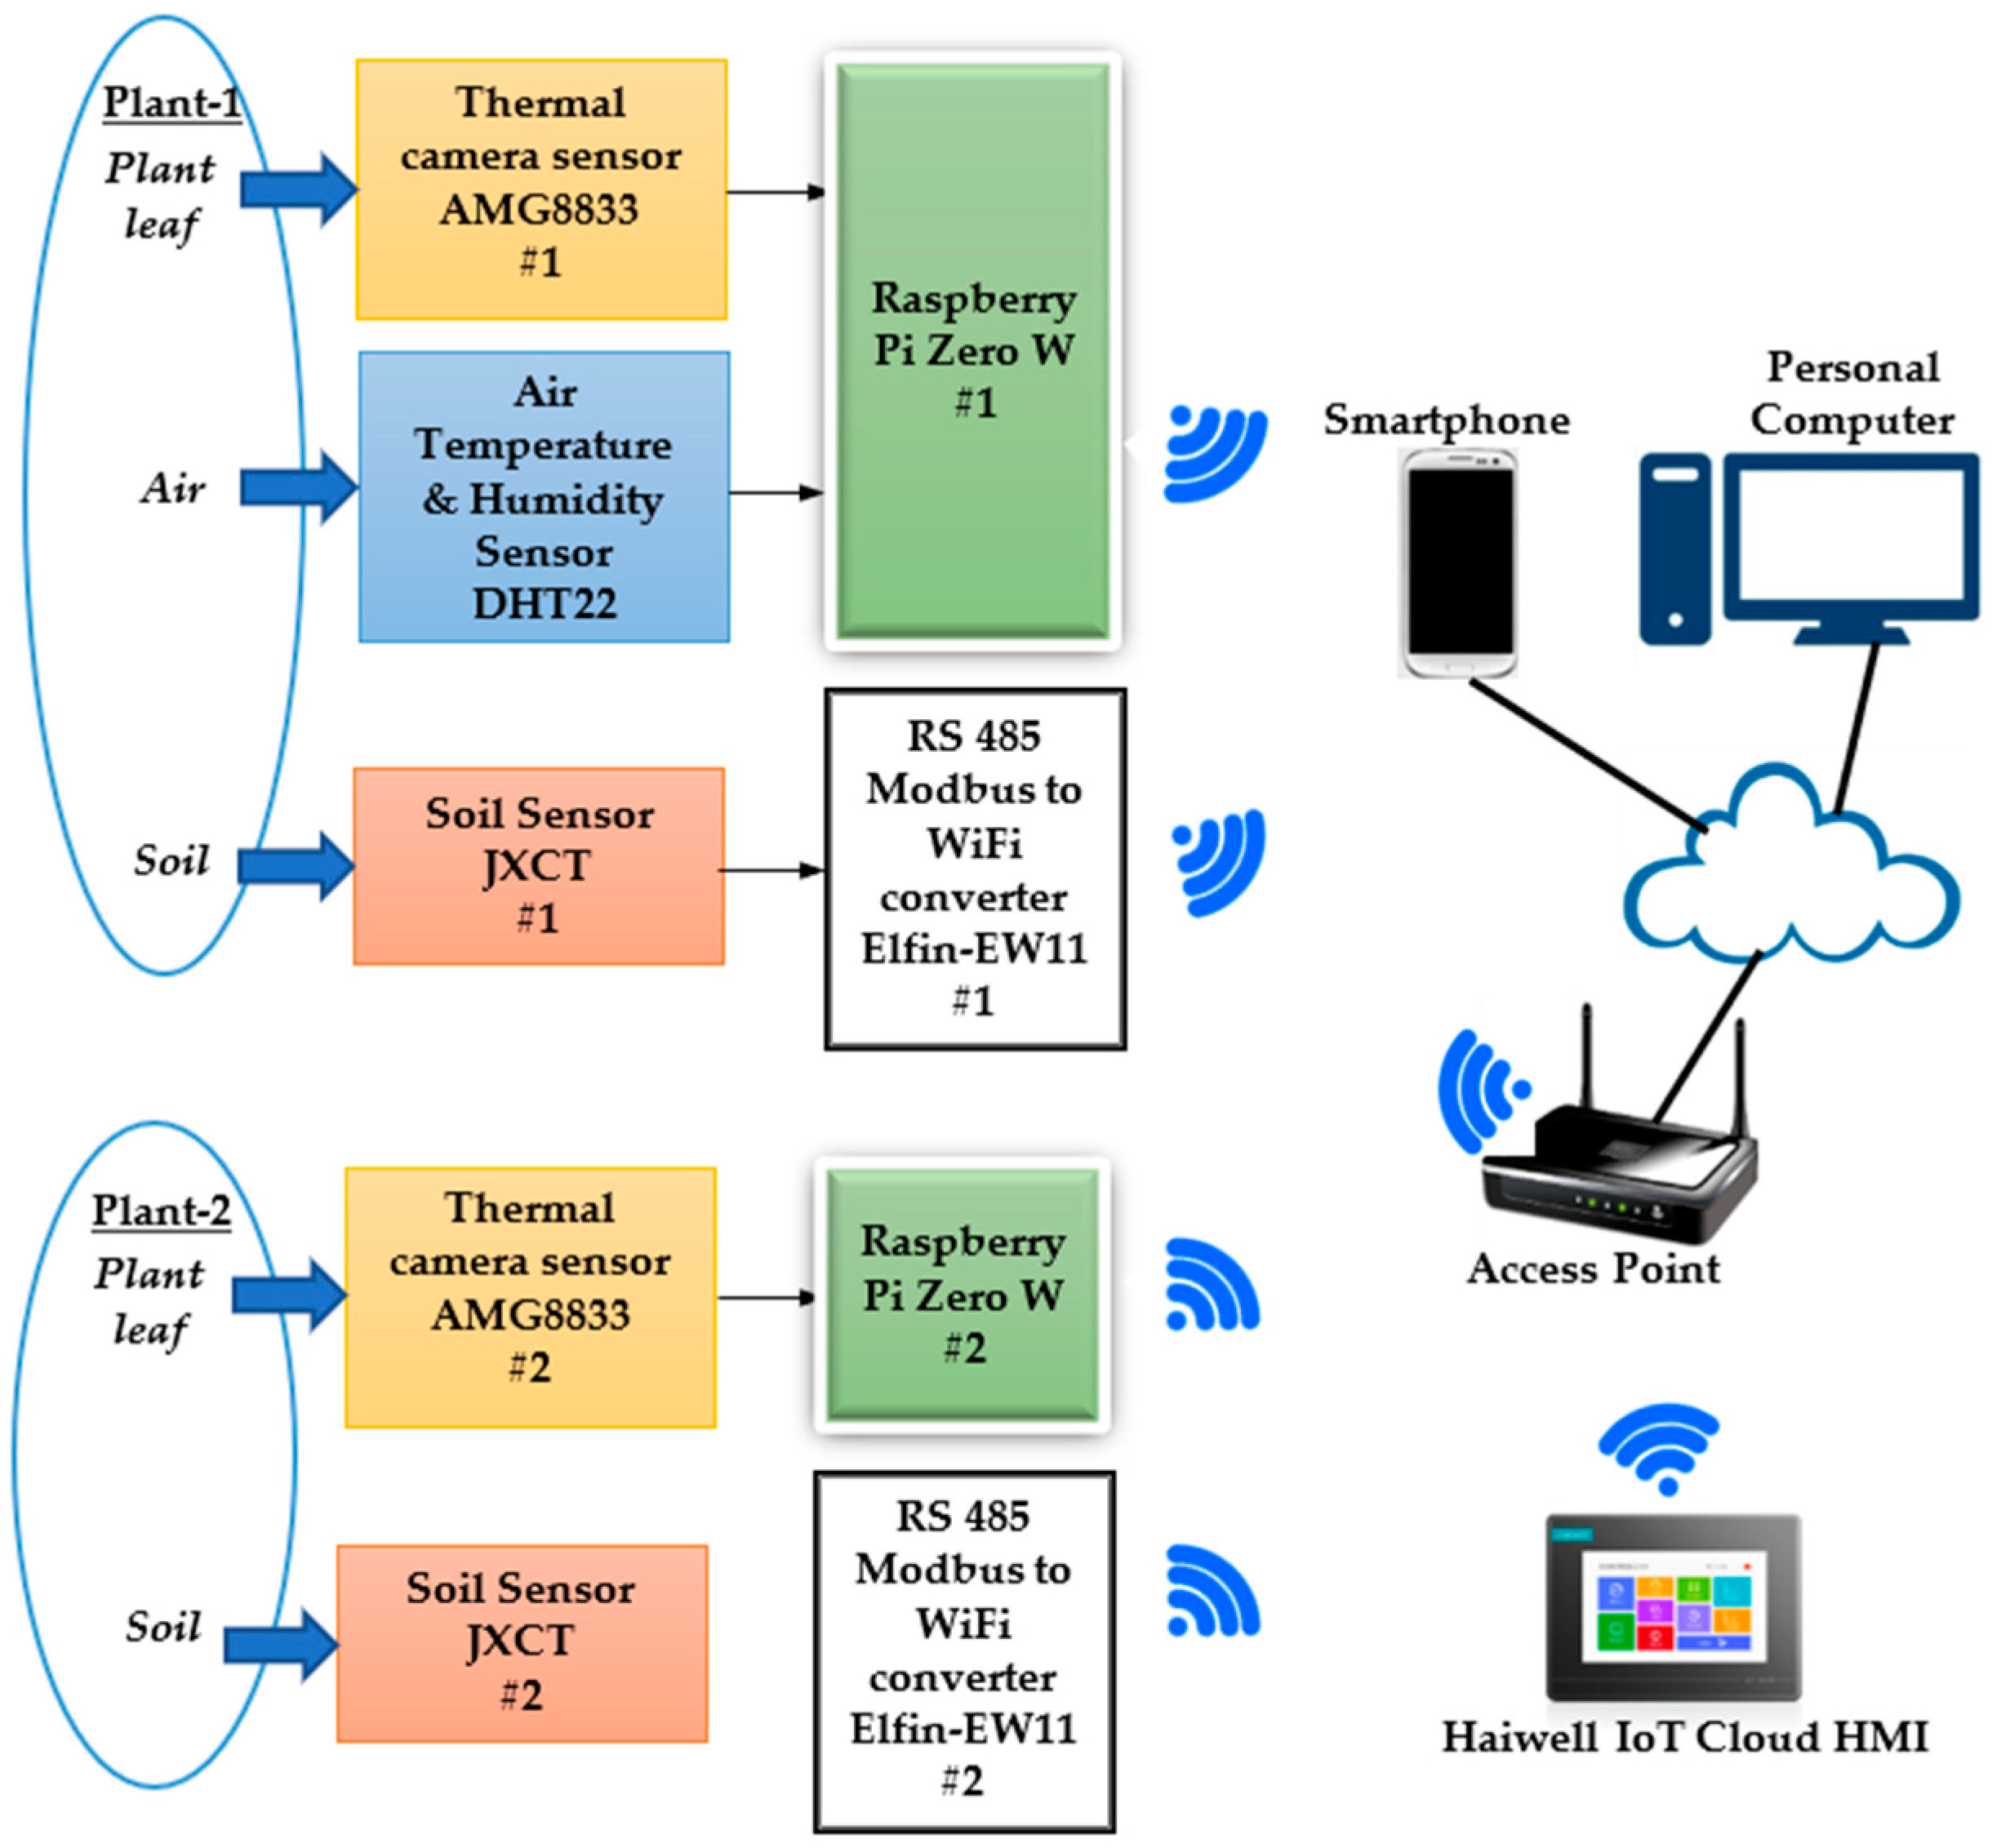
  • Our proposed system uses a low-cost IoT-based SCADA system produced by Xiamen Haiwell Technology [48]. We use the Haiwell IoT Cloud HMI, a small-sized SCADA server equipped with an HMI display that is remotely accessible via the Haiwell cloud.
  • The monitored parameters combine the leaf temperature, air, and soil parameters. Since our proposed system provides more parameters than the existing works in Table 1, the plant condition can be analyzed in more detail.
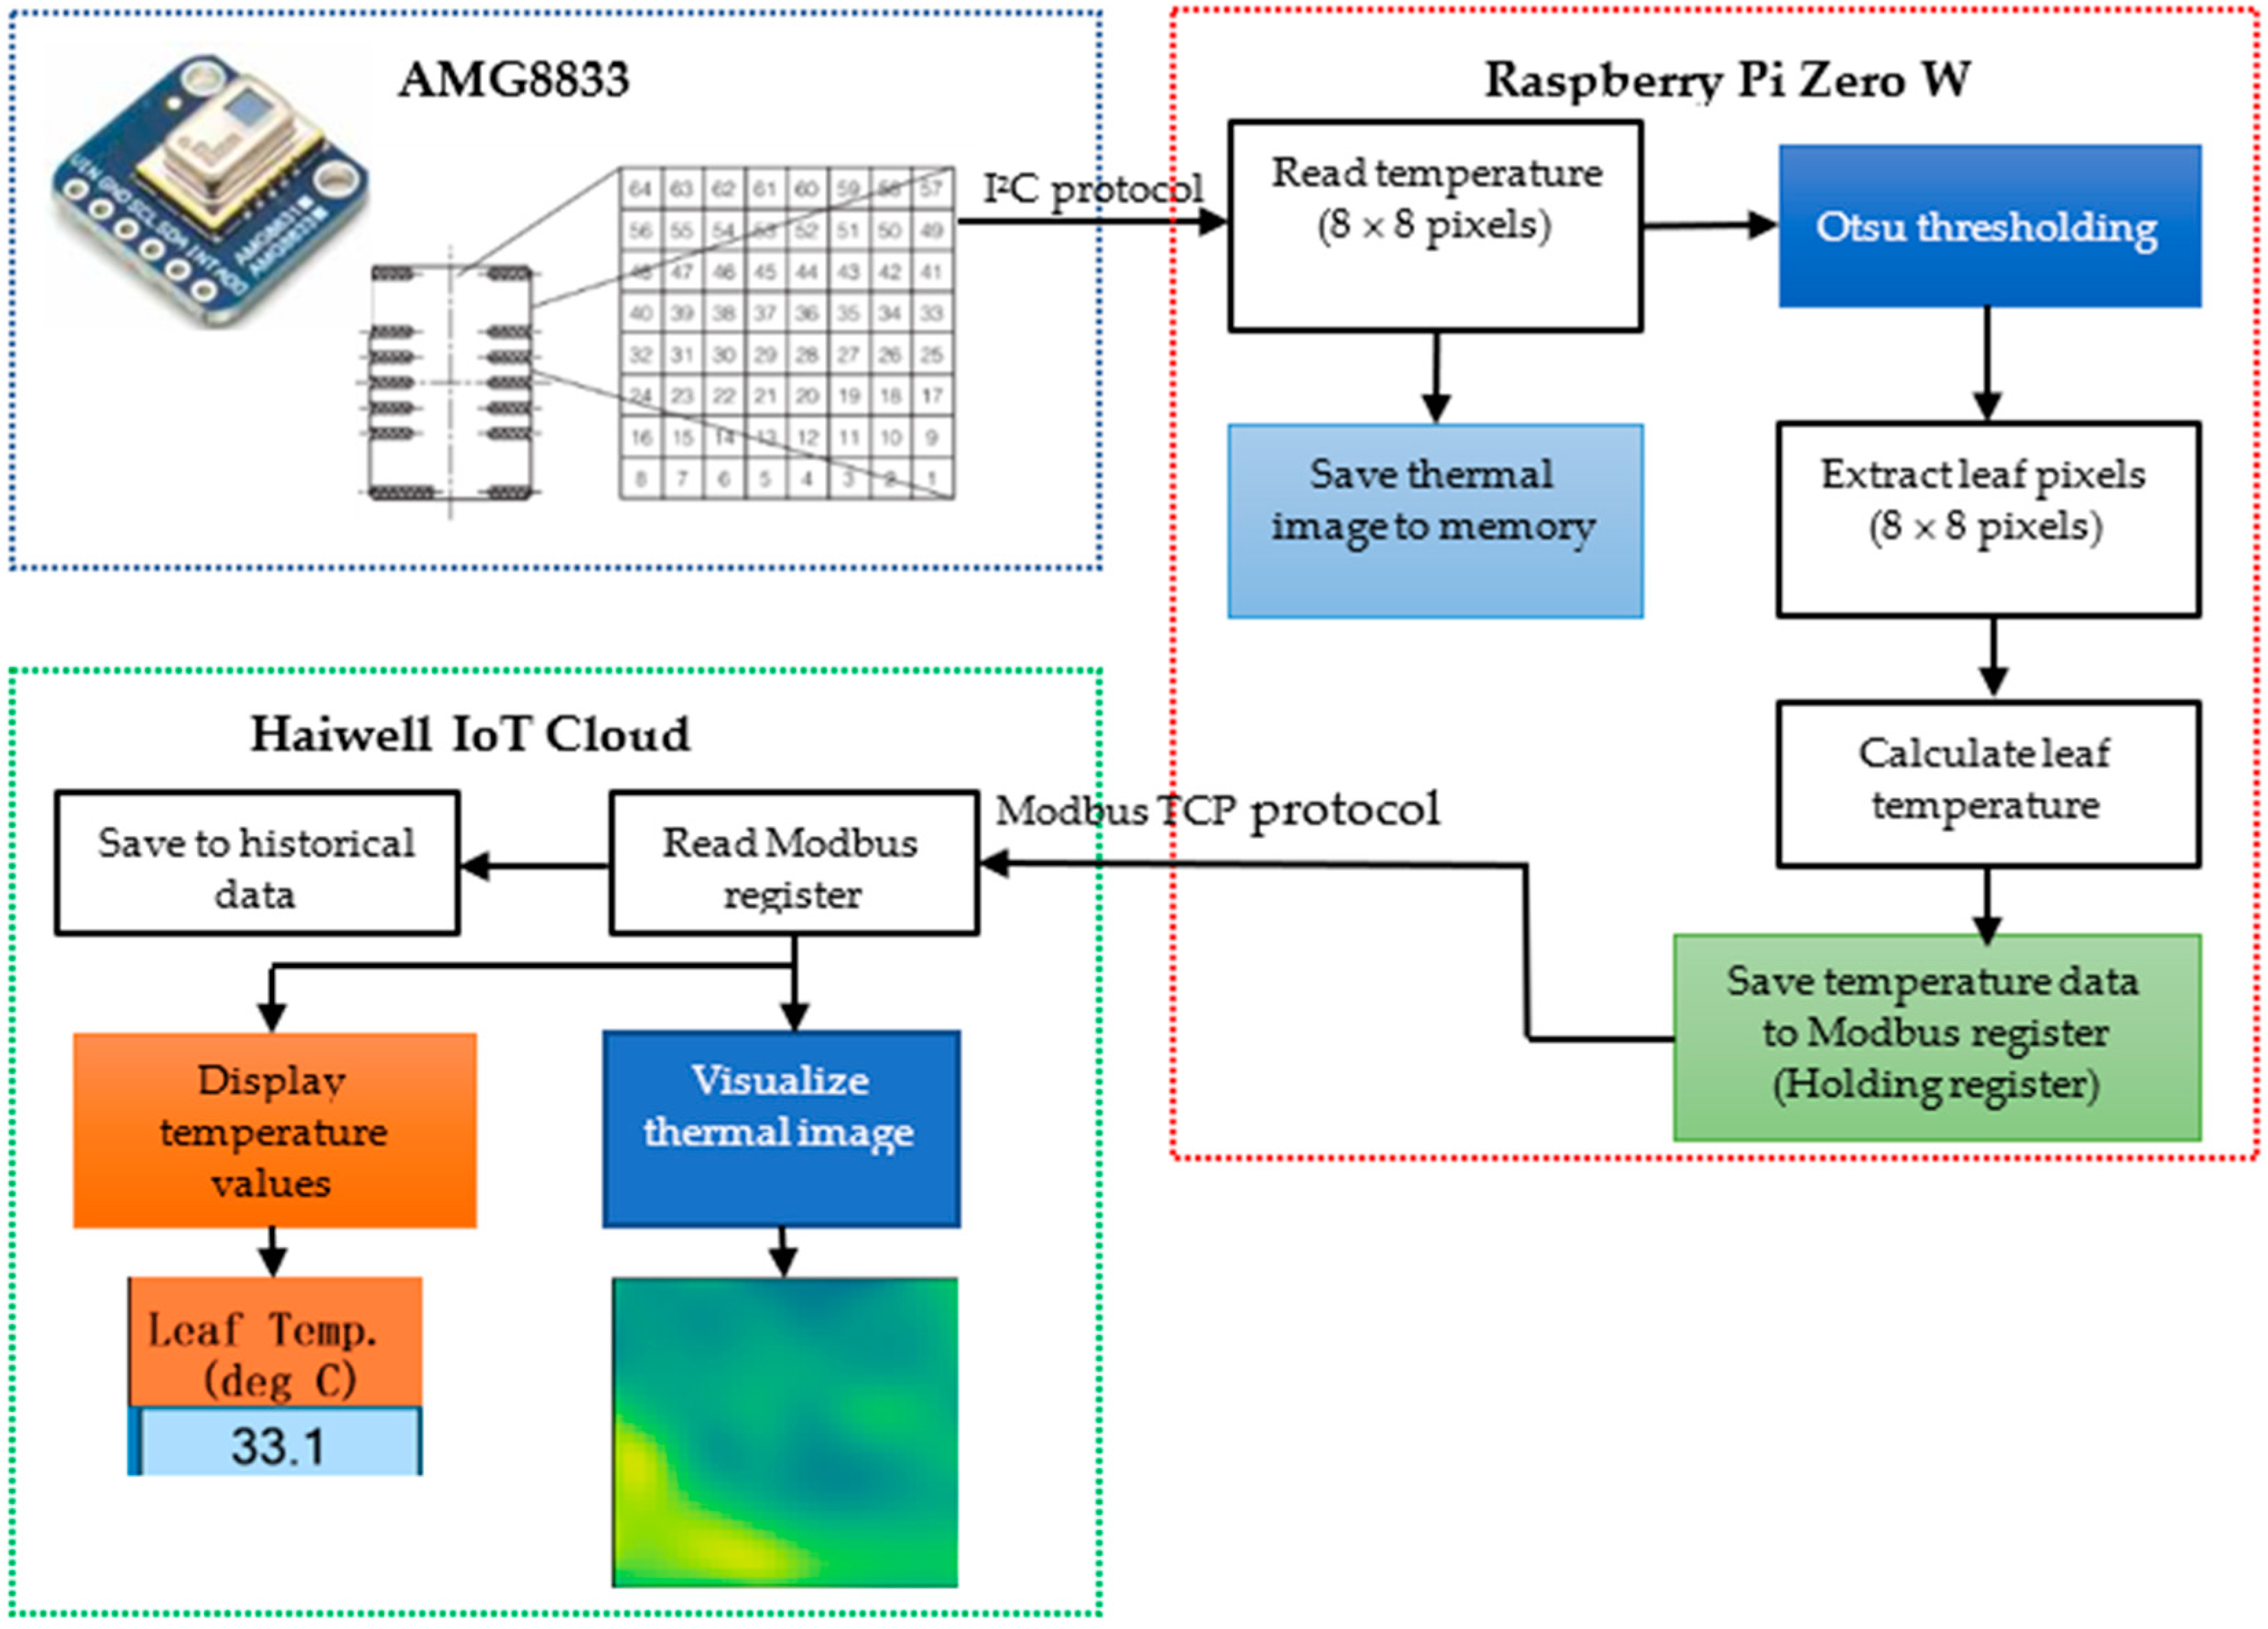
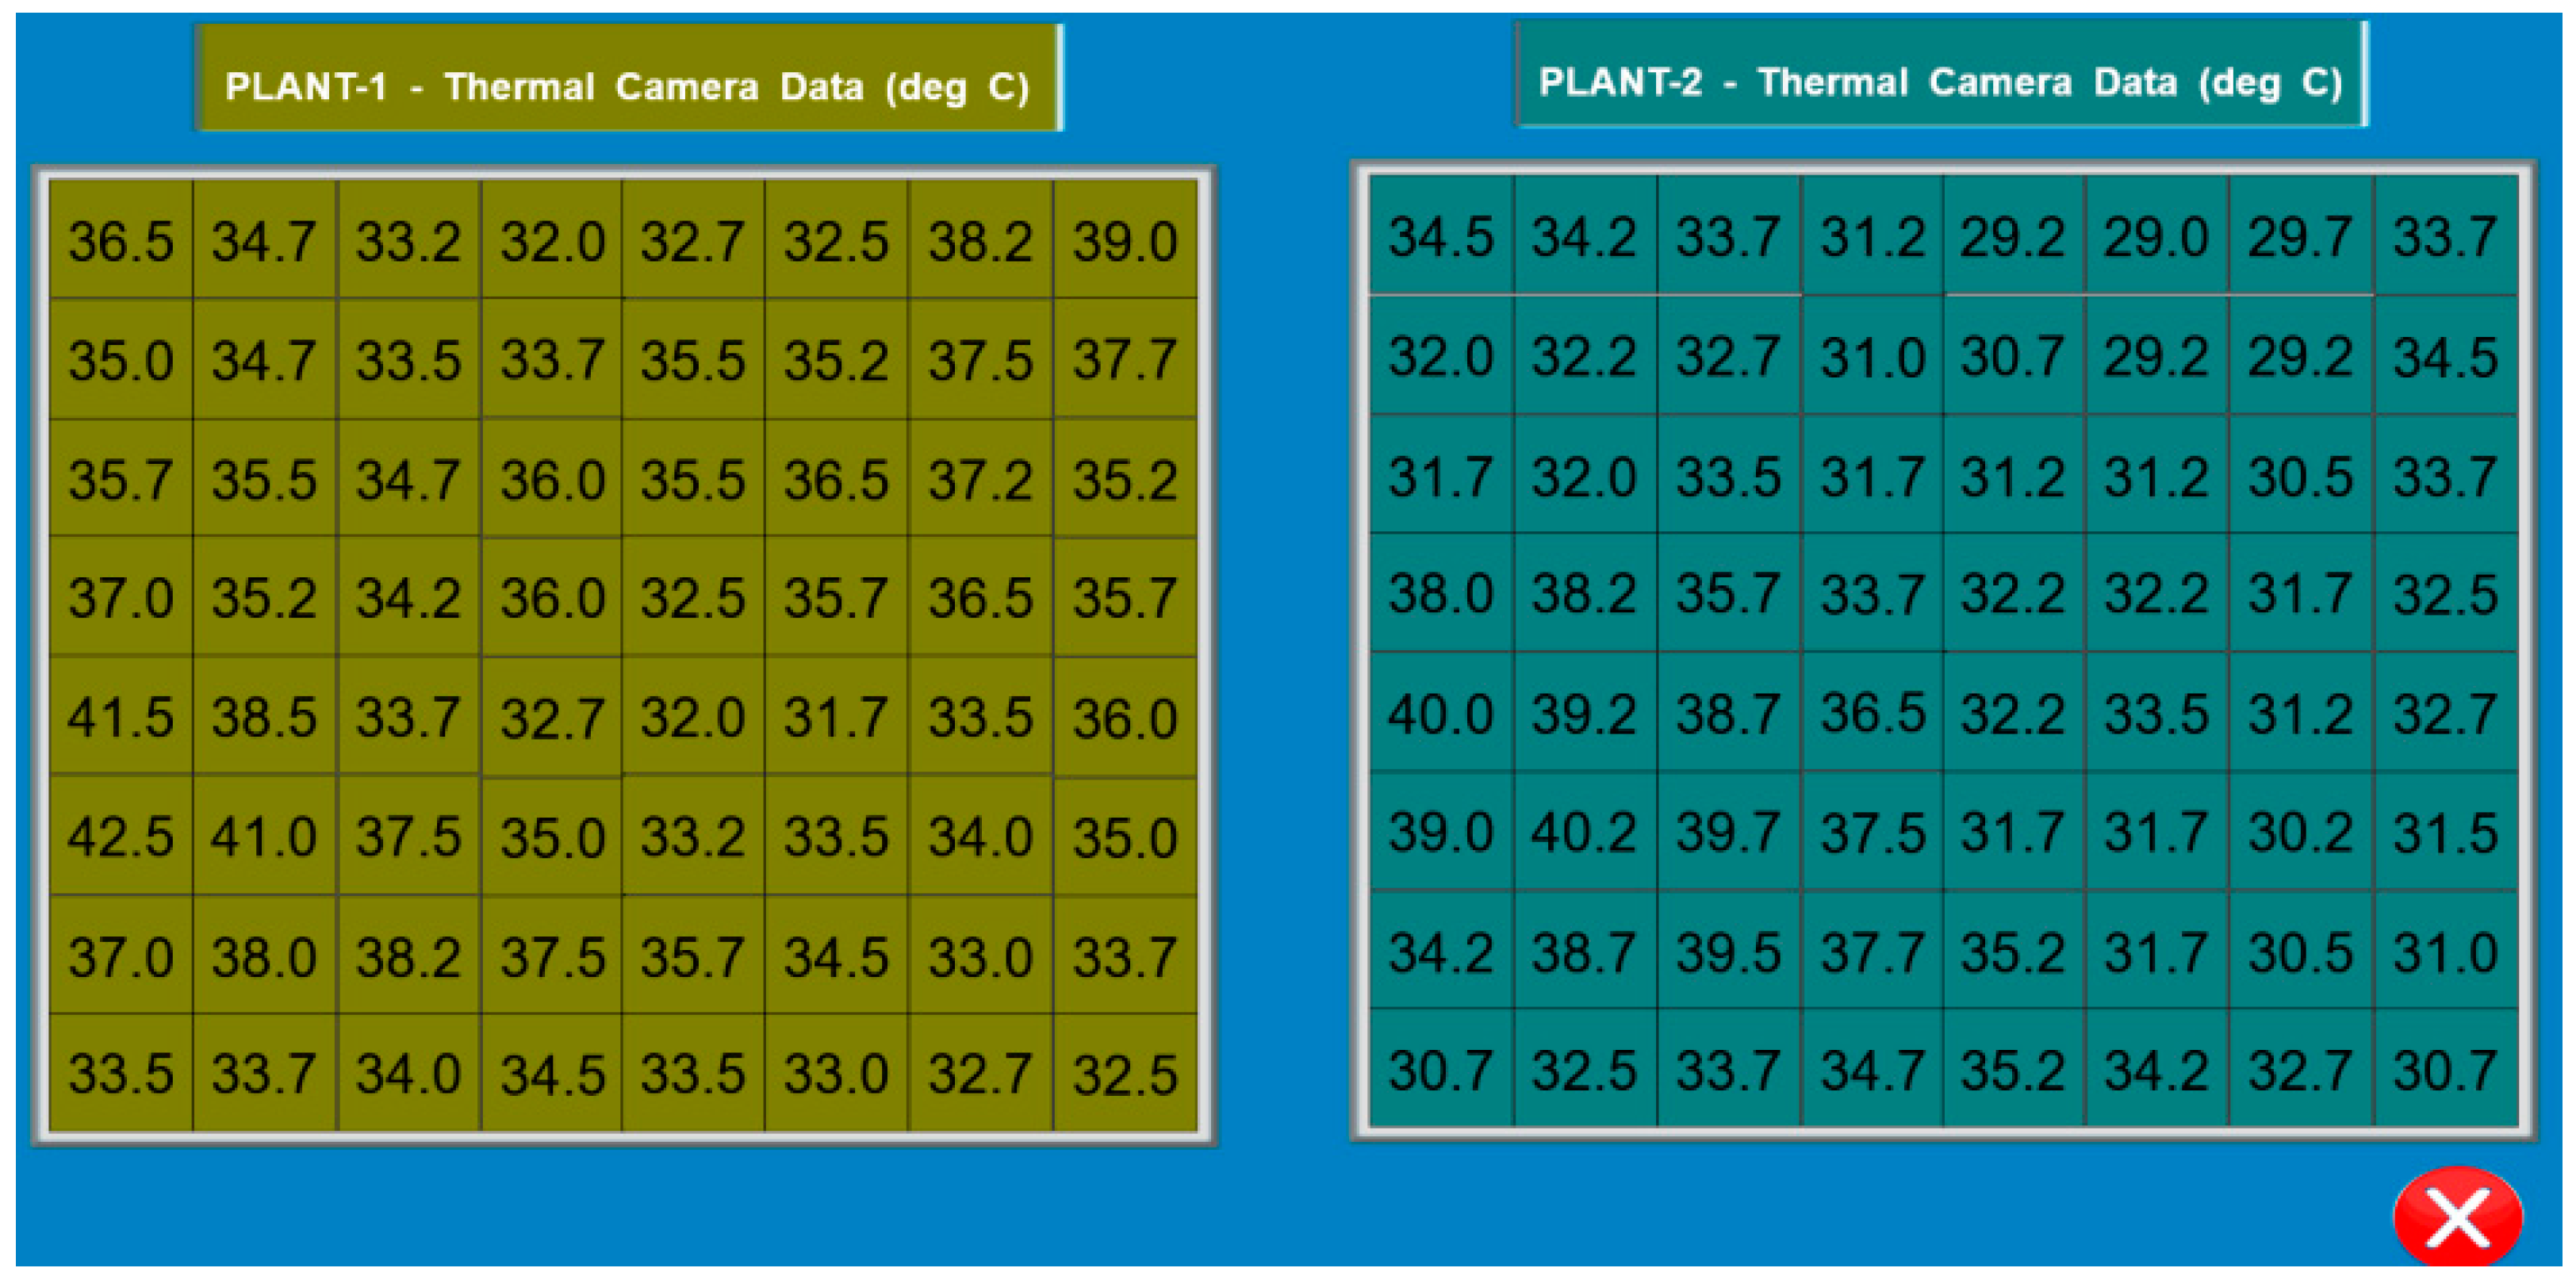
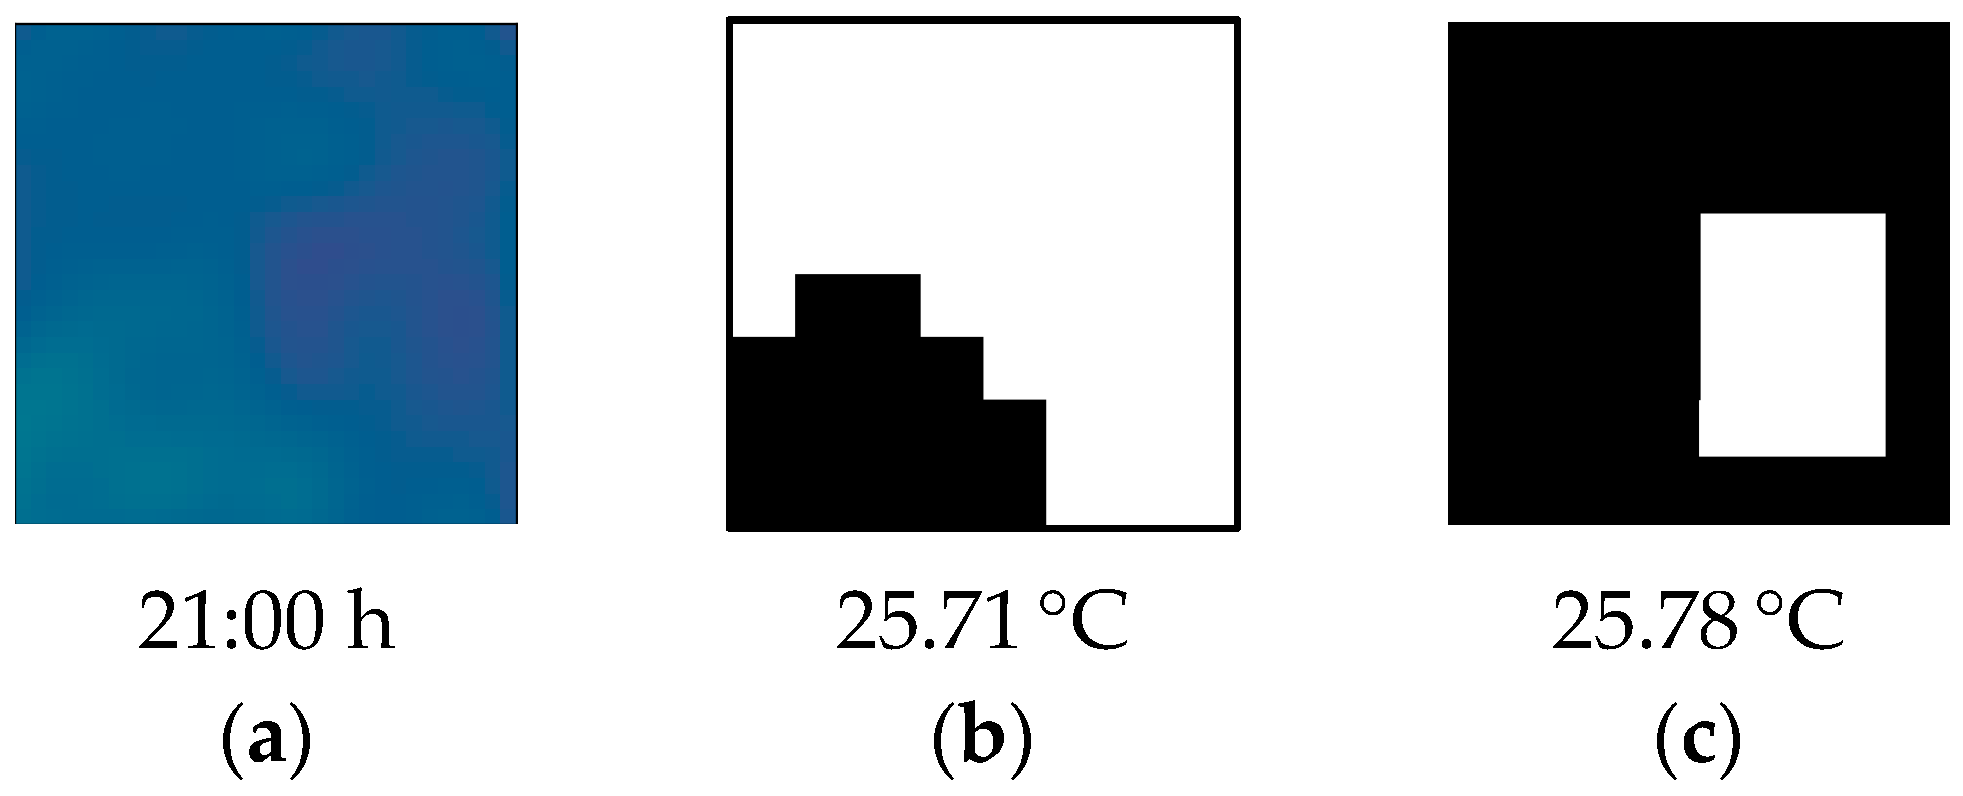
  • We propose a novel method to measure leaf temperature using a low-cost thermal camera, AMG8833 [49]. Our proposed system employs the 8 × 8 thermal camera and adopts a simple image thresholding technique to separate the leaf from the background for calculating the leaf temperature.
  • We propose a novel method to visualize the thermal image from the thermal camera in the SCADA HMI, where the data are sent from the sensor using the Modbus TCP protocol via wireless communication and then displayed in the HMI using a graphic tool provided by a free Haiwell Cloud SCADA software.
  • We comprehensively analyze the sensor data concerning vegetation behavior and instrument error reading.
The rest of the paper is organized as follows. Section 2 describes our proposed system. It explains the configuration of the proposed IoT-based SCADA, the sensors and leaf temperature measurement method, and the developed HMI. Section 3 presents the experimental results and discussion. Finally, the conclusion is covered in Section 4.

2. Proposed System

2.1. IoT-Based SCADA System Configuration

The configuration of the proposed IoT-based SCADA system is illustrated in Figure 1. In this work, we develop a SCADA system to monitor two plants, denoted Plant-1 and Plant-2. The purpose of using two plants is twofold. First, it is used to examine the performance of the sensor systems for measuring different plants or conditions. Second, it can be used to evaluate the feasibility of expanding the proposed SCADA system into a more extensive system.
It is worth noting that two different plants are planted separately in the polybag or pot and placed close together in the experiments. This arrangement ensures the air conditions for both plants are the same. Thus, the air parameters can only be measured in Plant-1. However, the leaf temperature and soil parameters should be measured separately. As shown in Figure 1, the proposed SCADA system consists of the sensors, Raspberry Pi Zero W [50], RS485 Modbus to WiFi converter, Access point, Haiwell IoT Cloud HMI, Haiwell cloud, and a computer or smartphone for remote monitoring.
The key element of the proposed system is the Haiwell IoT Cloud HMI. This device performs the SCADA function that can be accessed via the internet. Thus, it realizes the IoT-Based SCADA system. The HMI is connected to the field devices using wireless communication (WiFi) through an access point. Fortunately, the HMI unit supports the Modbus TCP protocol. Thus, it can be interfaced with other devices easily. This configuration provides a flexible arrangement of the field devices. The field devices are the sensor units, Raspberry Pi Zero W, and RS485 Modbus to WiFi converter. The sensor units are used to measure the monitored parameters. Based on the discussions in the previous section, we deal with the essential parameters and the availability of the sensor in the market, namely the leaf temperature, air temperature and humidity, soil moisture, temperature, pH, EC, and NPK.
In this work, the AMG8833 thermal camera measures the leaf temperature. It is connected to a Raspberry Pi Zero W using the I2C communication interface. The Raspberry Pi Zero W is used for thermal image processing, data saving, and sending to the HMI. The data are sent to the HMI using the Modbus TCP protocol wirelessly. A detailed explanation of the thermal camera specification, leaf temperature measurement method, and the data handle are provided in the next section.
The DHT22 sensor measures the air temperature and humidity. This sensor is connected to a Raspberry Pi Zero W using a single-wire connection. The Raspberry Pi Zero W reads the sensor’s air temperature and humidity data, store and send them to the HMI. Just as with the leaf temperature measurement, the air temperature and humidity data are wirelessly sent to the HMI using the Modbus TCP protocol. A detailed explanation of the DHT22 sensor specification, and the data handle are provided in the next section.
The JXCT soil sensor [51] measures the soil parameters of pH, temperature, moisture, EC, and NPK. The JXCT soil sensor has the RS485 interface with the Modbus RTU protocol. It is then connected to an RS485 to WiFi converter (Elfin-EW11) [52] for wireless data transfer to the Haiwell IoT Cloud HMI. The reason for using the WiFi converter rather than connecting to the Raspberry Pi Zero W is that we want to evaluate the performance of the WiFi communication of the Raspberry Pi Zero W with the WiFi converter, especially when implementing the Modbus TCP protocol. A detailed explanation of the JXCT sensor specification, and the data handle are provided in the next section.
The Haiwell IoT Cloud HMI is an HMI device equipped with an IoT gateway. The device has a built-in Haiwell cloud engine and cloud service. In this work, we exploit the four main features of the Haiwell IoT Cloud HMI:
  • A low cost of about US$ 200.
  • Support of the Modbus TCP protocol for easy interfacing with the sensor systems.
  • Easy design and programming of the HMI using the free Haiwell Cloud SCADA software.
  • Accessible from the cloud and mobile.

2.2. Sensors and Embedded System Hardware

2.2.1. Air Temperature and Humidity Sensor

Air temperature and humidity are the typical air parameters to be monitored. This work uses the DHT22 to measure air temperature and humidity. It is similar to the DHT11 but has superior accuracy. In the DHT22, the temperature is measured by a thermistor, and a capacitive humidity sensor measures the humidity. This sensor compensates for temperature and is calibrated. The DHT22 specifications are given in Table 3 [53].

2.2.2. Soil Sensor

In this work, the JXCT soil sensor is used for measuring the soil parameters of pH, temperature, moisture, EC, and NPK. It is a low-cost multi-parameter sensor with high precision and fast response. It is easy to use and, as default, arrives calibrated from the factory. This sensor measures the soil parameters based on ion concentrations [54]. The JXCT soil sensor specifications are given in Table 4.

2.2.3. Thermal Camera

In this work, the AMG8833 thermal camera, also called “Grid-EYE” [49], is used to measure the leaf temperature. It is a low-cost infrared array sensor with a resolution of 8 × 8 pixels. The pixel value represents the temperature of the detected object at the point, which is measured by the infrared array sensor. Therefore, the thermal camera is not affected by the ambient lighting. It only measures the temperature of the object. This sensor is easily interfaced with the embedded system via the I2C protocol. The AMG8833 specifications are given in Table 5.

2.2.4. Raspberry Pi Zero W

As shown in Figure 1, the Raspberry Pi Zero W embedded system is used to read and process the data from the DH22 and AMG8833 sensors. We chose the Raspberry Pi Zero W due to its low cost (US$ 25) and the small size of the single-board computer that can perform a simple image processing task for calculating the leaf temperature from the thermal camera. The Raspberry Pi Zero W specifications are a 1 GHz single-core ARMv6 CPU (BCM2835), 512MB RAM, 802.11 b/g/n wireless LAN, Bluetooth 4.1, 40-pin GPIO, and CSI connector.

2.2.5. RS485 Modbus to WiFi Converter

As described earlier, the JXCT soil sensor supports the Modbus protocol. Thus, it can directly connect to the SCADA server, a Haiwell IoT cloud HMI in this case. However, since the wireless (WiFi) communication between the sensor and the HMI is established, the RS485 to WiFi converter is required. In this work, we use the Elfin-EW11 as the converter from the RS485 Modbus RTU to WiFi Modbus TCP. This device allows a simple and easy configuration via a Web page. The Elfin-EW11 specifications are given in Table 6.

2.3. Leaf Temperature Monitoring

The schematic diagram of leaf temperature monitoring is illustrated in Figure 2. It consists of three units: an AMG8833 thermal camera, a Raspberry Pi Zero W single-board computer, and the Haiwell IoT Cloud HMI. The AMG8833 measures the temperature of the monitored object on the 8 × 8 pixels, as shown in the figure (top left). These temperature data are then read by the Raspberry Pi Zero W using the I2C protocol and converted to the thermal image. The image processing task can be performed once the data are in image format. It is worth noting that for the leaf temperature calculation using the Otsu thresholding, the pixel values are the original temperature data of the thermal camera. However, the pixel values of saved and displayed thermal images are converted to the heat-map color for easy visualization. The thermal image is also stored in the SDCard memory of the Raspberry Pi Zero W for data analysis.
At first, we collect the images during the day to observe the variation in the leaf and background temperatures. The results from observation show that the temperature of leaf objects is always lower than the background. This can be analyzed from the fact that the temperature of concrete and soil of the background tend to be higher than the air temperature. Since the experiments are conducted in a tropical climate where the daily temperature ranges from 20 to 40 °C, the leaf temperature will be lower than the background (concrete and soil) temperature. Based on this observation, we define the leaf temperature by a simple image segmentation using the Otsu thresholding.
The Otsu thresholding is a simple and popular image segmentation technique for separating the object from background. The Otsu thresholding is an automatic thresholding technique, where the optimal threshold (Topt) is obtained by maximizing between-class variance of the background and foreground. The Topt is calculated as [55]:
T o p t = arg max c f ( T o p t ) × 1 c f ( T o p t ) × m f ( T o p t ) m b ( T o p t ) 2 c f ( T o p t ) × σ f 2 ( T o p t ) + 1 c f ( T o p t ) × σ b 2 ( T o p t )
c f ( g ) = i = 0 g p f ( i )
m f ( T ) = g = 0 T g × p f ( g )
m b ( T ) = g = T + 1 255 g × p f ( g )
σ f 2 ( T ) = g = 0 T g m f ( T ) 2 × p f ( g )
σ b 2 ( T ) = g = T + 1 255 g m b ( T ) 2 × p f ( g )
where pf(g) is the probability mass function, g is the intensity value in the image (g = 0, ..., 255), mf(T) is the mean of the foreground, mb(T) is the mean of background, T is the thresholding level, σ f 2 ( T ) is the variance of the foreground, and σ b 2 ( T ) is the variance of the background.
The algorithm to calculate the leaf temperature is as follows:
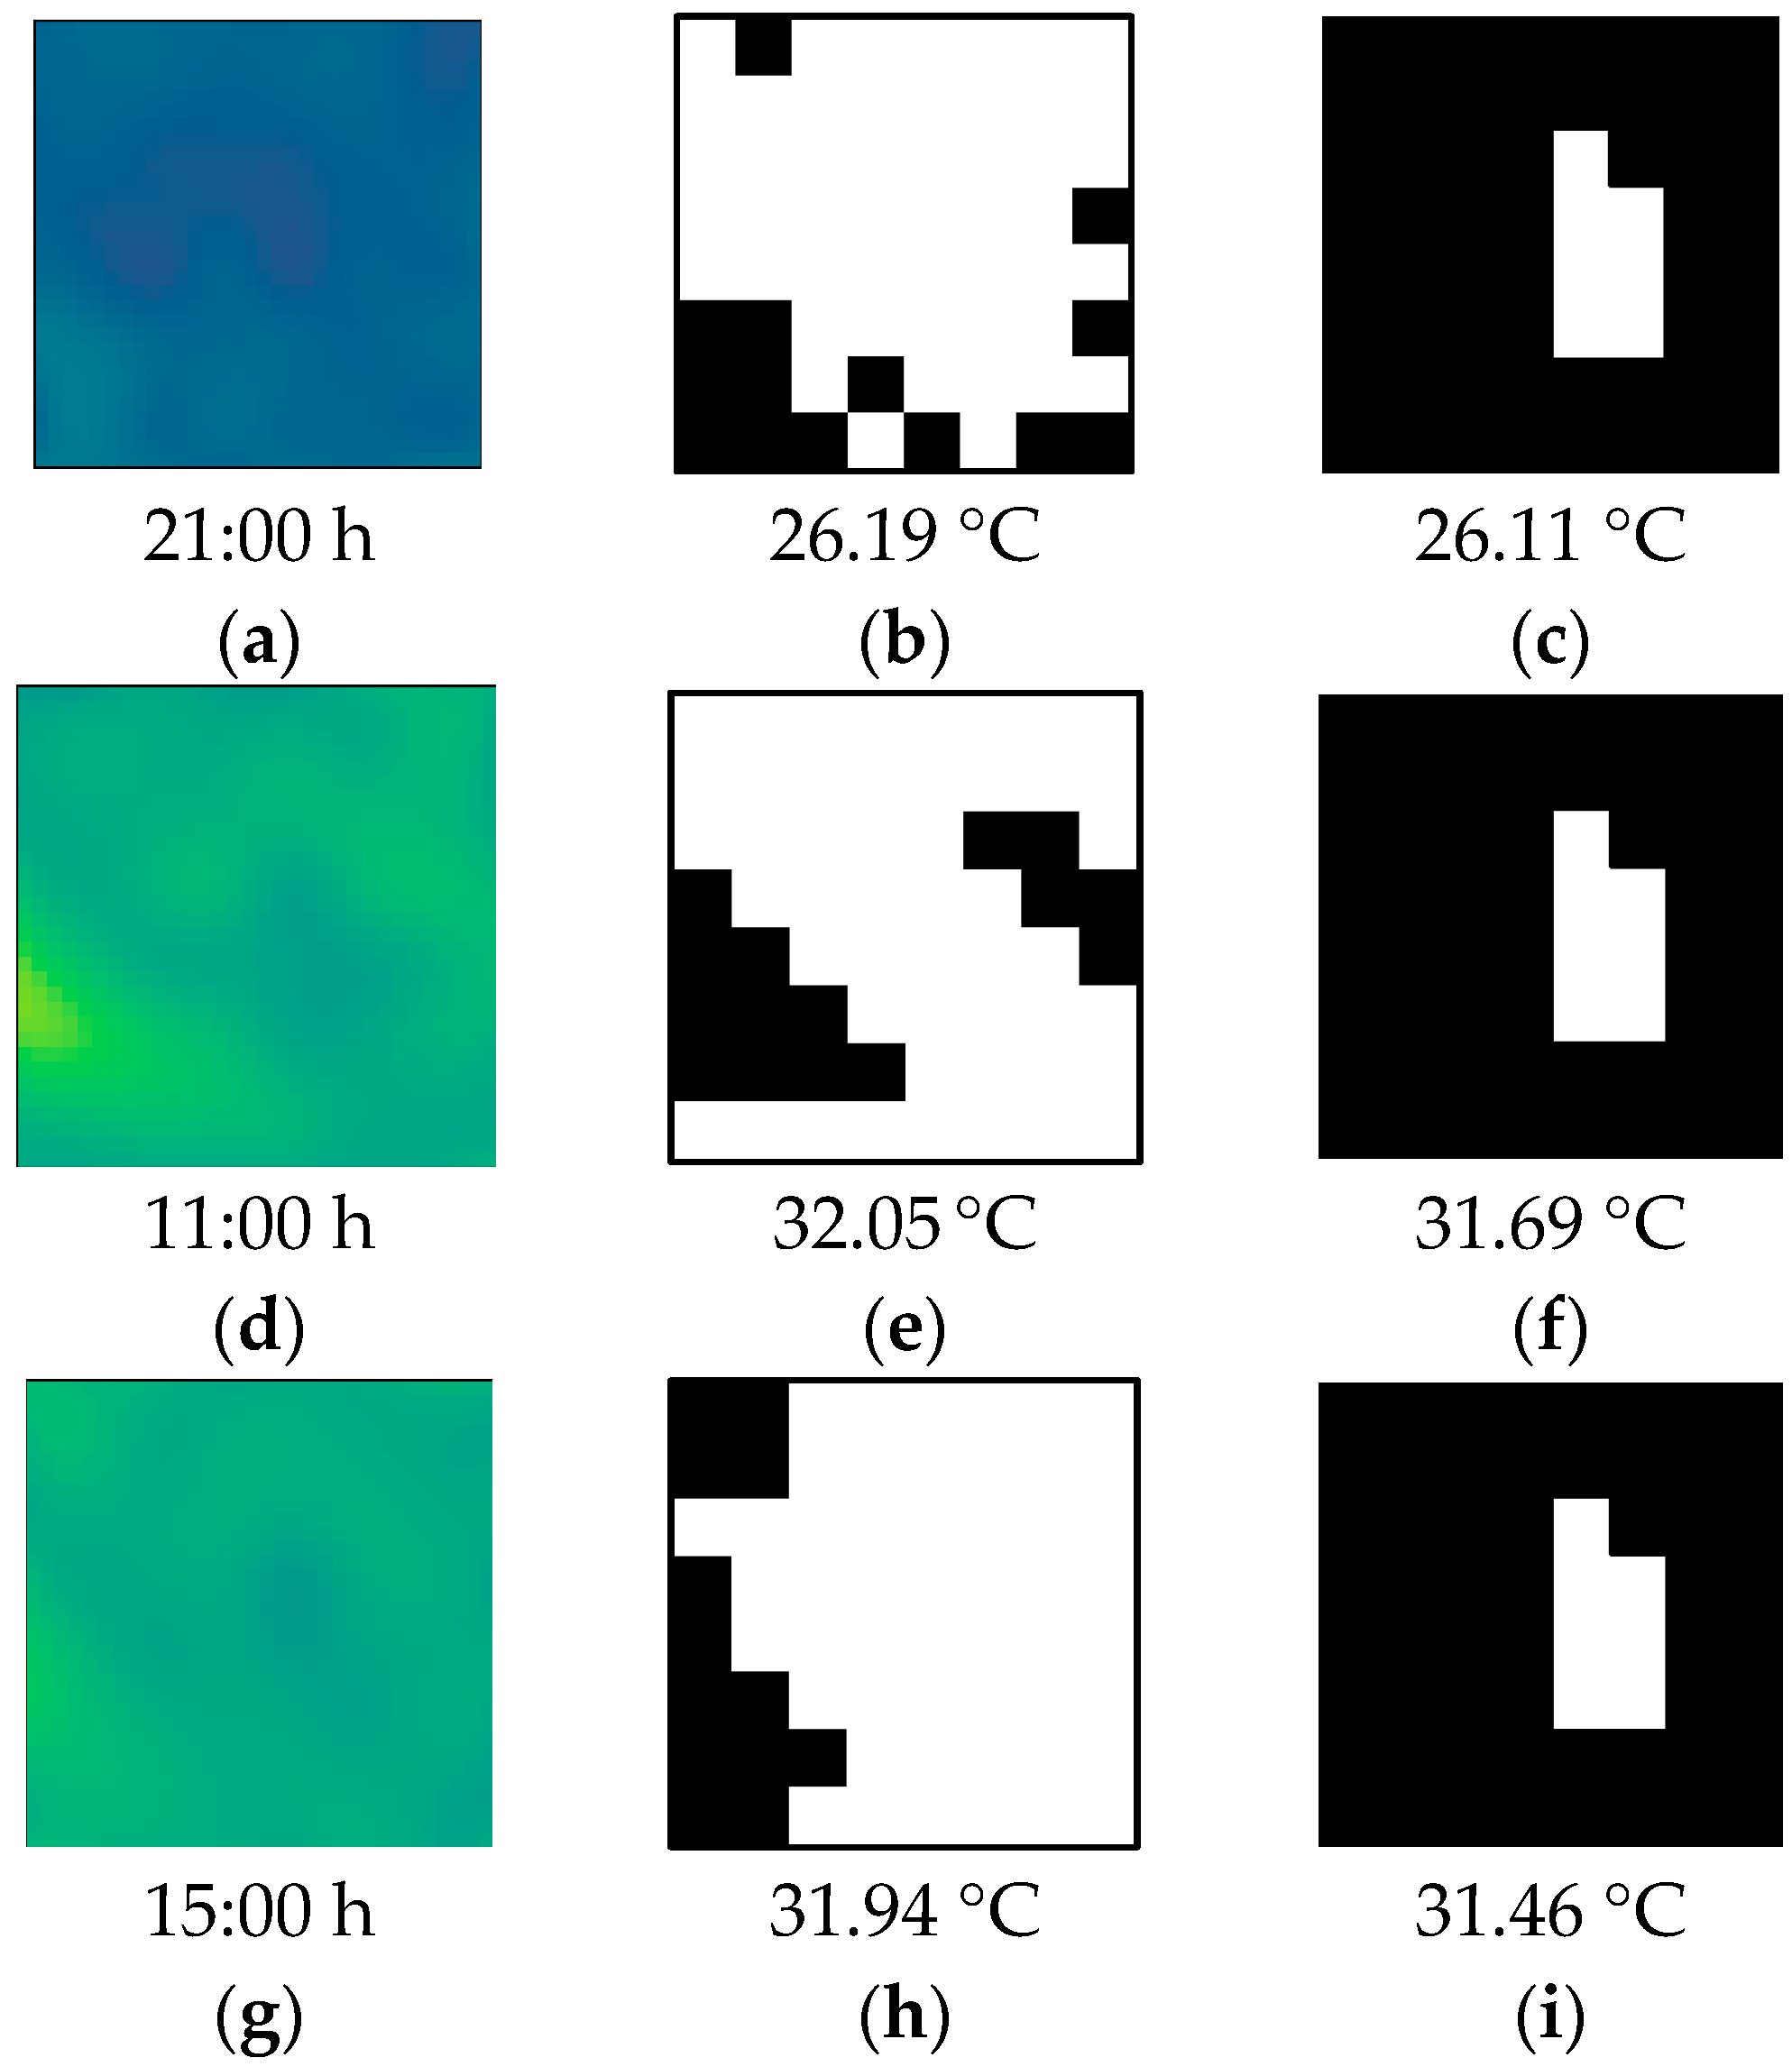
  • Apply the Otsu thresholding technique to separate an image into two parts, foreground and background, using an optimal threshold Topt;
  • The foreground pixels are defined as the pixels whose values are lower than Topt, and the background pixels are defined as the pixels whose values are higher than Topt;
  • The leaf temperature is defined as the average values of the foreground pixels, and the background temperature is defined as the average values of the background pixels.
In order to be accessible by the HMI, the temperature data of the 64 pixel thermal image, leaf temperature, and background temperature are stored in the Modbus registers. In turn, the Haiwell IoT Cloud HMI reads the temperature data from the Raspberry Pi Zero W using the Modbus TCP protocol. The thermal image data are then visualized into the image as shown in Figure 2 (bottom Left), while the leaf temperature is displayed in numerical format.

2.4. SCADA HMI

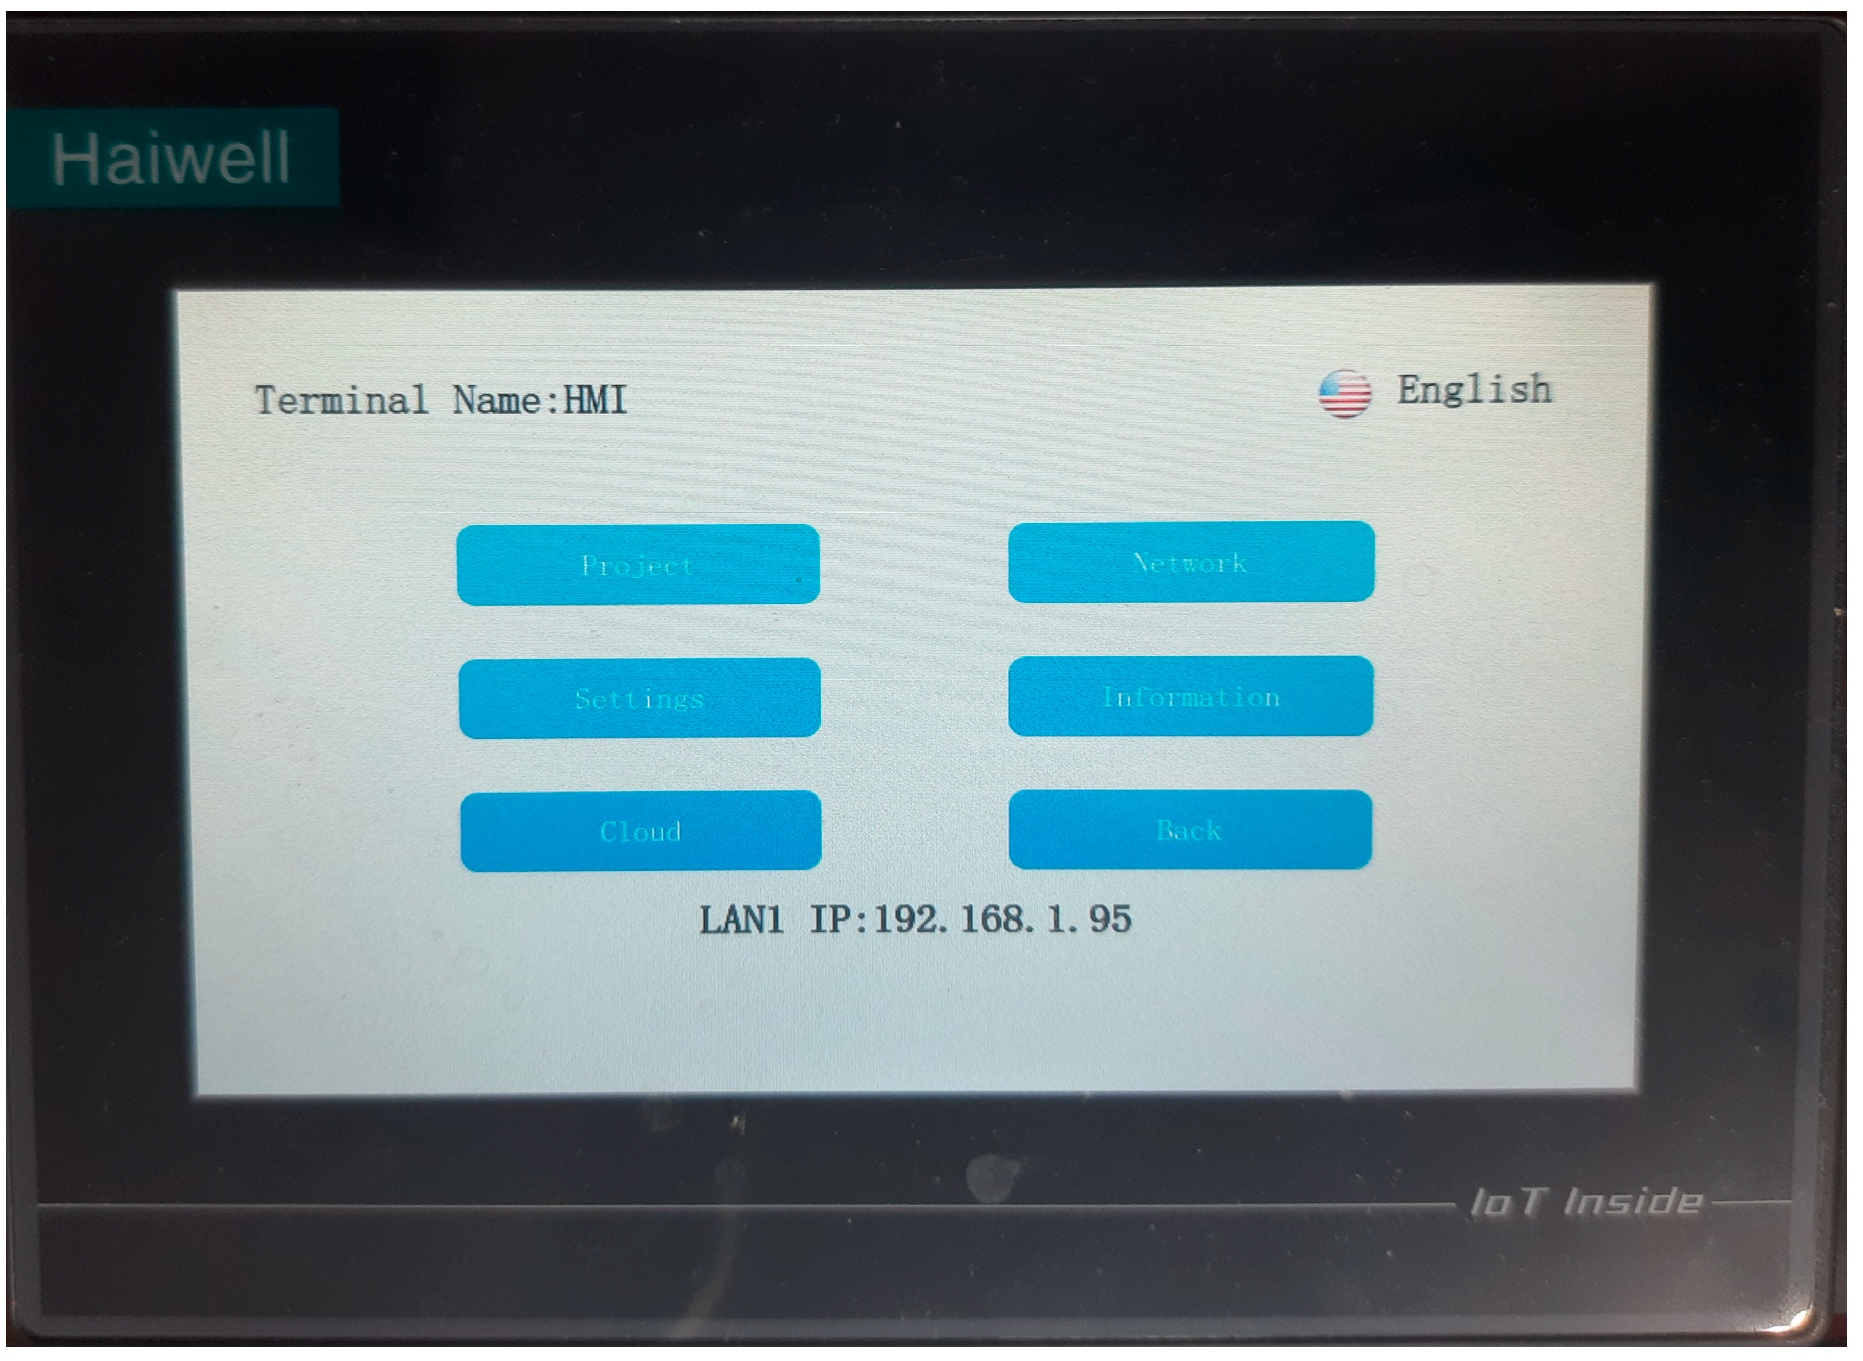
2.4.1. Haiwell IoT Cloud HMI

The Haiwell IoT Cloud HMI used in this experiment is the B7S-W series, as shown in Figure 3. It is developed based on the embedded Linux system with a 7-inch touchscreen display and scalable vector graphics (SVG) image editing and processing technology. It can communicate with popular industrial RTUs/PLCs such as Schneider, Siemens, Omron, Yokogawa, etc., using the standard Modbus protocol or their proprietary protocols. It also supports the MQTT, a popular protocol in IoT communication. The HMI specifications are given in Table 7.
The HMI is programmed and configured using the Haiwell Cloud SCADA software. Besides the visualization display, it provides real-time trends and stores historical data. The main advantage of this IoT-based SCADA system is that the HMI can be remotely accessed through the web or mobile application via the Haiwell cloud. The application on the HMI is synchronously accessed by all terminals. This means that when the user changes the menu on the HMI device, the display on the web or mobile application also changes accordingly, and vice versa.

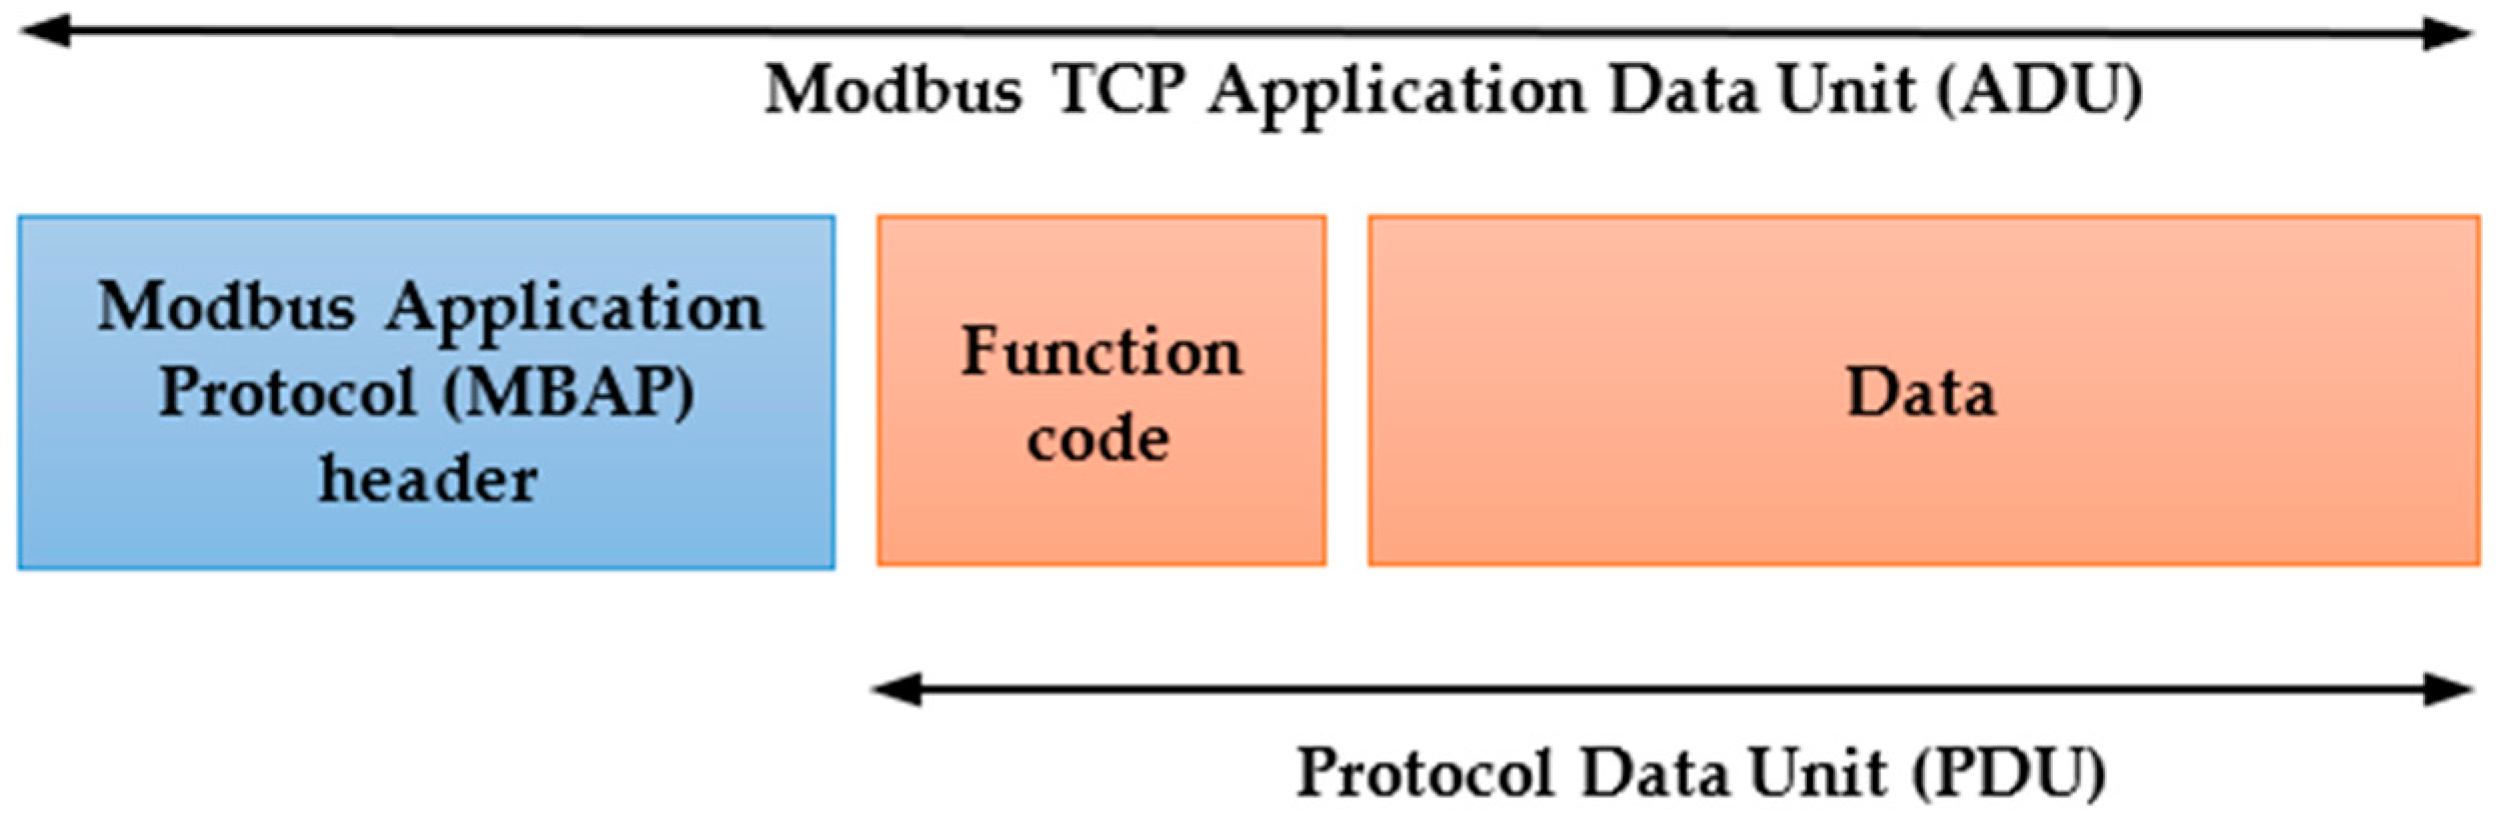
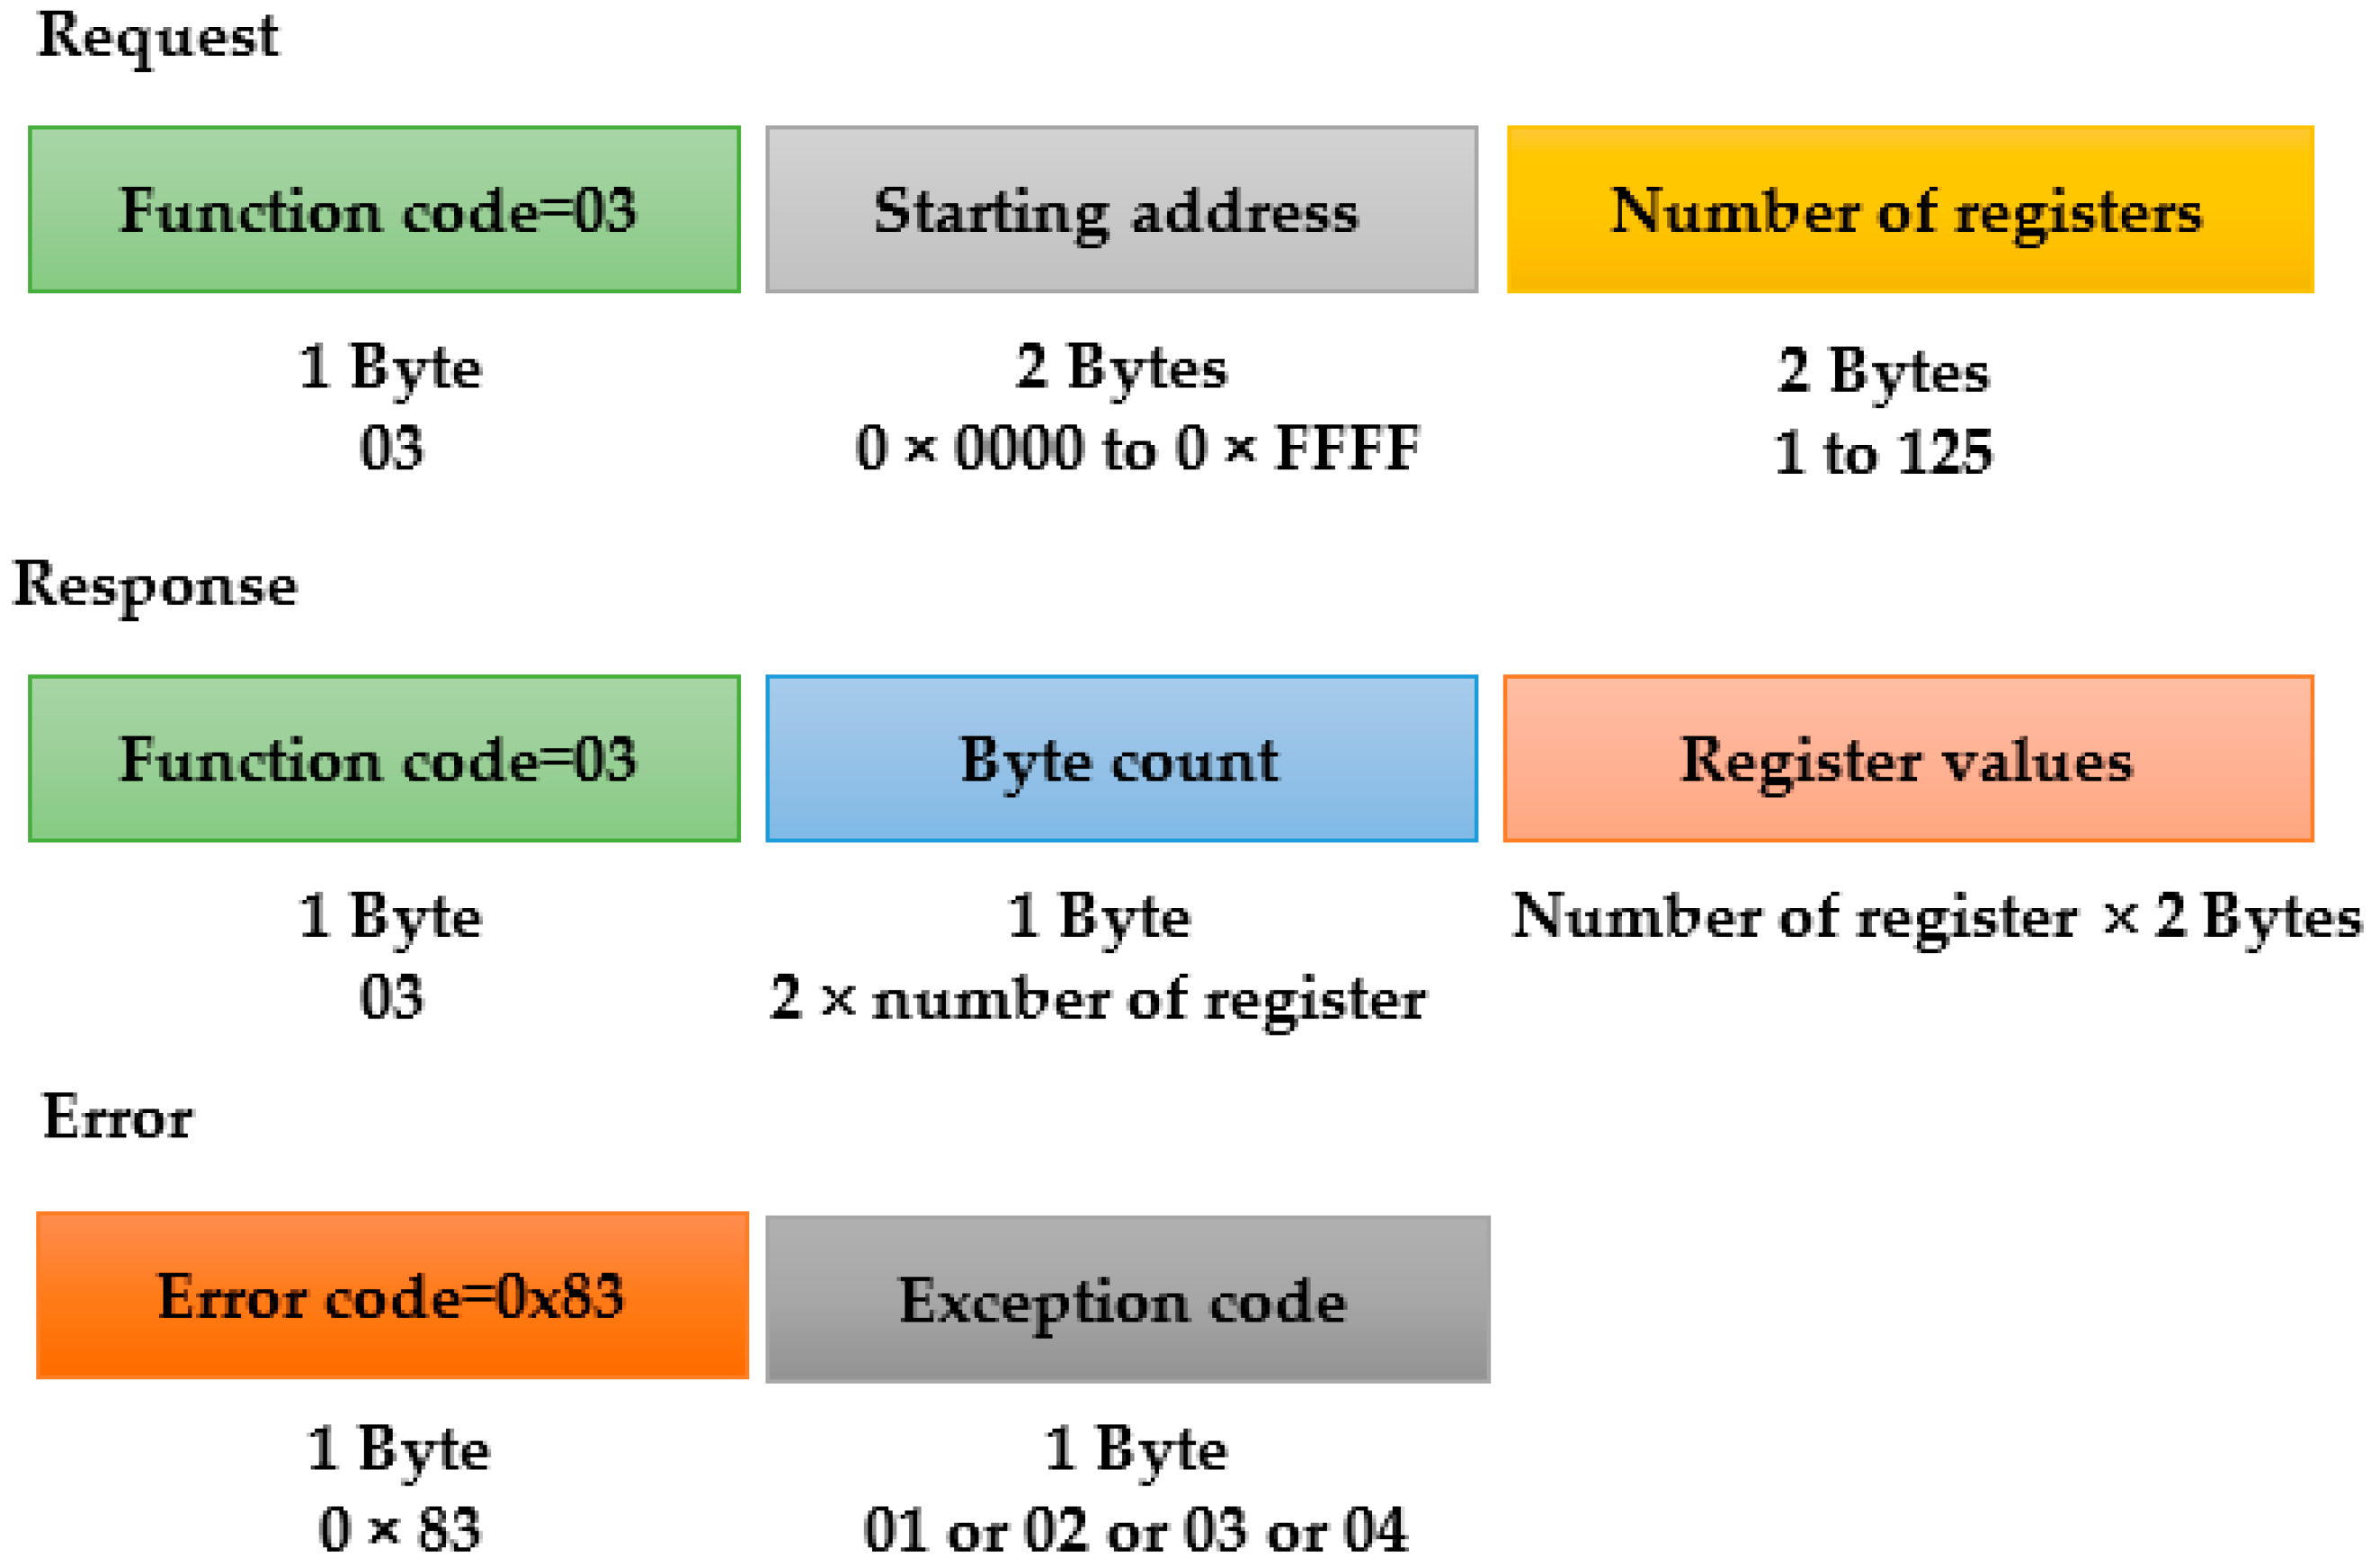
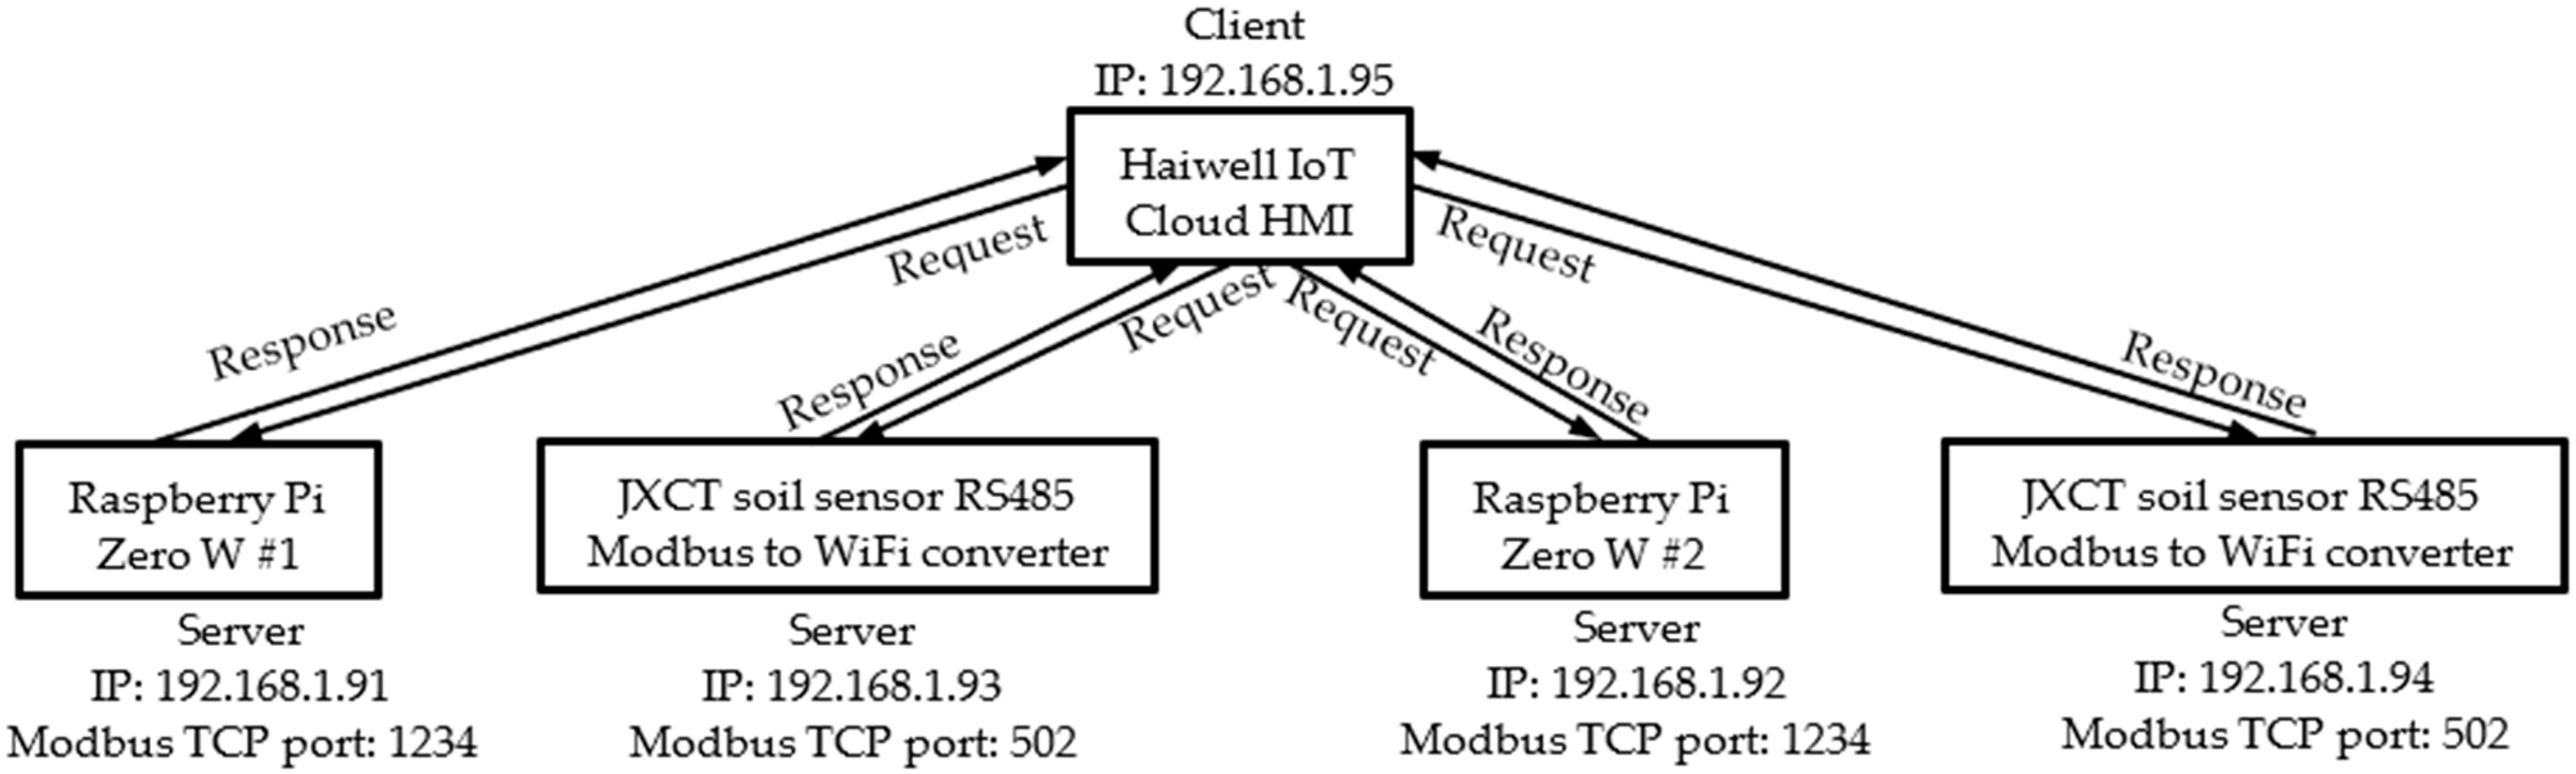
2.4.2. Modbus TCP Configuration

The Modbus TCP is a request–response protocol, where the client (master) requests a message to the server (slave) and the server replies to the client. There are four types of messages [56]:
  • Modbus request: the message sent by the client to initiate a transaction,
  • Modbus indication: the request message received on the server side,
  • Modbus response: the response message sent by the server,
  • Modbus confirmation: the response message received on the client side.
The Application Data Unit (ADU) of the Modbus TCP protocol is illustrated in Figure 4 [56]. It consists of the Modbus Application Protocol (MBAP) header, function code, and data. The function code and data field are called the Protocol Data Unit (PDU). The MBAP header contains the following fields: Transaction identifier for identification of Modbus request/response transaction, Protocol identifier, Length of the following bytes, and Unit identifier for identification of a remote slave. The function code field defines the task that should be performed. The data field contains additional information according to the function code, such as the register addresses, the number of items to be handled, and the actual data to be read or written. The common Modbus function codes are listed in Table 8 [57].
The PDU is defined for a particular function code. For instance, the PDU for the function code = 03 (Read Holding Registers) is illustrated in Figure 5. This function code reads the contents of holding registers in a remote device. The client requests the server by sending the function code (03), the starting address, and the number of registers to be read. Then, the server will respond by sending the function code (03), the number of bytes, and the register data. The server sends the error and exception codes if an error occurs.
The configuration of the Modbus TCP protocol used in the experiment is illustrated in Figure 6, where for simplicity, only Requests and Responses are indicated in the figure. The figure shows that the client is the Haiwell IoT Cloud HMI. The servers are the Raspberry Pi Zero W #1, Raspberry Pi Zero W #2; JXCT soil sensor RS485 Modbus to WiFi converter #1 and JXCT soil sensor RS485 Modbus to WiFi converter #2. The IP address of each device is shown in the figure. The RS485 Modbus to WiFi converters use the default Modbus TCP port number of 502. However, since this port number is the privilege port in the Raspberry Pi environment, we use the port number of 1234 for programming simplicity. The Modbus function code = 03 (Read Holding Registers) is used to access the data in the server. The Modbus data addressing for the Raspberry Pi Zero W and JXCT soil sensor RS485 Modbus to WiFi converter is listed in Table 9 and Table 10, respectively.
The client (Haiwell IoT Cloud HMI) requests the data from the servers every five seconds. The requested data are listed in Table 9 and Table 10. The data are then displayed on the HMI. Besides displaying the data, the HMI also stores the data in the memory. The data are stored in one-minute intervals for saving memory usage. Since the HMI is connected to the cloud server, the data can be accessed easily via the internet.

3. Experimental Results and Discussion

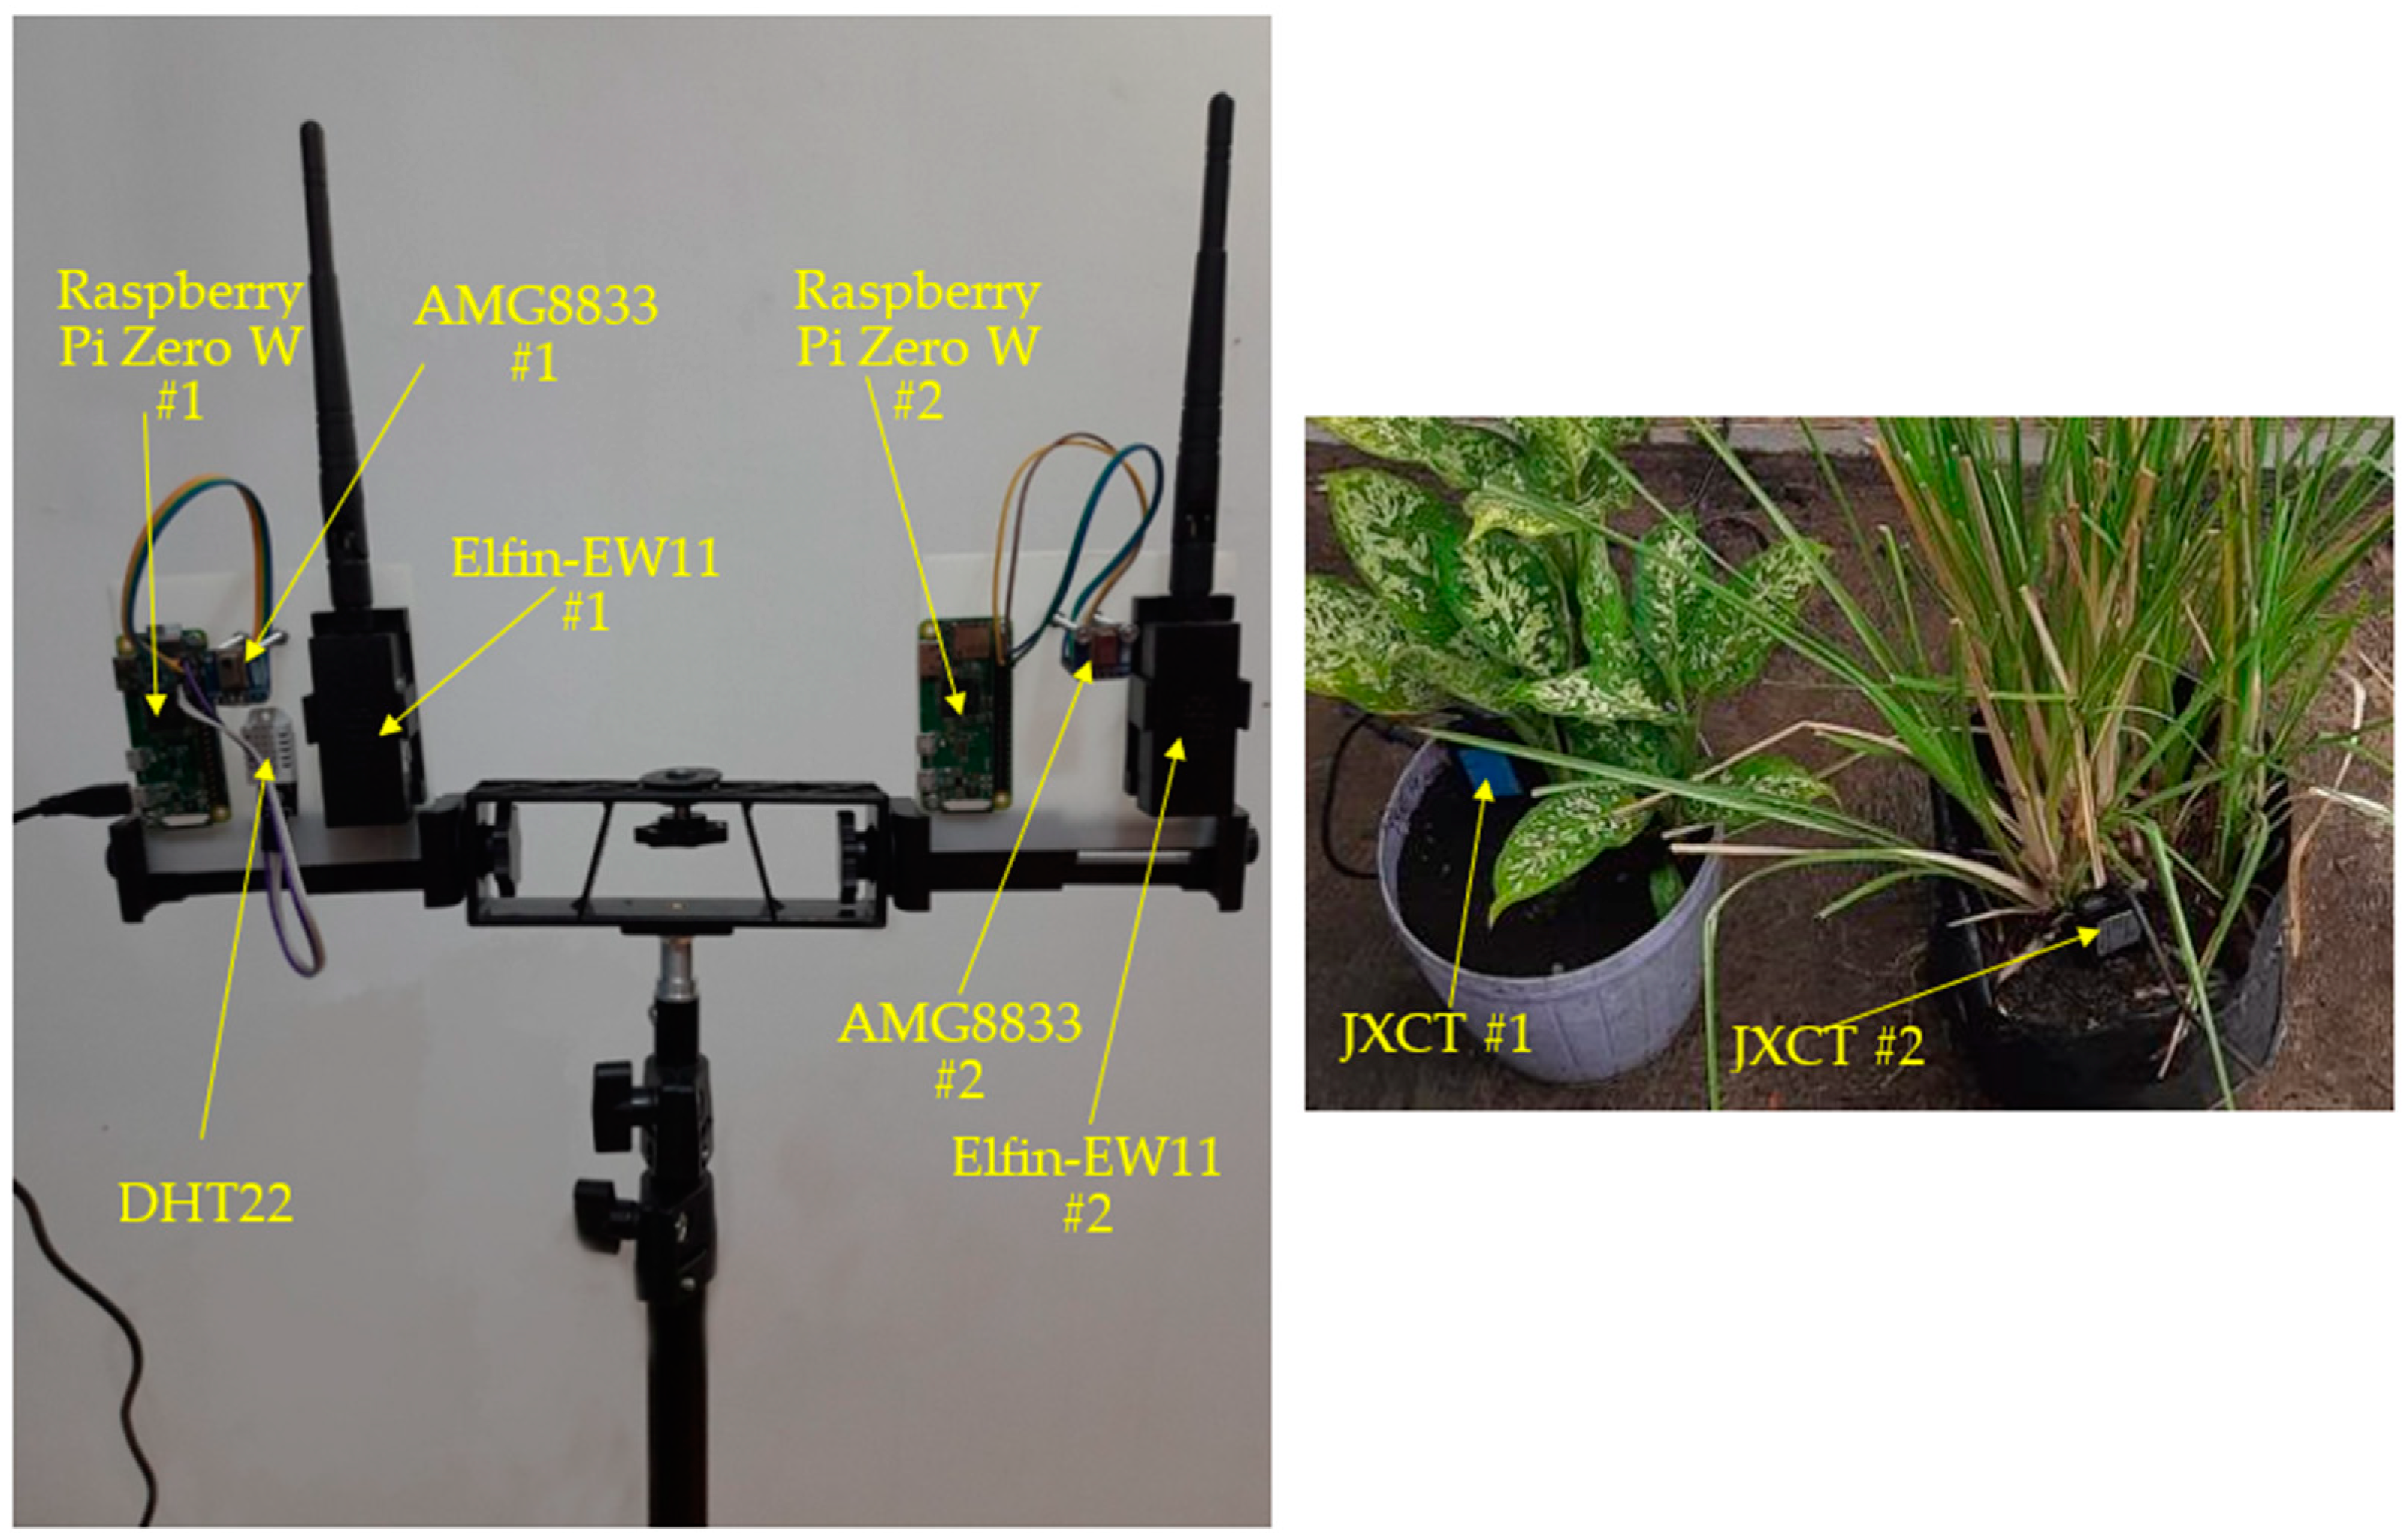
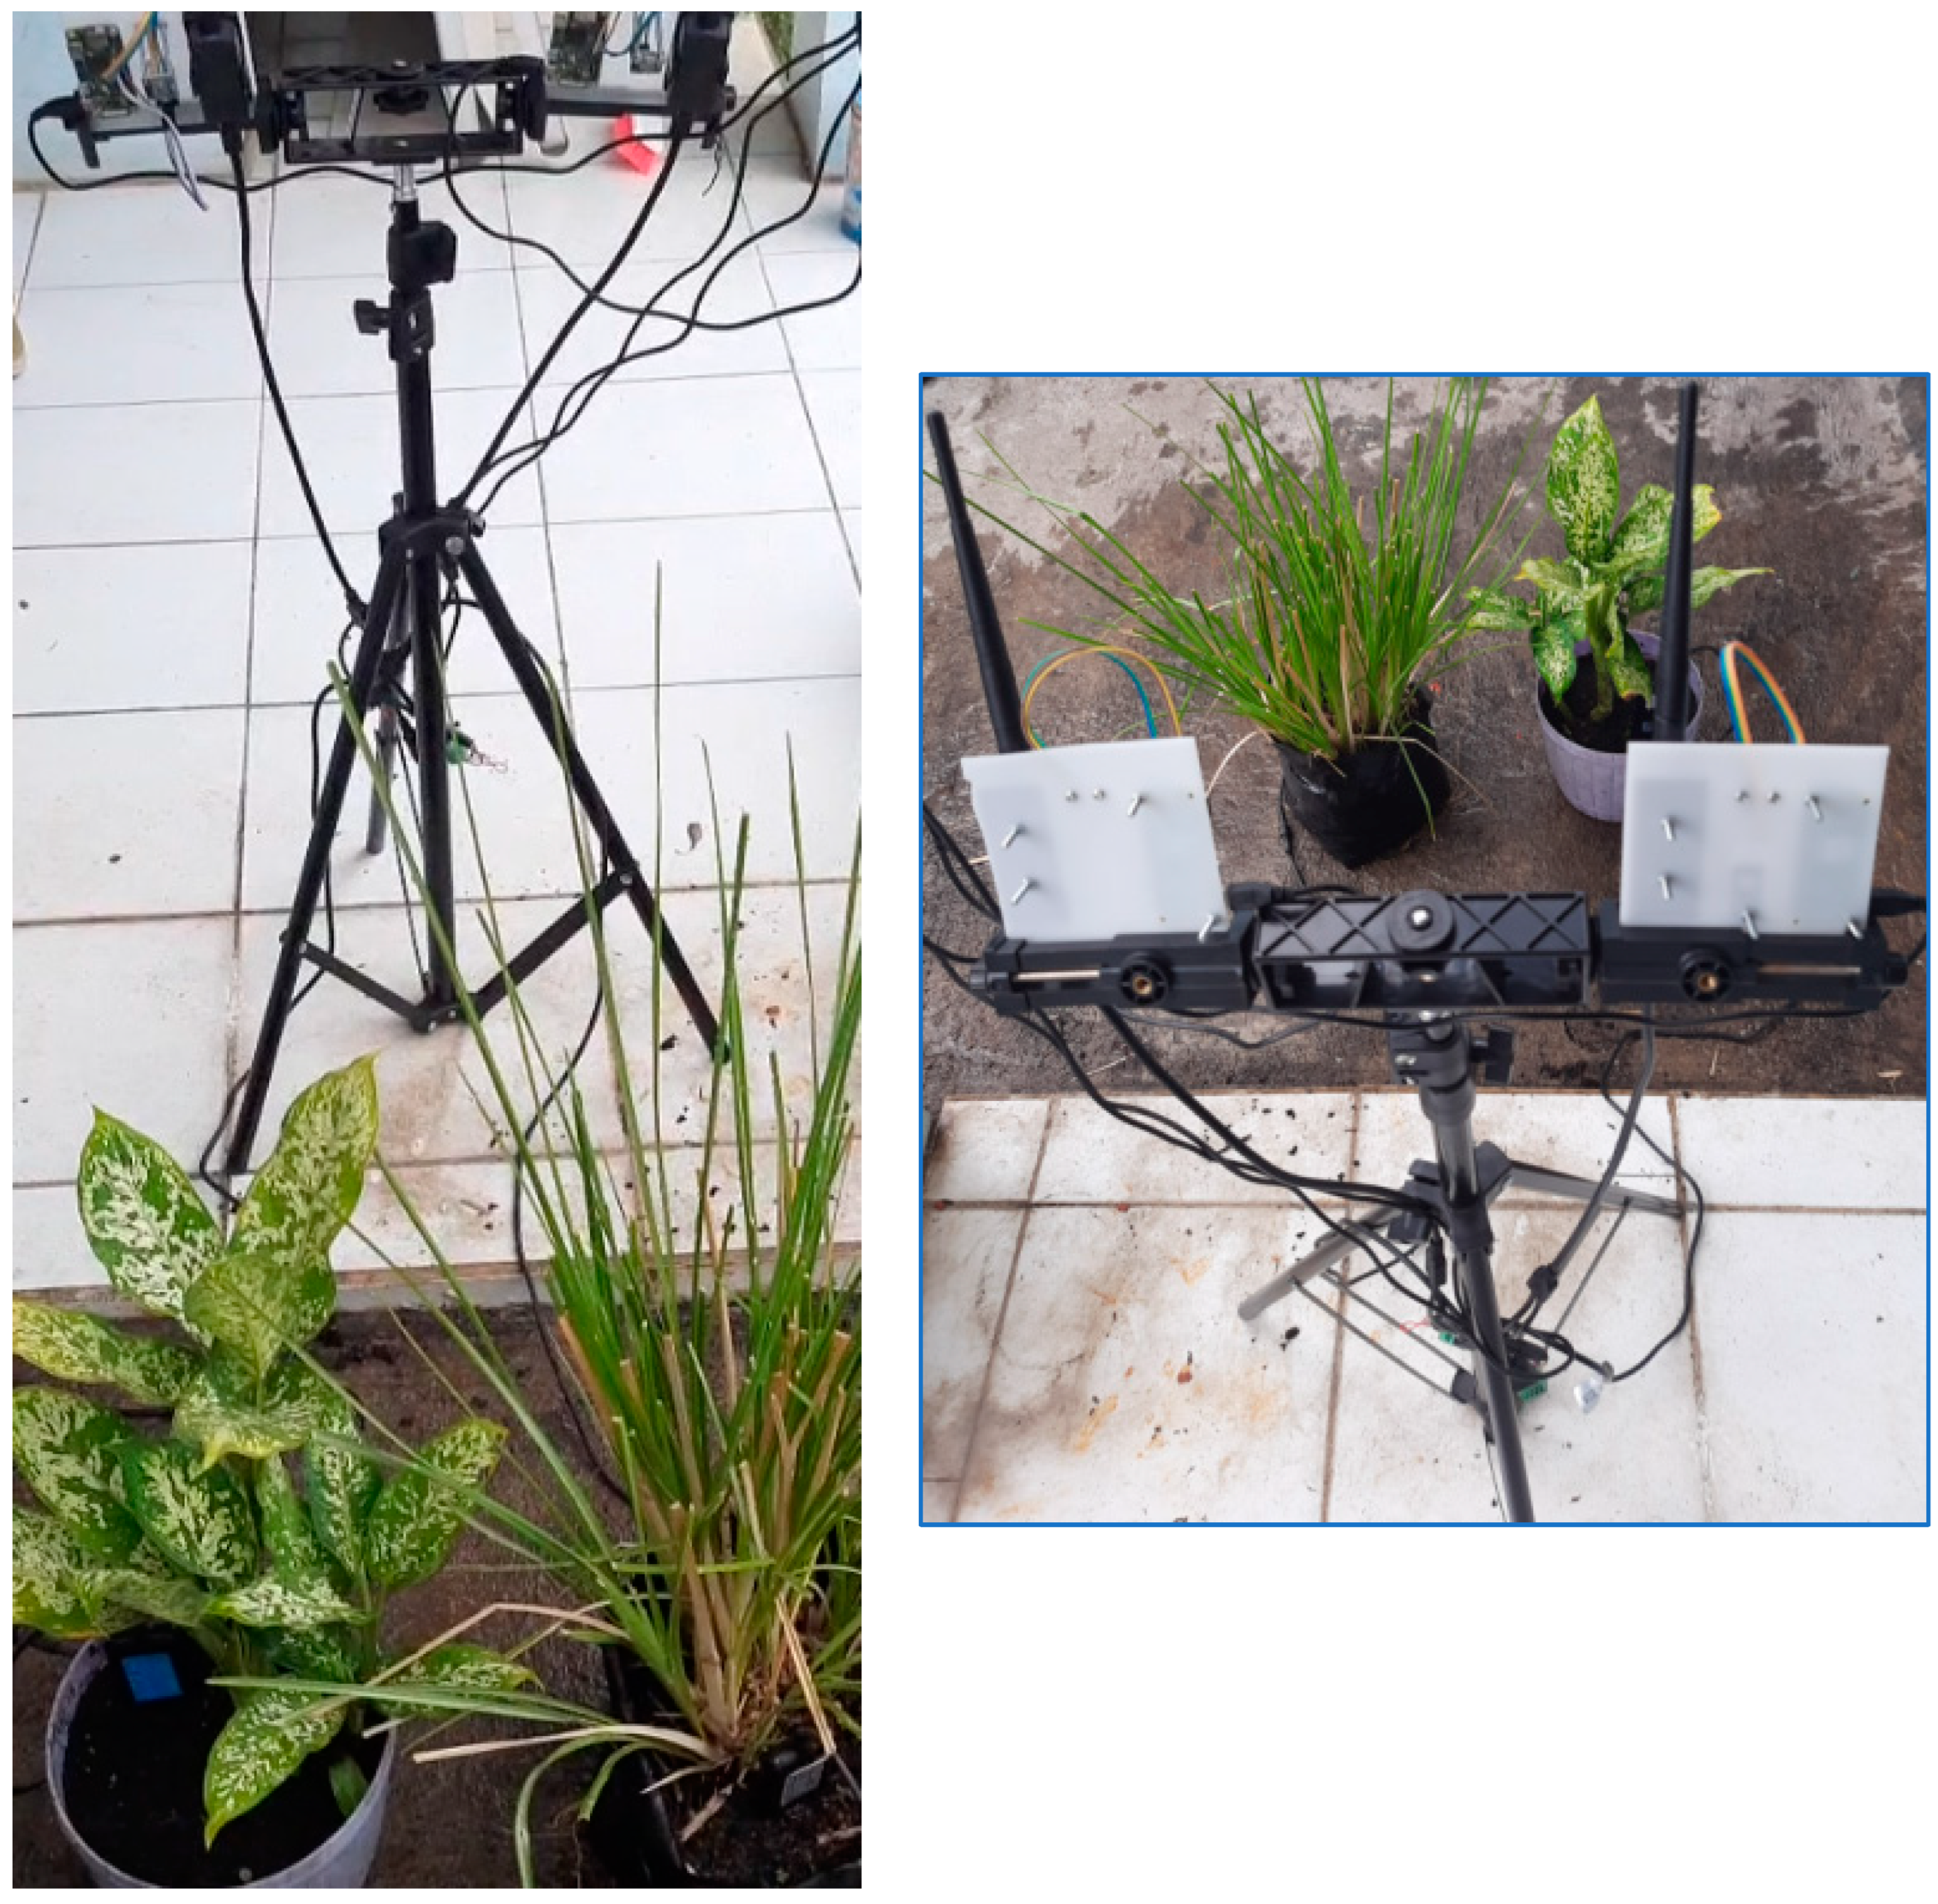
3.1. Hardware Implementation of Plant Monitoring System
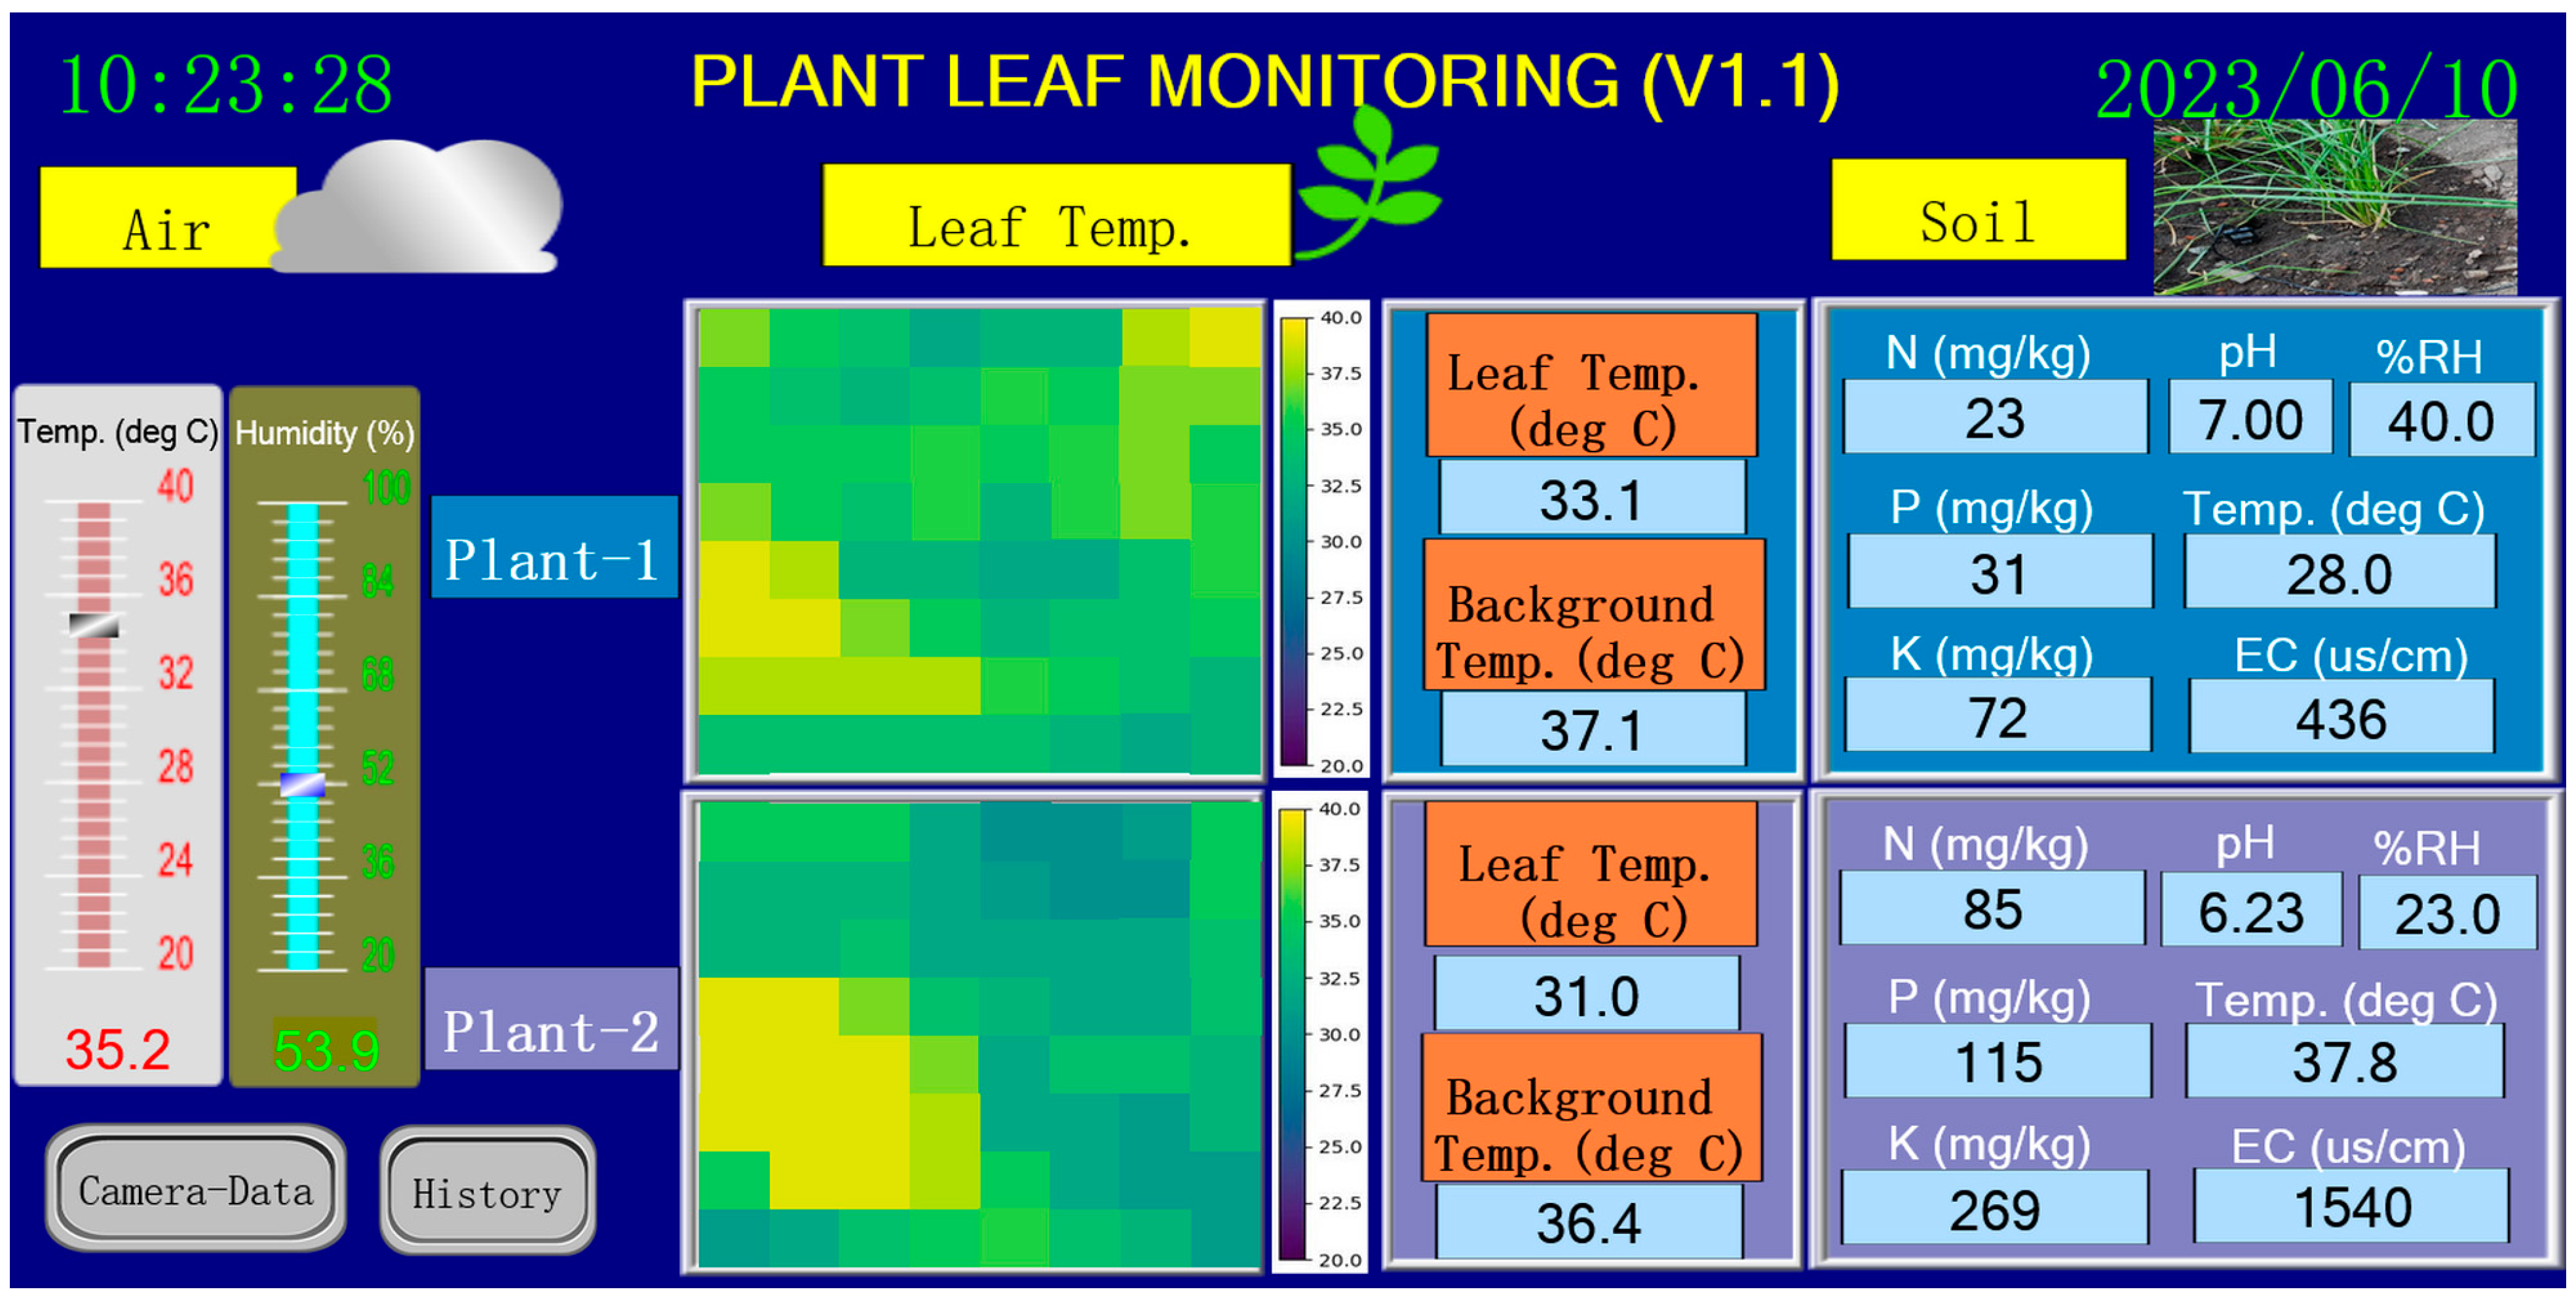
Figure 7 illustrates the arrangement of the proposed plant monitoring system hardware, where the left figure shows the air parameter sensor and thermal camera sensors, and the right figure shows the soil sensors. The left figure shows the distance between thermal camera #1 and thermal camera #2 is 27 cm. The RS485 to WiFi converter, air sensor, and thermal camera sensor are attached on one plate. Thus, it is easy to arrange each sensor unit for directing to the object/plant. Each RS485 to WiFi converter is connected to the soil sensor shown in the right figure (the cable is not shown). As described earlier, the sensor for air parameters (DHT22) is placed on the Plant-1 unit. The figure shows that the DHT22 sensor measures the air temperature in the monitored area, including Plant-1 and Plant-2.
The mechanical system of the sensor unit is designed so that every unit can be moved downward and upward to adjust with the plant position. The height of the sensor unit can be adjusted using the tripod rod. In this work, the distance between both sensors unit is fixed, even though it could be designed as adjustable or separable. Provided with the soil sensor is a long cable for connecting the RS485 to the WiFi converter. Thus, it can be flexibly inserted into the soil in the pot or polybag. Since the soil sensor is waterproof, the plant can be watered without pulling the sensor out.
The experimental setup for real-time monitoring is illustrated in Figure 8, where the left and right figures show the front and rear views of the instrument, respectively. Plant-1 is Dieffenbachia planted on the typical soil placed in a pot. Plant-2 is Vetiveria zizanioides planted on fertilizer soil placed in a polybag. As shown in the figures, the vertical position of the plants is below the sensors; thus, the sensors are directed 30° downward. This arrangement causes the objects captured by the thermal camera to be the leaf, soil, pot, and concrete, as discussed earlier.
Since the thermal camera detects the thermal energy of an object instead of the visual appearance, the alignment of the camera position is conducted as follows. The alignment process is conducted at night, when the ambient temperature is about 25 °C. We then place a bulb light in front of the plants and observe the position of the hotter object (bulb light) in the thermal images. In this way, the leaf area in the image can be estimated, and then positioned in the center of the image by aligning the thermal camera. Figure 9a,b show the thermal camera alignment for Plant-1 and Plant-2, respectively. The figures on the left side show the actual positions of bulb lamps in plants, while figures on the right side show their positions in the thermal images as denoted with the red circles.

3.2. HMI Dashboard

Figure 10 shows the appearance of the main menu display used for real-time plant monitoring. It consists of three main monitoring parts:
  • The left part shows air monitoring.
  • The center part shows leaf temperature monitoring.
  • The right part shows soil monitoring.
The air monitoring part displays the air temperature and humidity measured by the DHT22 sensor. These parameters are shown in the numerical display and animated gauge for easy monitoring.
The leaf temperature and soil monitoring parts show the monitoring parameters of Plant-1 and Plant-2. The leaf temperature monitoring part consists of the thermal image visualization and the numerical displays of the leaf and background temperature. Our main contribution is the visualization of the thermal image that does not use standard image transmission. Instead, a Modbus TCP is employed to transmit 64 pixels of the thermal camera. In the Haiwell Cloud SCADA software, the 64 pixels (8 × 8 pixels) are visualized using the image components, whose colors change according to the particular state. The state represents the temperature, where the number of states is limited to only twenty states (colors) for practical programming. The temperature value ranges from 20 to 40 °C and is visualized using purple to yellow colors, as shown in Figure 10. The thermal images in Figure 10 show that the leaf areas denoted in Figure 9 appear greenish, while the background is yellowish. This indicates that the leaf temperature is warmer than the background. The calculated leaf and background temperatures are shown on the right sides of the thermal images in Figure 10. Plant-1’s leaf and background temperatures are 33.1 and 37.1 °C, respectively. Plant-2’s leaf and background temperatures are 31.0 and 36.4 °C, respectively.
The temperature value for all 8 × 8 pixels of each thermal camera is shown in Figure 11, which appears when a “Camera Data” button in the main menu is pressed. The temperature values shown in Figure 11 are the values at the same time as shown in the display in Figure 10. Figure 11 can be used to check and debug the developed HMI program for visualizing the thermal image in Figure 10. Furthermore, Figure 11 helps us determine the plants’ temperature profile under monitoring.
Displayed in the soil monitoring part are the soil parameters (pH, temperature, moisture, EC, and NPK) measured by the JXCT sensor. Plant-1 and Plant-2 soil parameters are displayed on one screen for easy monitoring and comparison. All parameters (air, leaf temperature, soil), including the thermal images in the main menu, are updated every five seconds, which conforms to the execution time in the Raspberry Pi Zero W for processing the sensors. This time interval is fast enough for a real-time plant monitoring system.
The other useful features of HMI are historical trend and data. The historical trend consists of eight displays:
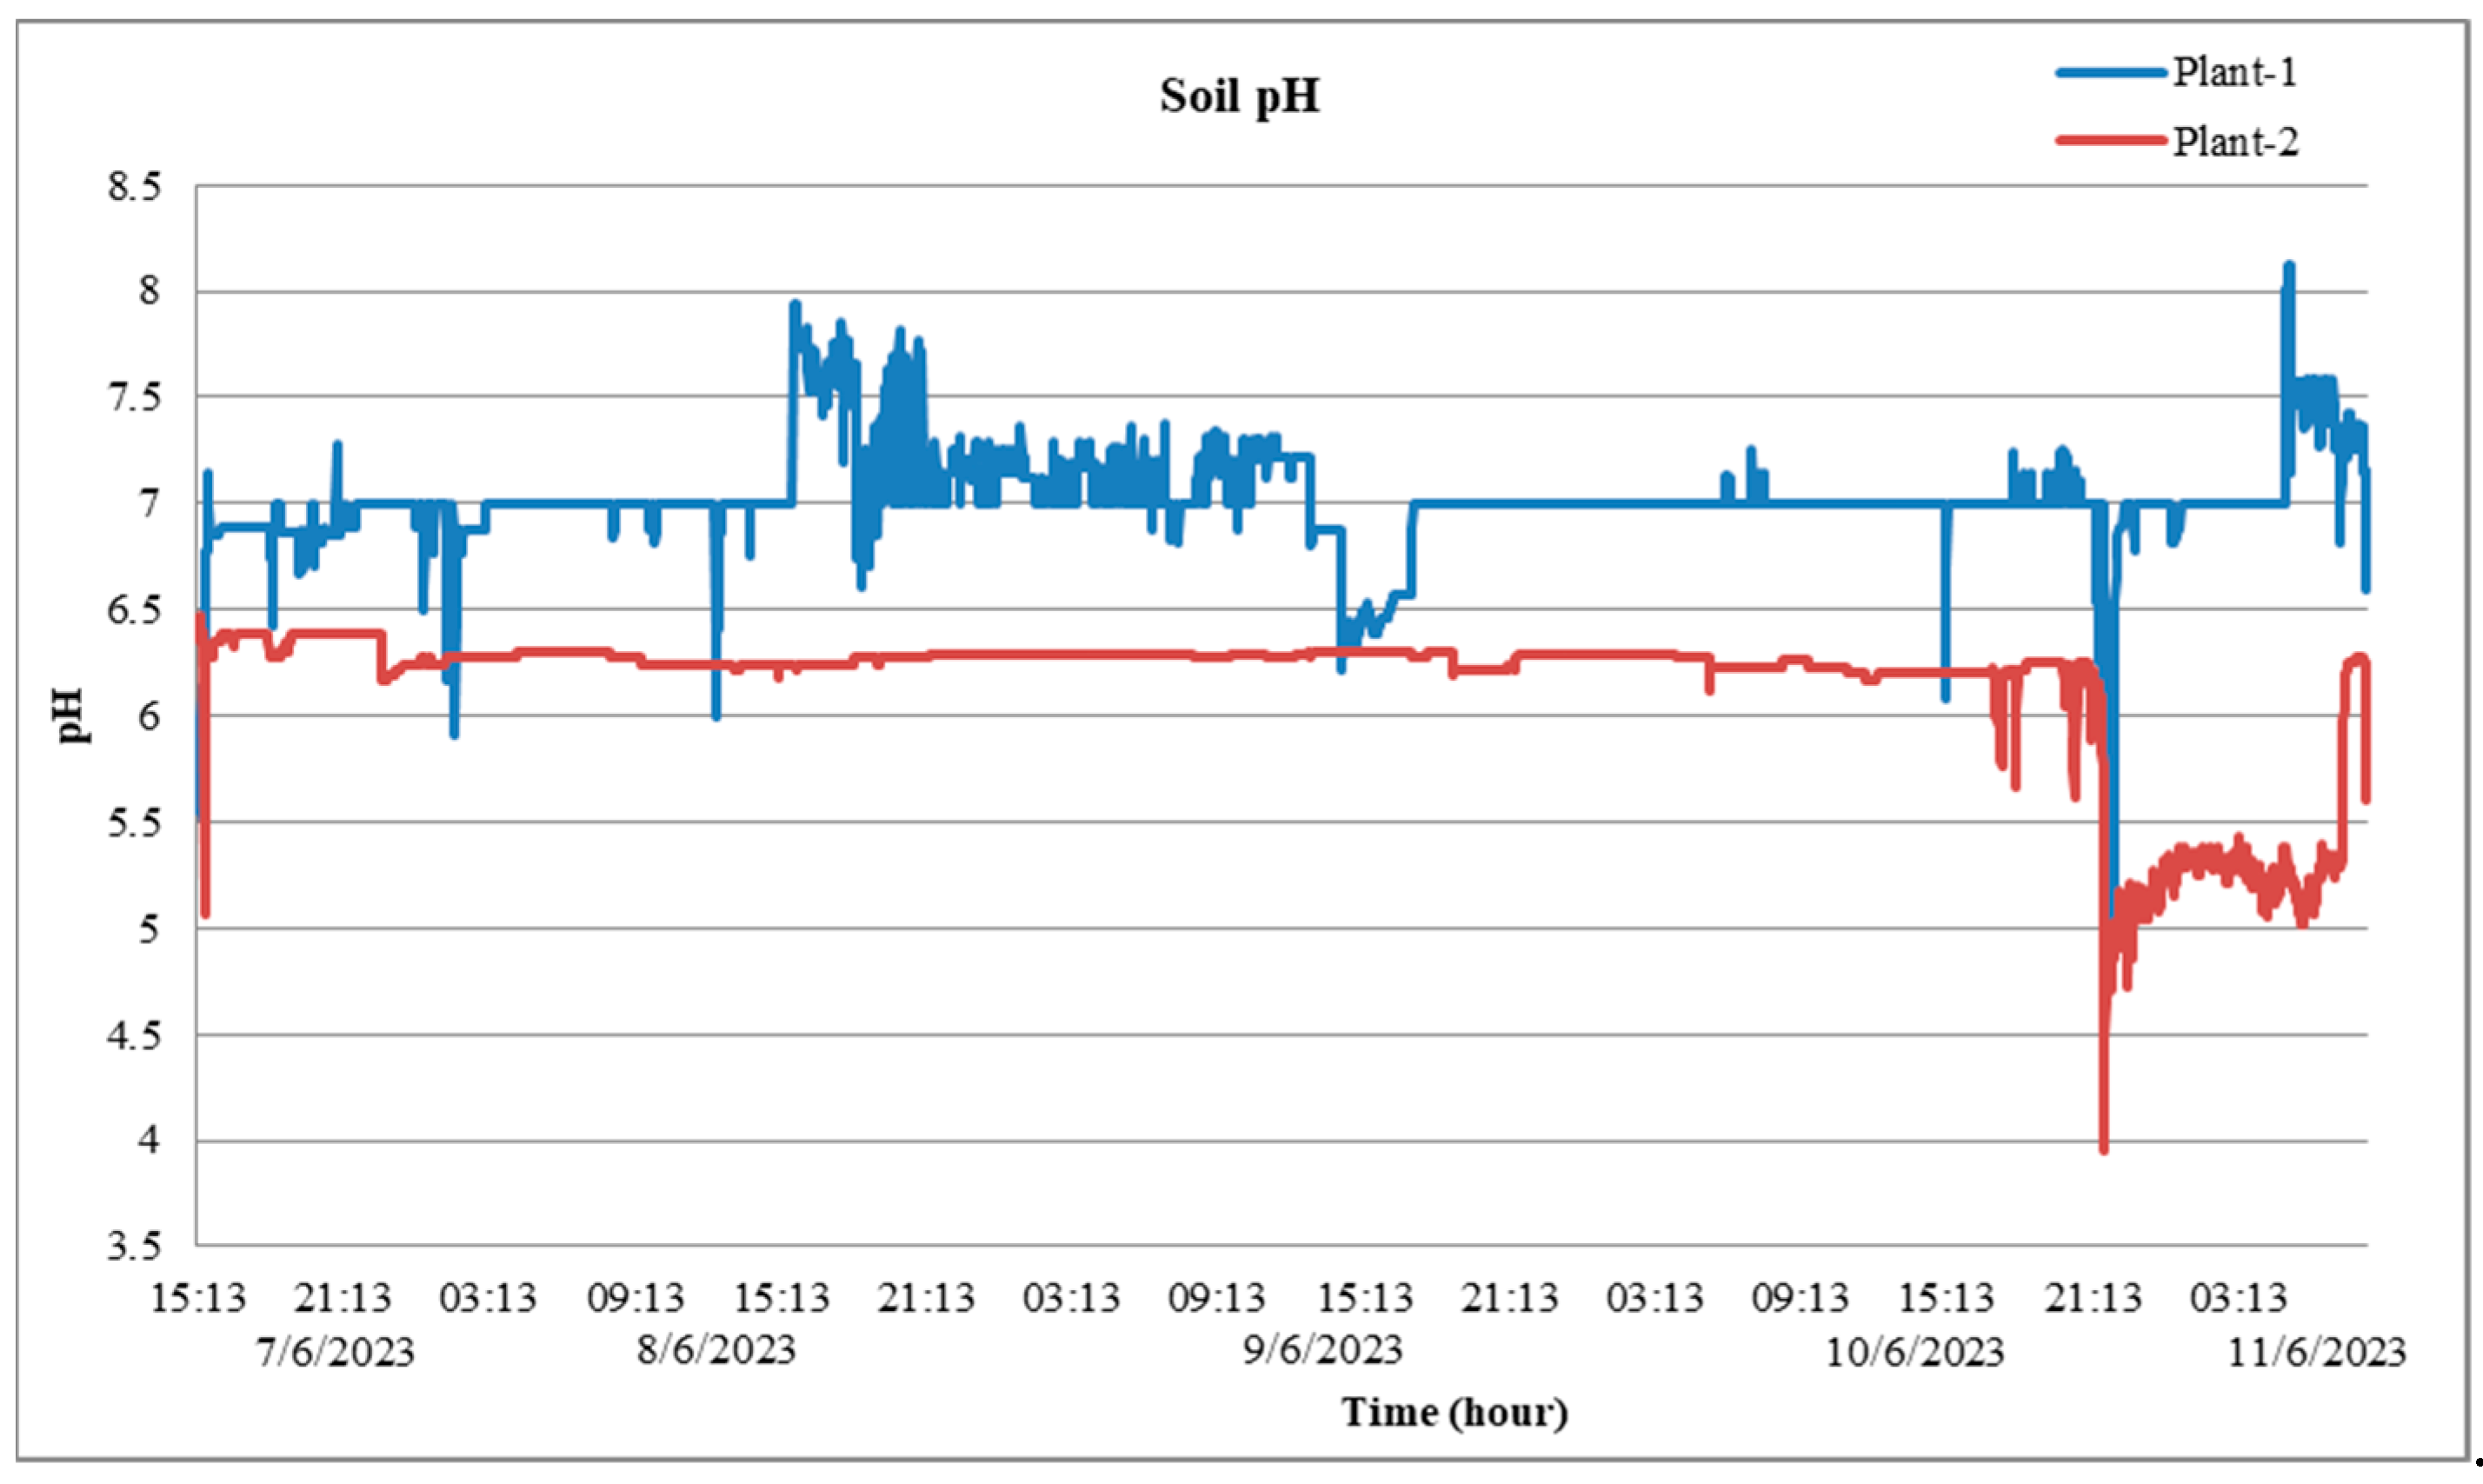
  • Historical trend of soil pH. It displays the trends in soil pH of Plant-1 and Plant-2.
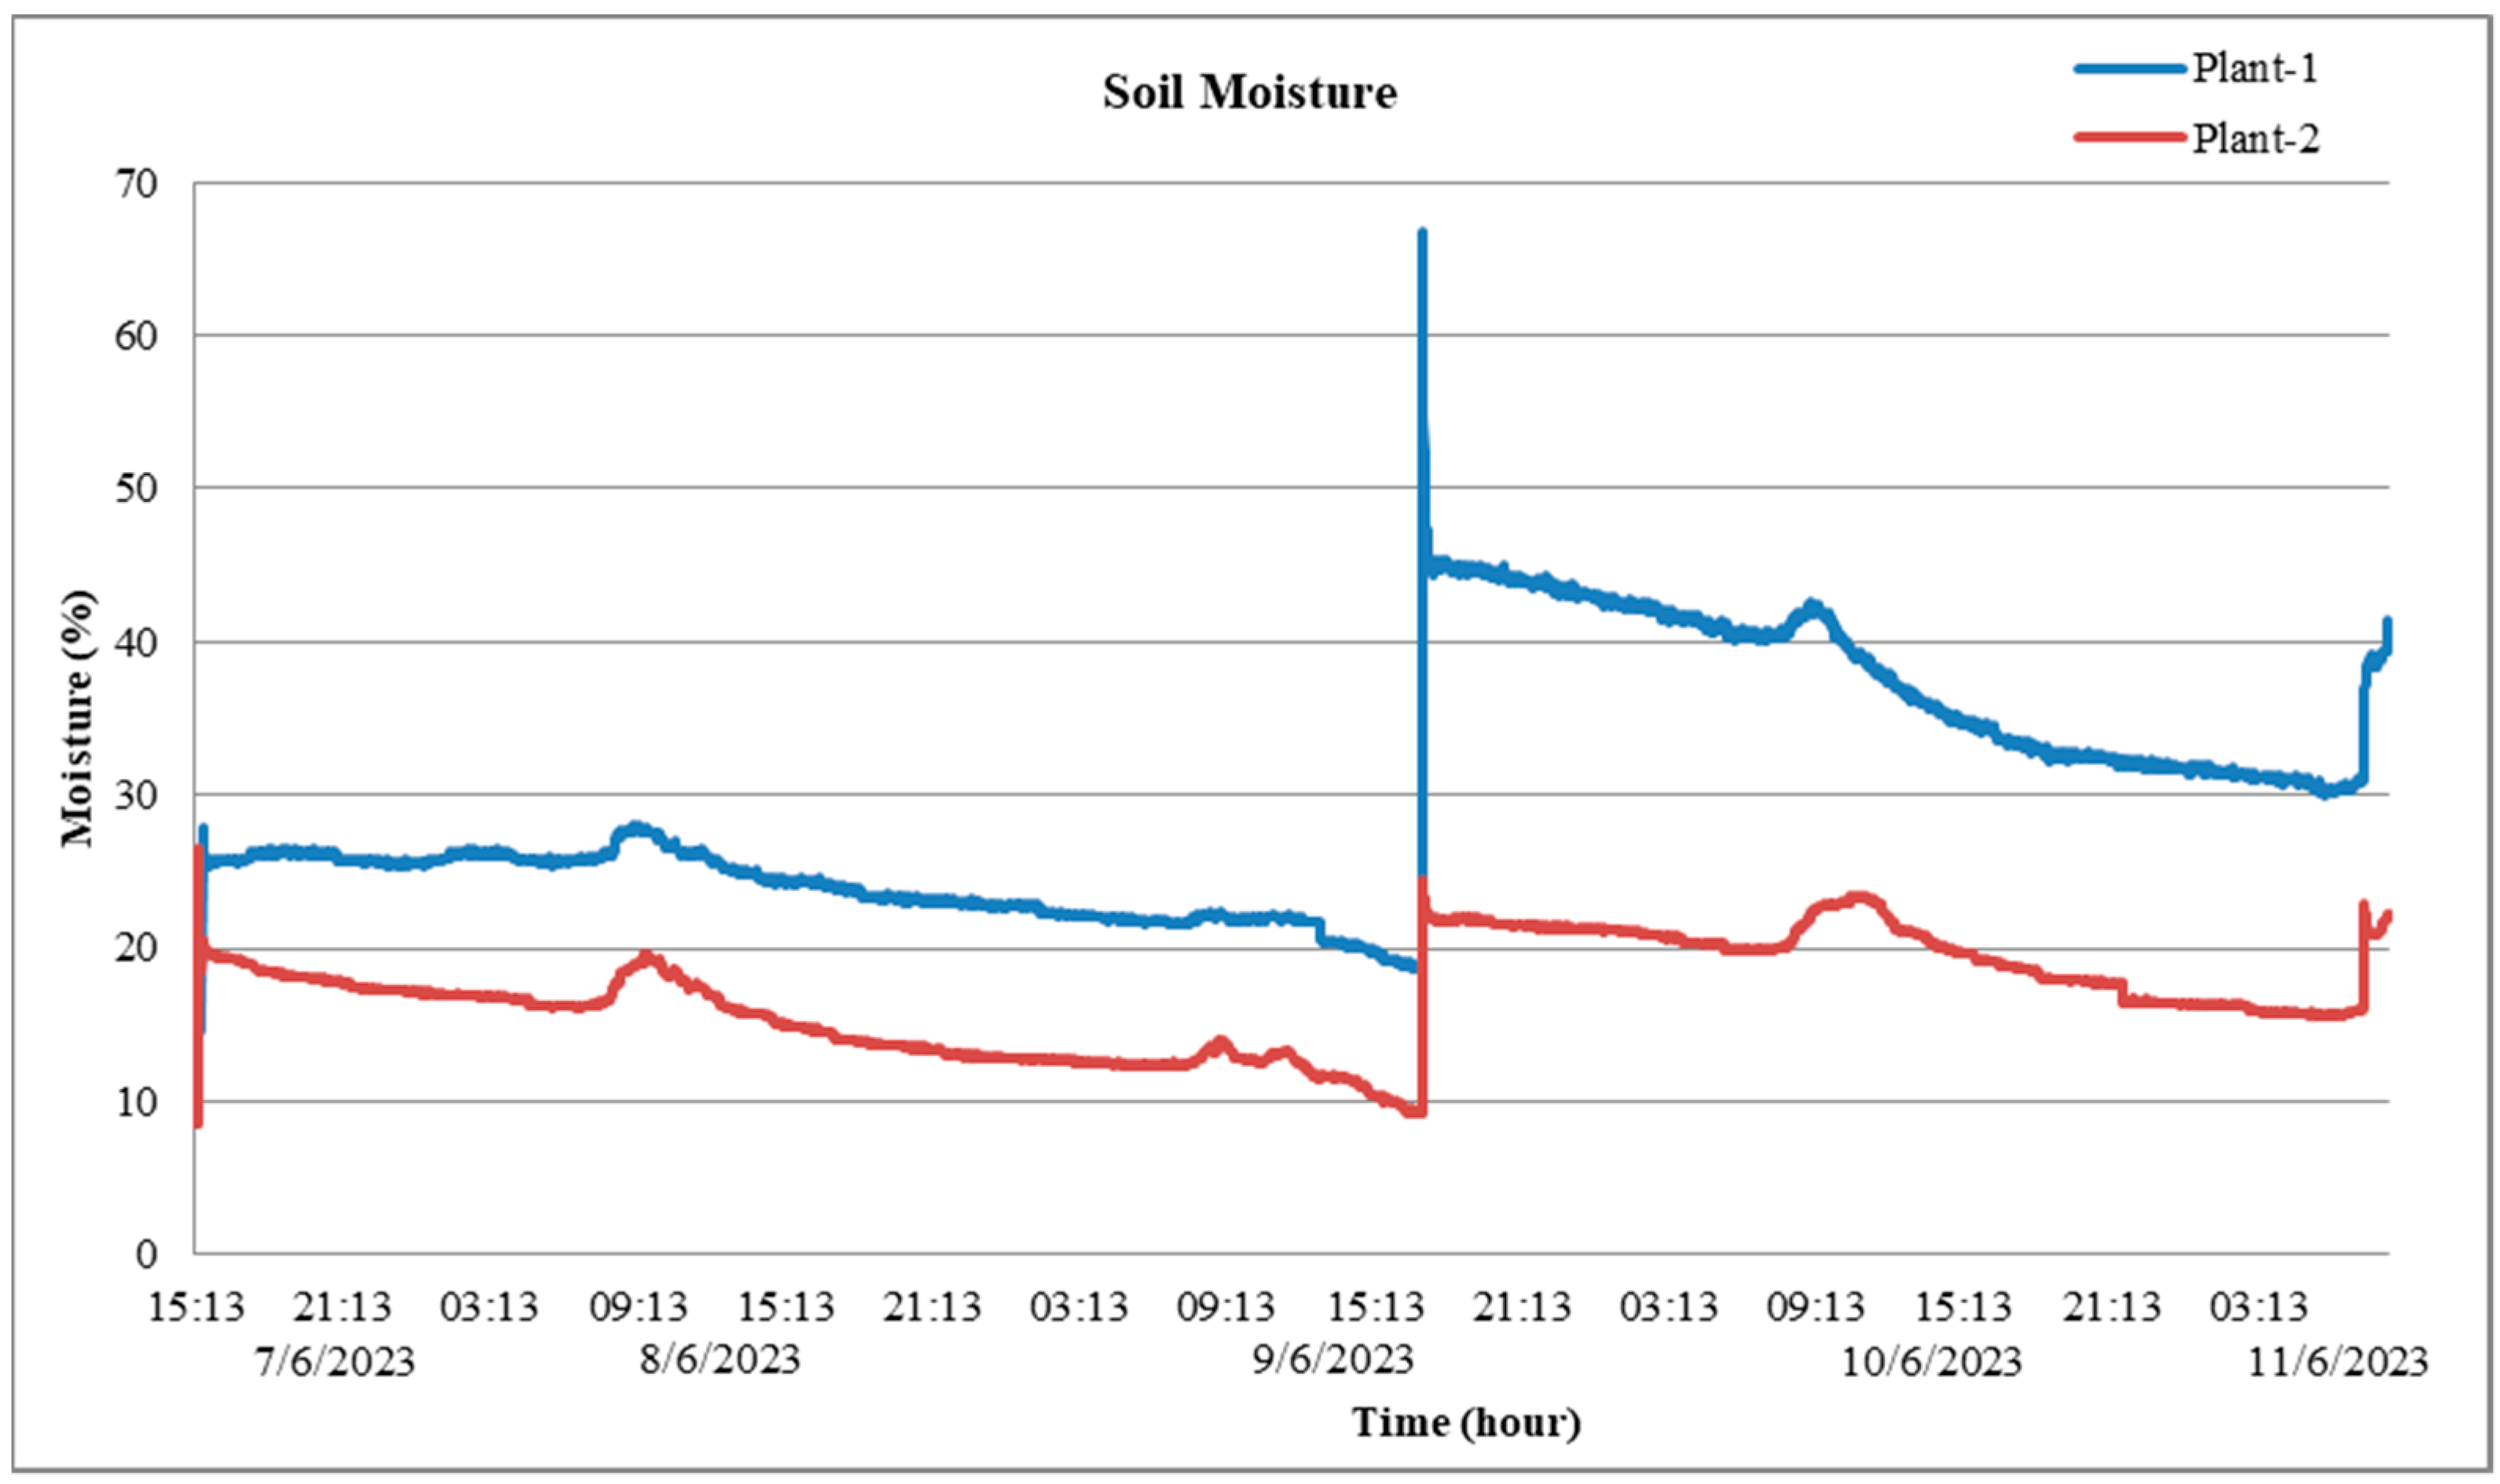
  • Historical trend of soil moisture. It displays the trends in soil moisture of Plant-1 and Plant-2.
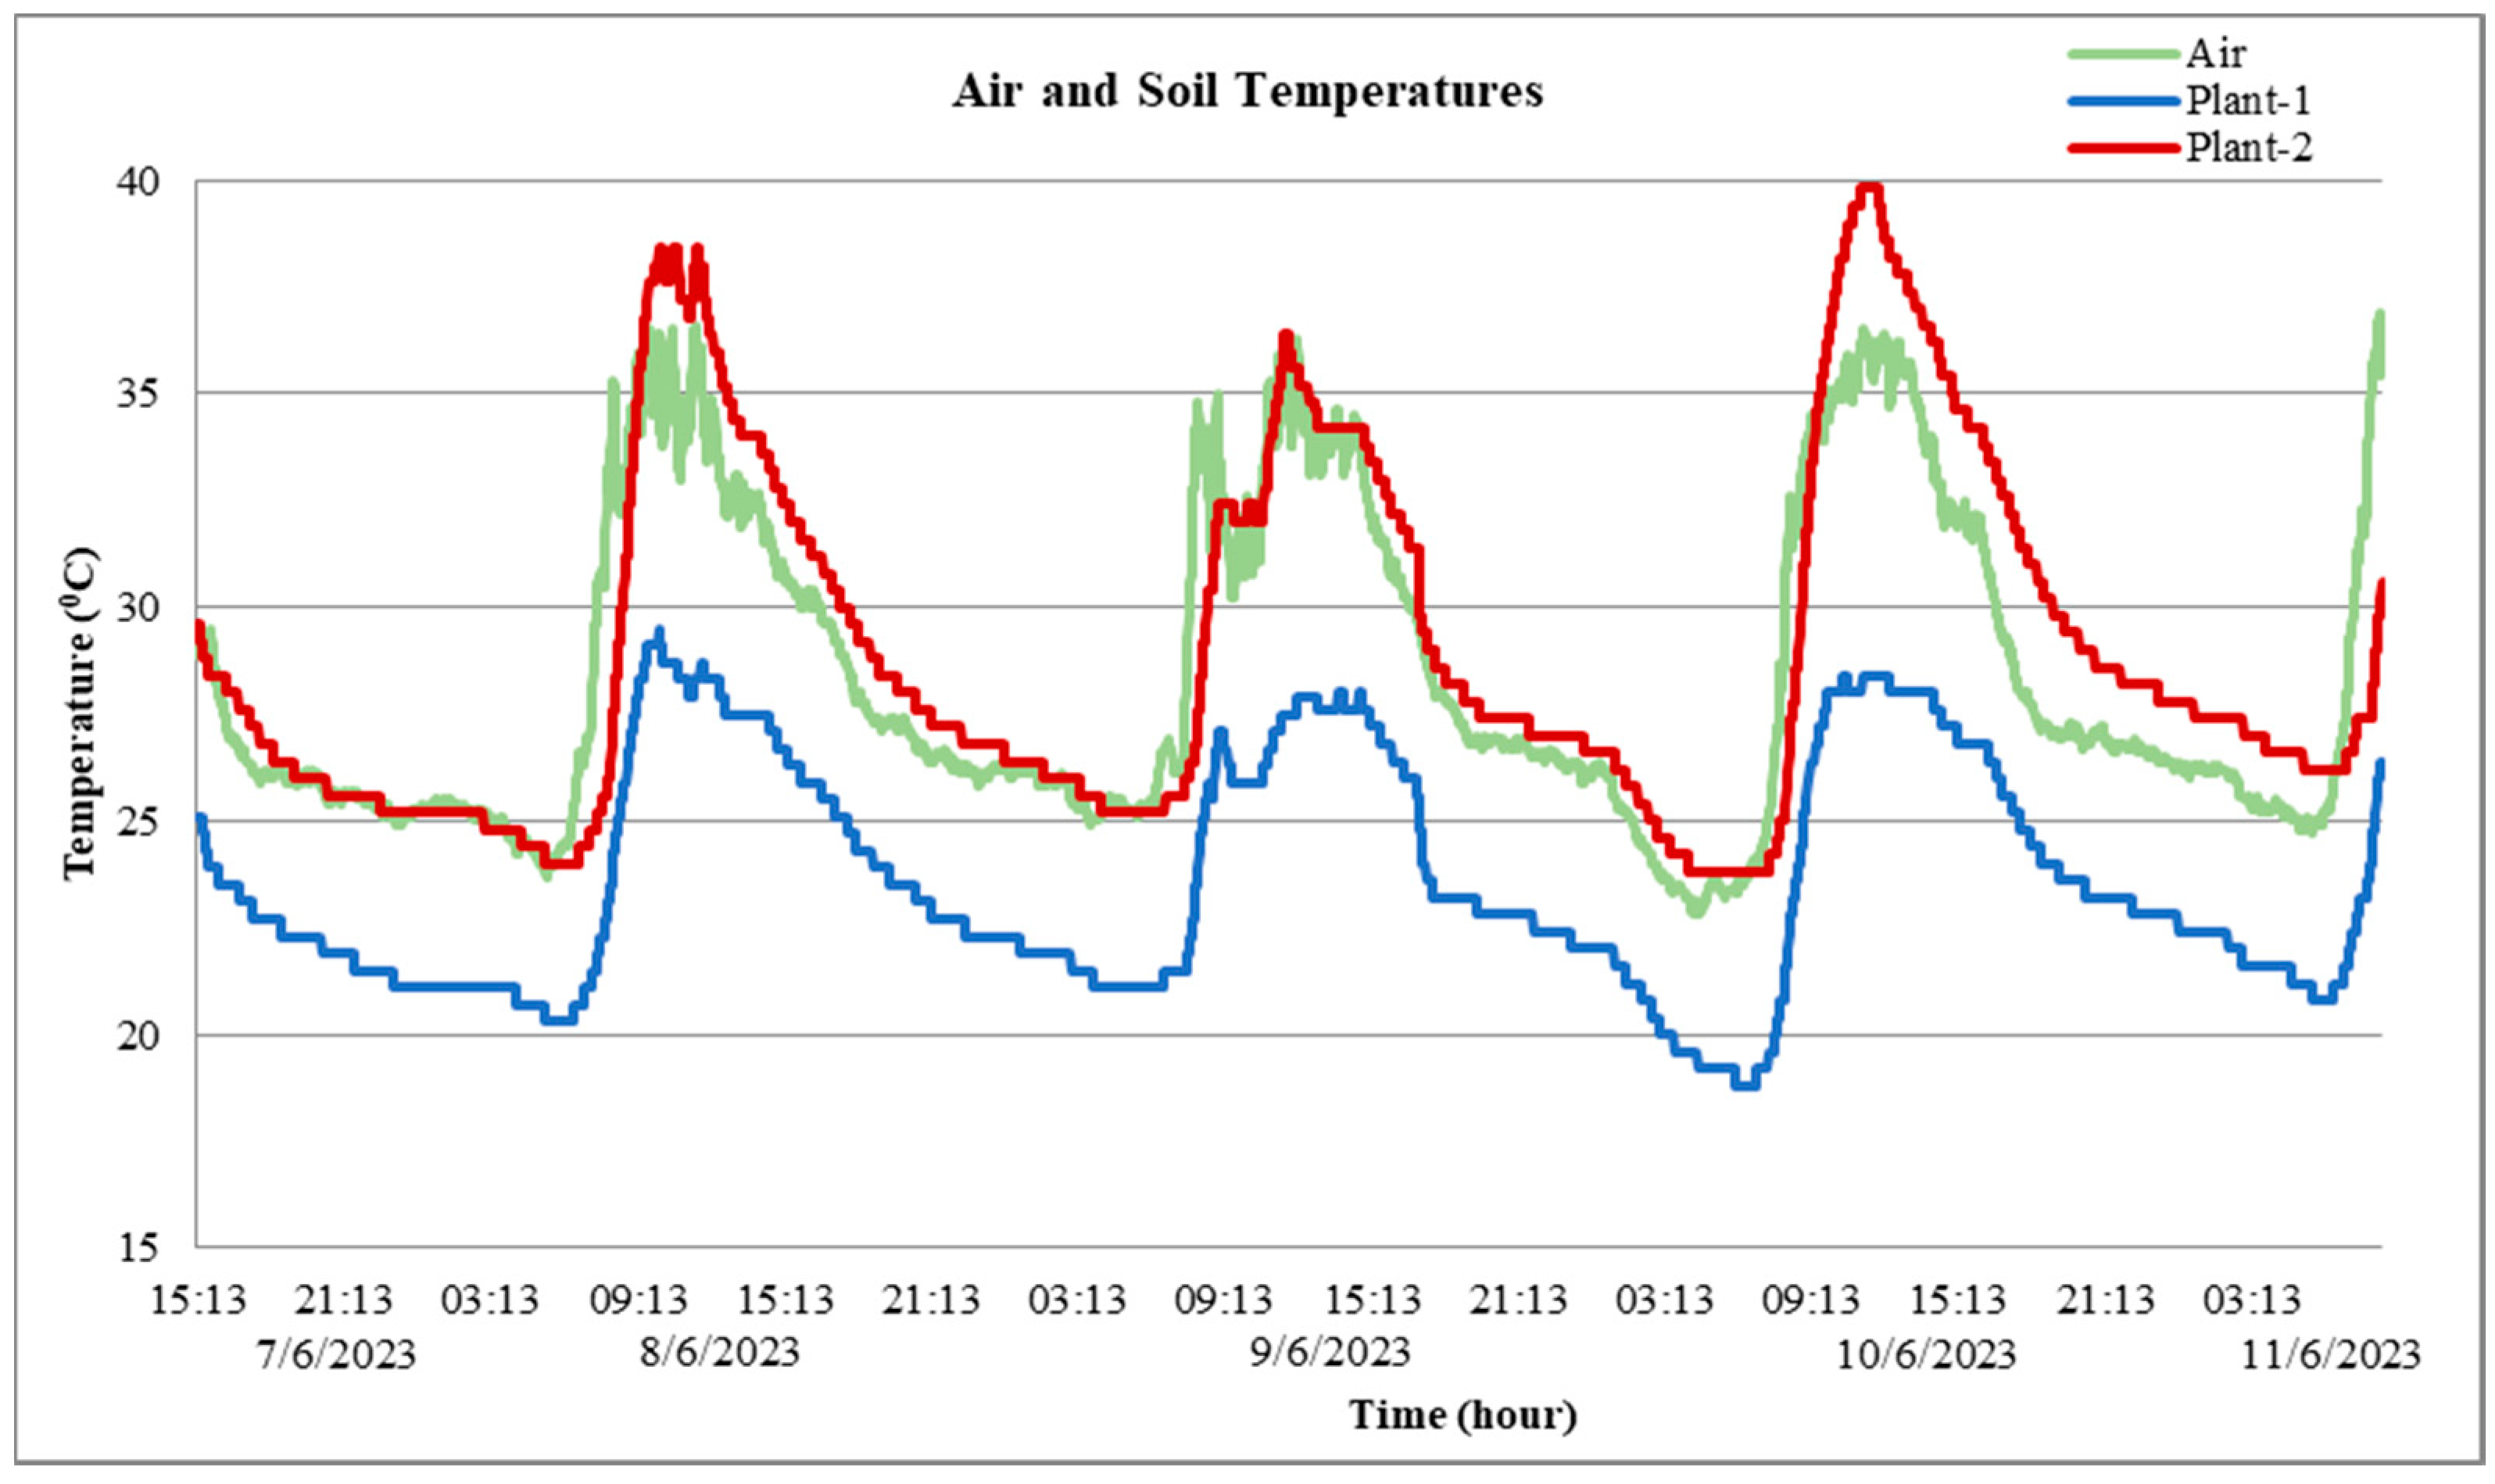
  • Historical trend of soil temperature. It displays the trends in soil temperature of Plant-1 and Plant-2.
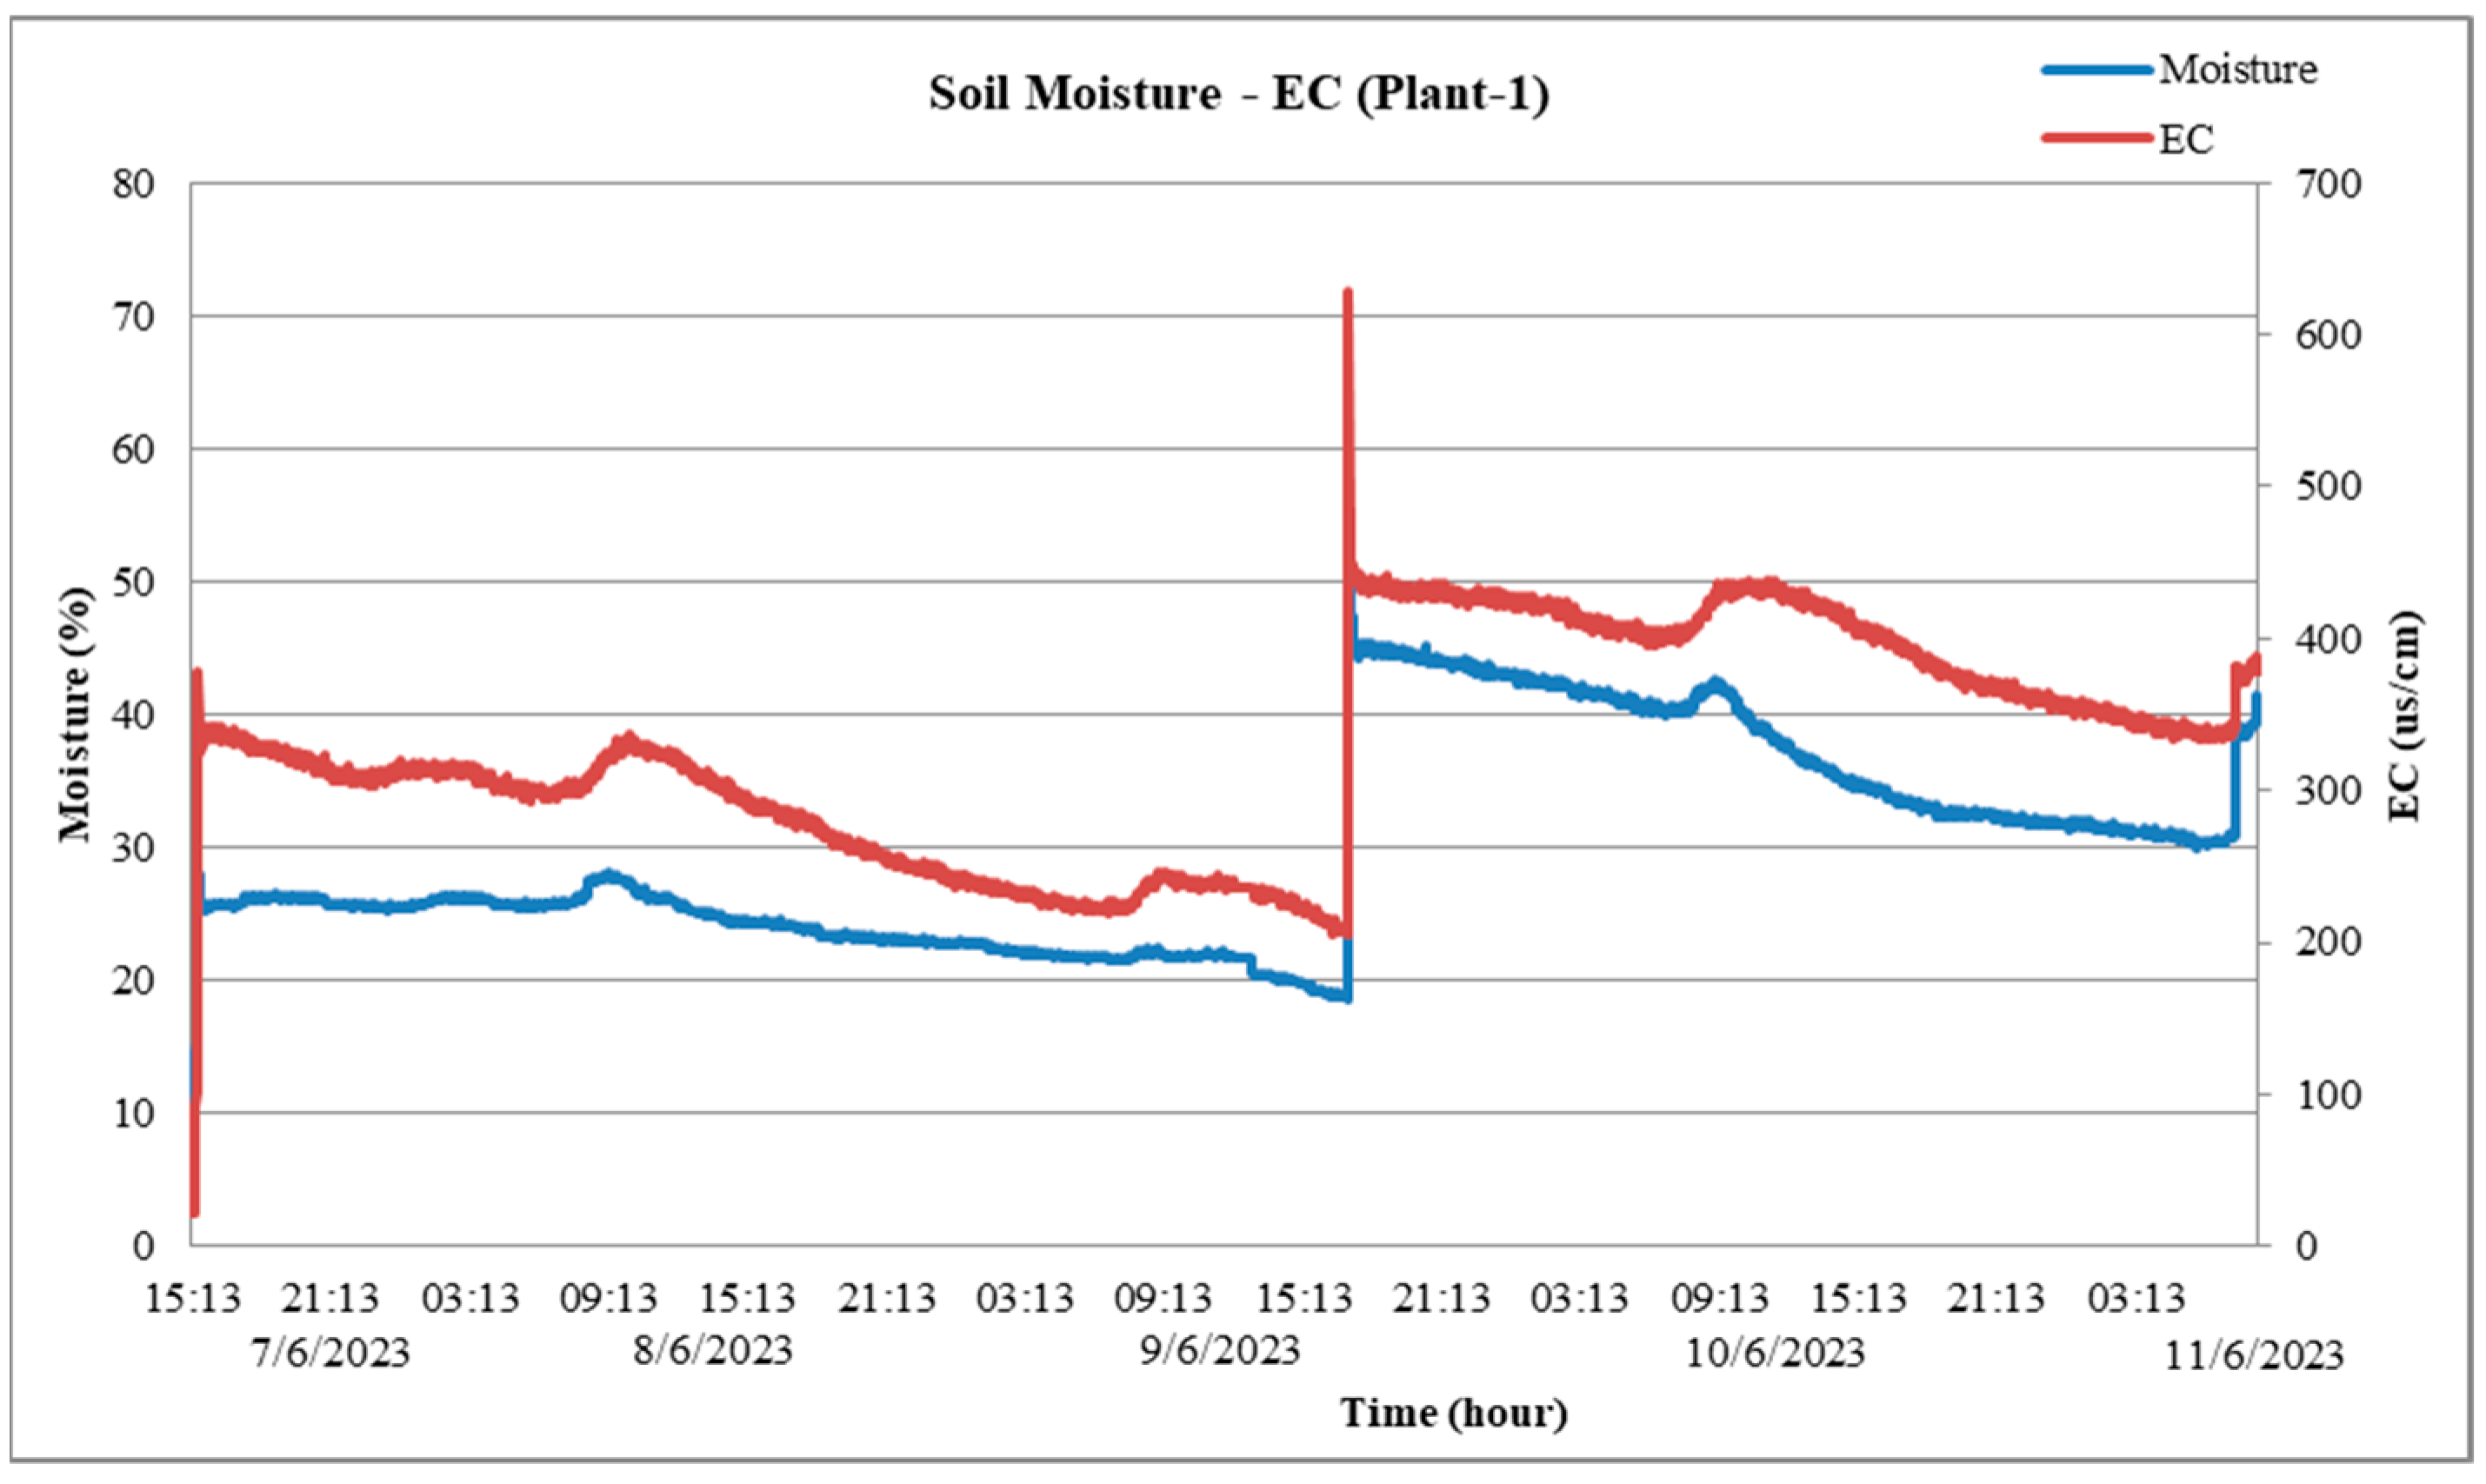
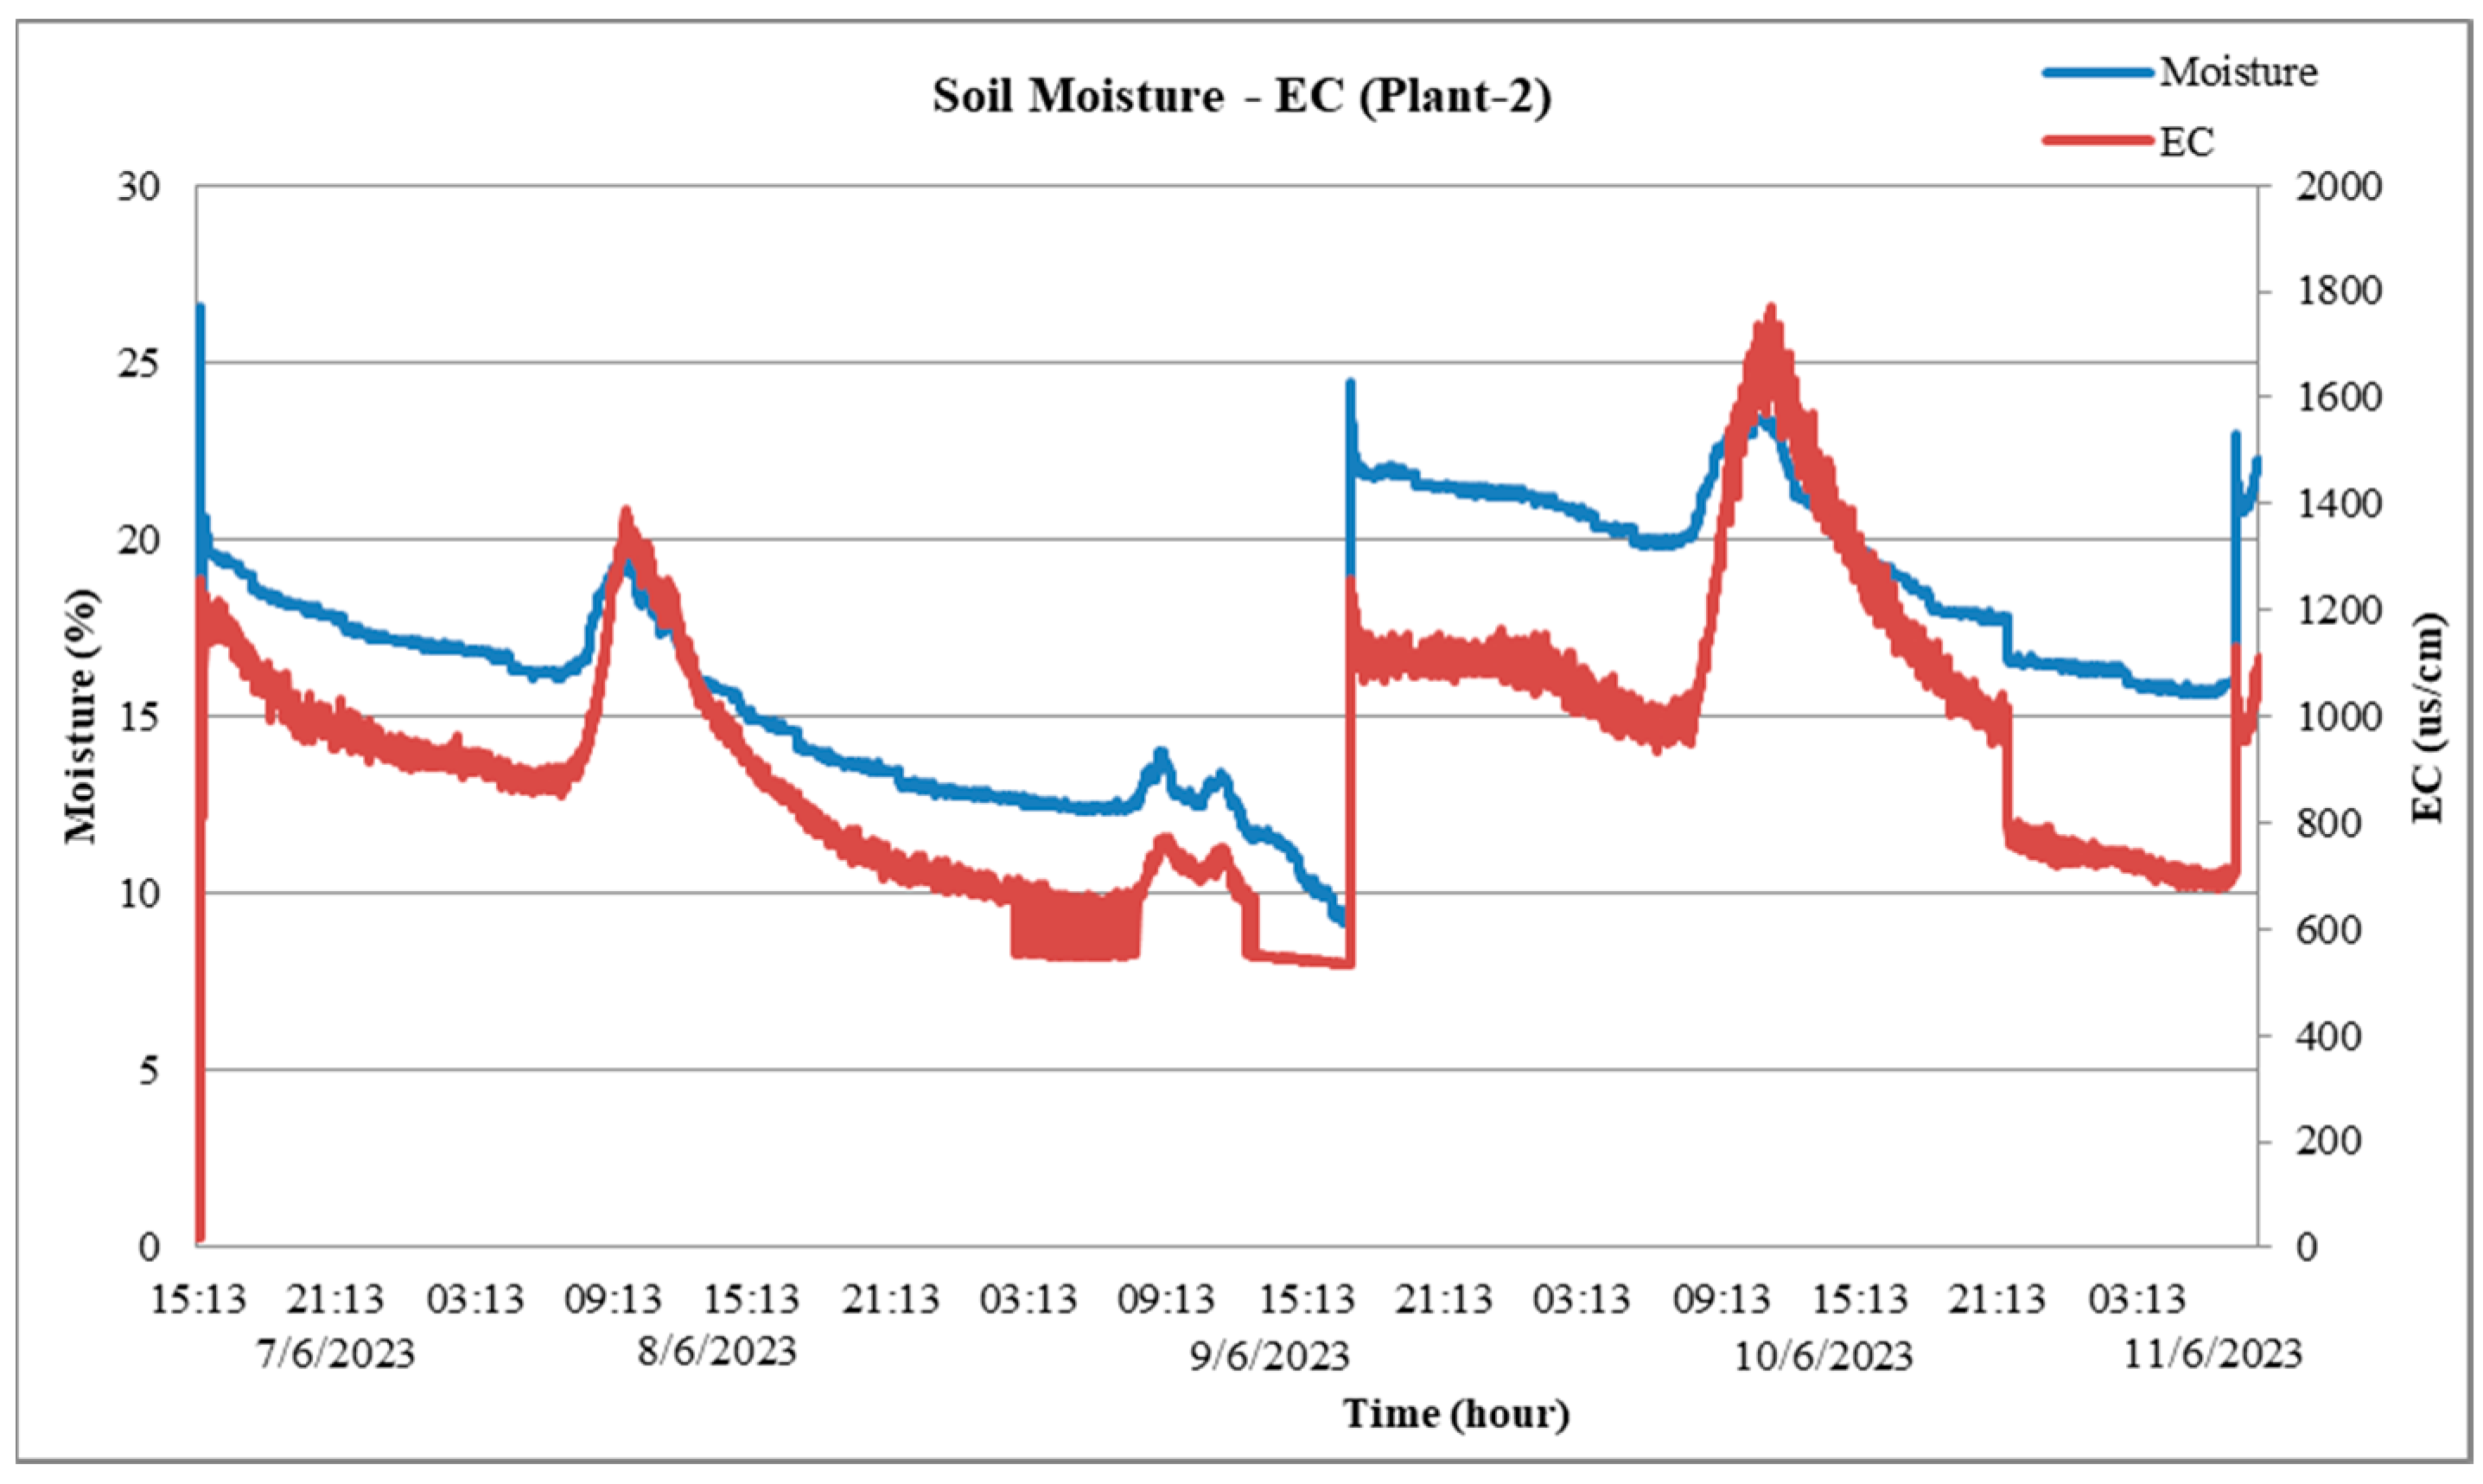
  • Historical trend of soil electrical conductivity (EC). It displays the trends in soil EC of Plant-1 and Plant-2.
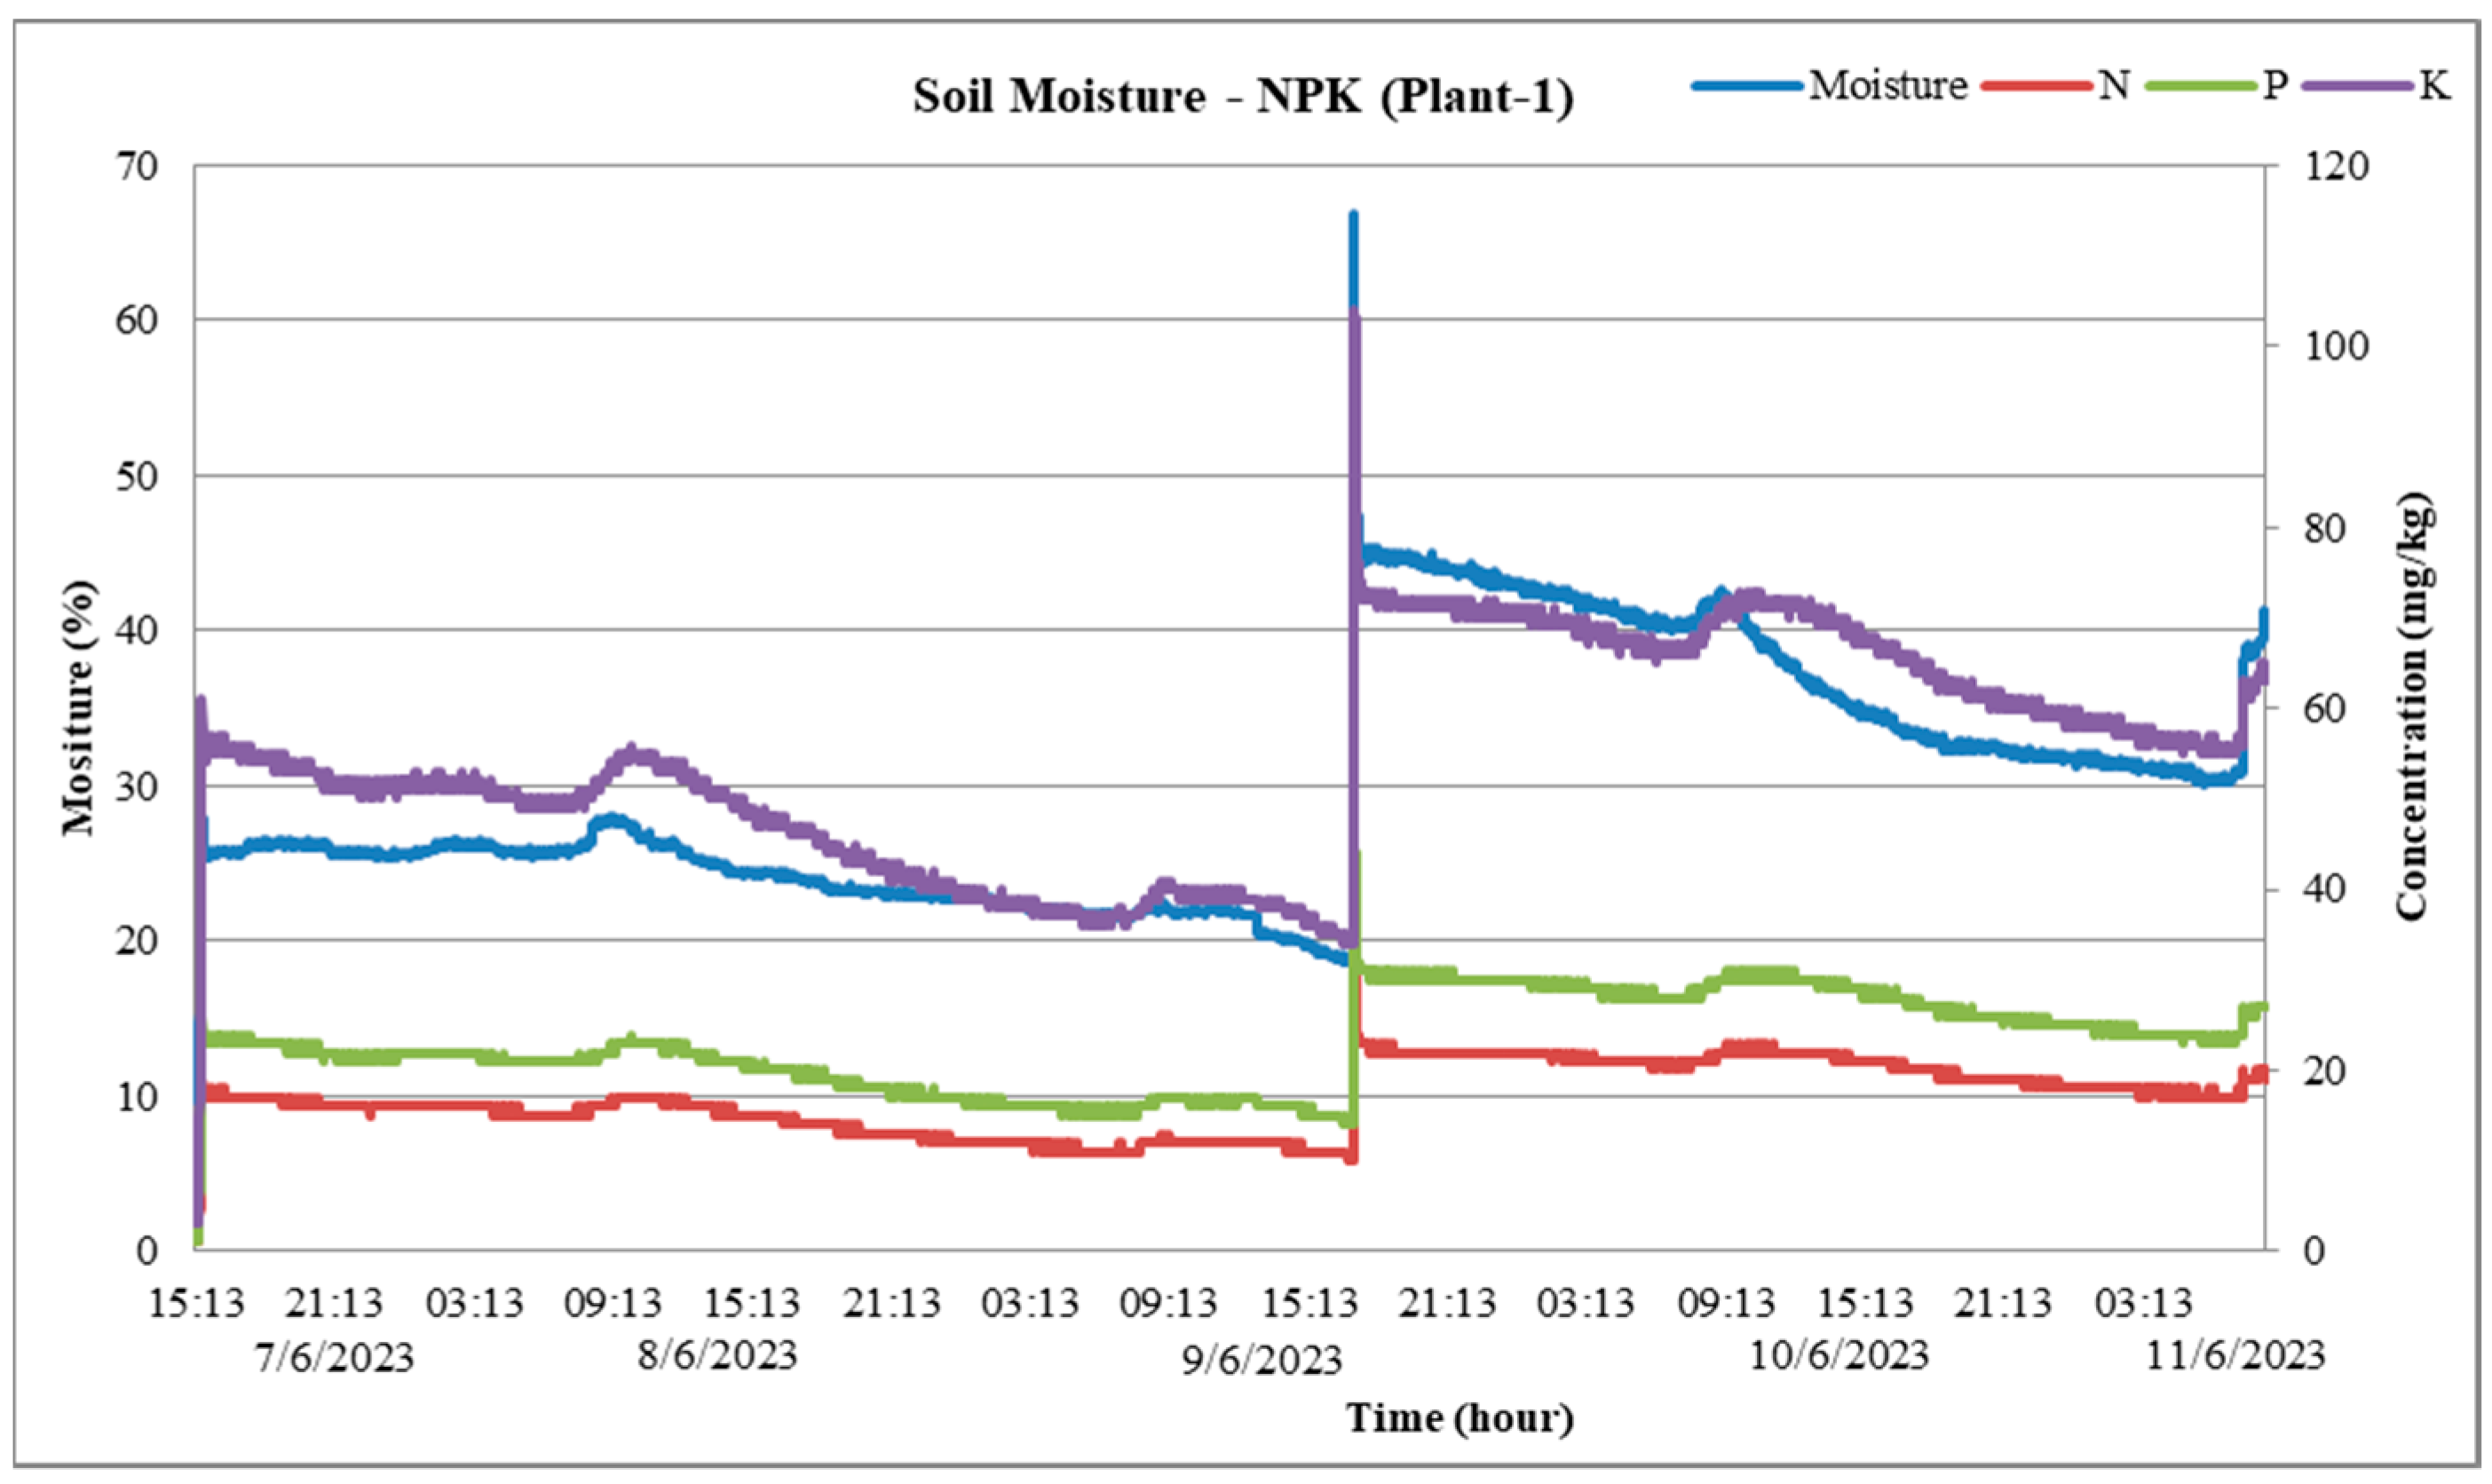
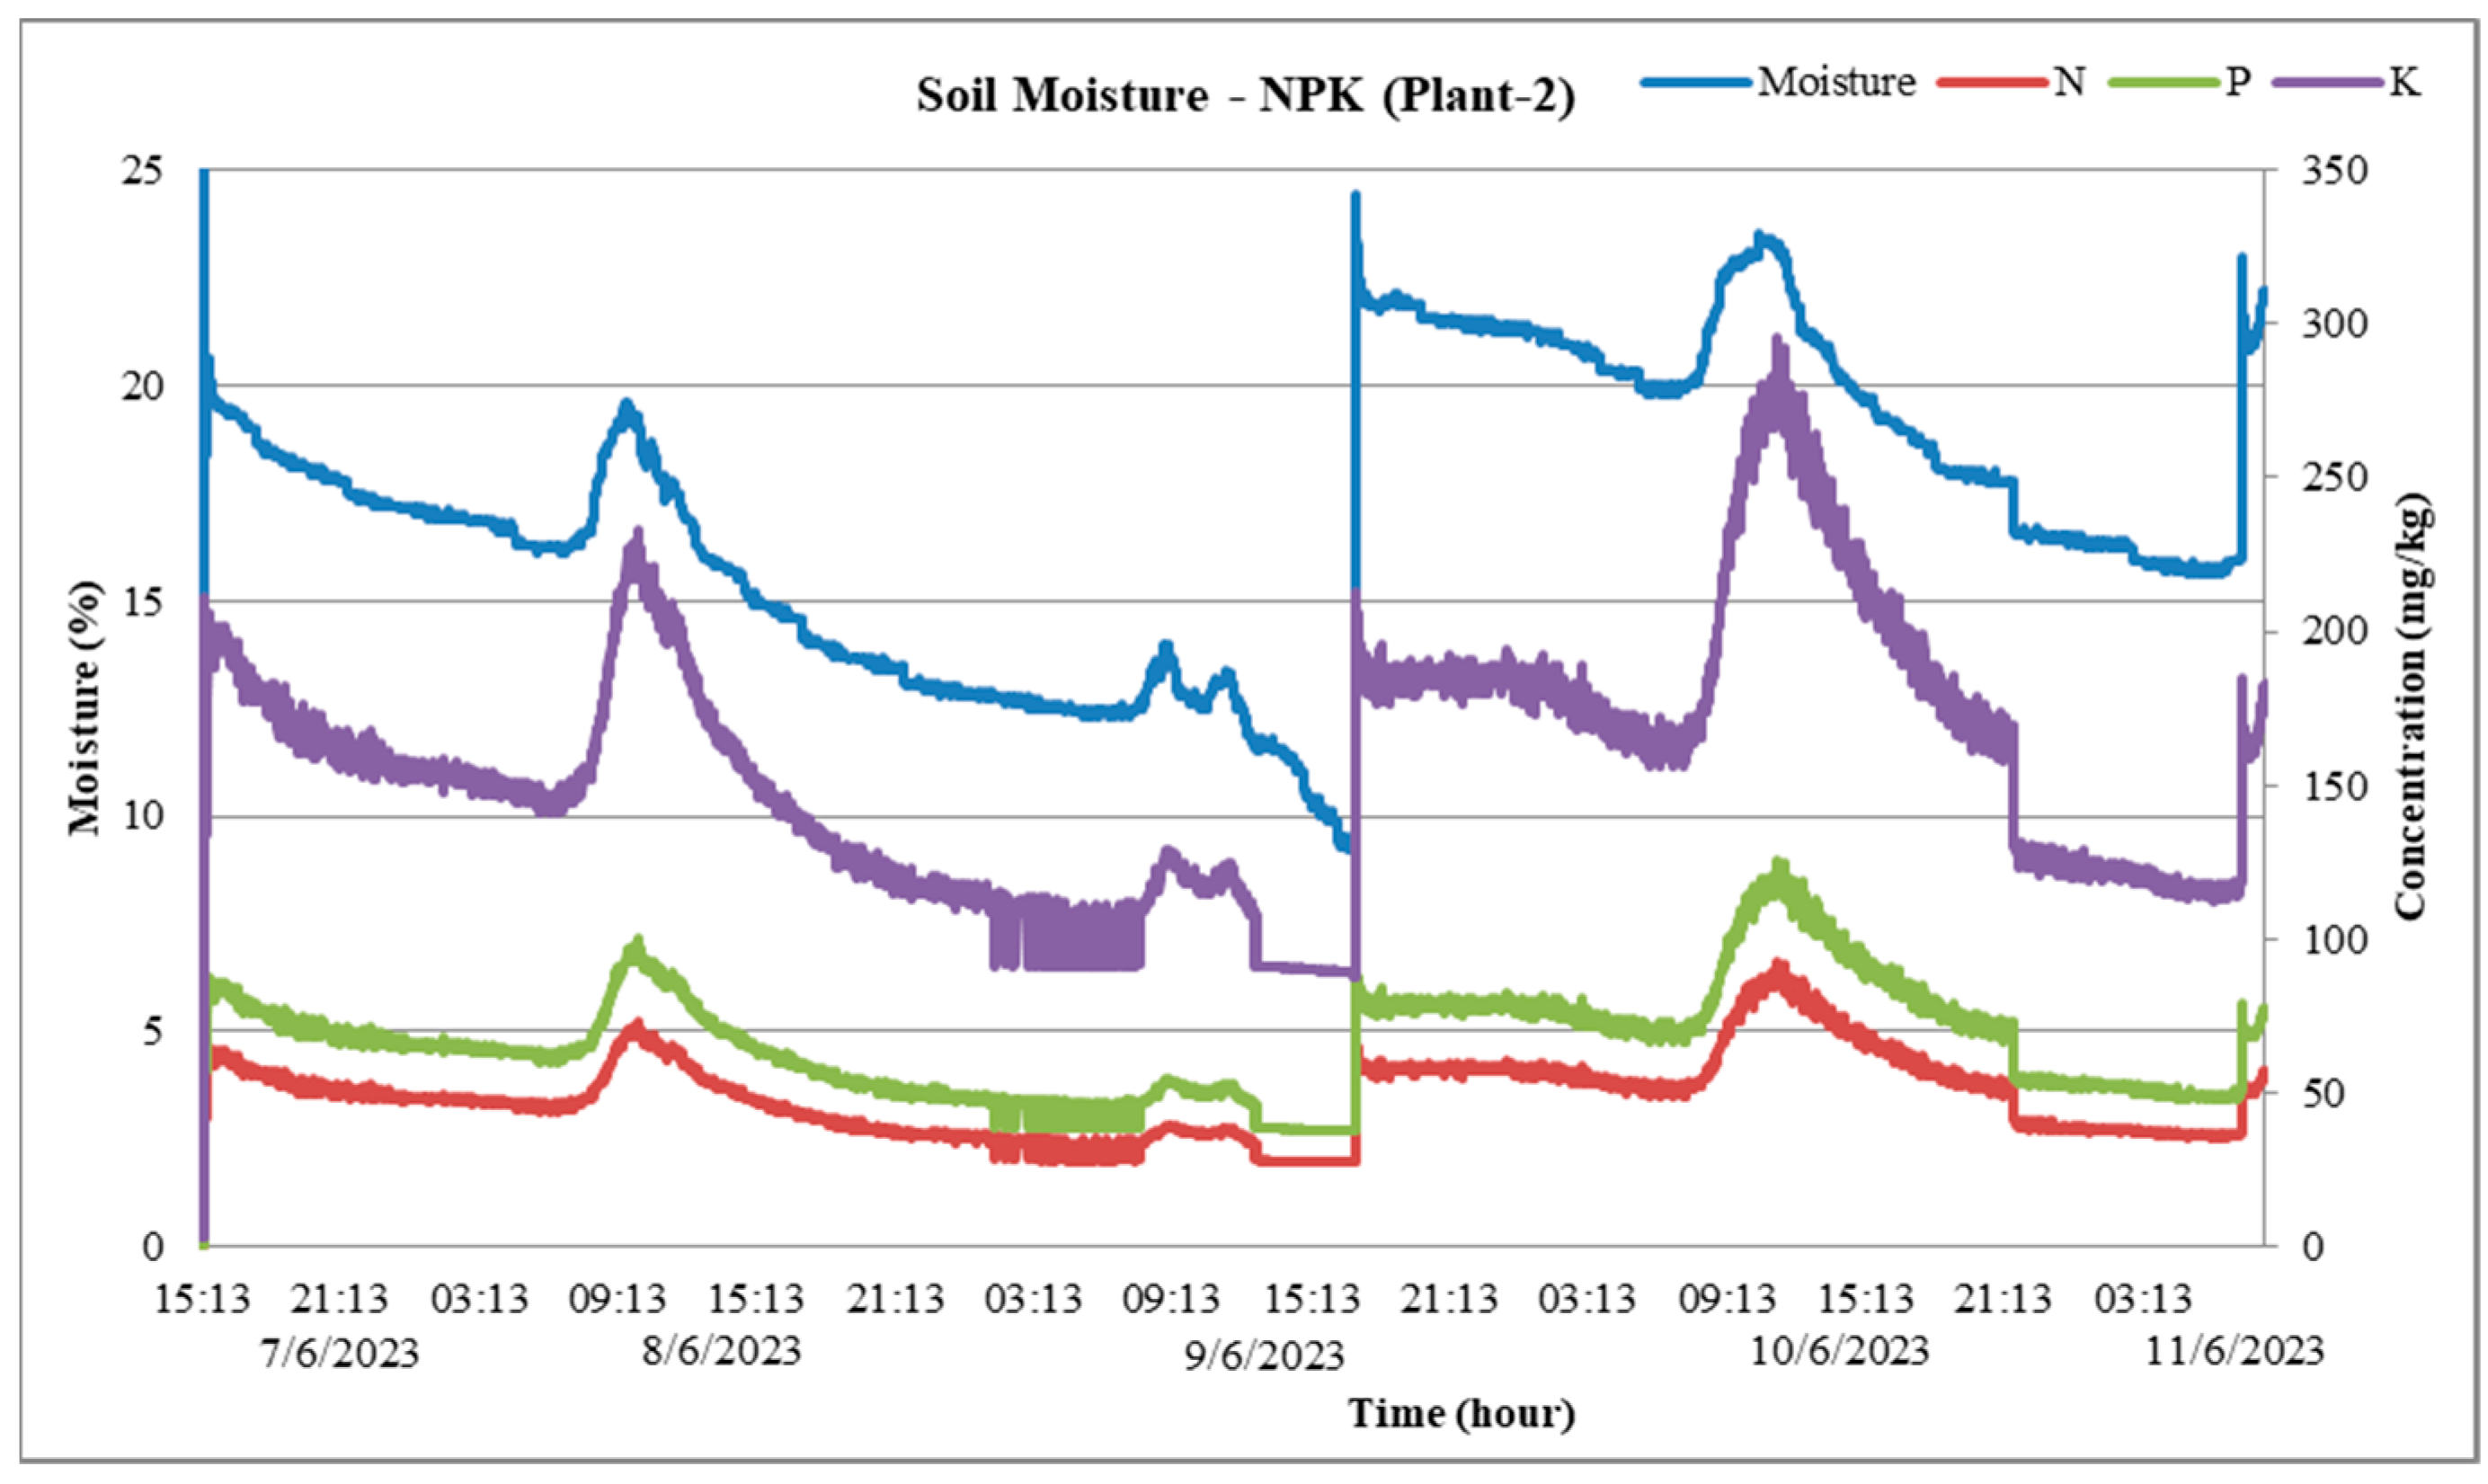
  • Historical trend of soil nitrogen. It displays the trends in soil nitrogen of Plant-1 and Plant-2.
  • Historical trend of soil phosphorous. It displays the trends in soil phosphorous of Plant-1 and Plant-2.
  • Historical trend of soil potassium. It displays the trends in soil potassium of Plant-1 and Plant-2.
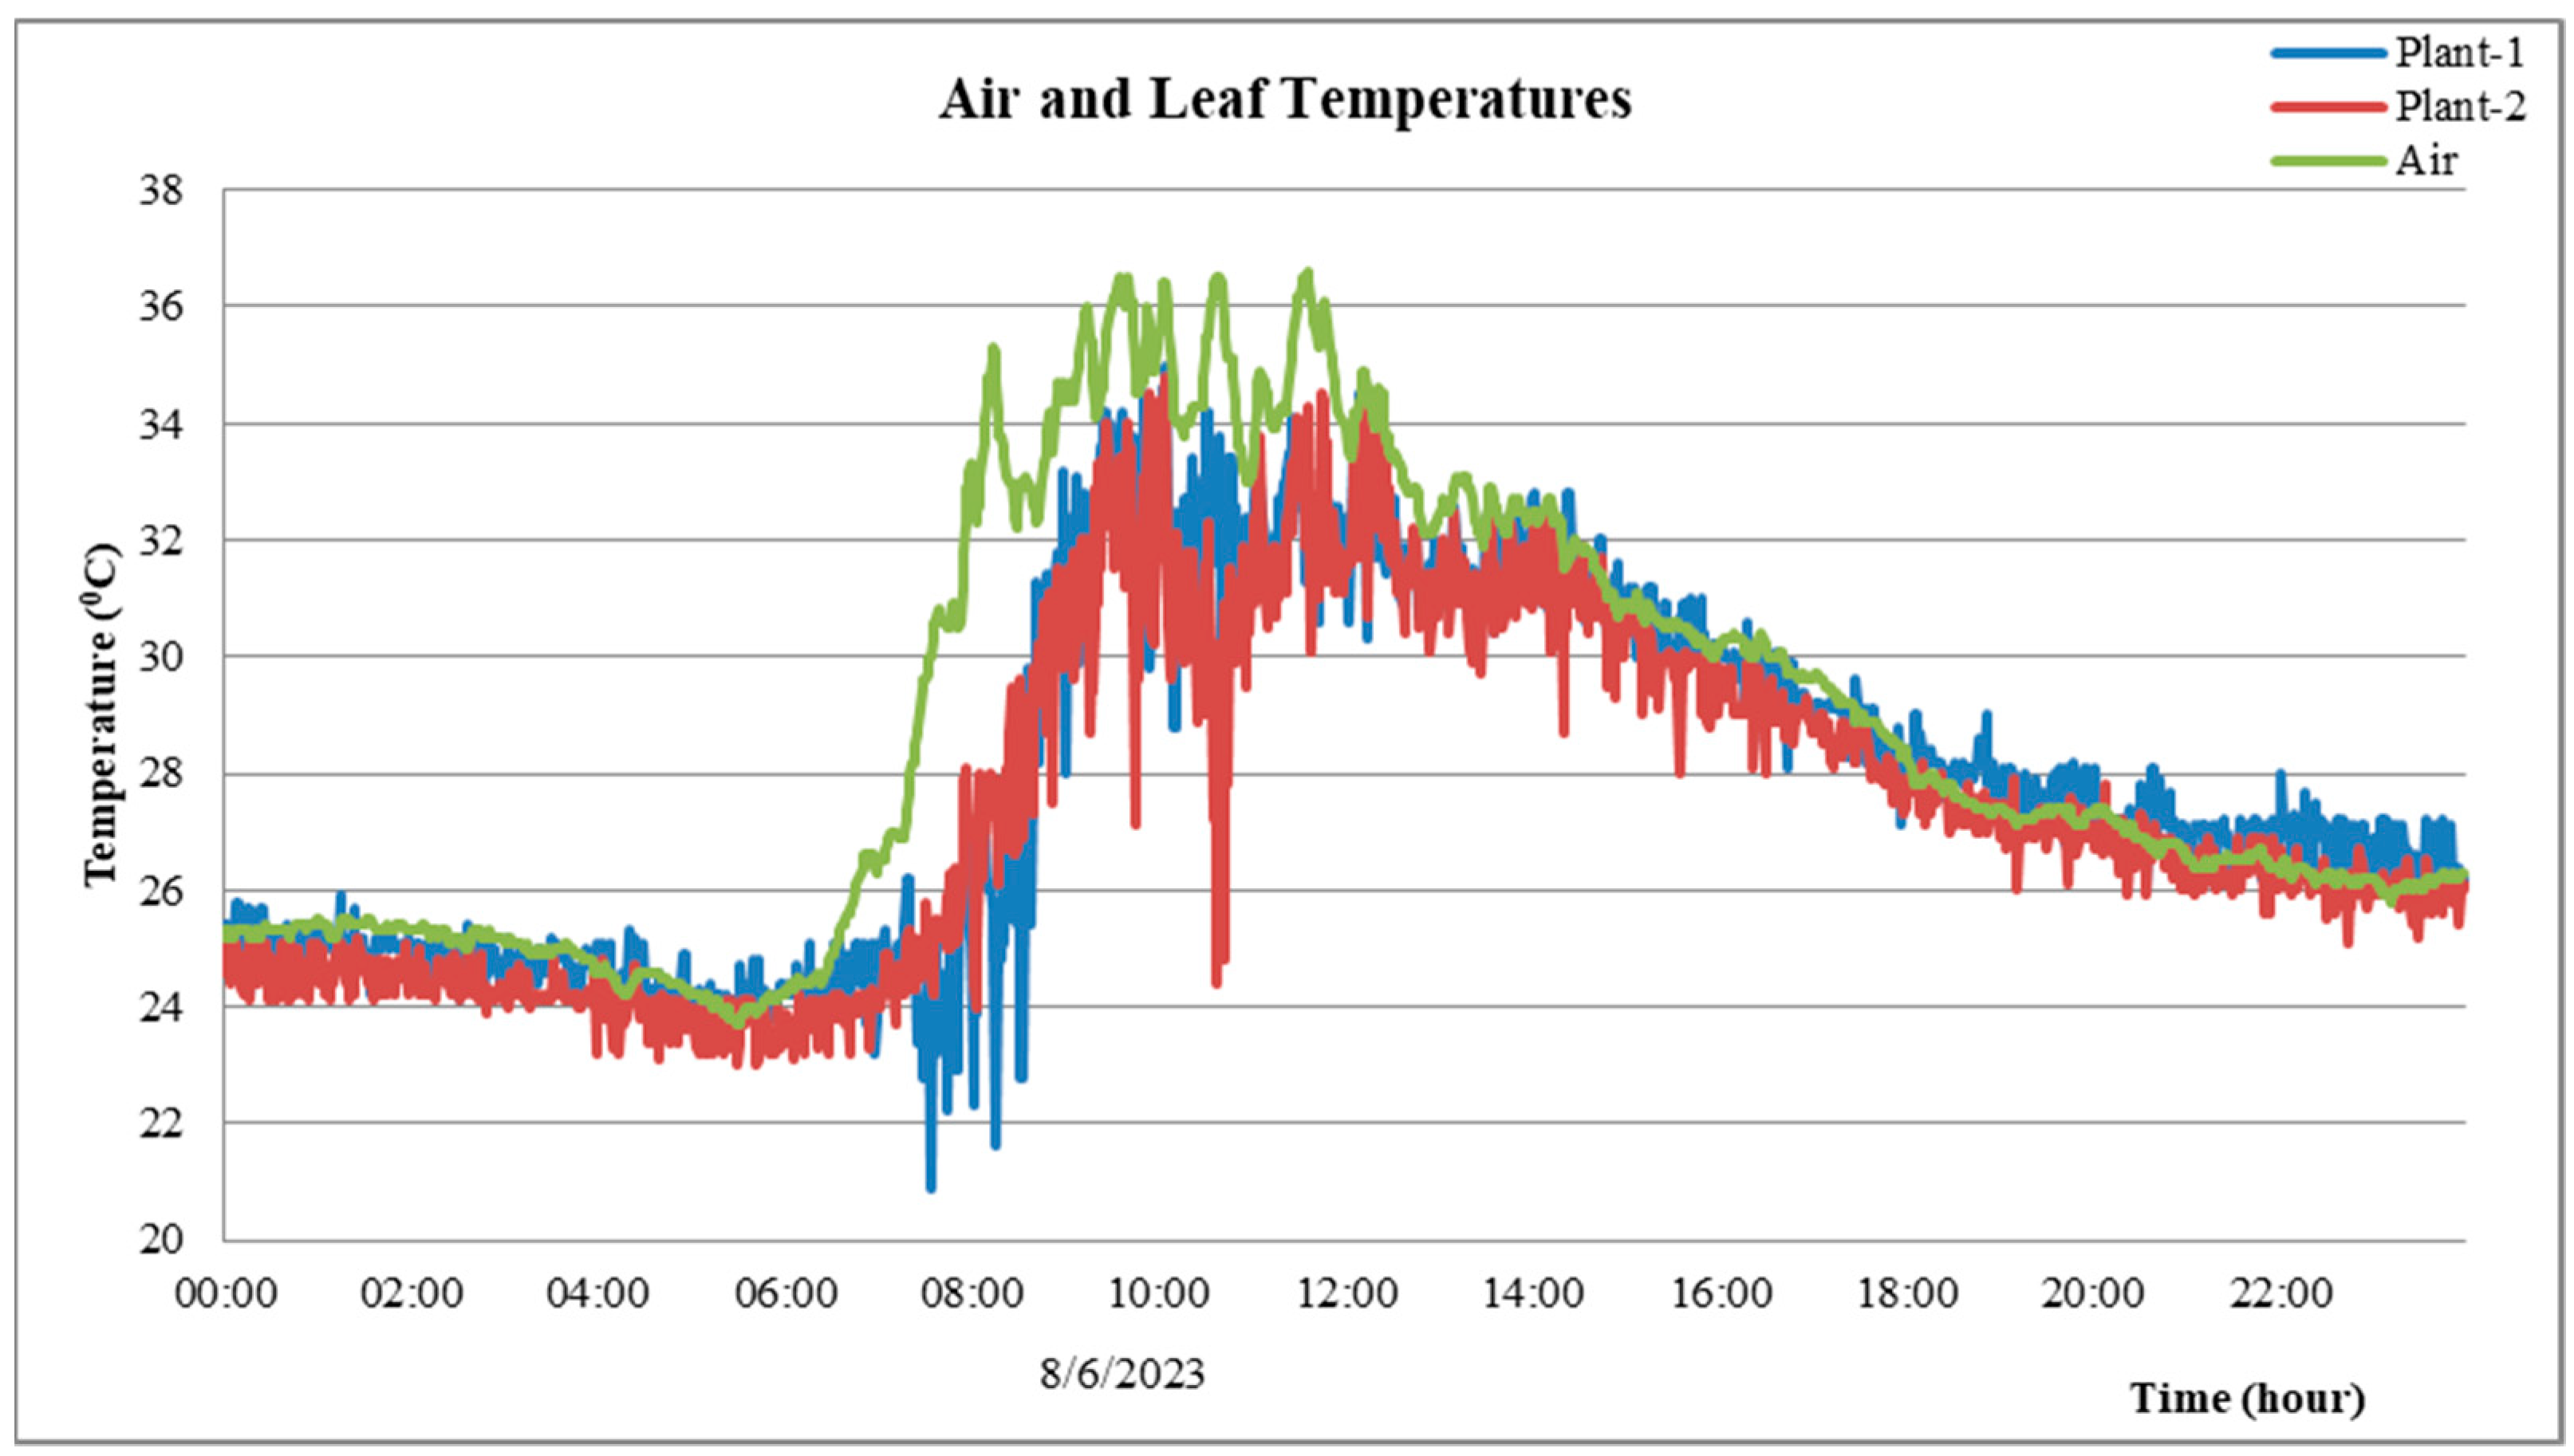
  • Historical trend of air and leaf temperature. It displays the trends in air temperature, and leaf and background temperatures of Plant-1 and Plant-2.
An example of the historical trend display is illustrated in Figure 12, which shows the historical trends in the air temperature, leaf, and background temperatures of Plant-1 and Plant-2. In the figure, the range of the displayed trend is three hours, where the SCADA program can adjust the range. The trend display provides valuable information to the user/operator about the trends in the monitored parameters.
The historical data saves a group of data into HMI internal memory. The historical data group can be displayed in the table format in the HMI. It consists of four groups:
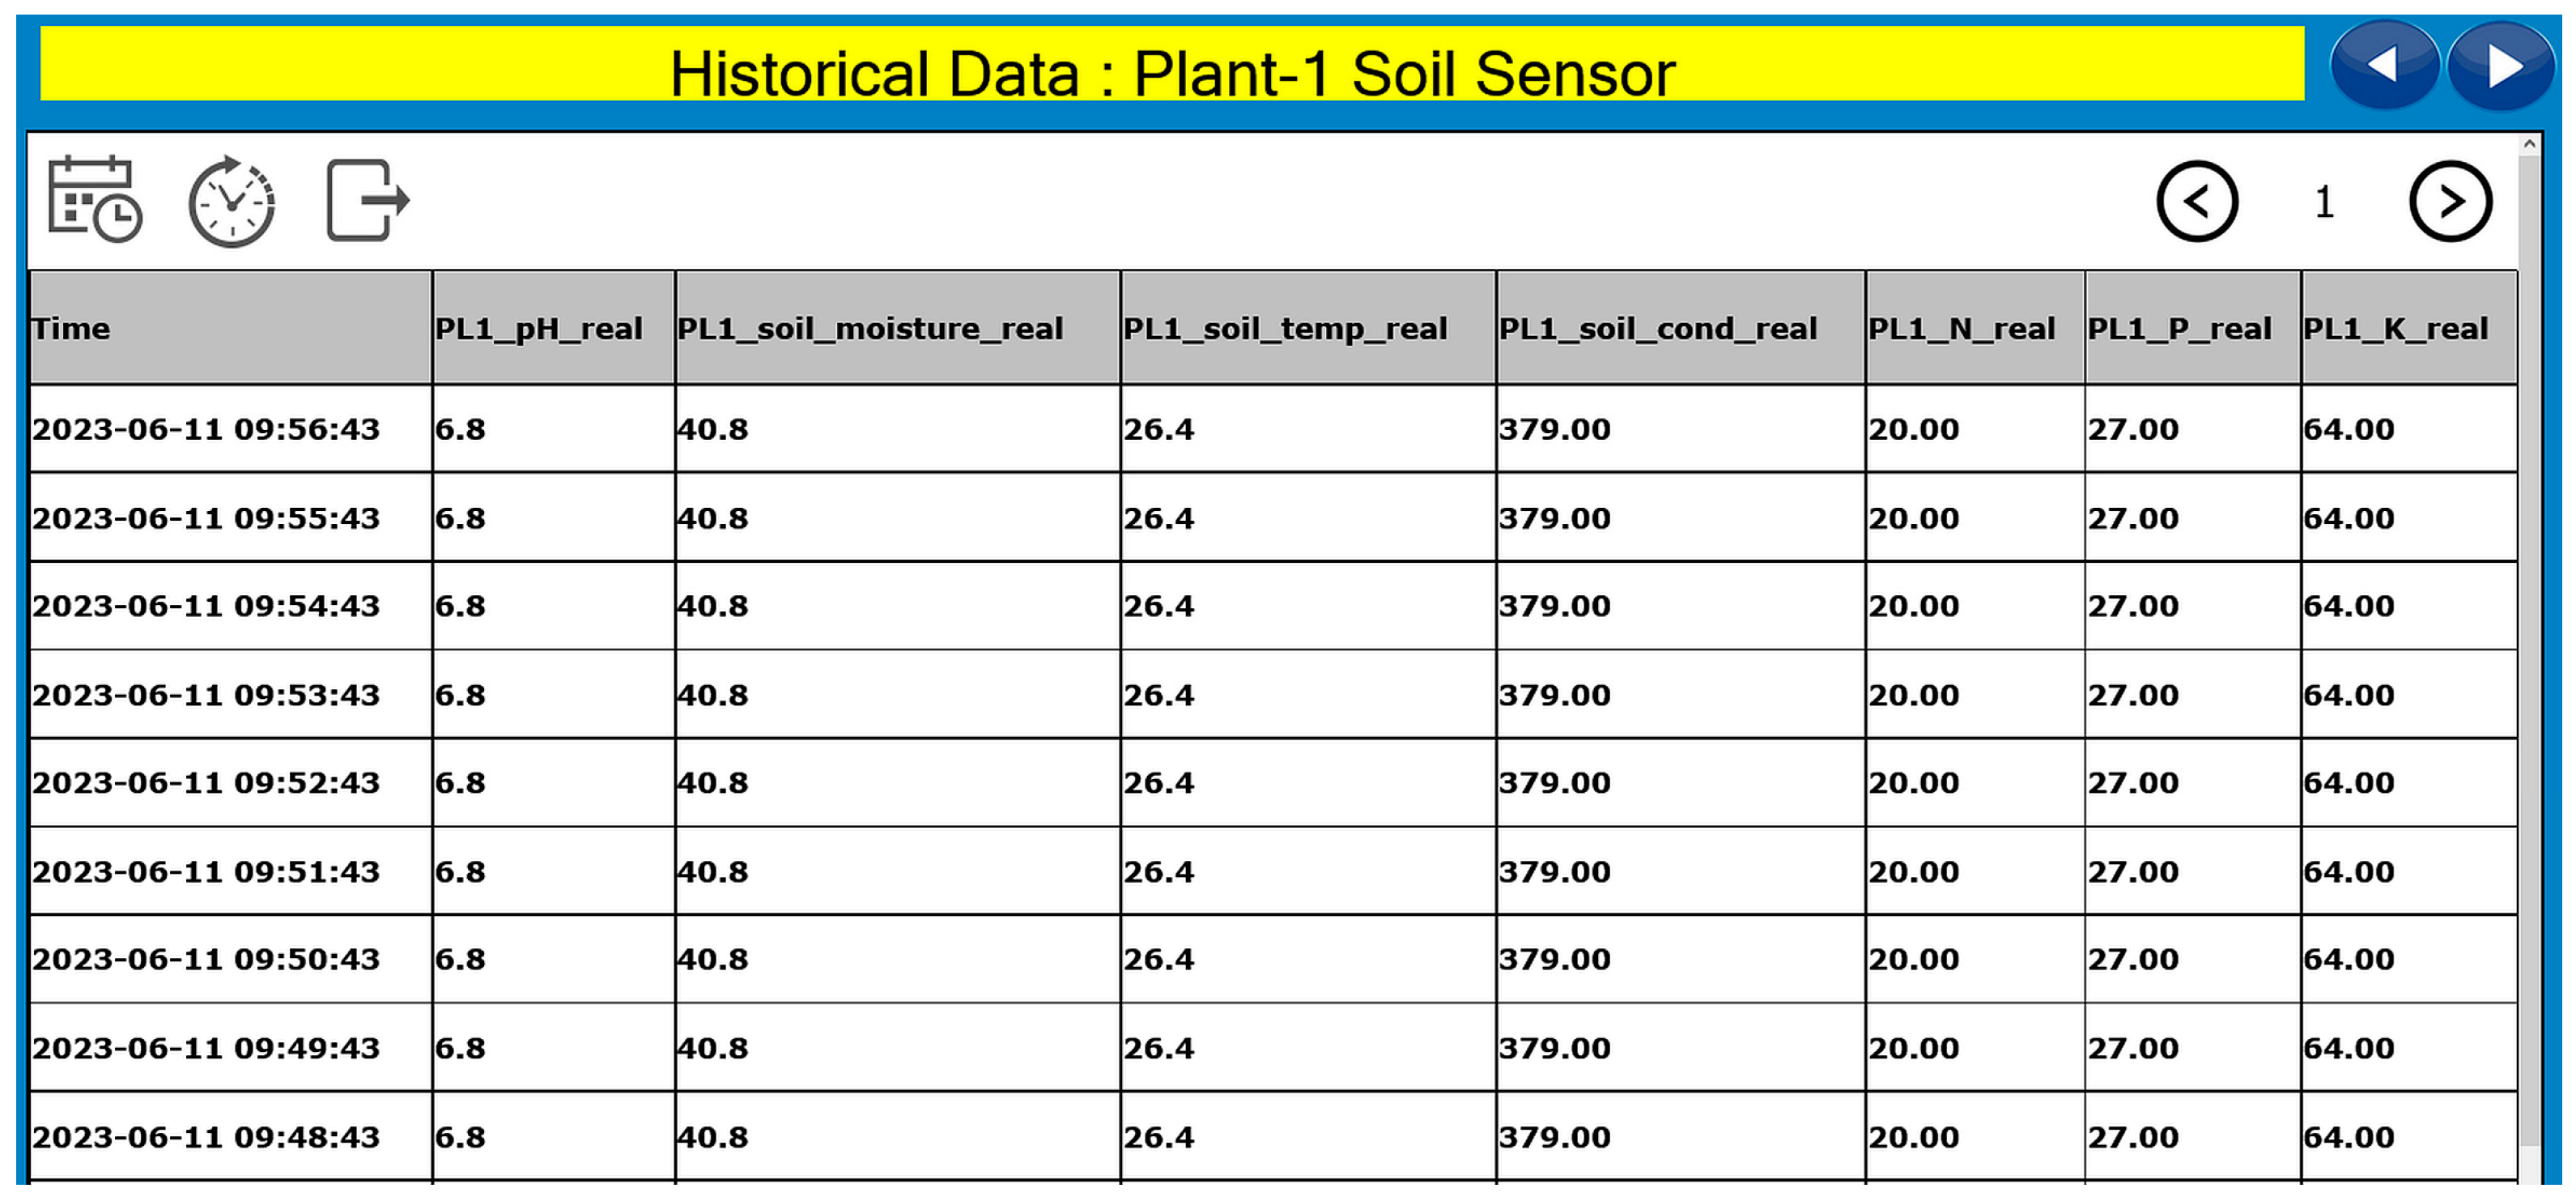
  • Historical data group of soil parameters of Plant-1. It displays the historical data of soil pH, moisture, temperature, EC, and NPK of Plant-1.
  • Historical data group of soil parameters of Plant-2. It displays the historical data of soil pH, moisture, temperature, EC, and NPK of Plant-2.
  • Historical data group of air parameters and leaf temperature of Plant-1. It displays the historical data of air temperature and humidity, an average temperature of the thermal image, threshold, leaf, and background temperatures of Plant-1.
  • Historical data group of leaf temperature of Plant-2. It displays the historical data of an average temperature of the thermal image, threshold, leaf, and background temperatures of Plant-2.
An example of the historical data display is illustrated in Figure 13, which shows the historical data of soil pH, moisture, temperature, EC, and NPK of Plant-1. The figure shows that the historical data are saved at every one-minute interval. The SCADA program can adjust this interval. Furthermore, the table can be saved into a CSV file for offline analysis. Theses historical data represent an essential feature in the sensor data analysis, as described in the next section.

3.3. Performance of Hardware System

The objective of evaluating the hardware system performance is to evaluate the reliability of the proposed system for real-time monitoring. This includes the performance evaluation of the Raspberry Pi Zero W, RS485 Modbus to WiFi converter, soil sensor, air sensor, thermal sensor, Haiwell IoT Cloud HMI hardware, and Modbus protocol.
In the experiments, the system was run continuously (twenty-four hours) from 7 June 2023 to 11 June 2023 in the outdoor environment (home terrace), as shown in Figure 8. During experiments, the Raspberry Pi Zero W stores the reading data from the DHT22 and AMG8833 sensors into the Modbus registers for supplying the Modbus data to the Haiwell IoT Cloud HMI and SDCard memory for data logging at one-minute intervals. The Haiwell IoT Cloud HMI requests the Modbus TCP data to the Raspberry Pi Zero W and RS485 Modbus to WiFi converter every five seconds. However, as described earlier, the data are saved to the HMI memory every minute.
Based on the data logger from the Raspberry Pi Zero W and historical data from the Haiwell IoT Cloud HMI, we evaluate the system performance as follows. We define the data recording success rate (DRSR) as the percentage of the number of stored data from the expected number of data at a particular time interval. The DRSRs in the Raspberry Pi Zero W and Haiwell IoT Cloud HMI are given in Table 11. As described earlier, the data of DHT22 and AMG8833 sensors are both stored in the Raspberry Pi Zero W and the Haiwell IoT Cloud HMI. Therefore, their DRSRs are calculated in Raspberry Pi Zero W and the Haiwell IoT Cloud HMI, as shown in the table. However, since the JXCT sensors (and RS485 Modbus to WiFi converter) do not store the data locally, the DRSRs for Plant-1 and Plant-2 are only calculated in the Haiwell IoT Cloud HMI.
The DRSR can be used to evaluate the following performances: (a) hardware faults, (b) processing delay time, and (c) Modbus communication error. Observing Table 11, all values of the DRSR in the Haiwell IoT Cloud HMI are 100%. The HMI hardware always runs smoothly during five days of evaluation. The HMI’s DRSR of 100% means that the HMI can process the task without delay and indicates that the Modbus communication runs appropriately. The average DRSR of the Raspberry Pi Zero W does not achieve 100%. It reaches 86.5% and 99.8% in Plant-1 and Plant-2, respectively. The DRSR of Raspberry Pi Zero W on Plant-1 each day, which is lower than 100%, denotes no hardware fault but represents the processing delay time. Further examination shows that the processing delay time is caused by the execution time uncertainty of the DHT22 sensor, where sometimes it is longer than one minute. It complies with the results in Plant-2, where the DSRR achieves almost 100% without a DHT22 sensor.

3.4. Performance of Leaf Temperature Measurement

The objective of evaluating the leaf temperature measurement performance is to compare the proposed leaf temperature measurement technique based on the Otsu thresholding with the one obtained by manual segmentation. In the manual segmentation, the location of the leaf area is defined manually by observing the thermal image. Fortunately, since the resolution of a thermal image is only 8 × 8 pixels, it can be carried out quickly. After the leaf area is defined, the leaf temperature is calculated by averaging the temperature values on the leaf area.
The leaf temperature measurement results of Plant-1 and Plant-2 are depicted in Figure 14 and Figure 15, respectively. The figures show the thermal images (heat-map color), the proposed segmented images with their respective leaf temperature, and the manually segmented images with their respective leaf temperature. The first, second, and third rows represent the measurement at 21:00 h, 11:00 h, and 15:00 h, respectively. In the proposed segmented images, the white color represents the pixels whose thermal values are below the optimal threshold (Topt) obtained by the Otsu thresholding. In the manually segmented images, the white color represents the leaf pixels.
Figure 14 and Figure 15 show that the areas of white pixels in the proposed segmented images differ from the ones of manually segmented images. However, the measured leaf temperatures of the proposed method are close to the manual ones. This is caused by the algorithm that computes the leaf temperature as the average temperature on the white pixels, whose values are almost the same due to the similar temperature. Table 12 shows the leaf temperature measurement error of Plant-1 and Plant-2 in Figure 14 and Figure 15. Observing Figure 14, Figure 15 and Table 12, we find that the discrepancy between the segmented pixels of proposed and manual methods does not reflect the leaf temperature measurement error. For instance, the discrepancy of segmented images in Figure 15h,i results in a small measurement error of 0.03%. It differs from the regular usage of the thresholding method in matching or detecting the object where the segmented object discrepancy yields higher error detection. Our proposed method takes benefit of the similarity of temperature values in the leaf and background.
The average leaf temperature measurement error of Plant-1 and Plant-2 during five days (7 June 2023 to 11 June 2023) is given in Table 13. Table 13 shows that the measurement errors on both Plant-1 and Plant-2 are almost the same (i.e., 1.41% and 1.53%, respectively). The small values of the standard deviations denote the slight variations in the measurement errors during five days. These results prove that our proposed method to segment the objects and average the temperature values works effectively for measuring the leaf temperature.

3.5. Sensor Data Analysis

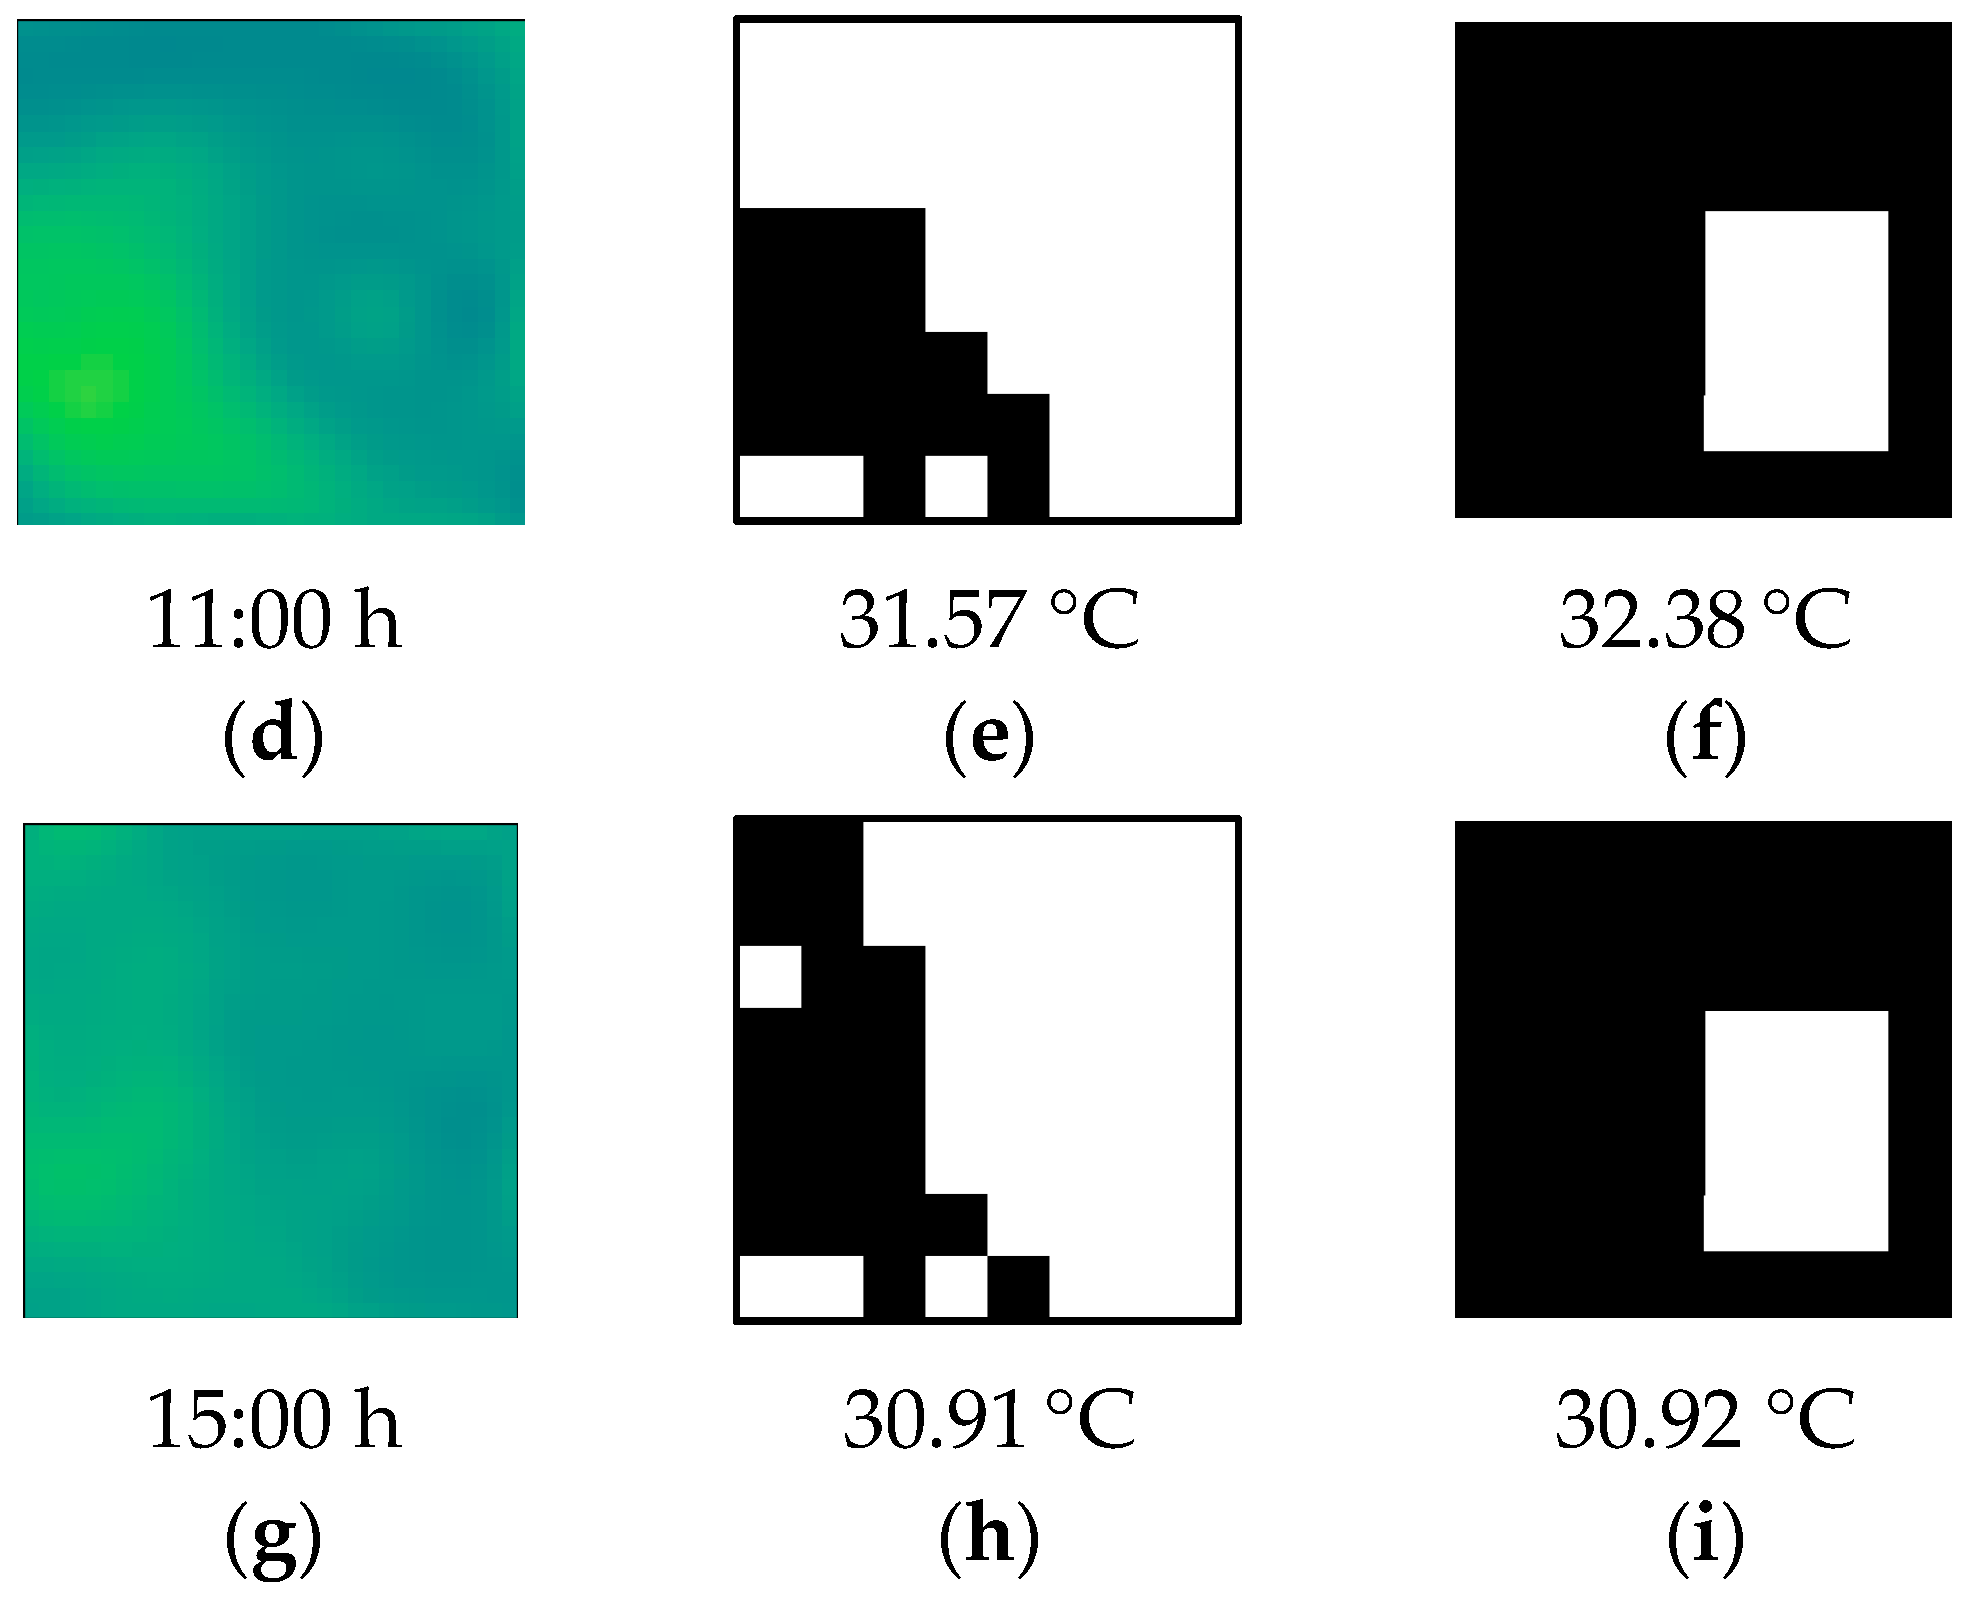
3.5.1. Air Temperature and Humidity

Figure 16 shows the recorded air temperature and humidity data graphs over five days (from 7 June 2023 to 11 June 2023). The air temperature profile (blue line) shows a similar daily pattern, where the maximum and minimum temperatures occur at noon around 12:00 h and in the morning around 05:00 h, respectively. The air humidity profile (red line) shows the opposite, where the maximum and minimum humidities happen in the morning and the noon, respectively. These profiles show a climate pattern typical for a tropical area.

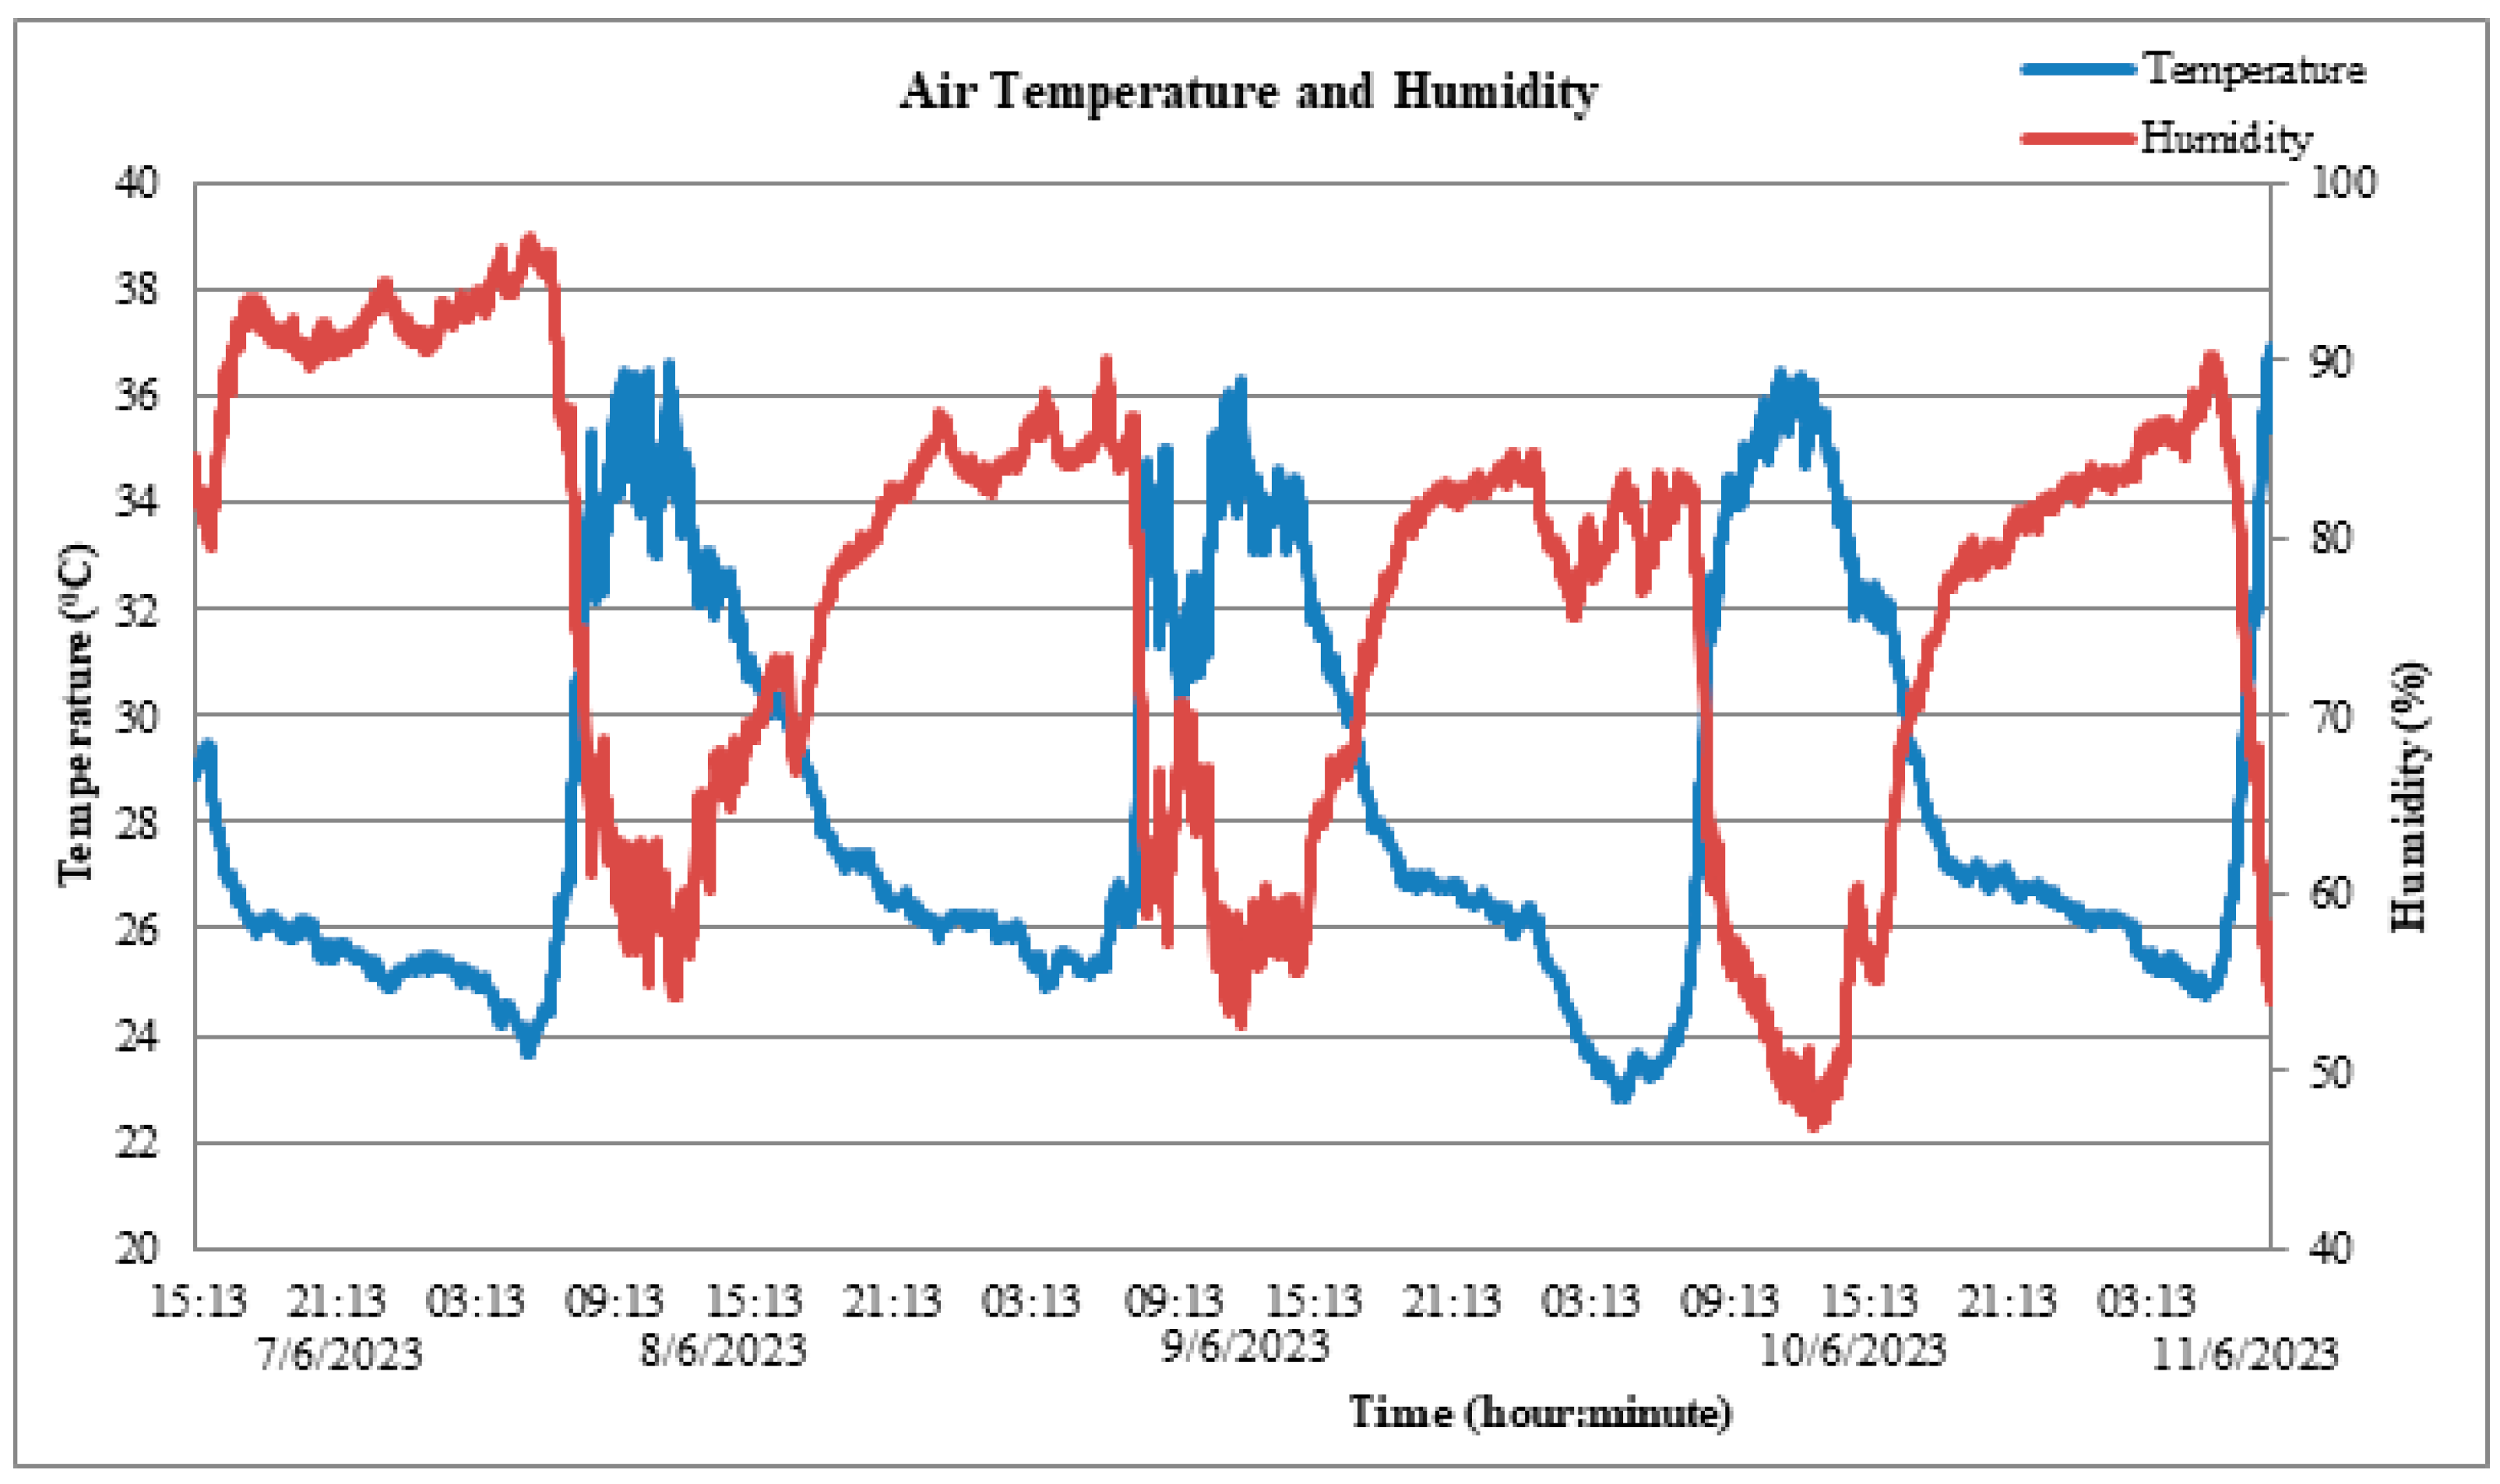
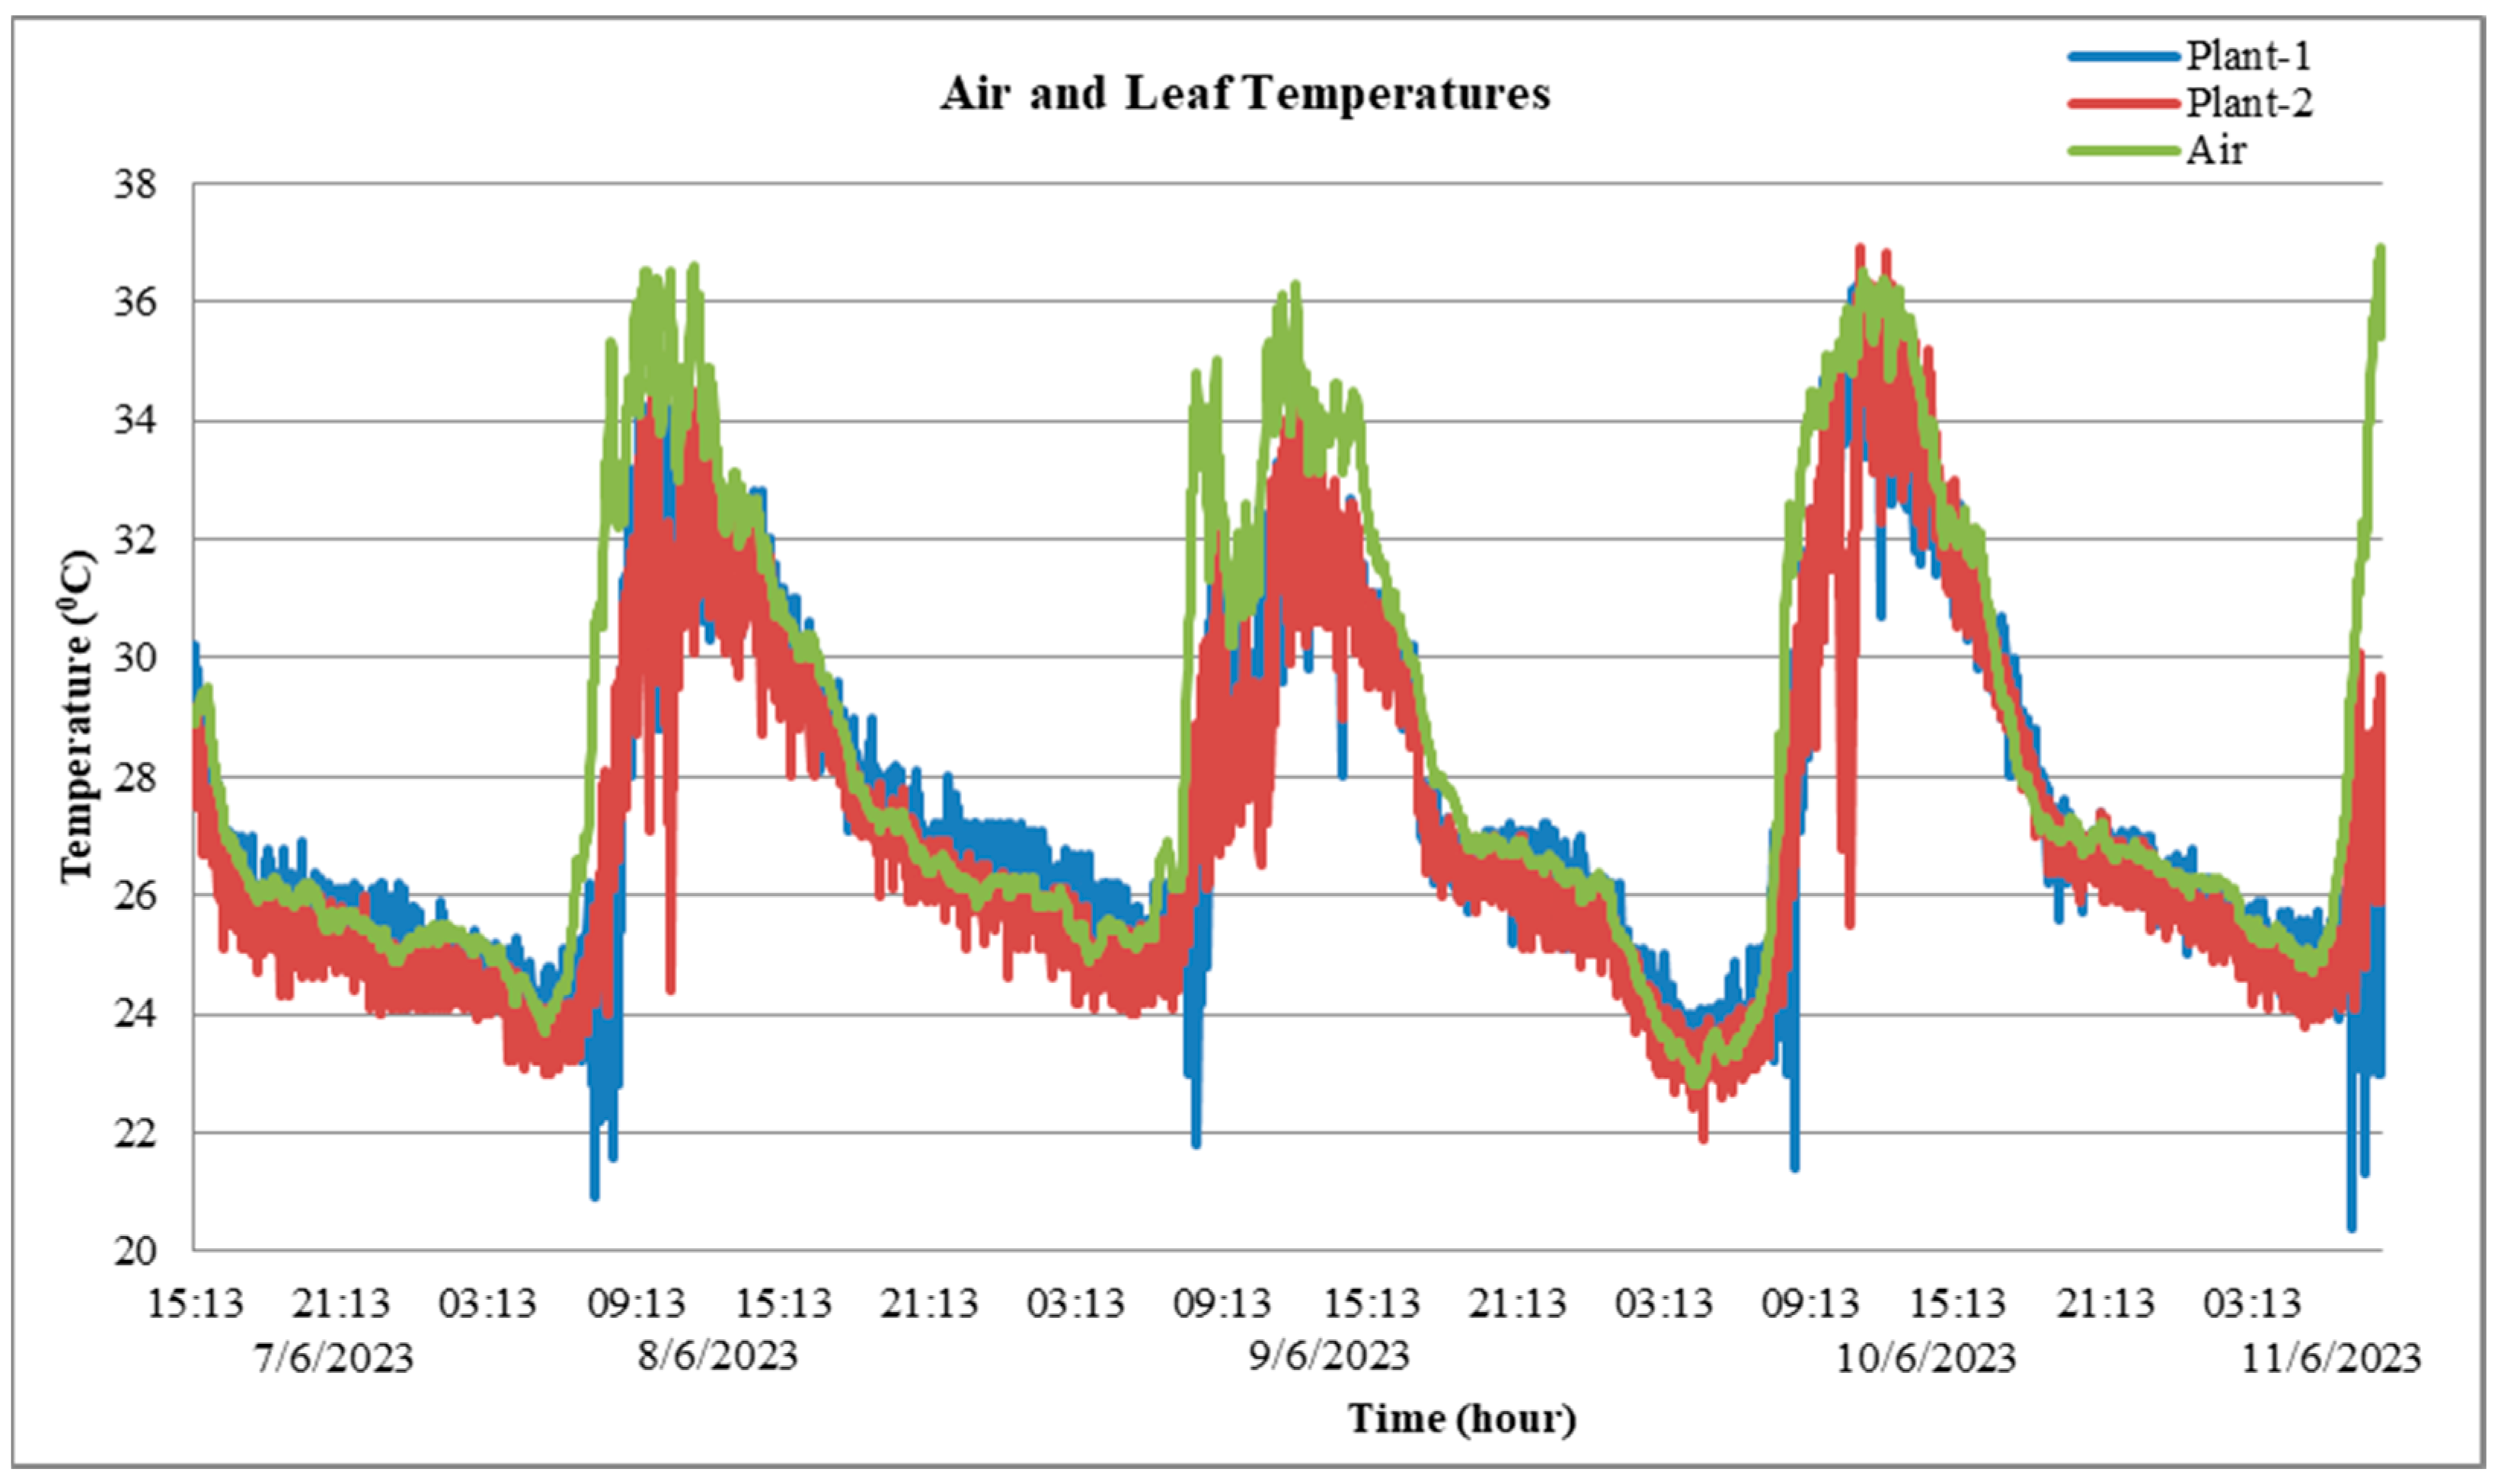
3.5.2. Leaf Temperature

Figure 17 shows the recorded air and leaf temperature data graphs over five days (from 7 June 2023 to 11 June 2023), where the yellow line represents the air temperature, and the blue and red lines represent the leaf temperatures of Plant-1 and Plant-2, respectively. Since the air temperature affects the leaf temperature [5,8,12], the air temperature profile is shown for easy analysis. The figure shows that the patterns of leaf temperatures follow the air temperature. This also conforms with the results in [12] that the leaf temperature is highly correlated with the air temperature.
Figure 17 shows that the Plant-2 leaf temperature tends to be lower than the air temperature over a whole day. However, the Plant-1 leaf temperature tends to be lower than the air temperature in the daytime (07:00 to 14:00 h) only. These behaviors are clearly shown in Figure 18, which depicts daily air and leaf temperature data graphs. Figure 17 and Figure 18 show that when the air temperature decreases (afternoon until early morning), the Plant-1 leaf temperature is higher than the air temperature, contrary to Plant-2. One possible reason, as addressed by [58], is caused by the leaf size, where due to its larger leaf size (see Figure 7 and Figure 8), Plant-1 leaf tends to be warmer than Plant-2.
Another interesting finding from Figure 17 and Figure 18 is that the Plant-1 leaf temperature exhibits significantly daily fluctuations at about 08:00 h. From observation of the data, it is caused by the abrupt air temperature changes during the sunshine. The thermal sensor (AMG8833) cannot track these rapid changes, thus producing an error reading. This phenomenon also occurs occasionally in Plant-2.

3.5.3. Soil Parameters

Figure 19 shows the recorded air and soil temperature data graphs, where the green line represents the air temperature, and the blue and red lines represent the soil temperatures of Plant-1 and Plant-2, respectively. It is clear from the figure that the soil temperatures follow the air temperature. The Plant-2 soil temperature is close to the air temperature, while the soil temperature is lower for Plant-1 than Plant-2. This phenomenon can be analyzed from the fact that Plant-1 soil is in regular soil, and Plant-2 is in fertilizer soil, and fertilizer soil tends to be warmer.
Figure 20 shows the recorded soil moisture data graphs, where the blue and red lines represent the soil moisture of Plant-1 and Plant-2, respectively. It is worth noting that during the experiments, both Plant-1 and Plant-2 were watered on 7 June 2023 (15:30 h), 9 June 2023 (17:11 h), and 11 June 2023 (7:33 h). Once watered, both Plant-1 and Plant-2 receive an equal water volume. The water volume on 9 June 2023 is twice that of other days. The effect of watering on the soil moisture is clearly shown in the figure, where the soil moisture increases significantly at the watering time. Further, the effect of double water volume on the watering is shown with the very high increment of the soil moisture on 9 June 2023.
Further investigation of Figure 20 shows a strange phenomenon where the soil moisture peaks slightly in the morning around 09:00 h daily, even though there is no watering. Since there is no water addition, the soil moisture should follow a trend of decreasing slowly. Therefore, the increase in soil moisture at the time is caused by a sensor reading error. This can be analyzed by referring to Figure 19, where at 09:00 h, the soil temperature increases significantly, which causes aberrant reading of the soil moisture.
Figure 20 also shows that the Plant-2 soil moisture is lower than Plant-1. This can be understood from Figure 19, in which the soil temperature of Plant-2 is higher than of Plant-1. The higher temperature mean more water evaporation, thus lowering the soil moisture.
Figure 21 and Figure 22 show the recorded soil moistures and EC data graphs of Plant-1 and Plant-2, respectively. The blue and red lines represent the soil moisture and EC, respectively. The figures show that the EC follows the soil moisture profile, where the soil EC increases when the soil moisture increases. The aberrant reading of soil moisture is encountered, as described earlier, which also occurs in the case of the soil EC.
Figure 23 shows the recorded soil EC data graphs, where the blue and red lines represent the soil EC of Plant-1 and Plant-2, respectively. The figure shows that the soil EC is higher for Plant-2 than Plant-1. It is caused by the fertilizer soil for Plant-2, which conducts more electricity than the regular soil of Plant-1.
Figure 24 shows the recorded soil pH data graphs, where the blue and red lines represent the soil pH of Plant-1 and Plant-2, respectively. The figure shows that the Plant-2 soil pH is acid, which is caused by the fertilizer soil of Plant-2. The figure also shows that the data reading is noisy. The noisy data is a result of the sensor accuracy of ±0.3 pH and the effect of the soil moisture or EC error reading, as shown in the Plant-2 soil pH on 11 June 2023 (after 21:13 h).
Figure 25 and Figure 26 show the recorded soil moisture, N, P, and K data graphs of Plant-1 and Plant-2, respectively. The blue, red, green, and purple lines represent the soil moisture, N, P, and K, respectively. The figures show that the soil N, P, and K follow the soil moisture profile. However, since no other treatment exists except watering, the soil N, P, and K should not change during five days of observation. Therefore, the soil NPK measurement using the JXCT sensor highly correlates with the soil moisture measurement. This suggests that the soil moisture data should be considered in the soil NPK data analysis or interpretation.
Figure 27 shows the recorded soil NPK data graphs, where the red, green, and purple lines represent the Plant-1 soil N, P, and K, respectively. The blue, aqua, and orange lines represent the Plant-2 soil N, P, and K, respectively. The figure shows that the soil NPK is higher for Plant-2 than Plant-1. This conforms with the fact that Plant-2 soil is in fertilizer soil, which has higher NPK concentrations than Plant-1 soil.
From the above discussion, we may summarize the findings in the JXCT soil sensor reading as follows:
  • Soil temperature readings can be independently interpreted.
  • Soil moisture readings should be interpreted by considering the soil temperature changes and watering treatment.
  • Soil EC, pH, N, P, and K readings should be interpreted by considering the soil moisture reading.

3.6. Comparison to Existing Systems

Table 14 gives a comparison of existing plant monitoring systems based on monitoring parameters, field device implementation, monitoring dashboard, monitoring device, and cost. The field device implementation indicates the reliability of actual implementation in outdoor environments, which should consider the casing/box protection and power consumption for battery operation. As shown in the table, most of the existing systems are hardware prototypes, except the work in [16] that uses the commercial product from ADCON. However, the work in [16] only deals with air temperature and humidity, soil temperature, and moisture monitoring. Since most works developed the hardware prototype, comparing the equipment protection in outdoor environments can only be conducted partially. Instead, we compare the power consumption, the monitoring features, and the cost.
Compared to the existing systems, our system provides all three monitored objects: leaf temperature, air parameters, and soil parameters. Further, our proposed system is IoT-enabled, where the monitoring dashboard uses the SCADA HMI, which can be accessed from the cloud or the HMI panel. Currently, our developed hardware prototype still uses a DC power supply. However, since air and soil sensor devices are similar to battery-powered systems [17,27], and considering the low power consumption of the AMG8833 thermal camera and the small type of Raspberry Pi Zero W, our proposed system is reliable to be powered by a battery. Even though the cost is slightly higher than the others, it offers extensive features. It is worth noting that the cost includes the Hawell IoT Cloud HMI device. Further, the proposed SCADA system is low cost compared to the established SCADA system.

4. Conclusions

A system for monitoring parameters of plant leaf temperature, air, and soil was developed using an IoT-based SCADA. The proposed monitoring system consists of the low-cost AMG8833 thermal camera for measuring the leaf and background temperatures, the DHT22 sensor for measuring the air temperature and humidity, the JXCT sensor for measuring the soil parameters, and the Haiwell IoT Cloud SCADA for implementing the IoT-based SCADA system. The leaf temperature is calculated from the leaf object, which is extracted using an image thresholding technique. The system was evaluated for continuous monitoring of two plants over five days and exhibited no hardware or software faults. The adopted Modbus TCP protocol functions appropriately in visualizing thermal images and other monitoring parameters. In the future, the system will be extended to monitor more plants in a larger area. Further, more environmental parameters and multi-sensor systems will be investigated for advanced applications.

Author Contributions

Conceptualization, A.S. and E.H.; methodology, A.S.; software, A.S.; validation, A.S.; data curation, A.S.; writing—original draft preparation, A.S.; writing—review and editing, A.S. and E.H.; project administration, E.H. All authors have read and agreed to the published version of the manuscript.

Funding

This work was supported by a Research Grant from the Ministry of Education, Culture, Research, and Technology, Republic of Indonesia, Year 2023 (No.: 077/E5/PG.02.00.PL/2023).

Institutional Review Board Statement

Not applicable.

Informed Consent Statement

Not applicable.

Data Availability Statement

Not applicable.

Acknowledgments

The authors thank the members of the Industrial Automation and Robotics Laboratory, Electrical Engineering Department, ITN Malang, for helping prepare the hardware during the data collection.

Conflicts of Interest

The authors declare no conflict of interest.

References

  1. Pathmudi, V.R.; Khatri, N.; Kumar, S.; Abdul-Qawy, A.S.H.; Vyas, A.K. A Systematic Review of IoT Technologies and Their Constituents for Smart and Sustainable Agriculture Applications. Sci. Afr. 2023, 19, e01577. [Google Scholar] [CrossRef]
  2. Kour, V.P.; Arora, S. Recent Developments of the Internet of Things in Agriculture: A Survey. IEEE Access 2020, 8, 129924–129957. [Google Scholar] [CrossRef]
  3. Xu, J.; Gu, B.; Tian, G. Review of Agricultural IoT Technology. Artif. Intell. Agric. 2022, 6, 10–22. [Google Scholar] [CrossRef]
  4. Farooq, M.S.; Riaz, S.; Helou, M.A.; Khan, F.S.; Abid, A.; Alvi, A. Internet of Things in Greenhouse Agriculture: A Survey on Enabling Technologies, Applications, and Protocols. IEEE Access 2022, 10, 53374–53397. [Google Scholar] [CrossRef]
  5. Aubrecht, D.M.; Helliker, B.R.; Goulden, M.L.; Roberts, D.A.; Still, C.J.; Richardson, A.D. Continuous, Long-Term, High-Frequency Thermal Imaging of Vegetation: Uncertainties and Recommended Best Practices. Agric. For. Meteorol. 2016, 228–229, 315–326. [Google Scholar] [CrossRef]
  6. Yu, L.; Wang, W.; Zhang, X.; Zheng, W.; Yu, L.; Wang, W.; Zhang, X.; Zheng, W. A Review on Leaf Temperature Sensor: Measurement Methods and Application. In Computer and Computing Technologies in Agriculture IX. CCTA; Li, D., Li, Z., Eds.; Springer: Cham, Switzerland, 2016. [Google Scholar] [CrossRef]
  7. Zhou, Z.; Diverres, G.; Kang, C.; Thapa, S.; Karkee, M.; Zhang, Q.; Keller, M. Ground-Based Thermal Imaging for Assessing Crop Water Status in Grapevines over a Growing Season. Agronomy 2022, 12, 322. [Google Scholar] [CrossRef]
  8. Kokin, E.; Pennar, M.; Palge, V.; Jürjenson, K. Strawberry Leaf Surface Temperature Dynamics Measured by Thermal Camera in Night Frost Conditions. Agron. Res. 2018, 16, 122–133. [Google Scholar] [CrossRef]
  9. Iseki, K.; Olaleye, O. A New Indicator of Leaf Stomatal Conductance Based on Thermal Imaging for Field Grown Cowpea. Plant Prod. Sci. 2020, 23, 136–147. [Google Scholar] [CrossRef]
  10. Giménez-Gallego, J.; González-Teruel, J.D.; Soto-Valles, F.; Jiménez-Buendía, M.; Navarro-Hellín, H.; Torres-Sánchez, R. Intelligent Thermal Image-Based Sensor for Affordable Measurement of Crop Canopy Temperature. Comput. Electron. Agric. 2021, 188, 106319. [Google Scholar] [CrossRef]
  11. Kim, B. Design and Implementation of Low-Cost Thermal-RGB Camera for Remote Monitoring Crop. Glob. J. Eng. Sci. 2021, 8, 8–10. [Google Scholar]
  12. Son, K.H.; Sim, H.S.; Lee, J.K.; Lee, J. Precise Sensing of Leaf Temperatures for Smart Farm Applications. Horticulturae 2023, 9, 518. [Google Scholar] [CrossRef]
  13. Noguera, M.; Millán, B.; Pérez-Paredes, J.J.; Ponce, J.M.; Aquino, A.; Andújar, J.M. A New Low-Cost Device Based on Thermal Infrared Sensors for Olive Tree Canopy Temperature Measurement and Water Status Monitoring. Remote Sens. 2020, 12, 723. [Google Scholar] [CrossRef]
  14. Absar, M.H.; Mirza, G.F.; Zakai, W.; John, Y.; Mansoor, N. Novel IoT-Based Plant Monitoring System. Eng. Proc. 2023, 23, 12. [Google Scholar]
  15. Wayangkau, I.H.; Mekiuw, Y.; Rachmat, R.; Suwarjono, S.; Hariyanto, H. Utilization of IoT for Soil Moisture and Temperature Monitoring System for Onion Growth. Emerg. Sci. J. 2020, 4, 102–115. [Google Scholar] [CrossRef]
  16. Marcu, I.; Suciu, G.; Bǎlǎceanu, C.; Drǎgulinescu, A.M.; Dobrea, M.A. IoT Solution for Plant Monitoring in Smart Agriculture. In Proceedings of the 2019 IEEE 25th International Symposium for Design and Technology in Electronic Packaging (SIITME), Cluj-Napoca, Romania, 23–26 October 2019; pp. 194–197. [Google Scholar] [CrossRef]
  17. Moshayedi, A.J.; Roy, A.S.; Liao, L.; Li, S. Raspberry Pi SCADA Zonal Based System for Agricultural Plant Monitoring. In Proceedings of the 2019 6th International Conference on Information Science and Control Engineering (ICISCE), Shanghai, China, 20–22 December 2019; pp. 427–433. [Google Scholar] [CrossRef]
  18. Ma, H.; Qi, J.; Li, K.; He, C. Plant Growth Monitoring Cloud Platform Based on Internet of Things. In Proceedings of the 2021 6th International Conference on Intelligent Computing and Signal Processing (ICSP), Xi’an, China, 9–11 April 2021; No. Icsp. pp. 1126–1129. [Google Scholar] [CrossRef]
  19. Abdullah, N.; Durani, N.A.B.; Bin Shari, M.F.; Siong, K.S.; Hau, V.K.W.; Siong, W.N.; Ahmad, I.K.A. Towards Smart Agriculture Monitoring Using Fuzzy Systems. IEEE Access 2021, 9, 4097–4111. [Google Scholar] [CrossRef]
  20. Carlos, A.D.J.; Augusto, C.-R.C.; Patricia, A.-C.P.; Alberto, P.-M.M.; Enrique, R.G.R.; César, M.-O.R.; Alfredo, O.-G.D.; Andrés, C.-M.C. Monitoring System of Environmental Variables for a Strawberry Crop Using IoT Tools. Procedia Comput. Sci. 2020, 170, 1083–1089. [Google Scholar] [CrossRef]
  21. Jamal, J.; Azizi, S.; Abdollahpouri, A.; Ghaderi, N.; Sarabi, B.; Silva-Ordaz, A.; Castaño-Meneses, V.M. Monitoring Rocket (Eruca Sativa) Growth Parameters Using the Internet of Things under Supplemental LEDs Lighting. Sens. Bio-Sens. Res. 2021, 34, 100450. [Google Scholar] [CrossRef]
  22. Zhang, S.; Guo, Y.; Li, S.; Ke, Z.; Zhao, H.; Yang, J.; Wang, Y.; Li, D.; Wang, L.; Yang, W.; et al. Investigation on Environment Monitoring System for a Combination of Hydroponics and Aquaculture in Greenhouse. Inf. Process. Agric. 2022, 9, 123–134. [Google Scholar] [CrossRef]
  23. Maginga, T.J.; Bakunzibake, P.; Masabo, E.; Massawe, D.P.; Agbedanu, P.R.; Nsenga, J. Design and Implementation of IoT Sensors for Nonvisual Symptoms Detection on Maize Inoculated with Exserohilum Turcicum. Smart Agric. Technol. 2023, 5, 100260. [Google Scholar]
  24. Madhumathi, R.; Arumuganathan, T.; Shruthi, R. Soil NPK and Moisture Analysis Using Wireless Sensor Networks. In Proceedings of the 2020 11th International Conference on Computing, Communication and Networking Technologies (ICCCNT), Kharagpur, India, 1–3 July 2020. [Google Scholar] [CrossRef]
  25. Nuchhi, S.; Bagali, V.; Annigeri, S. IOT Based Soil Testing Instrument for Agriculture Purpose. In Proceedings of the 2020 IEEE Bangalore Humanitarian Technology Conference (B-HTC), Vijiyapur, India, 8–10 October 2020; pp. 17–20. [Google Scholar] [CrossRef]
  26. Postolache, S.; Sebastião, P.; Viegas, V.; Postolache, O.; Cercas, F. IoT-Based Systems for Soil Nutrients Assessment in Horticulture. Sensors 2022, 23, 403. [Google Scholar] [CrossRef]
  27. Lavanya, G.; Rani, C.; GaneshKumar, P. An Automated Low Cost IoT Based Fertilizer Intimation System for Smart Agriculture. Sustain. Comput. Inform. Syst. 2020, 28, 100300. [Google Scholar] [CrossRef]
  28. Pyingkodi, M.; Thenmozhi, K.; Karthikeyan, M.; Kalpana, T.; Palarimath, S.; Kumar, G.B.A. IoT Based Soil Nutrients Analysis and Monitoring System for Smart Agriculture. In Proceedings of the 2022 3rd International Conference on Electronics and Sustainable Communication Systems (ICESC), Coimbatore, India, 17–19 August 2022; pp. 489–494. [Google Scholar] [CrossRef]
  29. Soetedjo, A.; Lomi, A.; Nakhoda, Y.I. Incorporating SCADA Software and High Level Language for Implementing the Optimization Technique in Smart Grid. Int. J. Innov. Comput. Inf. Control 2017, 13, 711–726. [Google Scholar]
  30. Alanazi, M.; Mahmood, A.; Chowdhury, M.J.M. SCADA Vulnerabilities and Attacks: A Review of the State-of-the-art and Open Issues. Comput. Secur. 2023, 125, 103028. [Google Scholar] [CrossRef]
  31. Hashem, M.Y.M.; Osman, F.A.; Eltokhy, M.A.R.; Allah, A.S.G. Low-Cost Design and Implementation of Cloud SCADA System. J. Eng. Res. 2020, 166, ELE15–ELE29. [Google Scholar] [CrossRef]
  32. Yi, M.; Mueller, H.; Yu, L.; Chuan, J. Benchmarking Cloud-Based SCADA System. In Proceedings of the 2017 IEEE International Conference on Cloud Computing Technology and Science (CloudCom), Hong Kong, China, 11–14 December 2017; pp. 122–129. [Google Scholar] [CrossRef]
  33. Tom, R.J.; Sankaranarayanan, S. IoT Based SCADA Integrated with Fog for Power Distribution Automation. In Proceedings of the 2017 12th Iberian Conference on Information Systems and Technologies (CISTI), Lisbon, Portugal, 21–24 June 2017; pp. 1–4. [Google Scholar] [CrossRef]
  34. Vargas-Salgado, C.; Aguila-Leon, J.; Chiñas-Palacios, C.; Hurtado-Perez, E. Low-Cost Web-Based Supervisory Control and Data Acquisition System for a Microgrid Testbed: A Case Study in Design and Implementation for Academic and Research Applications. Heliyon 2019, 5, e02474. [Google Scholar] [CrossRef] [PubMed]
  35. Aghenta, L.O.; Iqbal, M.T. Development of an IoT Based Open Source SCADA System for PV System Monitoring. In Proceedings of the 2019 IEEE Canadian Conference of Electrical and Computer Engineering (CCECE), Edmonton, AB, Canada, 5–8 May 2019; pp. 1–4. [Google Scholar] [CrossRef]
  36. Aghenta, L.O.; Iqbal, M.T. A Low-Cost, Open Source IoT-Based SCADA System Design, and Implementation for Photovoltaics. In Proceedings of the 28th Annual Newfoundland Electrical and Computer Engineering Conference, Newfoundland and Labrador, St. John’s, NL, Canada, 19 November 2019; pp. 1–5. [Google Scholar]
  37. Myint, A.K.; Latt, K.Z.; Hla, T.T.; Tun, N.M. IoT-Based SCADA System Design and Generation Forecasting for Hydropower Station. Int. J. Electr. Electron. Eng. Telecommun. 2021, 10, 251–260. [Google Scholar] [CrossRef]
  38. Aghenta, L.O.; Iqbal, M.T. Low-Cost, Open Source IoT-Based SCADA System Design Using Thinger.IO and ESP32 Thing. Electronics 2019, 8, 822. [Google Scholar] [CrossRef]
  39. Fazlollahtabar, H. Internet of Things-Based SCADA System for Configuring/Reconfiguring an Autonomous Assembly Process. Robotica 2022, 40, 672–689. [Google Scholar] [CrossRef]
  40. Salem, R.M.M.; Saraya, M.S.; Ali-Eldin, A.M.T. An Industrial Cloud-Based IoT System for Real-Time Monitoring and Controlling of Wastewater. IEEE Access 2022, 10, 6528–6540. [Google Scholar] [CrossRef]
  41. Oton, C.N.; Iqbal, M.T. Low-Cost Open Source IoT-Based SCADA System for a BTS Site Using ESP32 and Arduino IoT Cloud. In Proceedings of the 2021 IEEE 12th Annual Ubiquitous Computing, Electronics and Mobile Communication Conference, UEMCON, New York, NY, USA, 1–4 December 2021; pp. 681–685. [Google Scholar] [CrossRef]
  42. Pachamanov, A.; Georgiev, K. Tunnel Lighting Control System as a Component of SCADA Cloud Technology for Road Section. In Proceedings of the 2020 Fifth Junior Conference on Lighting (Lighting), Ruse, Bulgaria, 24–26 September 2020. [Google Scholar] [CrossRef]
  43. Osman, F.A. Secured Cloud SCADA System Implementation for Industrial Applications. Multimedia Tools Appl. 2022, 81, 9989–10005. [Google Scholar]
  44. Osaretin, C.A.; Zamanlou, M.; Iqbal, M.T.; Butt, S. Open Source IoT-Based SCADA System for Remote Oil Facilities Using Node-RED and Arduino Microcontrollers. In Proceedings of the 2020 11th IEEE Annual Information Technology, Electronics and Mobile Communication Conference (IEMCON), Vancouver, BC, Canada, 4–7 November 2020; pp. 571–575. [Google Scholar] [CrossRef]
  45. Grigorescu, S.D.; Seritan, G.C.; Enache, B.A.; Argatu, F.C.; Adochiei, F.C. Open Source Architecture for Iot Based SCADA System for Smart Home. Sci. Bull. Electr. Eng. Fac. 2020, 20, 33–36. [Google Scholar] [CrossRef]
  46. Church, P.; Mueller, H.; Ryan, C.; Gogouvitis, S.V.; Goscinski, A.; Haitof, H.; Tari, Z. Moving SCADA Systems to IaaS Clouds. In Proceedings of the 2015 IEEE International Conference on Smart City/SocialCom/SustainCom (SmartCity), Chengdu, China, 19–21 December 2015; pp. 908–914. [Google Scholar] [CrossRef]
  47. Zamanlou, M.; Iqbal, M.T. Development of an Economical SCADA System for Solar Water Pumping in Iran. In Proceedings of the 2020 IEEE International IOT, Electronics and Mechatronics Conference (IEMTRONICS), Vancouver, BC, Canada, 9–12 September 2020; pp. 31–34. [Google Scholar] [CrossRef]
  48. Haiwell. Available online: http://en.haiwell.com/ (accessed on 3 May 2022).
  49. Grid-EYE® Infrared Array Sensor. Available online: https://na.industrial.panasonic.com/products/sensors/sensors-automotive-industrial-applications/lineup/grid-eye-infrared-array-sensor (accessed on 3 February 2023).
  50. Raspberry Pi Zero W. Available online: https://www.raspberrypi.com/products/raspberry-pi-zero-w/ (accessed on 10 December 2022).
  51. 7 in 1 Integrated Soil Sensor EC PH NPK Moisture Temperature Meter. Available online: https://www.jxct-iot.com/product/showproduct.php?id=197 (accessed on 8 April 2023).
  52. Elfin-EW11. Available online: http://www.hi-flying.com/elfin-ew10-elfin-ew11 (accessed on 10 June 2022).
  53. DHT22-Digital-Output Relative Humidity & Temperature Sensor. Available online: https://datasheetspdf.com/pdf-file/792211/Aosong/DHT22/1 (accessed on 3 February 2023).
  54. Bellosta-Diest, A.; Campo-Bescós, M.; Zapatería-Miranda, J.; Casalí, J.; Arregui, L.M. Evaluation of Nitrate Soil Probes for a More Sustainable Agriculture. Sensors 2022, 22, 9288. [Google Scholar] [CrossRef] [PubMed]
  55. Sezgin, M.; Sankur, B. Survey over Image Thresholding Techniques and Quantitative Performance Evaluation. J. Electron. Imaging 2004, 13, 220. [Google Scholar] [CrossRef]
  56. Modbus-IDA. Modbus Messaging on Tcp/Ip Implementation Guide; Modbus Organization: Andover, MA, USA, 2006. [Google Scholar]
  57. Modbus-IDA. Modbus Application Protocol Specification V1.1a; Modbus Organization: Andover, MA, USA, 2004. [Google Scholar]
  58. Konrad, W.; Katul, G.; Roth-Nebelsick, A. Leaf Temperature and Its Dependence on Atmospheric CO2 and Leaf Size. Geol. J. 2021, 56, 866–885. [Google Scholar] [CrossRef]
Figure 1. Configuration of proposed IoT-Based SCADA system.
Applsci 13 11294 g001
Figure 2. Schematic diagram of leaf temperature monitoring.
Applsci 13 11294 g002
Figure 3. Haiwell IoT Cloud HMI (B7S-W).
Applsci 13 11294 g003
Figure 4. Modbus TCP Application Data Unit (ADU).
Applsci 13 11294 g004
Figure 5. PDU of function code = 03.
Applsci 13 11294 g005
Figure 6. Configuration of Modbus TCP.
Applsci 13 11294 g006
Figure 7. Hardware implementation of the plant monitoring system.
Applsci 13 11294 g007
Figure 8. Experimental setup.
Applsci 13 11294 g008
Figure 9. Thermal camera alignment for (a) Plant-1 and (b) Plant-2.
Applsci 13 11294 g009
Figure 10. Main menu display.
Applsci 13 11294 g010
Figure 11. Thermal camera data display.
Applsci 13 11294 g011
Figure 12. Historical trend display of air temperature parameters.
Applsci 13 11294 g012
Figure 13. Historical data display of Plant-1 soil sensor.
Applsci 13 11294 g013
Figure 14. Leaf temperature measurement of Plant-1: (a,d,g) Thermal images (heat-map color) at 21:00 h, 11:00 h, 15:00 h; (b,e,h) Segmented images and leaf temperatures of (a,d,g); (c,f,i) Manually segmented images and leaf temperatures of (a,d,g).
Applsci 13 11294 g014
Figure 15. Leaf temperature measurement of Plant-2: (a,d,g) Thermal images (heat-map color) at 21:00 h, 11:00 h, 15:00 h; (b,e,h) Segmented images and leaf temperatures of (a,d,g); (c,f,i) Manually segmented images and leaf temperatures of (a,d,g).
Applsci 13 11294 g015aApplsci 13 11294 g015b
Figure 16. Recorded air temperature and humidity data graphs.
Applsci 13 11294 g016
Figure 17. Recorded air and leaf temperature data graphs.
Applsci 13 11294 g017
Figure 18. A daily air and leaf temperatures data graphs.
Applsci 13 11294 g018
Figure 19. Recorded air and soil temperatures data graphs.
Applsci 13 11294 g019
Figure 20. Recorded soil moisture data graphs.
Applsci 13 11294 g020
Figure 21. Recorded soil moisture and EC data graphs of Plant-1.
Applsci 13 11294 g021
Figure 22. Recorded soil moisture and EC data graphs of Plant-2.
Applsci 13 11294 g022
Figure 23. Recorded soil EC data graphs.
Applsci 13 11294 g023
Figure 24. Recorded soil pH data graphs.
Applsci 13 11294 g024
Figure 25. Recorded soil moisture and N, P, K data graphs of Plant-1.
Applsci 13 11294 g025
Figure 26. Recorded soil moisture and N, P, K data graphs of Plant-2.
Applsci 13 11294 g026
Figure 27. Recorded soil NPK data graphs.
Applsci 13 11294 g027
Table 1. Literature survey of plant monitoring systems.
Ref.ParameterSensor HardwareIoTRemark
[7]Leaf temperatureFLIR Vue Pro R-Standalone thermal camera (640 × 512 pixels)
[8]Leaf temperatureFLIR P660-Standalone thermal camera (640 × 480 pixels)
[9]Leaf temperatureFLIR C2-Standalone thermal camera (80 × 60 pixels)
[10] Leaf temperatureFLIR Lepton 3.5-Thermal camera is connected to Raspberry Pi 4
[11]Leaf temperatureFLIR Lepton 3.5-Thermal camera is connected to Raspberry Pi 3
[12]Leaf temperature16 × 4 Thermopile Array (DIWELL Electronics)-Thermopile array is connected to STM32L476
[13]Leaf temperatureMLX90620-Thermopile array is connected to Arduino Mega
[14]Air temperature and humidityDHT11BlynkDHT11 is connected to Arduino and ESP8266 WiFi module for IoT communication
[15]Air temperature and humidityDHT11Authors developed Android Appl.DHT11 is connected to NodeMCU for IoT communication
[16]Air temperature and humidity; soil temperature and moistureSDI-12 sensorsADCONSensors are connected to ADCON RTU for IoT communication
[17]Air temperature and humidity; pressure; light; gas (H2, LPG, CH4, CO, alcohol, smoke)SHT10; BMP180; LDR; MQ2Authors developed IoT-based SCADASensors are connected to NodeMCU for IoT communication
[18]Air temperature and humidity; soil temperature and moisture; CO2DHT11; TELESKY FC-28; MG811Huawei cloudSensors are connected to STM32L431 for IoT communication
[19]Air temperature and humidity; soil moistureDHT11; Capacitive soil moisture sensorThingSpeak; Blynk; Open as AppSensors are connected to NodeMCU for IoT communication
[20]Soil temperature, conductivity, humidity, and pHNo information providedAmazon Web Services (AWS)Sensors are connected to Raspberry Pi 3 for IoT communication
[21]Air temperature and humidity; LightDHT11; GY-30Authors developed Web applicationSensors are connected to NodeMCU and raspberry Pi for IoT communication
[22]Air temperature and humidity; soil temperature and moisture; CO2; leaf humidity; lightRS-WS-N01-2; No information provided for soil and gas sensors; YT-YSW; RS-GZ-N02Authors developed Web applicationSensors are connected to data acquisition unit using LoRa communication
[23]Air temperature, humidity, pressure, and gas; soil NPKBME688; Taidacent and JXCTThingSpeakNPK sensor is connected to ELEGOO Nano Board; Air sensor is connected to ESP8266
[24]Soil temperature, moisture, pH, and NPKDS18B20; FC28; No information provided for soil pH and NPKAmazon Web Services (AWS)Sensors are connected to Arduino and NodeMCU for IoT communication
[25]Soil temperature, moisture, humidity, and NPKNo information providedThingSpeakSensors are connected to Arduino for IoT communication
[26]Soil temperature, electric conductivity, moisture, pH, and NPKJXCTAuthors developed mobile applicationSensors are connected to ESP32 Wi-Fi/LoRa board for IoT communication
[27]Soil NPKAuthors developed NPK sensorGoogle cloudSensors are connected to Raspberry for IoT communication
[28]Soil NPKNo information provided for NPK sensorThingSpeakSensors are connected to Arduino for IoT communication
Table 2. Literature survey of IoT-based SCADA systems.
Ref.Field of ApplicationRTU HardwareProtocol (RTU to MTU)MTU (Software–Hardware)
[17]Plant monitoringNodeMCUHTTPAuthors developed web application–Raspberry Pi
[33]Power distribution systemNo specific information provided 6LoWPANNo specific information provided
[34]Microgrid testbedArduinoNRF24L01-SPIAuthors developed Web application–Raspberry Pi
[35]Photovoltaic (PV) systemRaspberry PiHTTP EmonCMS–Raspberry Pi
[36]Photovoltaic (PV) systemRaspberry PiMQTTThingsBoard–Raspberry Pi
[37]Hydropower systemESP8266HTTPAuthors developed web application–no specific information provided
[38]Photovoltaic (PV) systemESP32HTTPThinger.IO–Raspberry Pi
[39]Autonomous assembly systemNo specific information provided No specific information provided No specific information provided
[40]Wastewater treatmentNodeMCUHTTPAuthors developed web application–free cloud server
[41]Base Transceiver Station (BTS)ESP32HTTPArduino IoT Cloud–Arduino IoT cloud server
[42]Tunnel light controlMicro850 Programmable ControllerNo specific information provided No specific information provided
[43]EducationESP8266HTTPAuthors developed web application
[44]Oil productionArduinoHTTPNode-RED IoT platform–computer server
[45]SmarthomeArduinoMQTTGrafana–Raspberry Pi
[46]General applicationComputer (simulated sensors)ModbusEclipseSCADA–Computer server
[47]Water pumping ArduinoFirmataNode-RED–Raspberry Pi
Table 3. DHT22 specifications.
TemperatureHumidity
Operating range −40–80 °C0–100% RH
Resolution0.1 °C0.1% RH
Accuracy±0.5 °C±2% RH
Repeatability±0.2 °C±1% RH
Power supply range3.3–5.5 V DC
InterfaceDigital signal–single wire
Average sensing time2 s
PriceUS$ 2
Table 4. JXCT specifications.
TemperatureMoistureECpHNPK
Operating range −40 to 80 °C0–100%0–10,000 μS/cm3–90–1999 mg/kg
Resolution0.1 °C0.1%10 us/cm0.011 mg/kg
Accuracy±0.5 °CWithin 0–53% ± 3%; within 53–100% ± 5%-±0.3±2% FS
Power supply12–24 V DC
InterfaceRS485 Modbus protocol
Response time<1 s
PriceUS$ 267
Table 5. AMG8833 specifications.
Power supply3.3 V DC
Temperature range0–80 °C
Temperature accuracy±2.5 °C
Viewing angle60°
Number of pixels8 × 8 pixels
InterfaceI2C
Frame rate10 fps
PriceUS$ 41
Table 6. Elfin-EW11 specifications.
Power supply5–18 V DC
ProcessorCortex-M3
Main frequency96 MHz
Operating systemFreeRTOS
Wireless standard802.11 b/g/n
WiFi band2.412–2.484 GHz
Neywork protocolIP, TCP, UDP, DHCP, DNS, HTTP Server/Client, ARP, BOOTP, AutoIP, ICMP, Web socket, Telnet, uPNP, NTP, Modbus TCP
Network modeSTA/AP/STA + AP
Serial portRS485
PriceUS$ 17
Table 7. Haiwell IoT Cloud HMI specifications.
Power supply24 ± 20% V DC
SoftwareHaiwell Cloud SCADA Version 3.36.9.8
Display size7-inch TFT
Display resolution800 × 480 pixels
Touchscreen typeResistive
MemoryFlash: 2 GB; RAM: 512 MB
I/O port1 × LAN; 2 × USB; 1 × RS485; 1 × RS232; 1 × WiFi
Common protocolModbus RTU; Modbus TCB
IoT protocolMQTT
Supported RTU/PLC protocolHaiwell; Schneider; Siemens; Panasonic; Mitsubishi; Omron; etc.
Table 8. Common Modbus function code.
Function CodeDefinition
01Read Coils
02Read Discrete Inputs
05Write Single Coil
15Write Multiple Coils
03Read Holding Registers
06Write Single Register
16Write Multiple Register
Table 9. Modbus data addressing for Raspberry Pi Zero W.
Holding Register AddressVariable NameUnit
0–63Temperature value at array (0, 0)–(7, 7) of thermal camera0.1 °C
64Air temperature value of DHT22 sensor *0.1 °C
65Air humidity value of DHT22 sensor *0.1%
66Average temperature value of thermal camera0.1 °C
67Otsu threshold value0.1 °C
68Background temperature value0.1 °C
69Leaf temperature value0.1 °C
*: Raspberry Pi Zero W #1 only.
Table 10. Modbus data addressing for JXCT soil sensor RS485 Modbus to WiFi converter.
Holding Register AddressVariable NameUnit
6pH value0.01 pH
18Soil moisture value0.1% RH
19Soil temperature value0.1 °C
21Soil conductivity valueus/cm
30Nitrogen concentration valuemg/kg
31Phosphorous concentration valuemg/kg
32Kalium/Potassium concentration valuemg/kg
Table 11. Data recording success rate (DRSR).
Collection TimeData Recording Success Rate (DRSR)
Raspberry Pi Zero WHaiwell IoT Cloud HMI
Plant-1 (DH22, AMG8833 #1)Plant-2 (AMG8833 #2)Plant-1 (DH22, AMG8833 #1)Plant-2 (AMG8833)Plant-1 (JXCT)Plant-2 (JXCT)
Day-1 (15:13–23:59 h)85.6%100%100%100%100%100%
Day-2 (00:00–23:59 h)88.6%100%100%100%100%100%
Day-3 (00:00–23:59 h)86.3%99.1%100%100%100%100%
Day-4 (00:00–23:59 h)88.1%100%100%100%100%100%
Day-5 (00:00–08:33 h)83.9%100%100%100%100%100%
Average86.5%99.8%100%100%100%100%
Table 12. Leaf temperature measurement error of Plant-1 and Plant-2 in Figure 14 and Figure 15.
Leaf Temperature (°C)Error (%)
Proposed MethodManually
Plant-1 (Figure 14—21:00 h)26.1926.110.31
Plant-1 (Figure 14—11:00 h)32.0531.691.14
Plant-1 (Figure 14—15:00 h)31.9431.461.53
Plant-2 (Figure 15—21:00 h)25.7125.780.27
Plant-2 (Figure 15—11:00 h)31.5732.382.50
Plant-2 (Figure 15—15:00 h)30.9130.920.03
Table 13. Average leaf temperature measurement error of Plant-1 and Plant-2.
Leaf Temperature Measurement
Error (%)Standard Deviation (%)
Plant-11.410.96
Plant-2 1.531.29
Table 14. Comparison to existing plant monitoring systems.
Ref.Monitoring ParameterField Device ImplementationMonitoring DashboardMonitoring DeviceCost (Approx.)
[7,8,9]Leaf temperatureHandheld or portable thermal camera, Battery powered, Not IoT system-Thermal camera>US$ 400
[10,11]Leaf temperatureHardware prototype, DC power supply, Not IoT systemPython-based/Web APIRaspberry PiUS$ 300
[12]Leaf temperature, Air temperature, humidity, CO2Hardware prototype, DC power supply, Not IoT systemLabViewPCUS$ 210
[13]Leaf temperatureDeveloped handheld device, Battery powered, Not IoT systemArduino displayArduinoUS$ 158
[14]Air temperature and humidityHardware prototype, DC power supply, Not continuous monitoring, IoT systemBlynk App.PC, SmartphoneUS$ 35
[16]Air temperature and humidity; soil temperature and moistureCommercial product (ADCON), Solar powered, IoT system GrafanaPCNA
[17]Air temperature and humidity; pressure; light; gas (H2, LPG, CH4, CO, alcohol, smoke)Hardware prototype, Battery powered, IoT systemWeb-based GUIPC, SmartphoneUS$ 130
[18]Air temperature and humidity; soil temperature and moisture; CO2Hardware prototype, DC power supply, IoT systemHuawei cloud PC, SmartphoneUS$ 133
[23]Air temperature, humidity, pressure and gas; soil NPKHardware prototype, DC power supply, IoT systemThingSpeakPC, SmartphoneUS$ 333
[26]Soil temperature, EC, moisture, pH, and NPKHardware prototype, Battery powered and solar panel, IoT systemMobile applicationSmartphoneUS$ 300
[27]Soil NPKHardware prototype, Battery powered, IoT systemGoogle cloudPC, SmartphoneUS$ 55
ProposedLeaf temperature; air temperature and humidity; soil temperature, EC, moisture, pH, and NPKHardware prototype, DC power supply, IoT-based SCADA systemHaiwell SCADA HMIPC, Smartphone, HMI panelUS$ 500 (including HMI device)
Disclaimer/Publisher’s Note: The statements, opinions and data contained in all publications are solely those of the individual author(s) and contributor(s) and not of MDPI and/or the editor(s). MDPI and/or the editor(s) disclaim responsibility for any injury to people or property resulting from any ideas, methods, instructions or products referred to in the content.

