
Numerical Study of Dig Sequence Effects during Large-Scale Excavation

Abstract
:1. Introduction
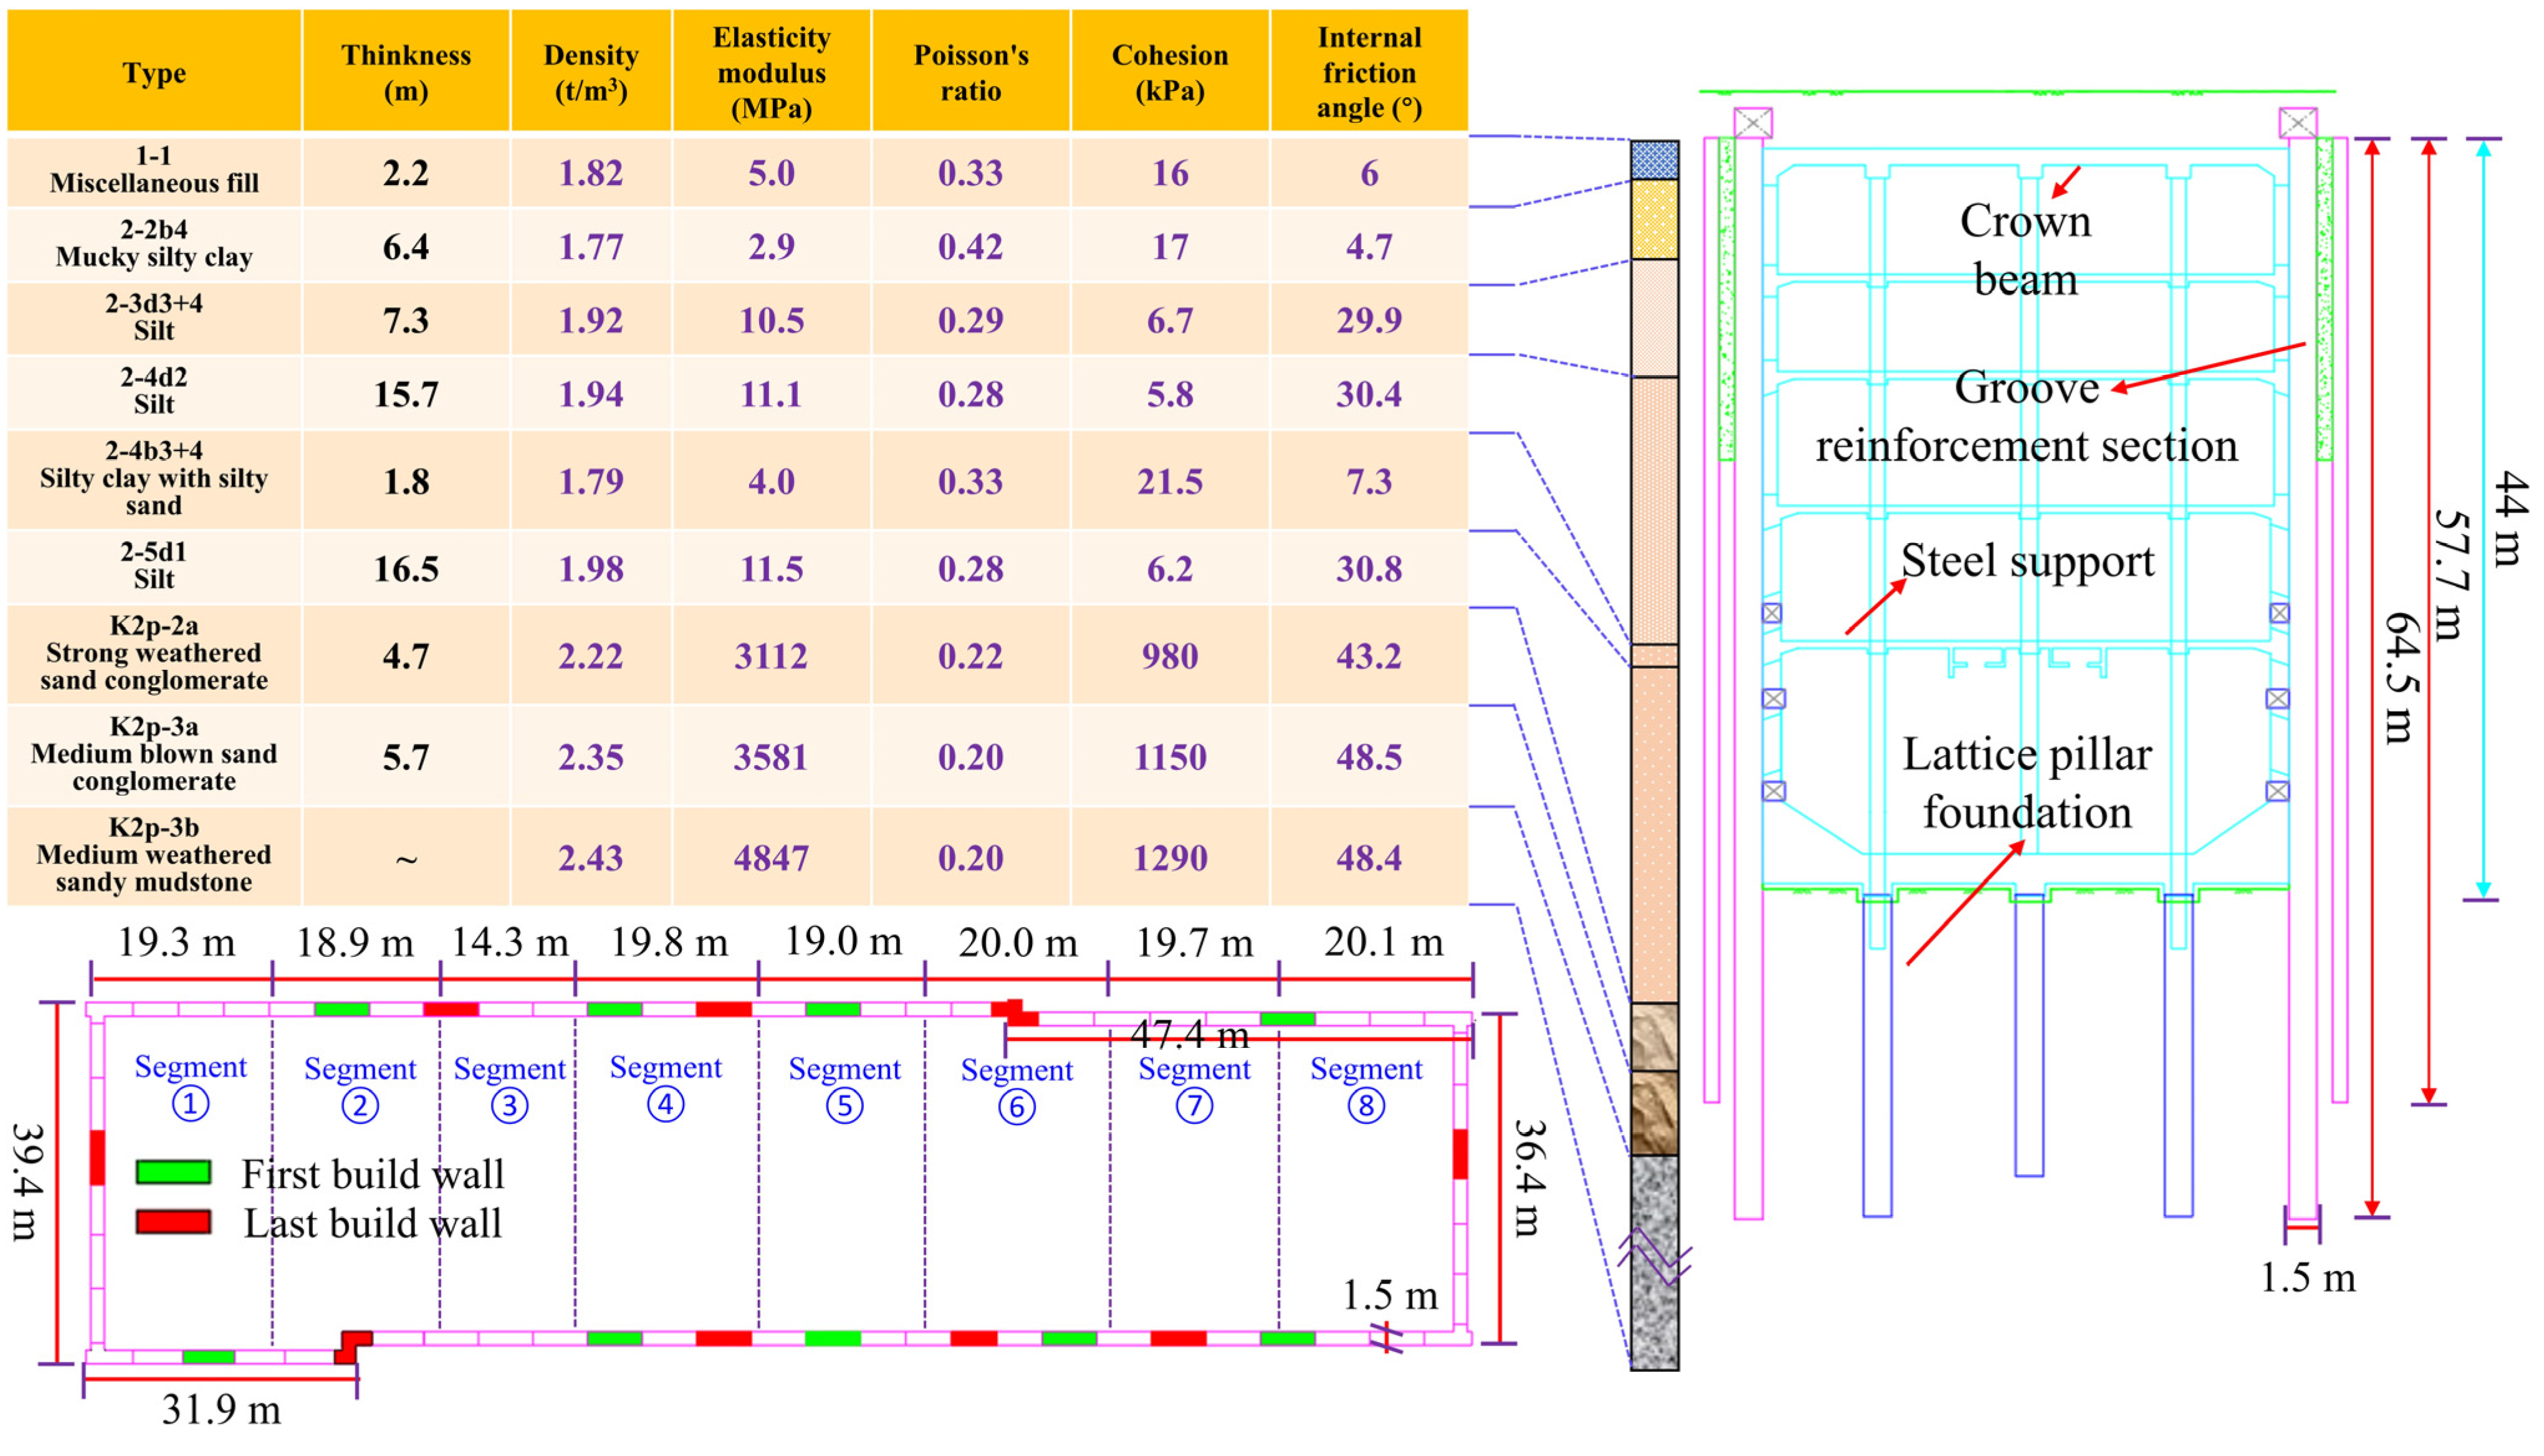
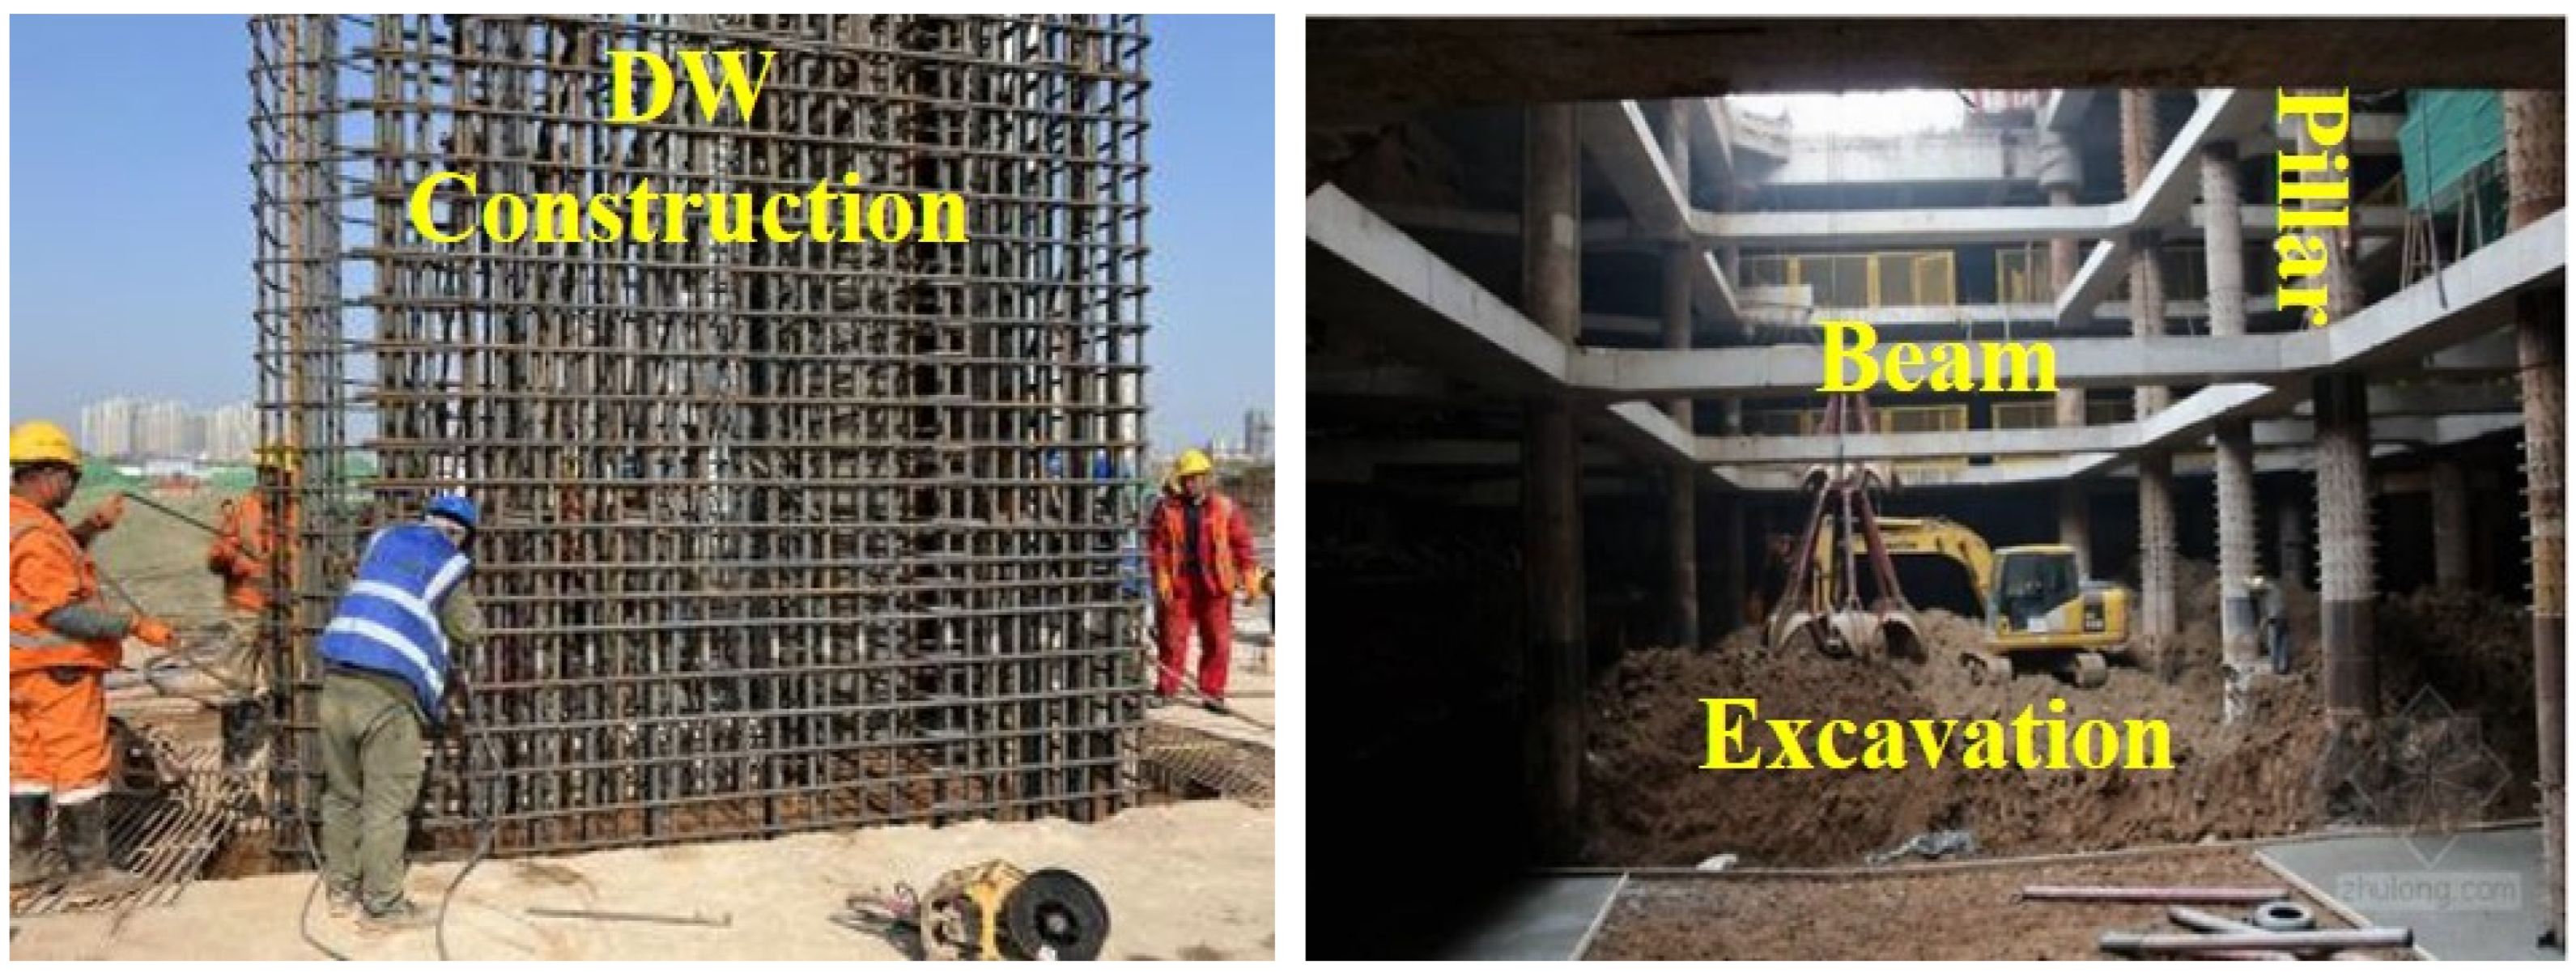
2. Project Overview
3. Modeling and Scheme Design
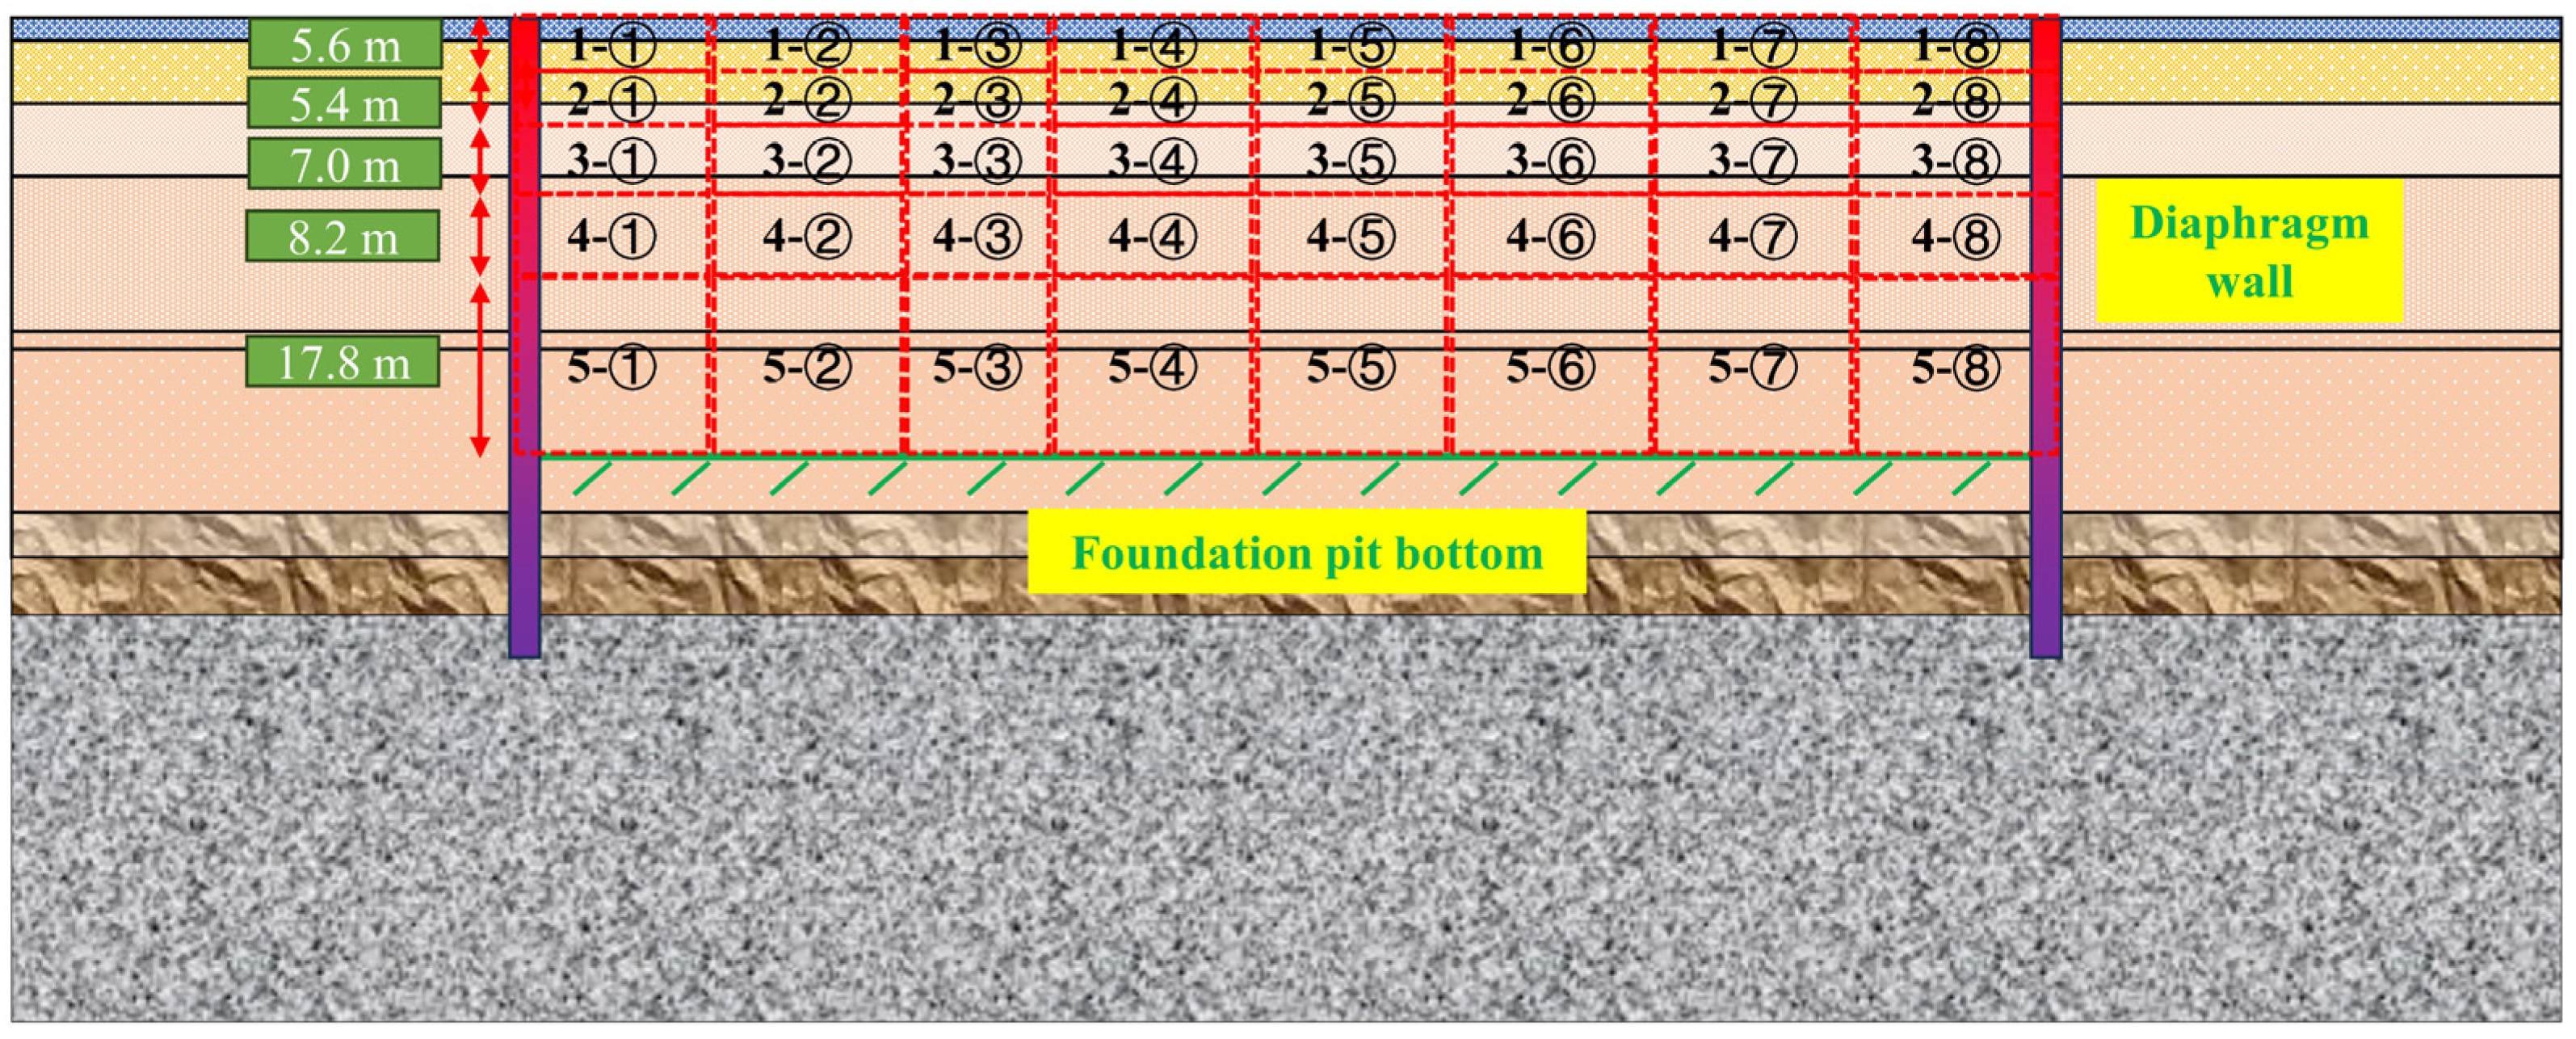
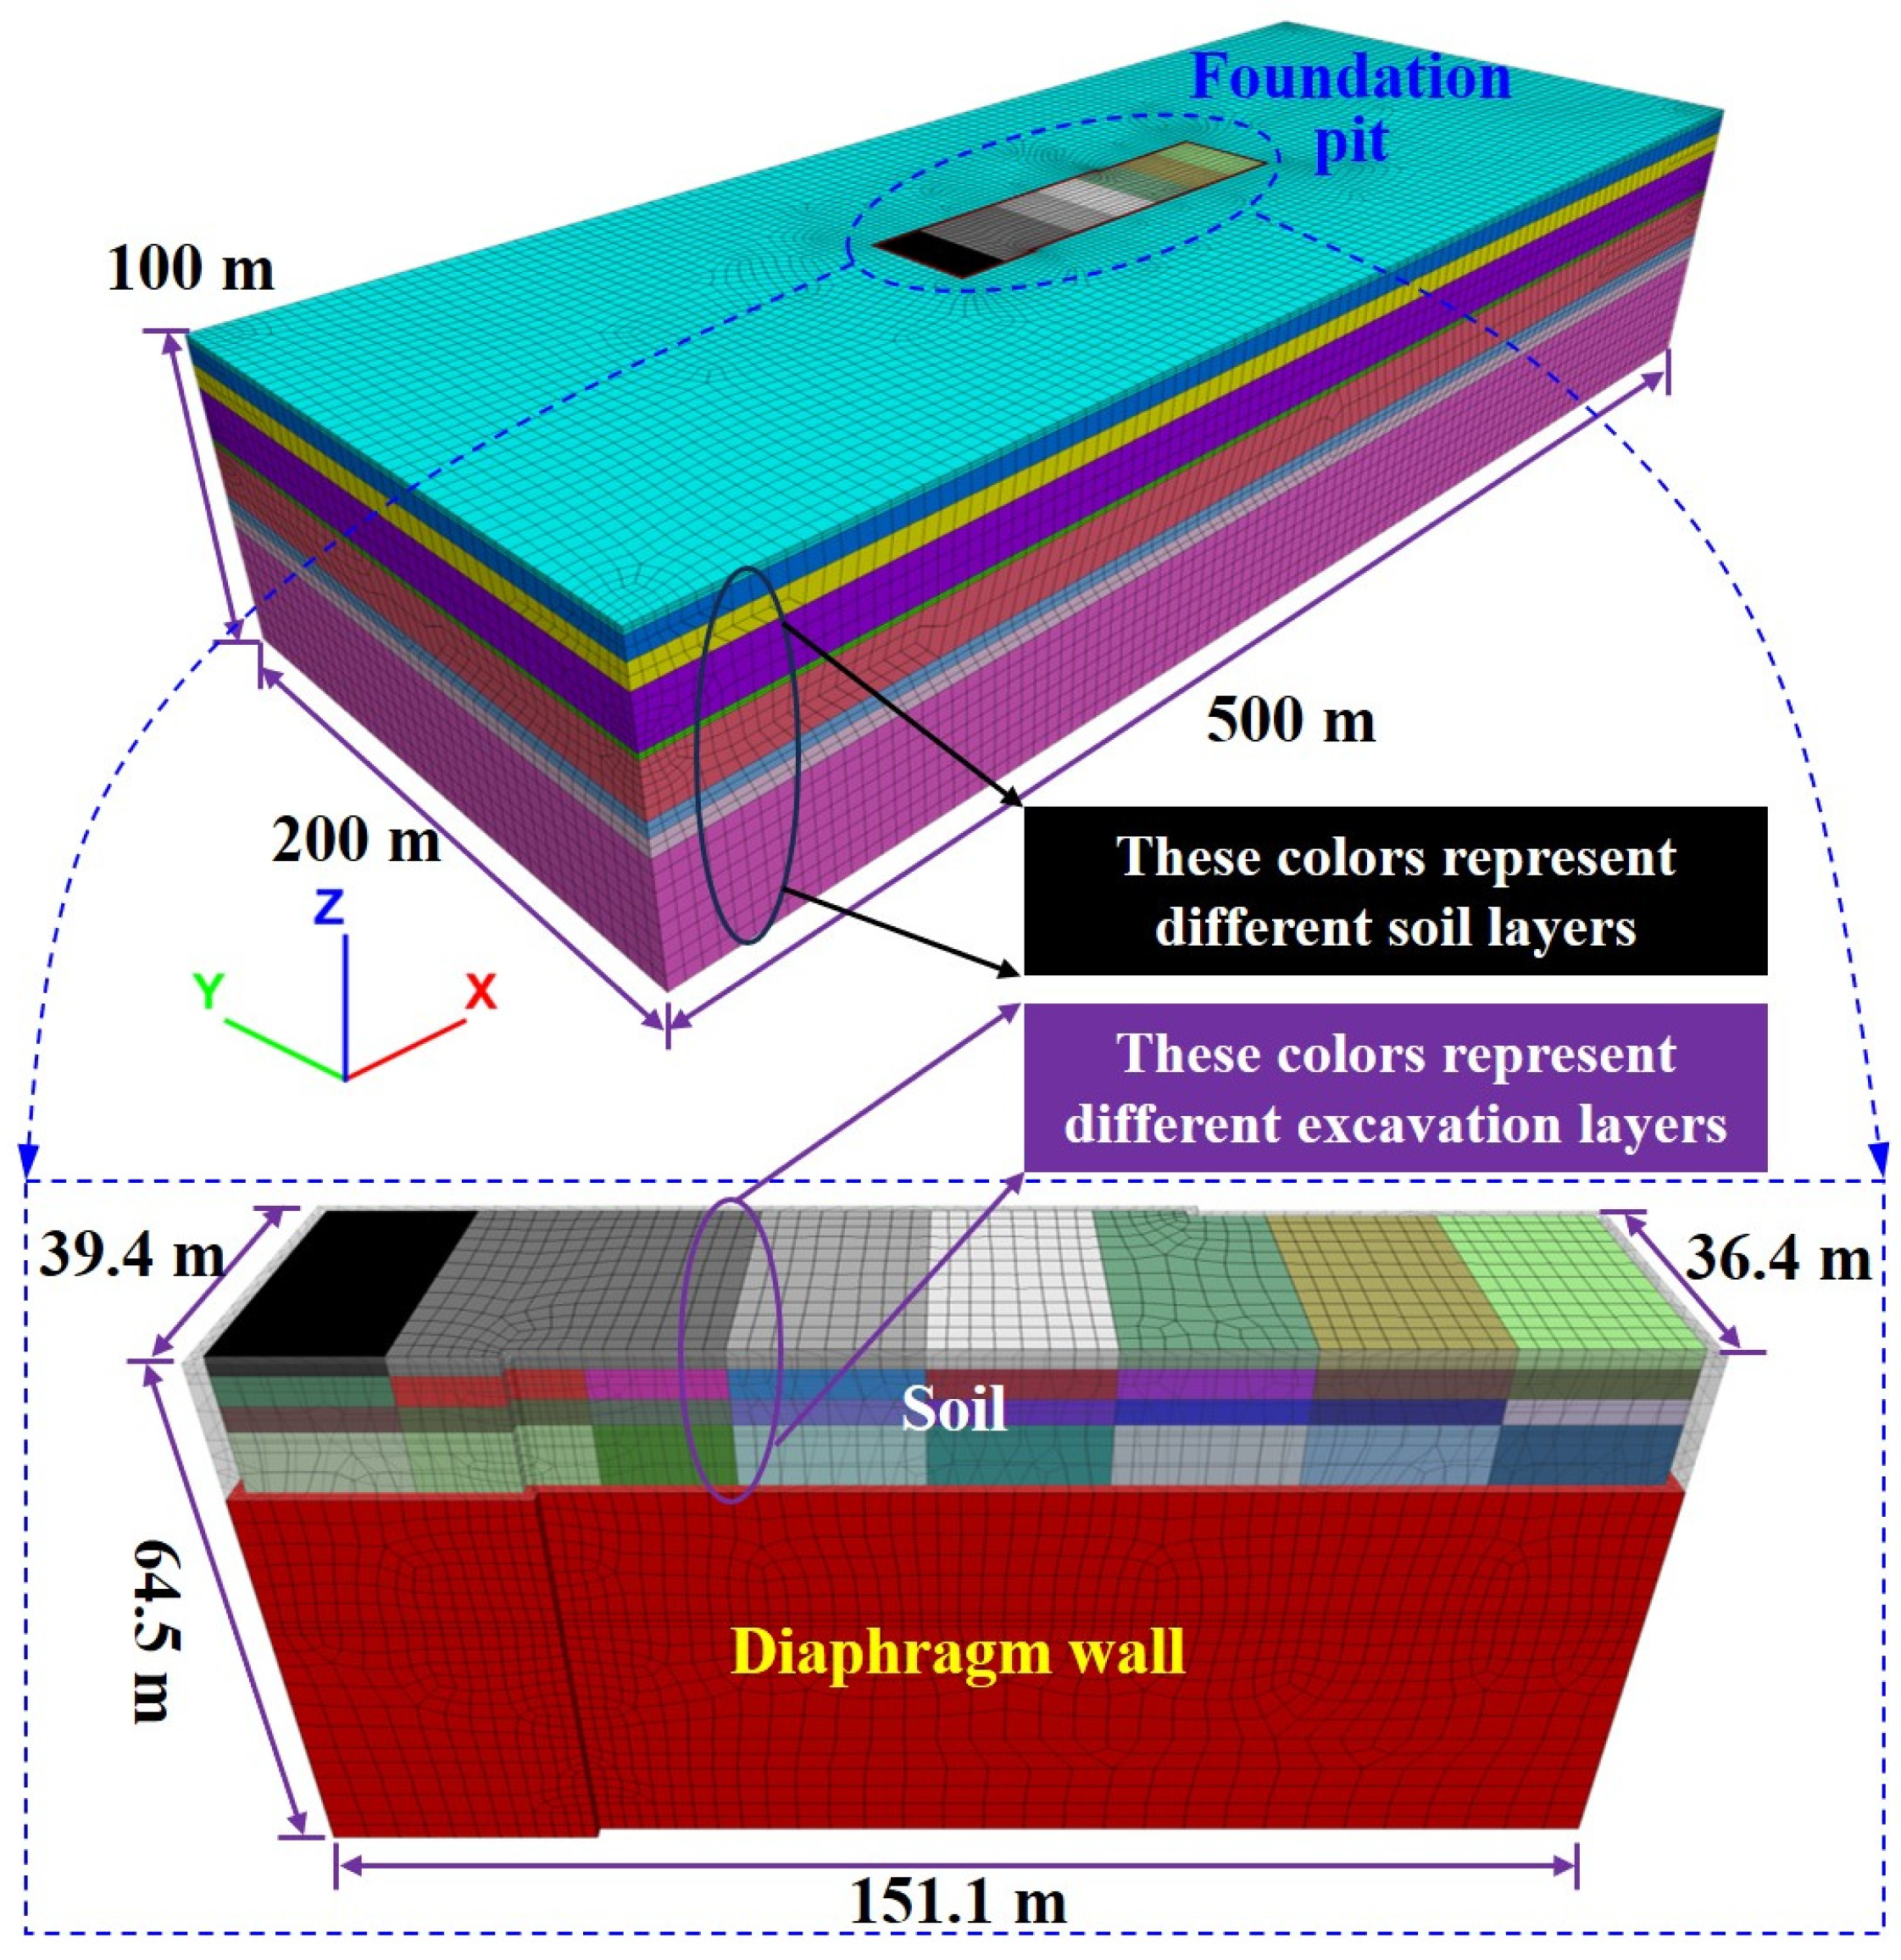
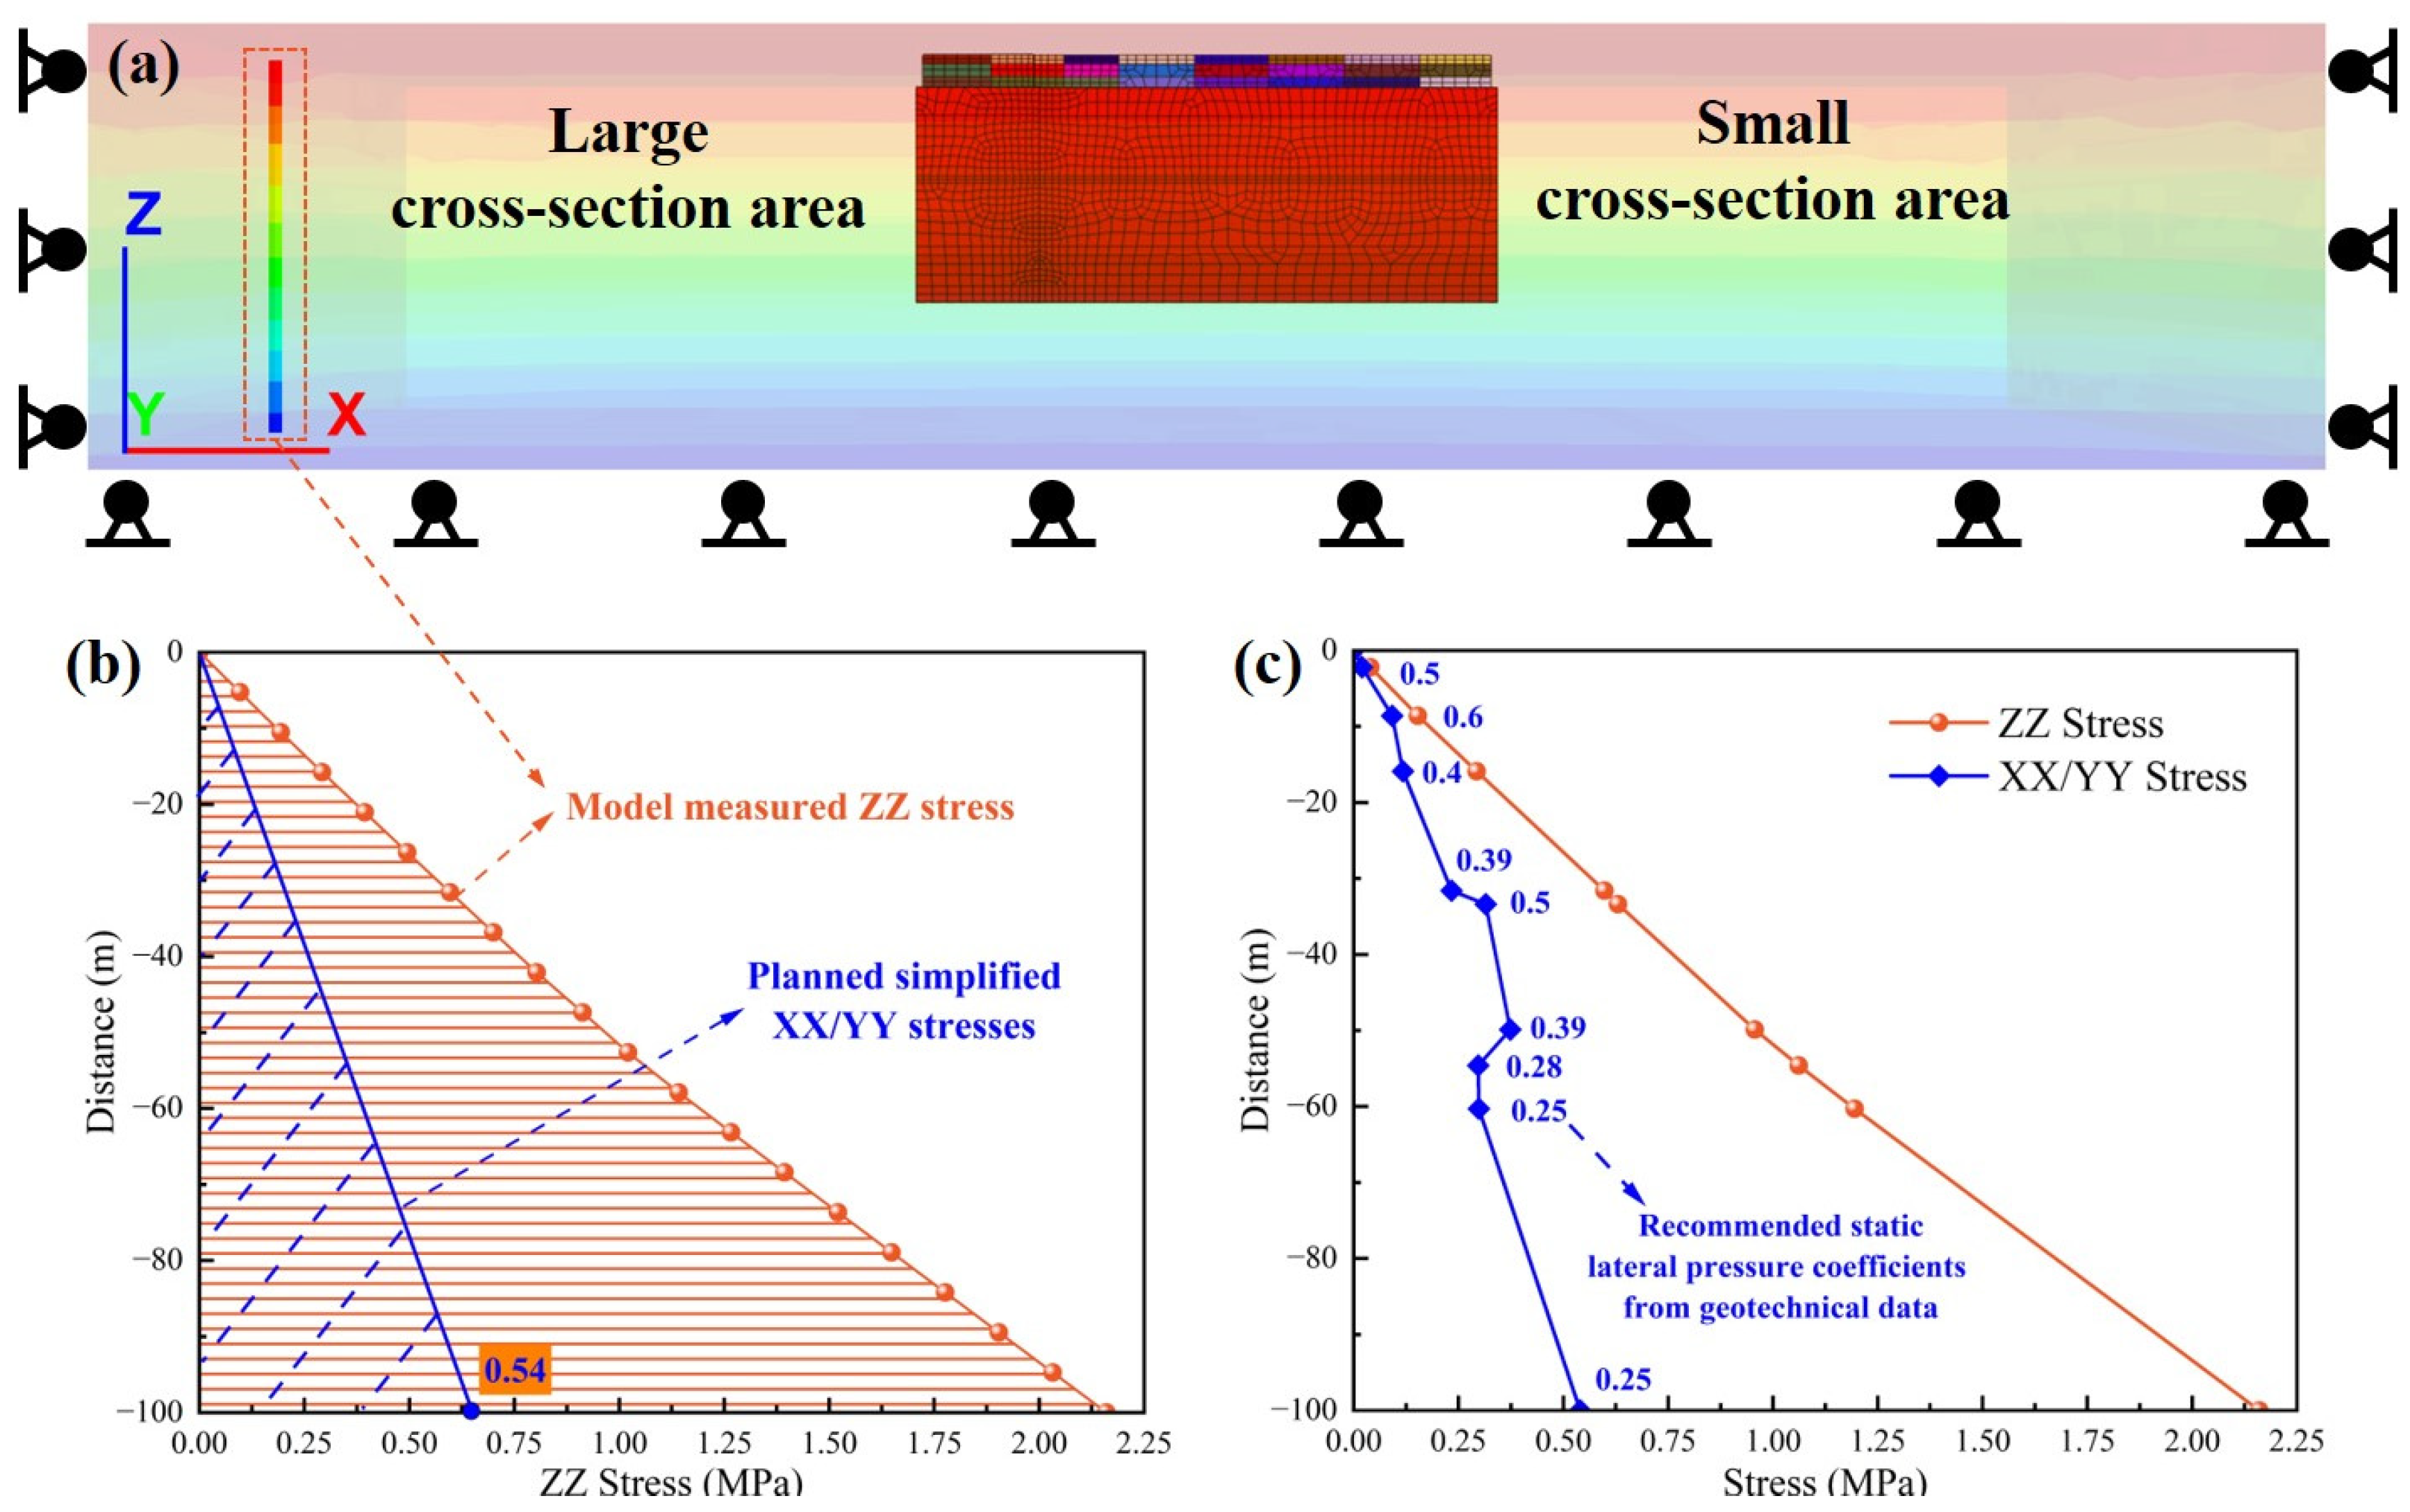
3.1. Modeling
3.2. Scheme Design
4. Simulation Results and Analysis
5. Discussion
5.1. Determination of the Optimal Excavation Scheme
5.2. Process Stability of the Optimal Excavation Scheme
6. Conclusions
- (1)
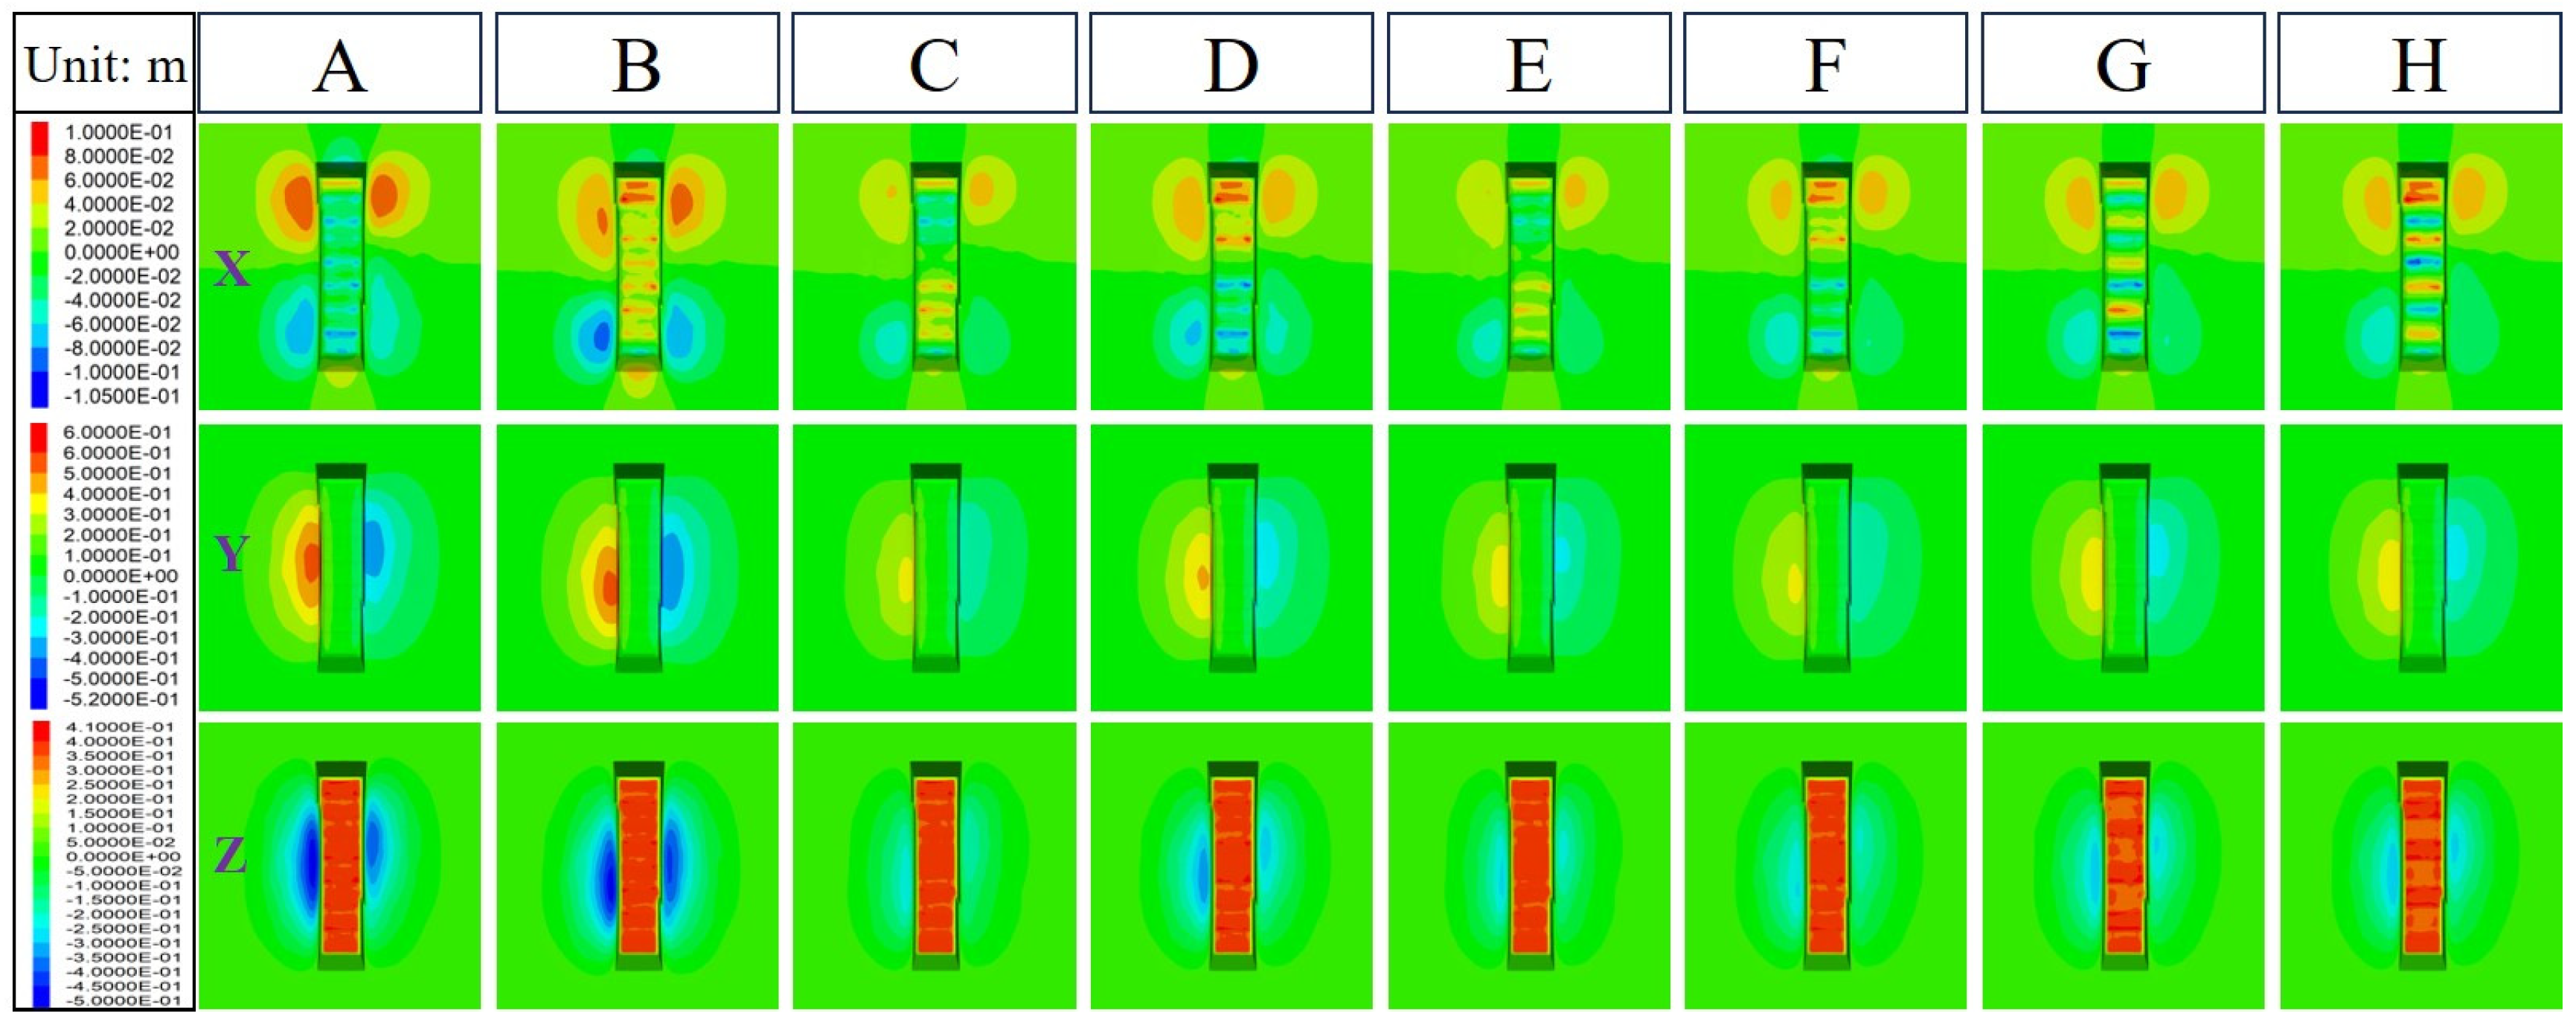
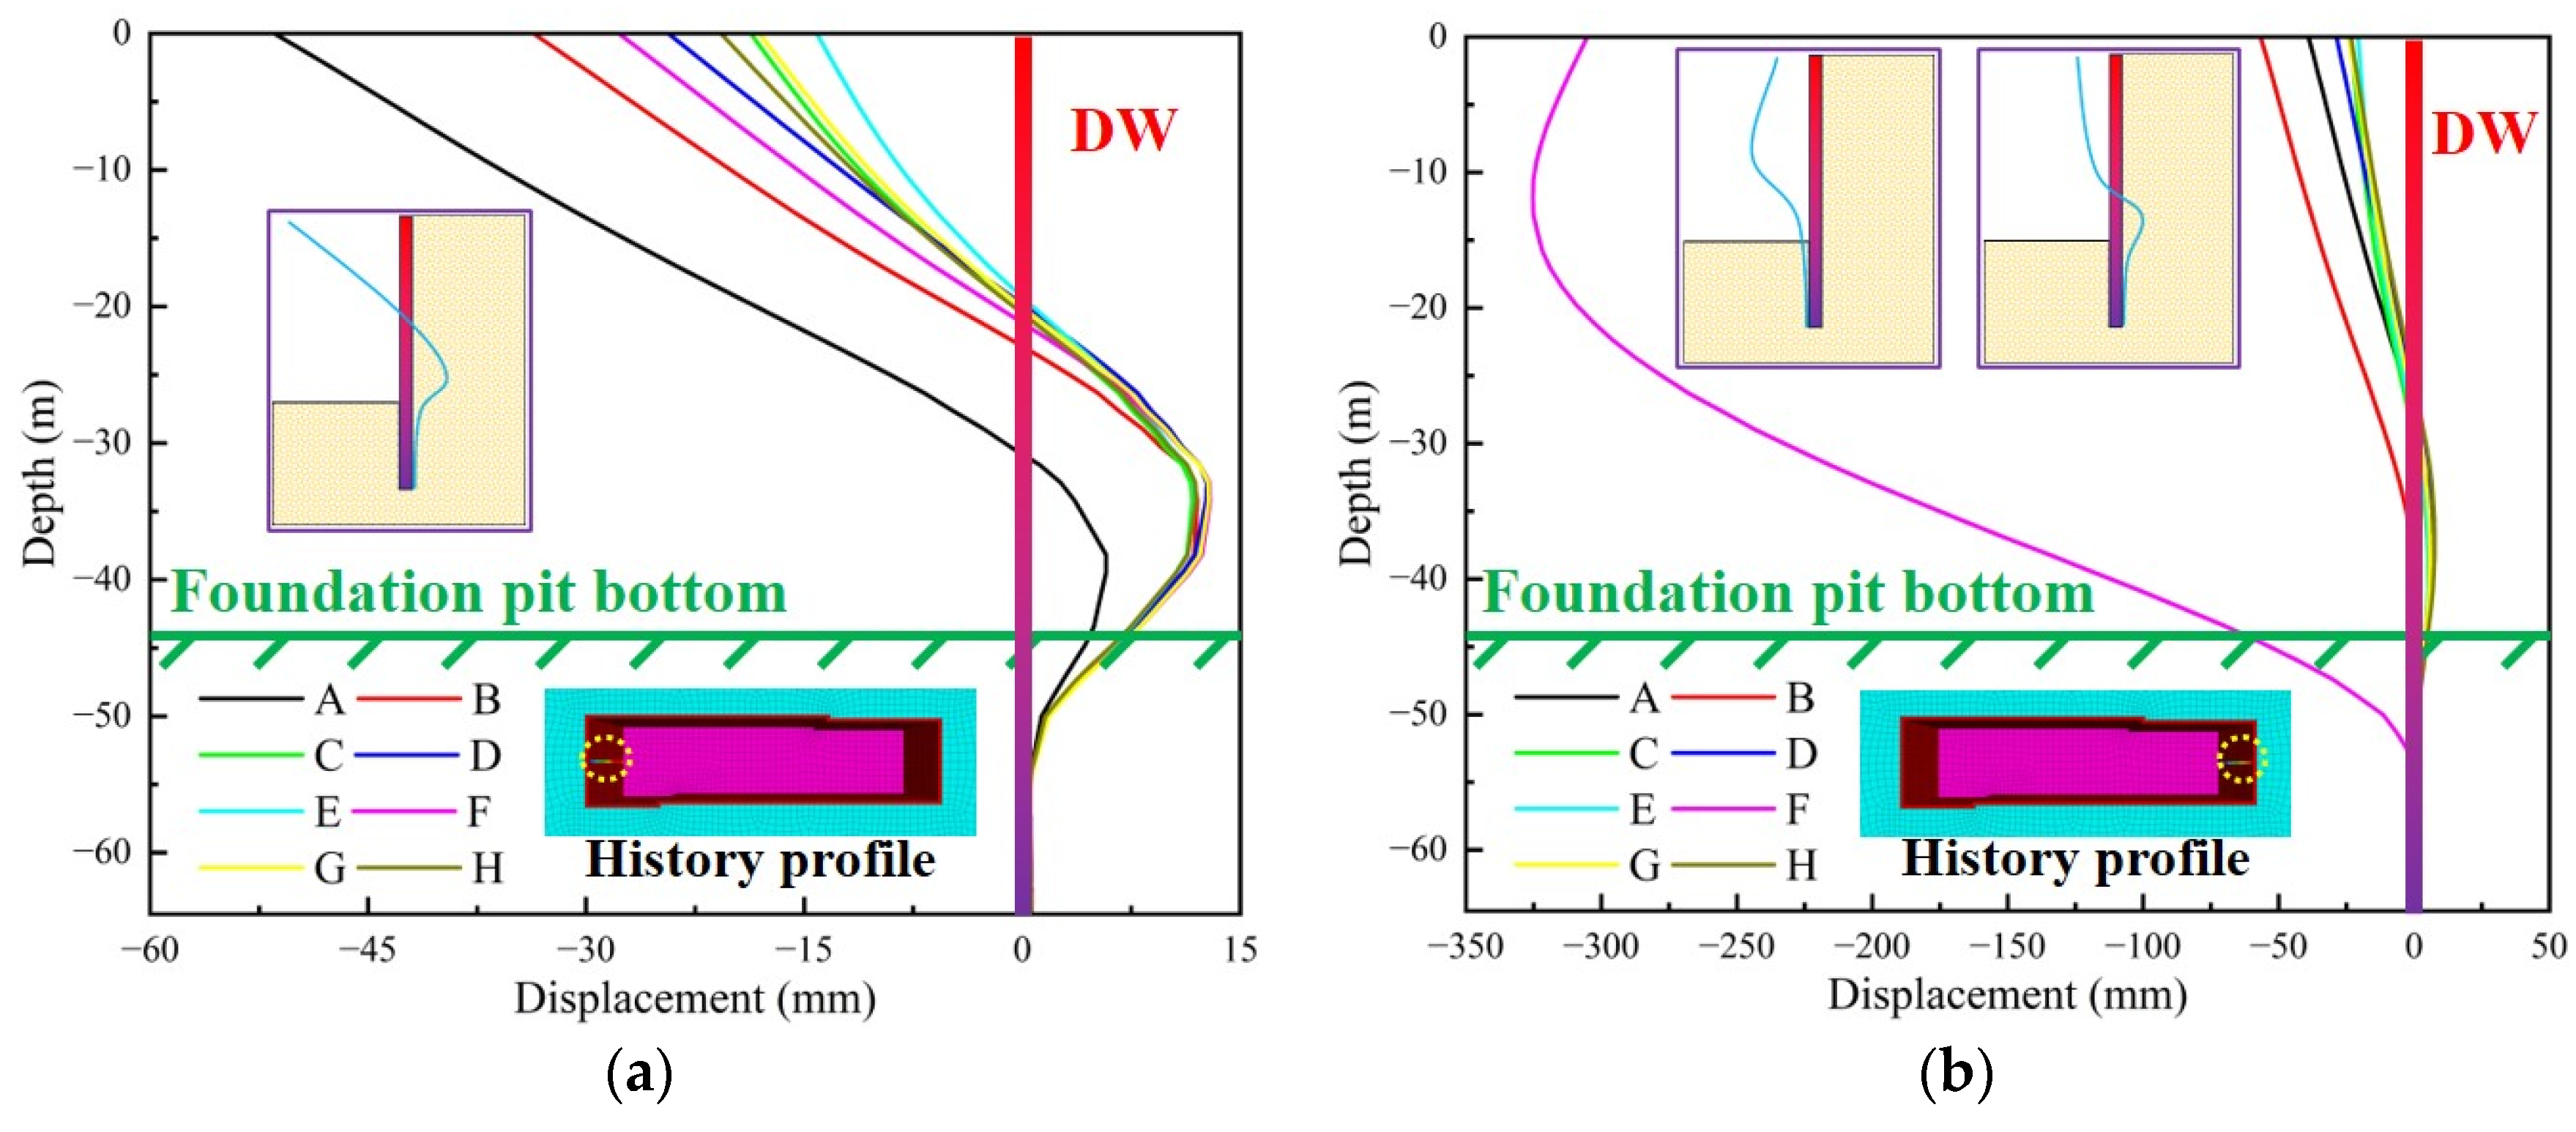
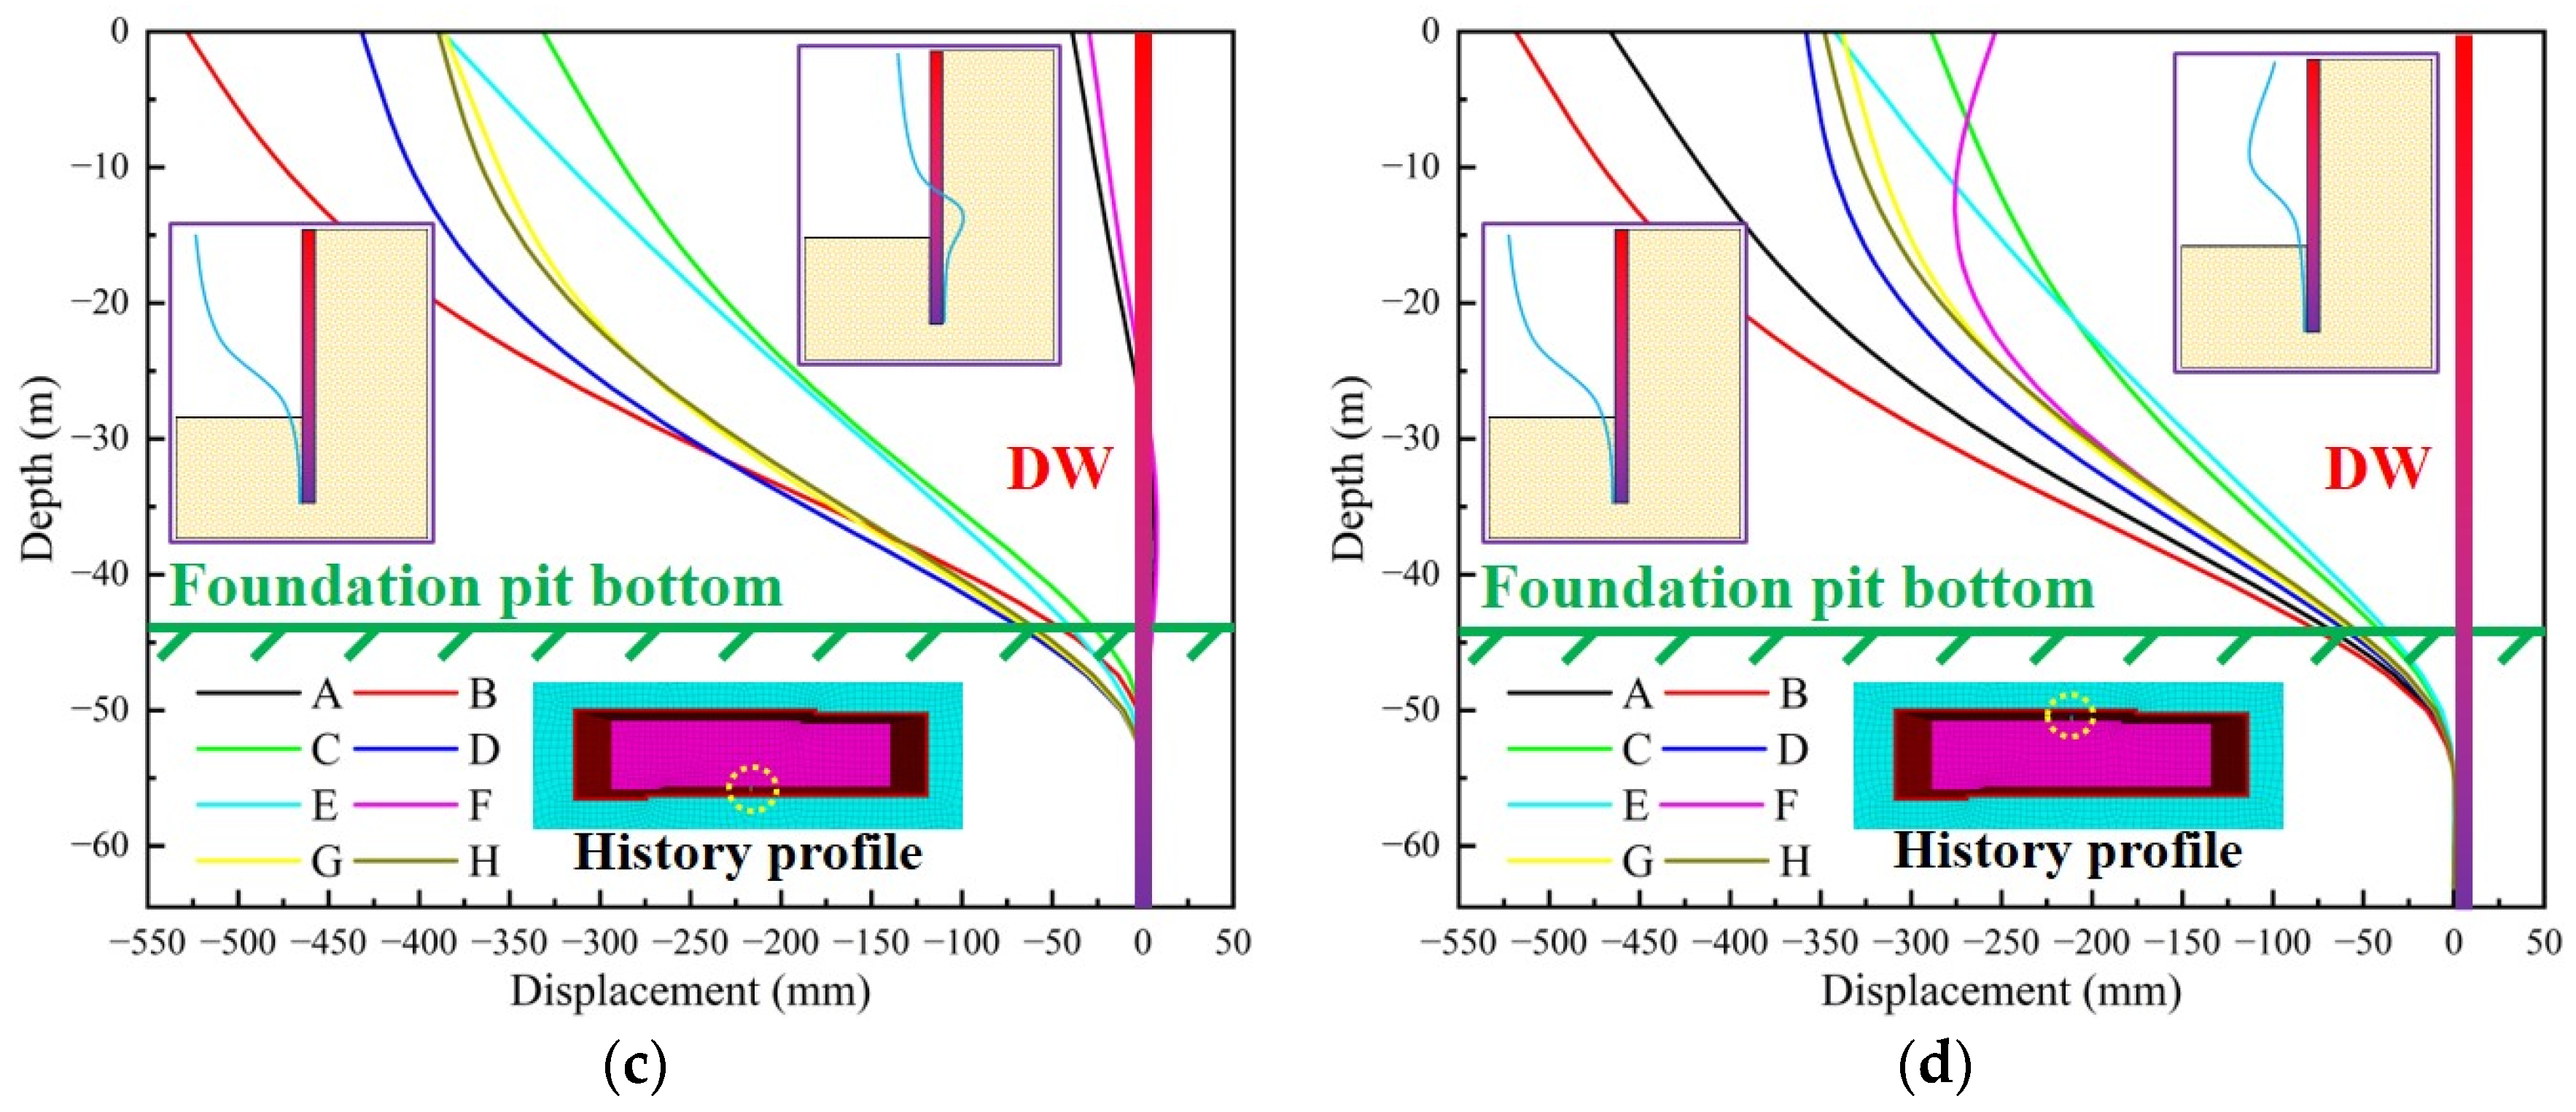
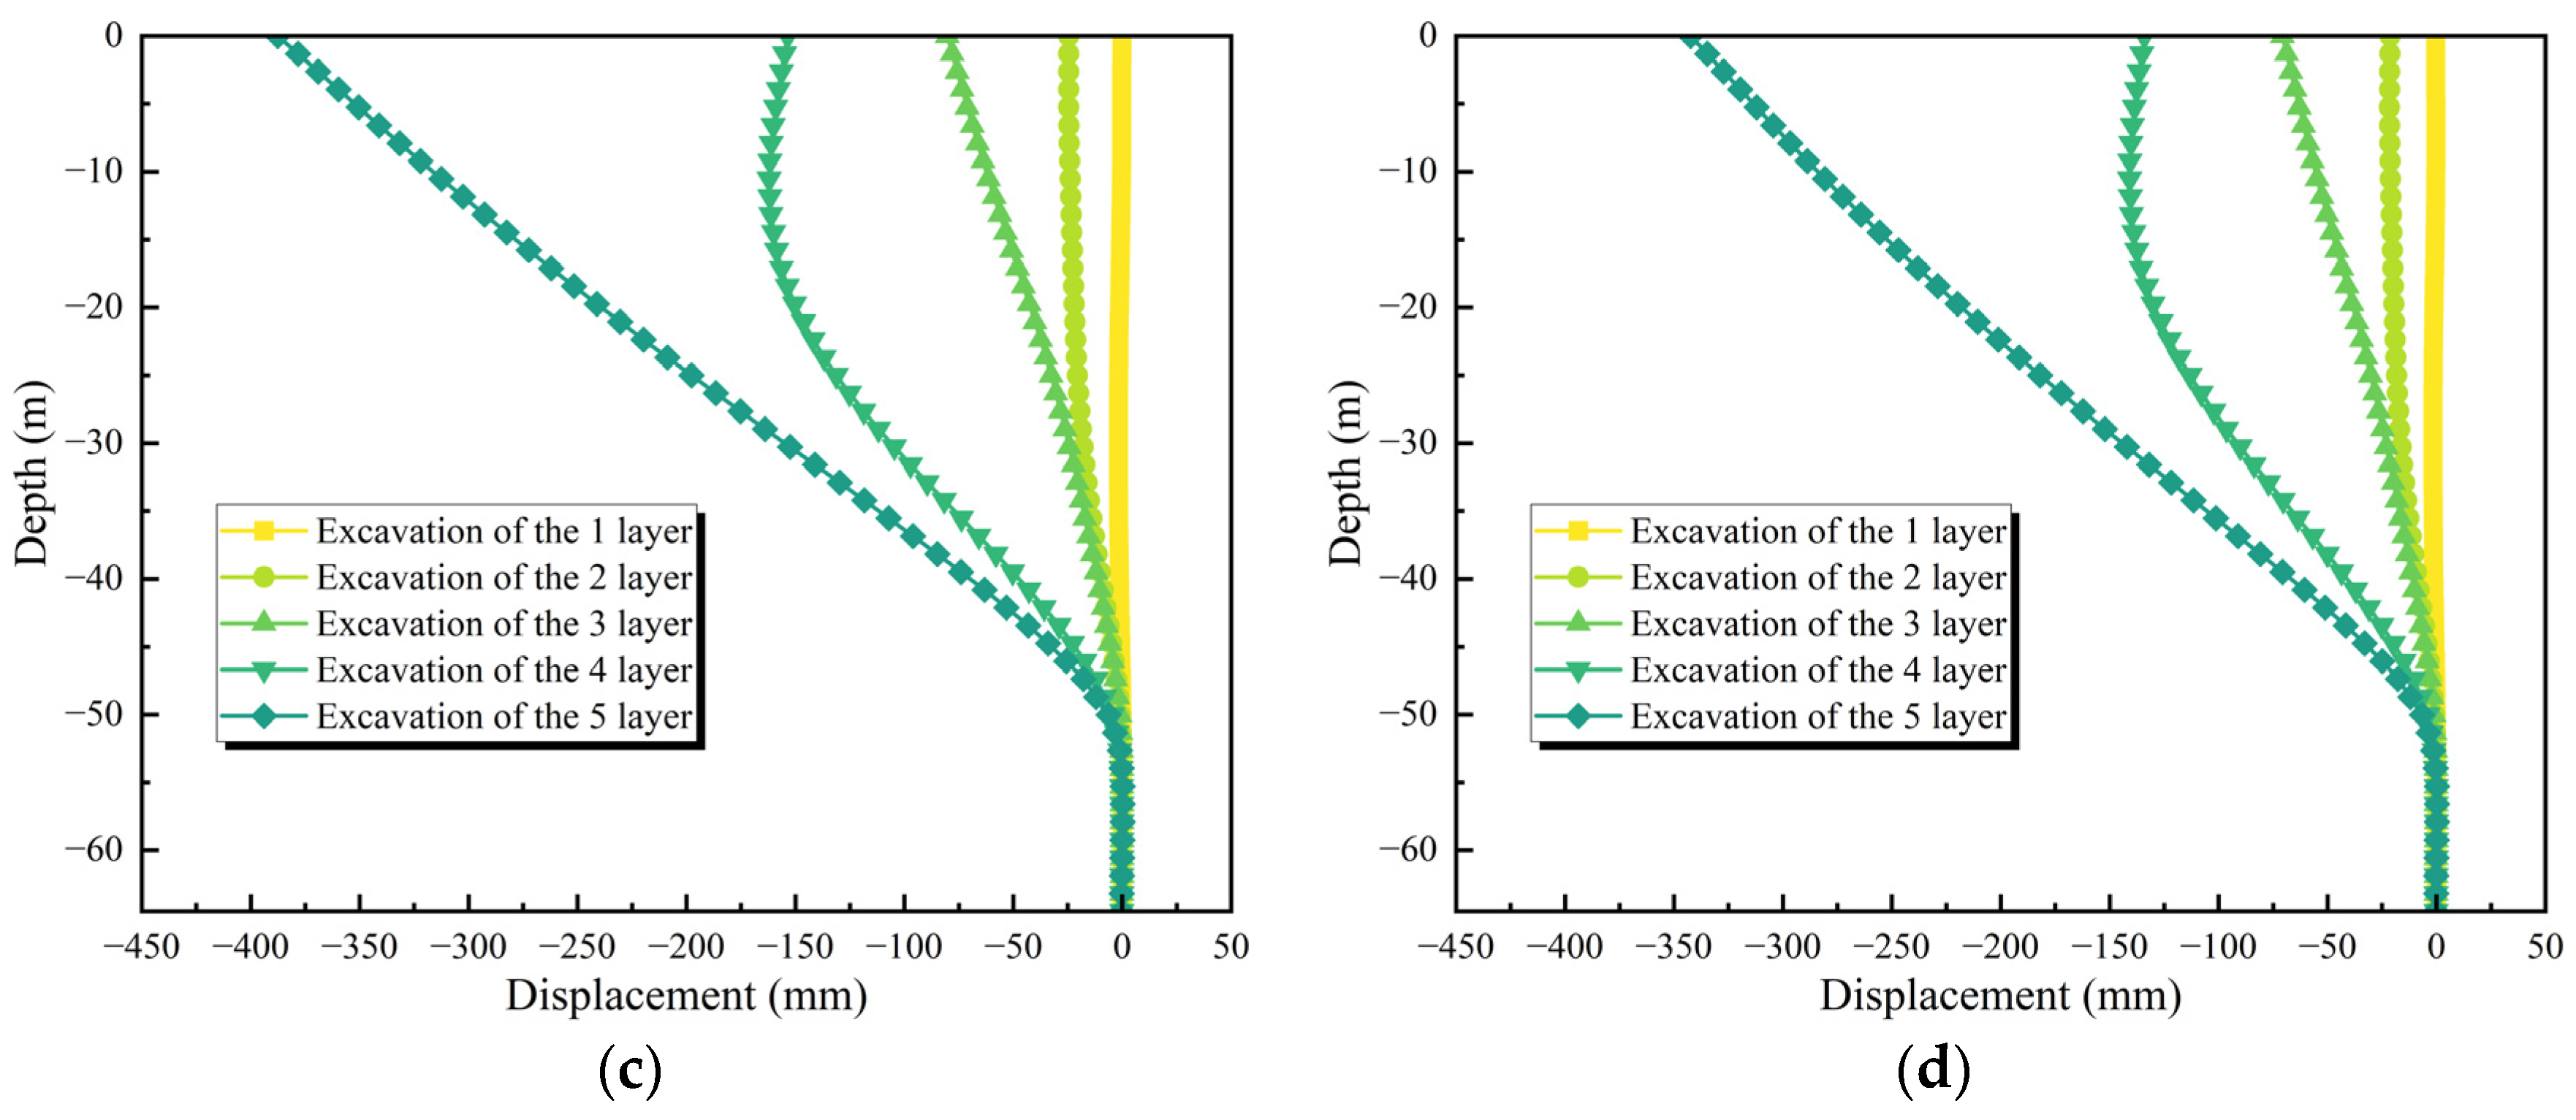
- Different excavation sequences can significantly affect the stability of a foundation pit, for the displacement, in which the maximum cumulative value of the displacement under scheme E is only 67.5% of that under scheme A. In addition, the excavation sequence and excavation phases lead to a change in the type of horizontal displacement of the foundation pit.
- (2)
- We defined a foundation pit excavation safety coefficient Kes, which comprises six factors that were scored using the min–max normalization method, and we obtained the optimal excavation sequence scheme, i.e., scheme E: “Excavate from the two ends of the foundation pit to the center at the same time, and then after completing the excavation of the first layer, then excavate from the center of the next layer to the two ends”.
- (3)
- Irregular-shaped foundation pits can also lead to local differences in the foundation pit’s stability; for example, in scheme E, the maximum displacement of the wide end reaches 221% of that the narrow end, but the length of the wide end is only 108.9% of that of the narrow end. Therefore, attention should paid to the reinforcement of weak areas when implementing supports.
Author Contributions
Funding
Institutional Review Board Statement
Informed Consent Statement
Data Availability Statement
Conflicts of Interest
Appendix A
Appendix A.1. Deformation Pattern of DW

Appendix A.2. Data from Other Simulation Results

References
- Zhou, N.; Vermeer, P.A.; Lou, R.; Tang, Y.; Jiang, S. Numerical Simulation of Deep Foundation Pit Dewatering and Optimization of Controlling Land Subsidence. Eng. Geol. 2010, 114, 251–260. [Google Scholar] [CrossRef]
- Wang, C.T.; Wang, H.; Qin, W.M.; Zhong, G.Q.; Chen, W. Evaluation of Collapse Possibility of Deep Foundation Pits in Metro Stations Based on Multi-State Fuzzy Bayesian Networks. Rock Soil Mech. 2020, 41, 1670–1679. [Google Scholar]
- Wang, Q.; Kang, X.; Zhu, K. Coupling Evaluation Method of the Construction Risk for Subway Deep Foundation Pit. J. Northeast. Univ. Nat. Sci. 2021, 42, 1152. [Google Scholar]
- Zhou, J.Z. Application of Gray Correlation Fault Tree Analysis for Unprotected Open Cut Excavations. China Civ. Eng. J. 2009, 42, 109–114. [Google Scholar]
- Sun, Y.; Li, Z. Study on Design and Deformation Law of Pile-Anchor Support System in Deep Foundation Pit. Sustainability 2022, 14, 12190. [Google Scholar] [CrossRef]
- Zhou, X.J.; Wang, J.H.; Mao, L.L.; Guo, R. Design of Typical Subway Station Structure and Its Enclosure with Open Cut Method in Chengdu City. Appl. Mech. Mater. 2014, 501–504, 1711–1714. [Google Scholar] [CrossRef]
- Orrego, C.; Lowther, R.; Newcombe, G.; Castro, R.; Báez, F.; Suzuki, K. Undercutting Method Selection at Cadia East PC2-3 Extension; University of Chile: Santiago, Chile, 2020; pp. 370–384. [Google Scholar]
- Han, W.; Li, G.; Sun, Z.; Luan, H.; Liu, C.; Wu, X. Numerical Investigation of a Foundation Pit Supported by a Composite Soil Nailing Structure. Symmetry 2020, 12, 252. [Google Scholar] [CrossRef]
- Lan, B.; Wang, Y.; Wang, W. Review of the Double-Row Pile Supporting Structure and Its Force and Deformation Characteristics. Appl. Sci. 2023, 13, 7715. [Google Scholar] [CrossRef]
- Wang, J.; Ma, G.; Zhuang, H.; Dou, Y.; Fu, J. Influence of Diaphragm Wall on Seismic Responses of Large Unequal-Span Subway Station in Liquefiable Soils. Tunn. Undergr. Space Technol. 2019, 91, 102988. [Google Scholar] [CrossRef]
- Li, J.; Li, J.; Cai, Y.; Wu, D.; Guo, C.; Zhao, W.; Tang, K.; Liu, Y. Application of Artificial Freezing Method in Deformation Control of Subway Tunnel. Adv. Mater. Sci. Eng. 2022, 2022, e3251318. [Google Scholar] [CrossRef]
- Yuan, J.; Huang, Y.; Cheng, L.; Yan, R.; Yuan, Y. Research on Internal Force of 3-D Modeling of Fish Belly Beam Supported in Foundation Pit Based on Computer Intelligent Stress Monitoring System. Highlights Sci. Eng. Technol. 2022, 28, 381–386. [Google Scholar] [CrossRef]
- Ashida, K. Trench Cutting and Re-Mixing Deep Wall (TRD) Construction Method; Yokohoko Renzoku Kussakushiki Chichu Renzokuheki Zosei Koho. Tsuchi Kiso Soil Mech. Found. Eng. 1996, 44, 40. [Google Scholar]
- Zhang, J.; Chen, Y. Experimental Study on Mitigations of Seismic Settlement and Tilting of Structures by Adopting Improved Soil Slab and Soil Mixing Walls. Sustainability 2018, 10, 4069. [Google Scholar] [CrossRef]
- Ai-jun, Z.; Zhi-yun, Z. Displacements and Internal Forces of Retaining Structures in Center-Island Excavation Based on Foundation Resistance Method. Chin. J. Geotech. Eng. 2014, 36, 42–47. [Google Scholar] [CrossRef]
- Bao-guo, C.; Teng-fei, Y.A.N.; Cheng-peng, W. Experimental Study on Compatible Deformation of Diaphragm Wall Support System for Deep Foundation Pit. Rock Soil Mech. 2020, 41, 3289–3299. [Google Scholar]
- Qiao, S.; Cai, Z.; Zhang, Z.; Tan, J. Behavior of Retaining System of Narrow-Long Deep Foundation Pit in Soft Soil in Nansha Port Area. J. ZheJiang Univ. Eng. Sci. 2022, 56, 1473–1484. [Google Scholar]
- Feng, Z.; Xu, Q.; Xu, X.; Tang, Q.; Li, X.; Liao, X. Deformation Characteristics of Soil Layers and Diaphragm Walls during Deep Foundation Pit Excavation: Simulation Verification and Parameter Analysis. Symmetry 2022, 14, 254. [Google Scholar] [CrossRef]
- Ma, S.; Fu, X.; Lu, H.; Huang, Z.; Zhang, J. A Combined Support Method of Isolation Pile and Diaphragm Wall for Protection of Buildings Adjacent to Deep Foundation Pit. Arab. J. Geosci. 2021, 14, 2005. [Google Scholar] [CrossRef]
- Zhou, Y.; Li, C.; Zhou, C.; Luo, H. Using Bayesian Network for Safety Risk Analysis of Diaphragm Wall Deflection Based on Field Data. Reliab. Eng. Syst. Saf. 2018, 180, 152–167. [Google Scholar] [CrossRef]
- Yang, T.; Liu, S.; Wang, X.; Zhao, H.; Liu, Y.; Li, Y. Analysis of the Deformation Law of Deep and Large Foundation Pits in Soft Soil Areas. Front. Earth Sci. 2022, 10, 828354. [Google Scholar] [CrossRef]
- Wang, J.; Liu, P.; Hu, J.; Pan, W.; Long, Y.; Cao, A.; Li, H.; Sun, Y. Mechanism of Detecting the Construction Quality of a Diaphragm Wall by an Infrared Thermal Field and Engineering Application. Materials 2023, 16, 1052. [Google Scholar] [CrossRef] [PubMed]
- Zeng, G.F.; Xue, X.-L.; Song, W.-W.; Li, M.K.; Bai, N. Mechanism of Foundation Pit Deformation Caused by Dewatering before Soil Excavation: An Experimental Study. Rock Soil Mech. 2020, 41, 2963. [Google Scholar] [CrossRef]
- Zeng, C.-F.; Zheng, G.; Zhou, X.-F.; Xue, X.-L.; Zhou, H.-Z. Behaviours of Wall and Soil during Pre-Excavation Dewatering under Different Foundation Pit Widths. Comput. Geotech. 2019, 115, 103169. [Google Scholar] [CrossRef]
- You, Y.; Yan, C.; Xu, B.; Liu, S.; Che, C. Optimization of Dewatering Schemes for a Deep Foundation Pit near the Yangtze River, China. J. Rock Mech. Geotech. Eng. 2018, 10, 555–566. [Google Scholar] [CrossRef]
- He, C.; Lu, Y.; Yang, Y. Effect of Size on the Stability of Narrow Foundation Pits. Adv. Civ. Eng. 2022, 2022, e7391622. [Google Scholar] [CrossRef]
- Wang, J.; Xiang, H.; Yan, J. Numerical Simulation of Steel Sheet Pile Support Structures in Foundation Pit Excavation. Int. J. Geomech. 2019, 19, 05019002. [Google Scholar] [CrossRef]
- Wang, J.; Liu, X.; Wu, Y.; Liu, S.; Wu, L.; Lou, R.; Lu, J.; Yin, Y. Field Experiment and Numerical Simulation of Coupling Non-Darcy Flow Caused by Curtain and Pumping Well in Foundation Pit Dewatering. J. Hydrol. 2017, 549, 277–293. [Google Scholar] [CrossRef]
- Chen, J.; Xu, Q.; Luo, X.; Tian, A.; Xu, S.; Tang, Q. Safety Evaluation and Energy Consumption Analysis of Deep Foundation Pit Excavation through Numerical Simulation and In-Site Monitoring. Energies 2022, 15, 7099. [Google Scholar] [CrossRef]
- Itasca, F. Fast Lagrangian Analysis of Continua in 3 Dimensions. Online Man. 2013, 175–180. [Google Scholar]
- Wang, M.; Song, Z.; Zheng, D.; Shen, W.; Gou, P.; Wei, S. Development and Application of Rock Energy Dissipation Model in FLAC3D. J. China Coal Soc. 2021, 46, 2565–2573. [Google Scholar]
- Wang, L.; Zhang, X.; Yin, S.; Zhang, X.; Jia, Y.; Kong, H. Evaluation of Stope Stability and Displacement in a Subsidence Area Using 3Dmine–Rhino3D–FLAC3D Coupling. Minerals 2022, 12, 1202. [Google Scholar] [CrossRef]
- Zi-sheng, D.; Yin-sheng, Z.O.U. Calculation of the earth pressure considering nonlinear displacement influence on deep excavation. Eng. Mech. 2004, 21, 107–111. [Google Scholar]
- Toupin, R.A. Saint-Venant’s Principle. Arch. Ration. Mech. Anal. 1965, 18, 83–96. [Google Scholar] [CrossRef]
- Cui, X.Z.; Jin, Q.; Shang, Q.S.; Liu, S.T. Mohr-Coulomb Model Considering Variation of Elastic Modulus and Its Application. Key Eng. Mater. 2006, 306–308, 1445–1448. [Google Scholar] [CrossRef]
- Cheng, C.; Xu, N.; Zheng, B. Mobilized Mohr-Coulomb and Hoek-Brown Strength Parameters during Failure of Granite in Alxa Area in China for High-Level Radioactive Waste Disposal. Energies 2019, 12, 4237. [Google Scholar] [CrossRef]
- Guo, X.; Zhao, Z.; Gao, X.; Wu, X.; Ma, N. Analytical Solutions for Characteristic Radii of Circular Roadway Surrounding Rock Plastic Zone and Their Application. Int. J. Min. Sci. Technol. 2019, 29, 263–272. [Google Scholar] [CrossRef]
- Ma, Y.; Lu, A.; Cai, H.; Zeng, X. Analytical Solution for Determining the Plastic Zones around Two Unequal Circular Tunnels. Tunn. Undergr. Space Technol. 2022, 120, 104267. [Google Scholar] [CrossRef]
- You, X.; Zhou, Q.; Xiao, Y.; Tong, L.; Yang, Q. Numerical Study on the Coupling Effect on a Retaining Structure of a Complex Deep Foundation Pit Group Excavation in a Soft-Soil Area. Appl. Sci. 2023, 13, 3263. [Google Scholar] [CrossRef]
- Su, T.; Zhou, Y.; Wang, Z.; Zhu, Q. Influence of Construction Sequence on the Force Characteristics of Foundation Pit Support Structure. Int. J. Civ. Eng. 2023, 21, 1751–1767. [Google Scholar] [CrossRef]
- Clough, W.; O’Rourke, T.D. Construction Induced Movements of Insitu Wall, Design and Performance of Earth Retaining Structure. ASCE 1990, 439–479. [Google Scholar]
- Chen, S.; Cui, J.; Liang, F. Case Study on the Deformation Coupling Effect of a Deep Foundation Pit Group in a Coastal Soft Soil Area. Appl. Sci. 2022, 12, 6205. [Google Scholar] [CrossRef]
- Finno, R.J.; Bryson, L.S. Response of Building Adjacent to Stiff Excavation Support System in Soft Clay. J. Perform. Constr. Facil. 2002, 16, 10–20. [Google Scholar] [CrossRef]
- Finno, R.J.; Blackburn, J.T.; Roboski, J.F. Three-Dimensional Effects for Supported Excavations in Clay. J. Geotech. Geoenviron. Eng. 2007, 133, 30–36. [Google Scholar] [CrossRef]


| Value Type | Thicknesses (m) | Elasticity Modulus (GPa) | Poisson’s Ratio | Density (t/m3) |
|---|---|---|---|---|
| actual value | 1.5 | 35 | 0.25 | 2.5 |
| simulated value | 1.5 | 100 | 0.2 | 2.5 |
| Scheme | Presentation | Total Steps | |
|---|---|---|---|
| A | 1-①→1-②→1-③→1-④→1-⑤→1-⑥→1-⑦→1-⑧→ 2-①→2-②→2-③→2-④→2-⑤→2-⑥→2-⑦→2-⑧→ 3-①→3-②→3-③→3-④→3-⑤→3-⑥→3-⑦→3-⑧→ 4-①→4-②→4-③→4-④→4-⑤→4-⑥→4-⑦→4-⑧→ 5-①→5-②→5-③→5-④→5-⑤→5-⑥→5-⑦→5-⑧→ | 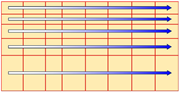 | 20,000 |
| B | 1-⑧→1-⑦→1-⑥→1-⑤→1-④→1-③→1-②→1-①→ 2-⑧→2-⑦→2-⑥→2-⑤→2-④→2-③→2-②→2-①→ 3-⑧→3-⑦→3-⑥→3-⑤→3-④→3-③→3-②→3-①→ 4-⑧→4-⑦→4-⑥→4-⑤→4-④→4-③→4-②→4-①→ 5-⑧→5-⑦→5-⑥→5-⑤→5-④→5-③→5-②→5-①→ | 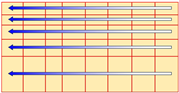 | 20,000 |
| C | 1-①, 1-⑧→1-②, 1-⑦→1-③, 1-⑥→1-④, 1-⑤→ 2-①, 2-⑧→2-②, 2-⑦→2-③, 2-⑥→2-④, 2-⑤→ 3-①, 3-⑧→3-②, 3-⑦→3-③, 3-⑥→3-④, 3-⑤→ 4-①, 4-⑧→4-②, 4-⑦→4-③, 4-⑥→4-④, 4-⑤→ 5-①, 5-⑧→5-②, 5-⑦→5-③, 5-⑥→5-④, 5-⑤→ |  | 10,000 |
| D | 1-④, 1-⑤→1-③, 1-⑥→1-②, 1-⑦→1-①, 1-⑧→ 2-④, 2-⑤→2-③, 2-⑥→2-②, 2-⑦→2-①, 2-⑧→ 3-④, 3-⑤→3-③, 3-⑥→3-②, 3-⑦→3-①, 3-⑧→ 4-④, 4-⑤→4-③, 4-⑥→4-②, 4-⑦→4-①, 4-⑧→ 5-④, 5-⑤→5-③, 5-⑥→5-②, 5-⑦→5-①, 5-⑧→ | 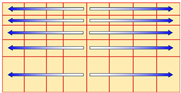 | 10,000 |
| E | 1-①, 1-⑧→1-②, 1-⑦→1-③, 1-⑥→1-④, 1-⑤→ 2-④, 2-⑤→2-③, 2-⑥→2-②, 2-⑦→2-①, 2-⑧→ 3-①, 3-⑧→3-②, 3-⑦→3-③, 3-⑥→3-④, 3-⑤→ 4-④, 4-⑤→4-③, 4-⑥→4-②, 4-⑦→4-①, 4-⑧→ 5-①, 5-⑧→5-②, 5-⑦→5-③, 5-⑥→5-④, 5-⑤→ | 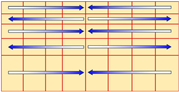 | 10,000 |
| F | 1-④, 1-⑤→1-③, 1-⑥→1-②, 1-⑦→1-①, 1-⑧→ 2-①, 2-⑧→2-②, 2-⑦→2-③, 2-⑥→2-④, 2-⑤→ 3-④, 3-⑤→3-③, 3-⑥→3-②, 3-⑦→3-①, 3-⑧→ 4-①, 4-⑧→4-②, 4-⑦→4-③, 4-⑥→4-④, 4-⑤→ 5-④, 5-⑤→5-③, 5-⑥→5-②, 5-⑦→5-①, 5-⑧→ | 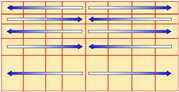 | 10,000 |
| G | 1-①, 1-③→1-⑤, 1-⑦→1-②, 1-④→1-⑥, 1-⑧→ 2-①, 2-③→2-⑤, 2-⑦→2-②, 2-④→2-⑥, 2-⑧→ 3-①, 3-③→3-⑤, 3-⑦→3-②, 3-④→3-⑥, 3-⑧→ 4-①, 4-③→4-⑤, 4-⑦→4-②, 4-④→4-⑥, 4-⑧→ 5-①, 5-③→5-⑤, 5-⑦→5-②, 5-④→5-⑥, 5-⑧→ |  | 10,000 |
| H | 1-②, 1-④→1-⑥, 1-⑧→1-①, 1-③→1-⑤, 1-⑦→ 2-①, 2-③→2-⑤, 2-⑦→2-②, 2-④→2-⑥, 2-⑧→ 3-①, 3-③→3-⑤, 3-⑦→3-②, 3-④→3-⑥, 3-⑧→ 4-①, 4-③→4-⑤, 4-⑦→4-②, 4-④→4-⑥, 4-⑧→ 5-①, 5-③→5-⑤, 5-⑦→5-②, 5-④→5-⑥, 5-⑧→ | 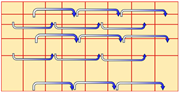 | 10,000 |
| Compositional Factor | Weight | Note | |
|---|---|---|---|
| Foundation pit excavation safety factor (Kes) | Displacement of the foundation pit (K1) | 0.5 | The displacement maxima in 6 directions XYZ in the model, maximum settlements at 4 monitoring points, maximum horizontal displacements on 4 survey lines |
| Time required for construction (K2) | 0.1 | The total steps required to complete pit excavation | |
| Deformation rate of the foundation pit (K3) | 0.1 | The maximum deformation rate in the model | |
| The volume of the plastic zone of the foundation pit (K4) | 0.1 | The “shear-now”, “shear-past”, “tensile-now”, and “tensile-past” volumes in the modeled plasticity region | |
| Maximum principal stress for DW (K5) | 0.1 | Maximum principal in the shell structure stress | |
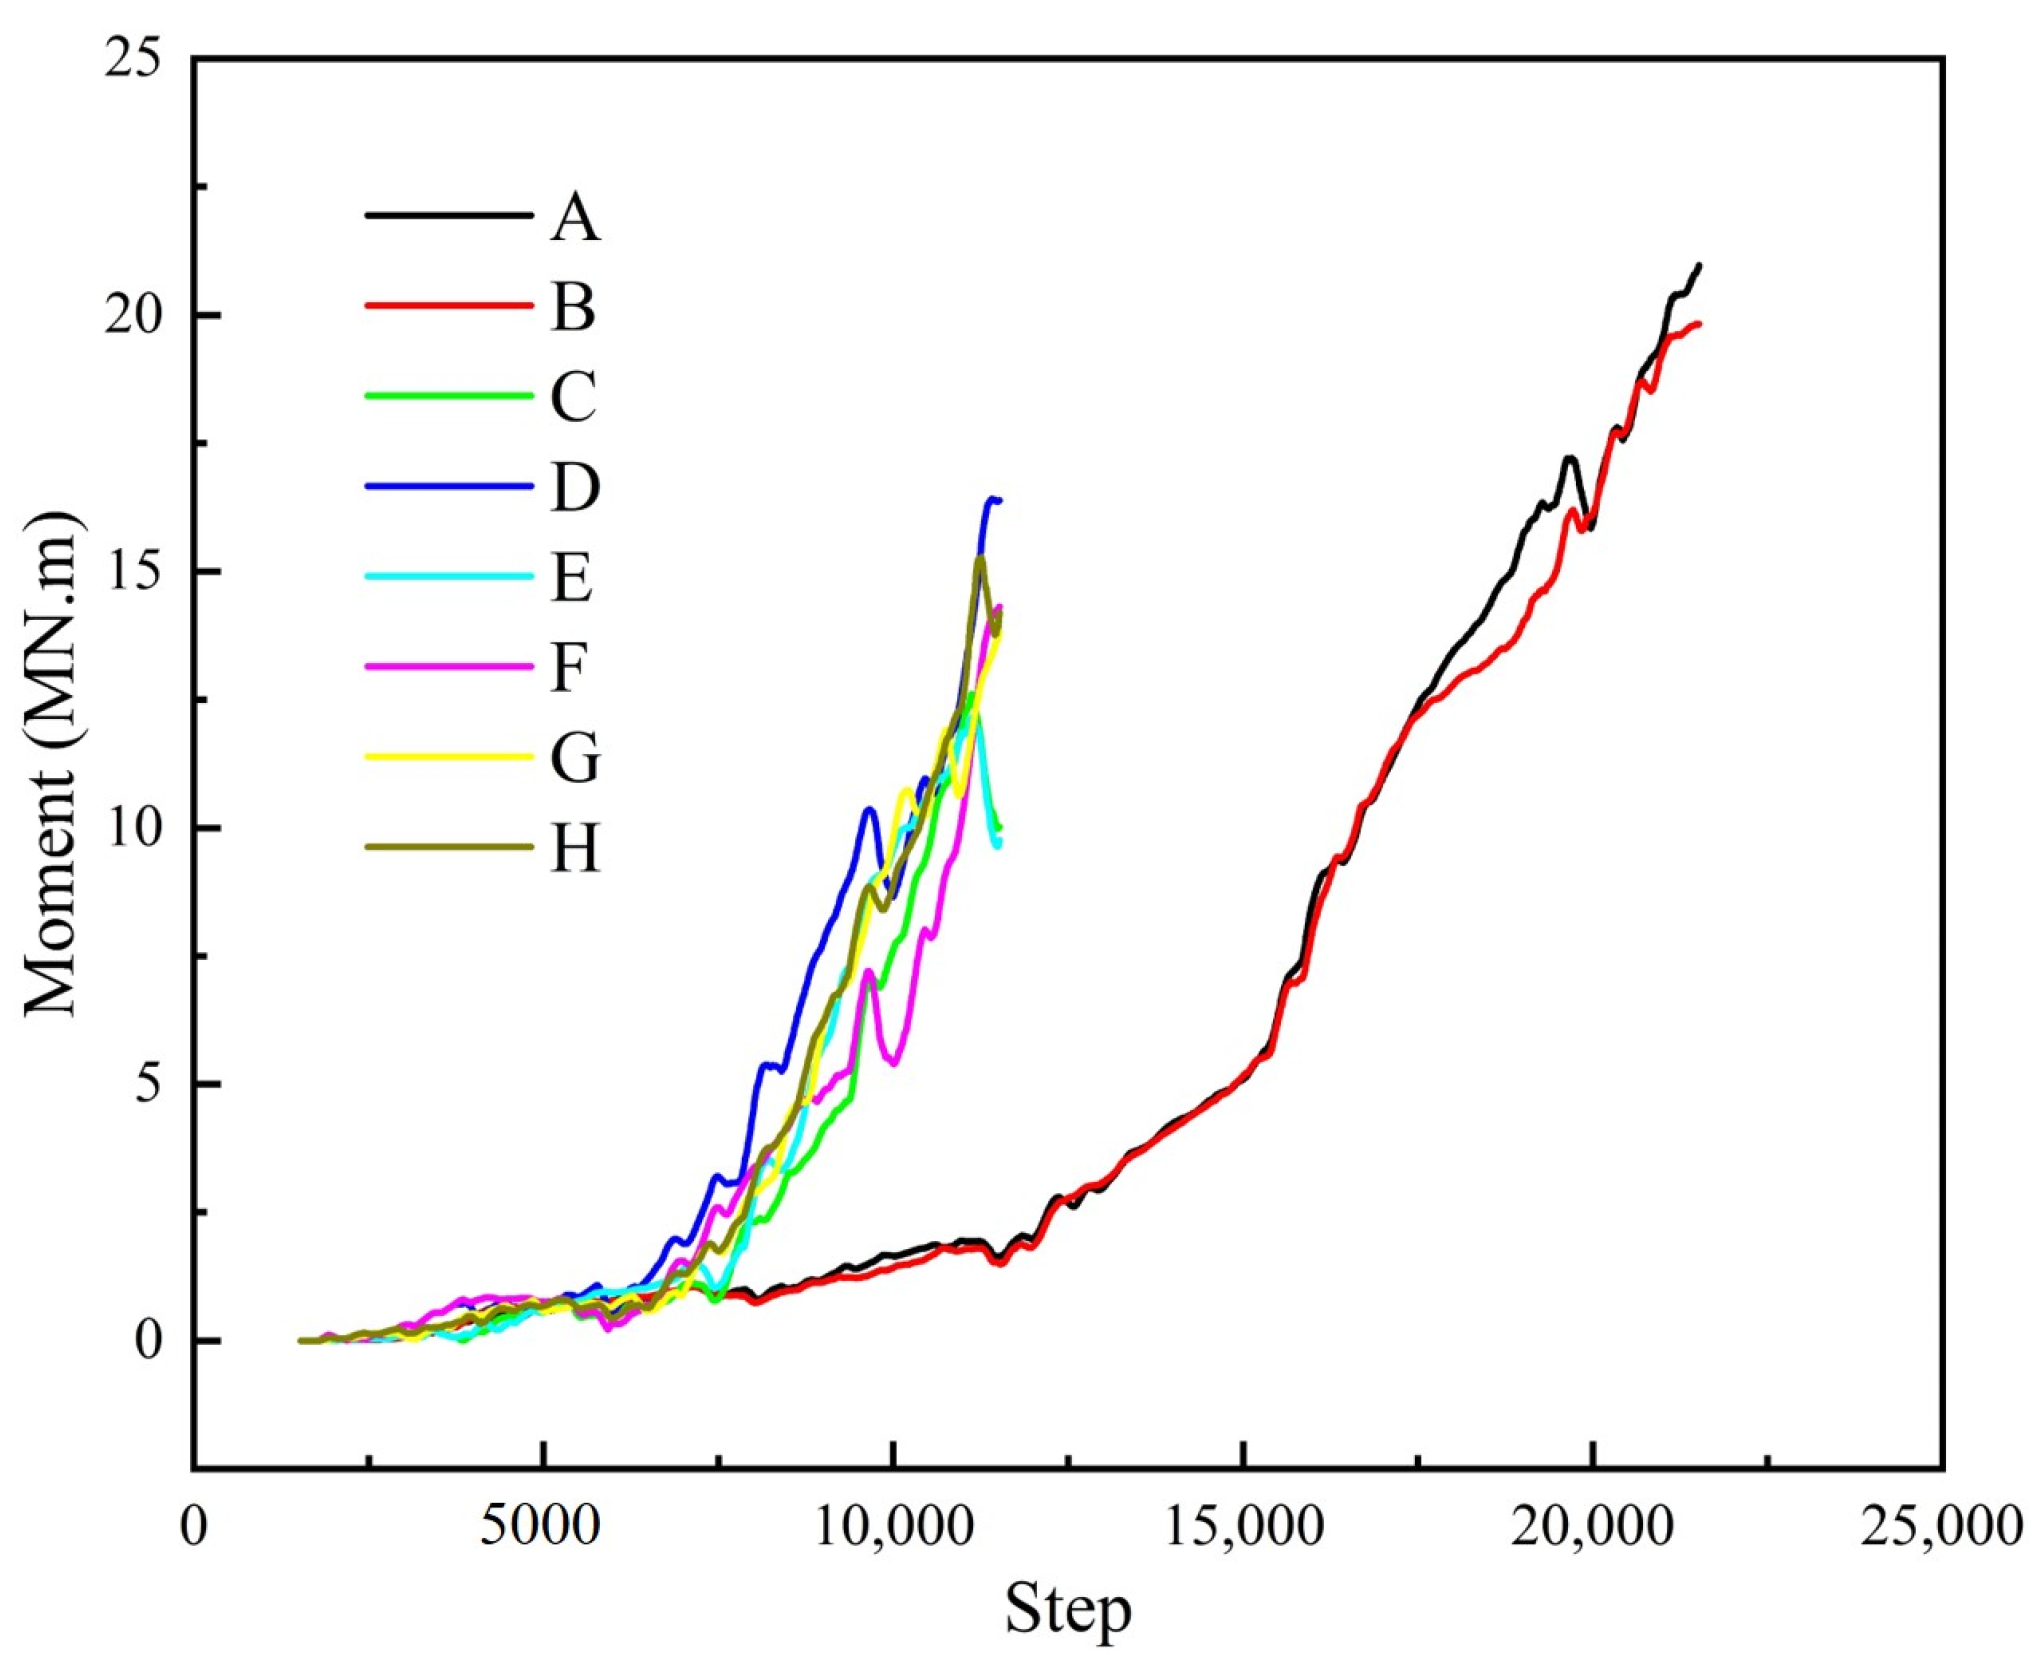
| Maximum moment at DW monitoring point (K6) | 0.1 | Maximum moment of the monitoring points in the shell structure |
| Compositional Factors | A | B | C | D | E | F | G | H | Weight | |
|---|---|---|---|---|---|---|---|---|---|---|
| K1 | X-1 | 0.08 | 0.00 | 0.50 | 0.97 | 0.35 | 0.84 | 1.00 | 0.98 | 0.5 |
| X-2 | 0.53 | 0.86 | 0.24 | 0.87 | 0.00 | 0.60 | 0.47 | 1.00 | ||
| Y-1 | 0.69 | 0.60 | 0.14 | 0.93 | 0.00 | 0.53 | 0.90 | 1.00 | ||
| Y-2 | 1.00 | 0.96 | 0.06 | 0.41 | 0.22 | 0.00 | 0.22 | 0.24 | ||
| Z-1 | 0.95 | 1.00 | 0.01 | 0.34 | 0.24 | 0.00 | 0.30 | 0.30 | ||
| Z-2 | 0.65 | 0.25 | 0.16 | 0.59 | 0.00 | 0.49 | 0.77 | 1.00 | ||
| S-1 | 1.00 | 0.97 | 0.00 | 0.41 | 0.09 | 0.06 | 0.18 | 0.23 | ||
| S-2 | 0.66 | 1.00 | 0.10 | 0.40 | 0.00 | 0.45 | 0.22 | 0.27 | ||
| S-3 | 0.00 | 0.31 | 0.27 | 1.00 | 0.12 | 0.99 | 0.34 | 0.29 | ||
| S-4 | 0.99 | 1.00 | 0.16 | 0.52 | 0.00 | 0.37 | 0.43 | 0.41 | ||
| H-1 | 0.52 | 0.52 | 0.35 | 1.00 | 0.10 | 0.82 | 0.26 | 0.00 | ||
| H-2 | 0.95 | 1.00 | 0.08 | 0.45 | 0.00 | 0.29 | 0.32 | 0.31 | ||
| H-3 | 1.00 | 0.32 | 0.10 | 0.17 | 0.00 | 0.22 | 0.13 | 0.14 | ||
| H-4 | 0.40 | 1.00 | 0.15 | 0.12 | 0.05 | 0.19 | 0.01 | 0.00 | ||
| K2 | 1.00 | 1.00 | 0.00 | 0.00 | 0.00 | 0.00 | 0.00 | 0.00 | 0.1 | |
| K3 | 1.00 | 0.85 | 0.00 | 0.40 | 0.11 | 0.03 | 0.20 | 0.23 | 0.1 | |
| K4 | S-n | 0.77 | 1.00 | 0.00 | 0.36 | 0.14 | 0.02 | 0.24 | 0.29 | 0.1 |
| S-p | 1.00 | 0.52 | 0.12 | 0.27 | 0.00 | 0.37 | 0.11 | 0.18 | ||
| T-n | 0.06 | 0.12 | 0.01 | 0.03 | 0.00 | 1.00 | 0.01 | 0.43 | ||
| T-p | 1.00 | 0.88 | 0.34 | 0.58 | 0.46 | 0.00 | 0.46 | 0.47 | ||
| K5 | 0.78 | 1.00 | 0.05 | 0.34 | 0.27 | 0.00 | 0.26 | 0.30 | 0.1 | |
| K6 | 1.00 | 0.90 | 0.02 | 0.59 | 0.00 | 0.41 | 0.36 | 0.40 | 0.1 | |
| Total value | 0.79 | 0.79 | 0.10 | 0.46 | 0.09 | 0.29 | 0.30 | 0.35 | 1.0 | |
Disclaimer/Publisher’s Note: The statements, opinions and data contained in all publications are solely those of the individual author(s) and contributor(s) and not of MDPI and/or the editor(s). MDPI and/or the editor(s) disclaim responsibility for any injury to people or property resulting from any ideas, methods, instructions or products referred to in the content. |
© 2023 by the authors. Licensee MDPI, Basel, Switzerland. This article is an open access article distributed under the terms and conditions of the Creative Commons Attribution (CC BY) license (https://creativecommons.org/licenses/by/4.0/).
Share and Cite
Li, D.; Chen, Y.; Dai, B.; Wang, Z.; Liang, H. Numerical Study of Dig Sequence Effects during Large-Scale Excavation. Appl. Sci. 2023, 13, 11342. https://doi.org/10.3390/app132011342
Li D, Chen Y, Dai B, Wang Z, Liang H. Numerical Study of Dig Sequence Effects during Large-Scale Excavation. Applied Sciences. 2023; 13(20):11342. https://doi.org/10.3390/app132011342
Chicago/Turabian StyleLi, Danli, Ying Chen, Bing Dai, Zhengyi Wang, and Hao Liang. 2023. "Numerical Study of Dig Sequence Effects during Large-Scale Excavation" Applied Sciences 13, no. 20: 11342. https://doi.org/10.3390/app132011342