Article

A Comparative Study of Fourier Transform Near-Infrared Spectroscopy and Physicochemical Methods in Wheat Quality Analysis

Dryland-Technology Key Laboratory of Shandong Province, College of Agronomy, Qingdao Agricultural University, Qingdao 266109, China
*
Author to whom correspondence should be addressed.
Appl. Sci. 2023, 13(20), 11368; https://doi.org/10.3390/app132011368
Submission received: 16 August 2023 / Revised: 8 October 2023 / Accepted: 8 October 2023 / Published: 17 October 2023

Abstract

:
Near-infrared spectroscopy is a non-invasive, rapid, and efficient analytical method widely employed in agricultural quality assessment. This study aims to explore the potential of Fourier transform near-infrared (FT-NIR) spectroscopy in the analysis of wheat quality in comparison to traditional physicochemical methods. Key quality parameters such as protein content, bulk density, dough extensibility, development and stability time, wet gluten, and extension area were considered. To compare the similarities between the two methods in an irregular manner and to make the trials more representative, randomized combinations of different samples were made by planting different wheat genotypes in different locations. In wheat protein determination (r = 0.92, p < 0.001), the correlation between protein determinations was very high and highly statistically significant. This indicates that the Fourier transform near-infrared (FT-NIR) assay is highly consistent and accurate with the physicochemical method for protein determination. In the quality indices of bulk density (r = 0.46, p < 0.05), dough extensibility (r = 0.46, p < 0.05), development time (r = 0.37, p < 0.05), stability time (r = 0.49, p < 0.01), wet gluten (r = 0.54, p < 0.01), and dough extension area (r = 0.63, p < 0.001), there was a positive correlation between the two assays. Although the correlation was lower compared to the protein assay, it was still statistically significant. This suggests that the FT-NIR assay also has some accuracy in these indices, although there may be some differences from the physicochemical method. Through comparative analysis, we found that in wheat quality assessment, FT-NIR showed a strong correlation and was highly significant in the determination of wheat protein content; in the determination of the extension area, although highly significant, the correlation coefficient was not high, and there was a positive correlation between the two, and a lower correlation was shown in the bulk density, dough extensibility, and development time. These results indicate that FT-NIR can assess the wheat protein content quality indicator. However, its ability to accurately assess wheat quality indicators such as density, dough extensibility, development and stability time, wet gluten, and dough extensibility needs further investigation.

1. Introduction

In recent years, with the continuous advancement of agricultural technology and the growing emphasis on the quality of agricultural products, wheat quality analysis has become a crucial research focus. The quality of wheat directly impacts food processing and quality assessment, holding significant importance for the development and economic benefits of the wheat industry [1]. Therefore, the research and applications of rapid, accurate, and non-destructive wheat quality assessment techniques have garnered significant attention. Fourier transform near-infrared spectroscopy (FT-NIR), as an advanced spectral technique, has found wide application in agricultural product quality analysis due to its efficiency, convenience, and non-destructive nature [2]. This technique leverages the absorption characteristics of wheat samples in the near-infrared spectral range to acquire chemical information [3], offering a novel approach to non-destructive measurement of wheat quality [4]. However, while FT-NIR technology holds great potential [5], its accuracy and reliability in wheat quality analysis still face certain challenges. Factors such as the growth location, climate, soil, and agricultural practices impact wheat quality [6], and variations in these factors can lead to different quality characteristics of the same wheat variety in different locations or years, complicating quality analysis. Physicochemical methods have long been widely used in wheat quality analysis, with their accuracy and reliability validated over time [7]. However, physicochemical methods involve complex sample preparation and operational procedures, are time-consuming, and can be destructive, limiting their application in large-scale quality measurements.
Previous research, such as Dowell [8], collected a large number of wheat samples and predicted the quality characteristics of wheat through near-infrared spectroscopy. The research demonstrated the ability of near-infrared spectroscopy to predict wheat protein content, with a predictive accuracy reaching R2 > 0.97. However, the performance in predicting other quality indicators was not significant. Du [9] summarized the application of near-infrared spectroscopy in wheat quality analytical parameters, rheological parameters, and final product quality determination and found that NIRS has great potential in the quantitative determination of analytical parameters. However, there are still challenges in model robustness and accuracy in determining rheological parameters and the final product quality for wheat products. Xiao [10] established near-infrared analysis models for wheat wet gluten content, sedimentation value, alcohol-soluble protein, and gliadin, confirming their excellent predictive capabilities. Current research is focused on other bands such as spectral infrared; e.g., Vatter [11] used multispectral imaging to predict not only yield but also important quality traits in the field before harvest, which is of high value for breeders aiming to optimize the allocation of resources, but the multispectral camera is more affected by the weather as it is mounted on a drone. There have been no in-depth studies on the accuracy of FT-NIR for prediction of wheat quality. Therefore, the objectives of this study are to derive the correlation between the experimental results of the two methods and to validate the potential of the Fourier transform near-infrared spectroscopy technique for application in wheat quality analysis, offering a scientific basis and technical support for wheat quality assessment [12].

2. Materials and Methods

2.1. Experimental Setup and Sample Preparation

This experiment was conducted in experimental fields in Weifang City, Shandong Province, China. A total of 15 wheat genotypes were randomly planted across 18 randomly selected locations, resulting in 29 randomly composed sample data points, as shown in Table 1. The purpose of this approach was to introduce greater randomness and representativeness into the experiment, which would effectively validate the stability of the model and optimize its performance. Each plot in each site measured three meters and comprised six rows, being about 223 m in length and having a total area of 667 square meters. The collection method was to randomly take three square wheats from the top, middle, and bottom of each plot. The base fertilizer consisted of 50 kg of compound fertilizer with a nitrogen–phosphorus–potassium ratio of 15:15:15. Mechanical sowing was performed with a row spacing of 26 cm.
The Fourier transform near-infrared spectrometer (FT-NIR) used in this experiment was an Antaris II, manufactured by Thermo Fisher Scientific Inc. (Waltham, MA, USA). It operated within the near-infrared spectral range of 780 to 2526 nm. The detector employed was DTGS, the beam splitter was a multi-layer coated potassium bromide (KBr) prism, and the light source was EverGlo (Muggensturm, Germany). After receiving the yield, the measurements were repeated three times via FT-NIR spectroscopy and by measuring the reflectance or transmission spectra of the wheat samples in the near-infrared spectral range, and then the spectral data were analyzed using a mathematical model to correlate them with the known data on the quality of protein content, bulk density, dough extensibility, development and stability time, wet gluten, and dough extensibility and ultimately to predict the various quality indices in the wheat samples. The wheat quality indexes were also measured via physicochemical methods for comparative analysis.
The physicochemical method of determination of each indicator was as follows:
① In the laboratory, wheat protein content was determined using the Kjeldahl method. Initially, wheat samples were subjected to acid hydrolysis in the presence of sulfuric acid and a catalyst. The resulting ammonia was distilled and reacted with boric acid. Subsequently, by titrating the concentration of ammonia, the total nitrogen content in the wheat sample was calculated, allowing for the estimation of wheat protein content determined by the Kjeldahl method.
② Wheat bulk density measurements were conducted using a standard volumeter. Initially, the mass of the wheat sample was weighed. Then, the sample was gradually added to the volumeter until the wheat inside reached the calibrated volume of 1 L. The bulk density was calculated by dividing the total mass of the sample by 1 L, and this measurement was repeated three times, with the average value taken.
③ Dough extensibility was determined in the laboratory using a powder drawing machine. First, the moisture content of different genotypes of wheat was determined using a grain moisture detector, and then different genotypes of wheat were ground into flour; each genotype of wheat was determined separately in the powder drawing machine, and the moisture content was input to obtain the weight of flour required; after pouring the corresponding flour into the machine, the amount of water was added to the water distillate, and the machine started to work and automatically drew the time line—regarding consistency value, a consistency value of 500 ± 30 meant this flour quality test was successful; for the dough to rise after the stretching test, the dough is divided into two sections to repeat the stretching; take the average value, derived from the dough extensibility.
④ Wheat flour dough development time and stabilization time in the laboratory were measured using a rotational rheometer; the dough sample is first placed in the test fixture of the rheometer, and shear deformation begins at a fixed shear rate; the shear stress and shear deformation of the dough are measured and recorded as a function of time, and based on the measured data, wheat flour dough development time and stabilization time can be determined.
⑤ In the laboratory, wheat wet gluten was determined using a gluten index tester. First, wheat flour and water were mixed in specific proportions to form wheat dough. Subsequently, the dough was allowed to rest for a period, typically 15–30 min, to allow gluten formation. The dough sample was placed in the gluten index tester, where the testing instrument applied mechanical shear force over a certain period and recorded the required data. This facilitated the measurement of gluten content in the wheat dough [13].
⑥ The determination of wheat elongation area index is carried out in the laboratory using a tensile testing machine. Firstly, wheat flour and water are mixed in a certain proportion to make wheat dough; let the dough rest for a certain period of time, usually 15–30 min, divide the dough into appropriate sized samples, and then place it in the fixture of the tensile testing machine, and begin to stretch it at a certain speed. The tensile testing machine will record the force and displacement data during stretching. This leads to the wheat elongation area index.

2.2. Data Analysis

The Shapiro–Wilk test was used because the material in this test was a small sample and in sample data with n ≤ 50 [14]. As shown in Table 2, a normality test was conducted on the measurement results of different wheat indicators using FT-NIR and physicochemical methods [15]. Among these, the exhibited protein content, test weight, extensibility, dough development time, stability time, wet gluten, and extensogram area measured using FT-NIR, as well as the protein content, wet gluten, and extensogram area measured using physicochemical methods, had p values ≥ 0.05, indicating that these indicators follow a normal distribution [16]. Therefore, they are suitable for correlation analysis and variance analysis. For correlation analysis, Pearson correlation can be employed, On the other hand, test weight, extensibility, dough development time, and stability time measured via physicochemical methods had p values ≤ 0.05, indicating their deviation from normal distribution [17]. Consequently, Spearman’s rank correlation can be utilized.
The data analysis and processing of this experiment was conducted in SPSS version 27 using Pearson and Spearman correlation functions. Automatic generation of positive error lines for each set of data, plotted through line graphs, was performed.

3. Results

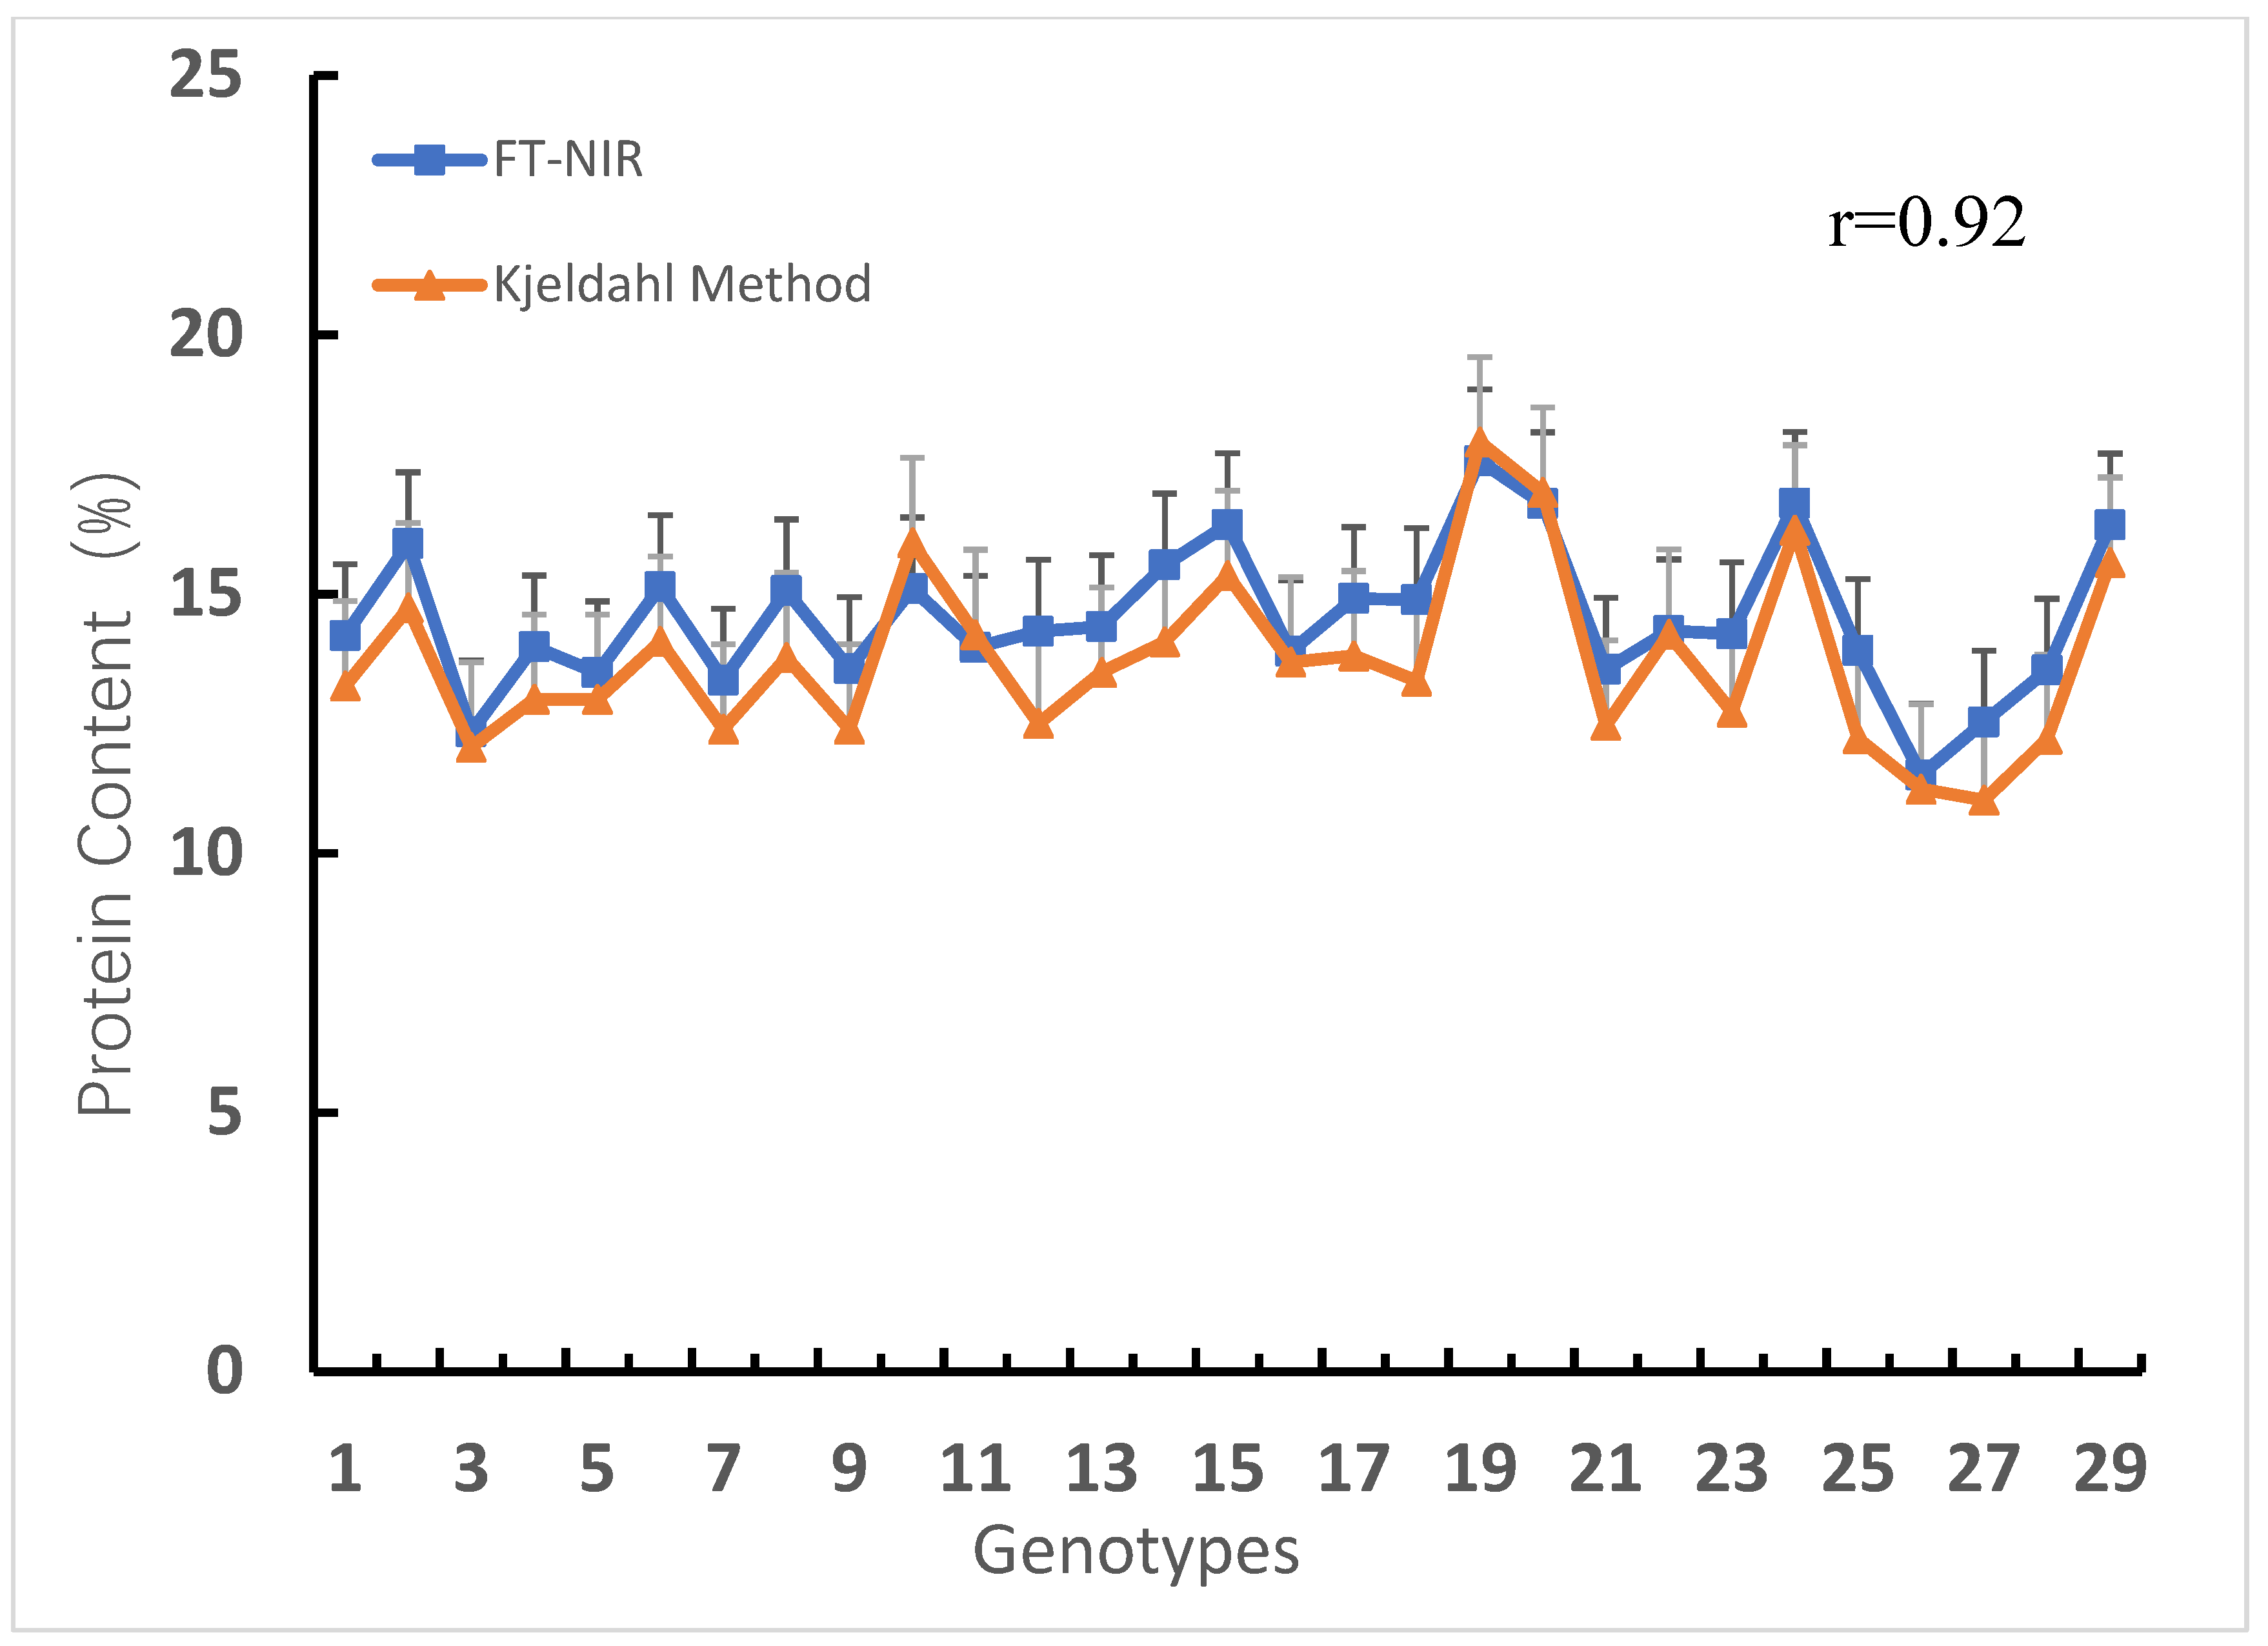
3.1. Protein Content

The protein content measured via the Kjeldahl method ranged from 11.51% to 17.57%, whereas that obtained via FT-NIR ranged from 11.03% to 17.93% (Figure 1). For samples of the same wheat genotype from different regions, the protein contents measured via the two methods showed different degrees of similarity. For example, in samples of genotype VS44 collected from Hexiling and Zhangjiaguanzhuang, the results obtained via the two methods were similar, but in samples of the same genotype collected from Dazhai, the results obtained via the two methods were not similar even though the sowing dates were almost similar. This may be because of the basal fertilizer of the area or the ambient temperature and humidity on the protein content. The accuracy of their two measurements was high, with r = 0.92 for the protein content measured via both, and there was also a high degree of agreement between the two in the analysis of correlation results. This indicates the reliability of NIR spectroscopy in determining protein measurements in wheat [18].

3.2. Bulk Density

The bulk density measured with a standard volumetric meter ranged from 563 to 790 (kg/m3), whereas that obtained via FT-NIR ranged from 781 to 824 (kg/m3) (Figure 2). For the different wheat genotypes sampled from different regions, the results determined via FT-NIR were generally higher than those determined via standard volumetrics. And there were individual cases of a large gap; for example, in the samples of yannong15 collected from the suspension test field, the similarity between its measured results and FT-NIR was very low, which could be attributed to the influence of the variety of yannong15, or to the improper operation during sowing affecting the experimental results. In the rest of the samples measured via FT-NIR, the results are high, which may be due to the machine itself lacking accuracy in the determination of bulk density, even if the correlation is significant, but the correlation coefficient is not high, so when using FT-NIR as a tool for wheat bulk density detection, attention should be paid to the degree of its correlation coefficient.

3.3. Extensibility

The dough extensibility measured using a powder drawing machine ranged from 66 to 197 (mm). The dough extensibility measured with FT-NIR ranged from 122 to 177 (mm) (Figure 3). For samples of the same wheat genotypes from different regions, dough extensibility measured via the two methods showed varying degrees of similarity. For example, in samples of genotype VS1403 collected from Junbukou and Chenjia, the results obtained via the two methods were similar, but in samples of the same genotype collected from Louzi, the results obtained via the two methods were not similar even though the sowing dates were almost similar. The reason for this is that different sowing locations lead to different results for the two determinations, so different locations for the same genotype can also contribute to the accuracy of FT-NIR determinations. Therefore, the degree of correlation coefficient should be noted when utilizing FT-NIR as a tool for dough extensibility detection.

3.4. Development Time

Dough development time measured with a rotational rheometer ranged from 1.4 to 14.3 (min). Dough development time measured with FT-NIR ranged from 1.77 to 5.21 (min) (Figure 4). For samples of the same wheat genotypes from different regions, the dough development time measured via the two methods showed varying degrees of similarity. For example, in samples of genotype VS1403 collected from Junbukou and Chenjia, the results obtained via the two methods were similar, but in samples of genotype VS44 collected from Zhangfengchaobei and Hexiling and Zhangjiaguanzhuang, although the sowing dates were almost similar, the results obtained via the two methods were not similar. This may be due to the influence of the basal fertilizer in the area or the ambient temperature and humidity on the dough development time. Where samples # 8, 9, 10, 11, 13, and 29 are generally high, possibly due to the genotype itself being a high-gluten wheat or the flour itself being so low in moisture that the dough may take longer to absorb.

3.5. Stability Time

Dough stability time measured with a rotational rheometer ranged from 3.4 to 29.1 (min), whereas that obtained via FT-NIR ranged from 3.86 to 8.04 (min) (Figure 5). For samples of different wheat genotypes from the same region, the dough stability time measured via the two methods showed varying degrees of similarity. For example, in samples of genotypes VS25053, VS116, and VS126 collected from the Agricultural Bureau, the results obtained via the two methods were similar, but in samples of genotype VS5022 collected from Xiying and Miaobu, the results obtained via the two methods were not similar even though the sowing dates were almost similar. This may be because of the basal fertilizer in the area or the ambient temperature and humidity on the dough stability time.

3.6. Wet Gluten

Dough wet gluten measured via a wet gluten meter ranged from 26.97% to 39.95% (min), whereas that obtained via FT-NIR ranged from 24.45% to 38.24% (Figure 6). For samples of the same wheat genotype from different regions, the wet gluten contents measured via the two methods showed different degrees of similarity. For example, in samples of genotype VS44 collected from Zhangfengchaobei and Zhangjiaguanzhuang, the results obtained via the two methods were similar, but in samples of the same genotype collected from Hexiling, the results obtained via the two methods were not similar even though the sowing dates were almost similar. This may be because of the basal fertilizer of the area or the ambient temperature and humidity on the wet gluten content. In the overall analysis, the accuracy of the results of both methods was high, and there was also a high degree of agreement between the two methods in the correlation results analysis. This indicates that the near-infrared spectroscopy technique has a certain degree of accuracy in the determination of wet gluten in wheat.

3.7. Extension Area

The dough extension area measured with the tensile testing machine ranged from 31 to 123 (mm), whereas that obtained via FT-NIR ranged from 3.92 to 113.51 (mm) (Figure 7). For samples of different wheat genotypes from the same region, the extension areas measured via the two methods showed varying degrees of similarity. For example, in samples of genotypes VS116 and VS126 collected from the Agricultural Bureau, the results obtained via the two methods were similar, but in samples of genotype VS25053 collected from the Agricultural Bureau, the results obtained via the two methods were not similar even though the sowing dates were almost similar. This may be because of differences between genotypes and depending on the accuracy of the two extension areas. In a comprehensive analysis, the accuracy of both of their results was high, and there was also a high degree of agreement between the two in the correlation results analysis. This indicates that the NIR spectroscopic technique has a certain degree of accuracy in the determination of the extension area in wheat.

3.8. Correlation Coefficient

According to the results of the Pearson’s correlation coefficient and significance level, as shown in Table 3, most of the indicators showed significant positive correlations with the results measured via physical and chemical methods, which implies that the results of the FT-NIR spectroscopy method for wheat quality analysis are in good agreement with physical and chemical methods. However, there are still a few indicators (e.g., bulk density, extensibility, and formation time) that show weak correlations, which may need further exploration and interpretation [19]

3.9. Correlation Analysis between Different Wheat Quality Indicators

The seven indicators of protein content, bulk density, dough extensibility, development and stability time, wet gluten, and extension area were comprehensively analyzed via FT-NIR and laboratory methods and positive error analysis, and significant analysis of correlation was also performed. As shown in Figure 8, in general, according to the overall mean and other observations, it was found that in protein, stabilization time, wet gluten, and elongation area indicators, it can be clearly seen that there is a strong correlation, and the capacity, ductility, and formation time is lower.

4. Discussion

This study compared the application of Fourier transform near-infrared (FT-NIR) spectroscopy and the physical–chemical method in wheat quality analysis. The degrees of correlation observed in the measurements were as follows, in descending order: protein content (r = 0.92) > extension area (r = 0.63) > wet gluten content (r = 0.54) > stability time (r = 0.49) > dough extensibility (r = 0.46) > bulk density (r = 0.46) > development time (r = 0.37). The study found that protein content had a high degree of similarity between the two methods; the correlation between the two methods of bulk density was generally low, resulting in an overall low correlation that may be influenced by the large area, but also by the effects of seeding or improper FT-NIR manipulation; dough extensibility exhibited high correlations for specific genotypes and locations, but low correlations for others. Many factors may influence the extensibility of wheat; for example, the variety of wheat, the moisture content, the dough preparation process, and possibly the lack of FT-NIR databases may result in large differences between the two development times, which displayed high correlations across different locations for a particular variety. The very low phenotypic correlation for individual genotypes means that NIR spectroscopy techniques differ significantly from physicochemical methods in the measurement of development time for different wheat genotypes, and therefore, it is not possible to predict dough formation time with complete accuracy. Dough development time may be affected by a variety of factors, including wheat variety, moisture content, mixing process, and FT-NIR database; dough stability time is usually affected by a variety of factors, including wheat variety, flour quality, mixing process, and environmental conditions [20]; In the wet gluten analysis, some of the location varieties had high correlation, and most of the data still differed greatly, suggesting that there is a relative lack of databases for FT-NIR that are not well developed., and these need to be populated with many test results of samples under different conditions. The correlation coefficient was 0.54, which clearly shows that the correlation coefficient is not very strong; therefore, these two methods cannot be considered as equivalent or interchangeable for the determination of wet gluten content, and there is still room for improvement. Extension areas vary widely among different varieties of wheat, but FT-NIR also shows relatively high correlation. This could provide an optional, non-destructive measure for the evaluation of this indicator of extension area in wheat. However, a large and rich FT-NIR database is needed for more accurate measurements.
The differences observed in measurements using FT-NIR spectroscopy and physicochemical methods can be attributed to variations in technical principles, sample preparation and handling, instrument accuracy and sensitivity, differences in calibration samples, data processing and analysis methods, and errors associated with sample characteristics and preparation. The accumulation of calibration samples and the consideration of objective conditions are essential for improving the consistency of models [21]. For this experiment, the accuracy and reliability of the Fourier transform near-infrared spectroscopy (FT-NIR) quality analyzer in measuring the quality of wheat can be continuously improved by expanding the set of calibration samples, optimizing the pre-processing method, taking into account the characteristics of the samples and preparation errors, optimizing the parameters of the spectrometer equipment, introducing other advanced technologies, establishing a diversified quality assessment system, researching and developing new sensor technologies, and optimizing the modeling algorithm, so as to achieve a more precise prediction of the accuracy in determining the various quality indexes of wheat [22]. The results of this study show that near-infrared spectroscopy technology provides measurements of protein content and other indicators with comparable accuracy to laboratory physical–chemical methods and even outperforms them in some aspects. This offers a new option for quality monitoring in practical production settings [23].
Scholars like Pandey have analyzed the chemical properties of wheat grains stored under specific conditions using FT-NIR and NIR, demonstrating the effectiveness of both models in the rapid assessment of wheat grain storage quality [24]. Similarly, Amir applied FT-IR to identify wheat genotypes based on spectral peaks [25]. However, current research in this area has primarily focused on the application of spectroscopic techniques, with limited studies on spectroscopy accuracy. This experiment, based on established wheat quality measurement standards, conducted an in-depth comparative analysis of accuracy in measuring wheat quality across different genotypes and locations. In this experiment, the accuracy of FT-NIR in determining wheat quality of different genotypes in different plots was analyzed in an in-depth comparative manner from the standard basis of wheat quality measurement. To reduce model dependence as well as to improve the broad applicability of the study, several wheat genotypes were purposely selected for measurement in this study. This random sampling helps to better reflect the diversity in actual agricultural production, which improves the reliability and generalizability of the results and enriches the database of the FT-NIR model. However, the main limitation of this study is the limited number of samples and the use of data from a single season.
In future research endeavors, it is advisable to consider expanding the sample size to further enhance the applicability of Fourier transform near-infrared spectroscopy (FT-NIR) technology across a broader range of wheat genotypes. Additionally, in-depth exploration of optimizing spectroscopic instrument parameters, refining preprocessing methods, and optimizing model algorithms can be undertaken to further enhance the accuracy and stability of measurements. Furthermore, there is potential to explore the practical application of FT-NIR technology in actual production settings, enabling rapid assessment of wheat quality and thereby improving agricultural production efficiency. By doing so, this technology could potentially contribute to advancing the efficiency and effectiveness of wheat quality evaluation.

5. Conclusions

In the comparative analysis of several wheat genotypes, we found that FT-NIR showed high correlation with physicochemical methods in protein content determination, and moderate correlation in dough stability time, wet gluten, and extension area of wheat, which can be determined quickly and non-destructively via FT-NIR. However, the correlation between FT-NIR and the measured values in the quality indexes of bulk density, dough extensibility, and development time is generally large, but individual genotypes of wheat show high correlation, but there are also samples with low correlation, so in the measurement of the latter three quality indexes, it should be verified whether the region and wheat genotypes are correlated in order to carry out the rapid and non-destructive quality measurement of wheat via FT-NIR Measurement.

Author Contributions

Writing—original draft preparation, Z.H.; writing—review and editing, Y.S. All authors have read and agreed to the published version of the manuscript.

Funding

Agricultural Major Technology Collaborative Promotion Plan Project in Shandong Province: SDNYXTTG-2022-18; Shandong Modern Agricultural Technology & Industry System-cultivation and soil fertilizer: SDAIT0107; Agricultural Major Technology Collaborative Promotion Plan Project in Shandong Province: SDNYXTTG-2023-30.

Acknowledgments

The authors would like to thank the anonymous reviewers for their valuable contributions to this paper.

Conflicts of Interest

The authors declare no conflict of interest.

References

  1. Gao, L.; Meng, C.; Yi, T.; Xu, K.; Cao, H.; Zhang, S.; Yang, X.; Zhao, Y. Genome-wide association study reveals the genetic basis of yield- and quality-related traits in wheat. BMC Plant Biol. 2021, 21, 144. [Google Scholar] [CrossRef]
  2. Zareef, M.; Arslan, M.; Hassan, M.M.; Ahmad, W.; Ali, S.; Li, H.H.; Qin, O.Y.; Wu, X.Y.; Hashim, M.M.; Chen, Q.S. Recent advances in assessing qualitative and quantitative aspects of cereals using nondestructive techniques: A review. Trends Food Sci. Technol. 2021, 116, 815–828. [Google Scholar] [CrossRef]
  3. Zhang, S.; Liu, S.; Shen, L.; Chen, S.; He, L.; Liu, A. Application of near-infrared spectroscopy for the nondestructive analysis of wheat flour: A review. Curr. Res. Food Sci. 2022, 5, 1305–1312. [Google Scholar] [CrossRef]
  4. Mishra, G.; Srivastava, S.; Panda, B.K.; Mishra, H.N. Rapid Assessment of Quality Change and Insect Infestation in Stored Wheat Grain Using FT-NIR Spectroscopy and Chemometrics. Food Anal. Meth. 2018, 11, 1189–1198. [Google Scholar] [CrossRef]
  5. De Girolamo, A.; Cervellieri, S.; Mancini, E.; Pascale, M.; Logrieco, A.F.; Lippolis, V. Rapid Authentication of 100% Italian Durum Wheat Pasta by FT-NIR Spectroscopy Combined with Chemometric Tools. Foods 2020, 9, 1551. [Google Scholar] [CrossRef] [PubMed]
  6. De Girolamo, A.; Cortese, M.; Cervellieri, S.; Lippolis, V.; Pascale, M.; Logrieco, A.F.; Suman, M. Tracing the Geographical Origin of Durum Wheat by FT-NIR Spectroscopy. Foods 2019, 8, 450. [Google Scholar] [CrossRef]
  7. Bekes, F. New Aspects in Quality Related Wheat Research: II. New Methodologies for Better Quality Wheat. Cereal Res. Commun. 2012, 40, 307–333. [Google Scholar] [CrossRef]
  8. Dowell, F.E.; Maghirang, E.B.; Xie, F.; Lookhart, G.L.; Pierce, R.O.; Seabourn, B.W.; Bean, S.R.; Wilson, J.D.; Chung, O.K. Predicting Wheat Quality Characteristics and Functionality Using Near-Infrared Spectroscopy. Cereal Chem. 2006, 83, 529–536. [Google Scholar] [CrossRef]
  9. Du, Z.J.; Tian, W.F.; Tilley, M.; Wang, D.H.; Zhang, G.R.; Li, Y.H. Quantitative assessment of wheat quality using near-infrared spectroscopy: A comprehensive review. Compr. Rev. Food Sci. Food Saf. 2022, 21, 2956–3009. [Google Scholar] [CrossRef] [PubMed]
  10. Xiao, R. Study on Rapid Measurement Technology of Wheat Main Quality Indexs Based on Near Infrared Spectroscopy. Master’s Thesis, Henan Agricultural University, Zhengzhou, China, 2022. [Google Scholar]
  11. Vatter, T.; Gracia-Romero, A.; Kefauver, S.C.; Nieto-Taladriz, M.T.; Aparicio, N.; Araus, J.L. Preharvest phenotypic prediction of grain quality and yield of durum wheat using multispectral imaging. Plant J. 2022, 109, 1507–1518. [Google Scholar] [CrossRef] [PubMed]
  12. Molognoni, L.; Ploencio, L.A.D.; Deolindo, C.T.P.; de Oliveira, L.V.A.; Hoff, R.B.; Daguer, H. FT-NIR combined with chemometrics versus classic chemical methods as accredited analytical support for decision-making: Application to chemical compositional compliance of feedingstuffs. Microchem. J. 2020, 158, 105126. [Google Scholar] [CrossRef]
  13. Chen, J.; Zhu, S.; Zhao, G. Rapid determination of total protein and wet gluten in commercial wheat flour using siSVR-NIR. Food Chem. 2017, 221, 1939–1946. [Google Scholar] [CrossRef]
  14. GB/T 4882-2001; Statistical Interpretation of Data—Normality Tests. East China Normal University: Shanghai, China, 2001; p. 36.
  15. Huang, W.-J.; Su, N.-C. A study of generalized normal distributions. Commun. Stat.—Theory Methods 2017, 46, 5612–5632. [Google Scholar] [CrossRef]
  16. Zhao, J.; Lee, S.K.; Kim, H.-M. Some counterexamples of a skew-normal distribution. Commun. Stat. Appl. Methods 2019, 26, 583–589. [Google Scholar] [CrossRef]
  17. Zheng, S.; Hardin, J.M.; Gupta, A.K. The inverse problem of multivariate and matrix-variate skew normal distributions. Statistics 2012, 46, 361–371. [Google Scholar] [CrossRef]
  18. Jiang, H.; Liu, G.; Mei, C.; Chen, Q. Qualitative and quantitative analysis in solid-state fermentation of protein feed by FT-NIR spectroscopy integrated with multivariate data analysis. Anal. Methods 2013, 5, 1872–1880. [Google Scholar] [CrossRef]
  19. Kasuya, E. On the use of r and r squared in correlation and regression. Ecol. Res. 2019, 34, 235–236. [Google Scholar] [CrossRef]
  20. Zhao, H.; Guo, B.; Wei, Y.; Zhang, B. Effects of grown origin, genotype, harvest year, and their interactions of wheat kernels on near infrared spectral fingerprints for geographical traceability. Food Chem. 2014, 152, 316–322. [Google Scholar] [CrossRef]
  21. Wu, Y.F.; Luan, X.L.; Liu, F. FT-NIR online detection performance improvement and evaluation for. Infrared Phys. Technol. 2023, 128, 104514. [Google Scholar] [CrossRef]
  22. Badaro, A.T.; Tavares, J.; Blasco, J.; Aleixos-Borras, N.; Barbin, D.F. Near infrared techniques applied to analysis of wheat-based products: Recent advances and future trends. Food Control 2022, 140, 109115. [Google Scholar] [CrossRef]
  23. De Girolamo, A.; Arroyo, M.C.; Cervellieri, S.; Cortese, M.; Pascale, M.; Logrieco, A.F.; Lippolis, V. Detection of durum wheat pasta adulteration with common wheat by infrared spectroscopy and chemometrics: A case study. LWT—Food Sci. Technol. 2020, 127, 109368. [Google Scholar] [CrossRef]
  24. Pandey, P.; Srivastava, S.; Mishra, H.N. Comparison of FT-NIR and NIR for evaluation of phyisco-chemical properties of stored wheat grains. Food Qual. Saf. 2018, 2, 165–172. [Google Scholar] [CrossRef]
  25. Amir, R.M.; Anjum, F.M.; Khan, M.I.; Khan, M.R.; Pasha, I.; Nadeem, M. Application of Fourier transform infrared (FTIR) spectroscopy for the identification of wheat varieties. J. Food Sci. Technol. 2013, 50, 1018–1023. [Google Scholar] [CrossRef] [PubMed]
Figure 1. Comparison of protein content of wheat genotypes measured via physicochemical and FT-NIR methods. The positive error line in the figure indicates the degree of data variability, where the black lines is the error lines of FT-NIR and the gray lines is the error line of Kjeldahl Method.
Applsci 13 11368 g001
Figure 2. Comparison of bulk density of wheat genotypes measured via physicochemical and FT-NIR methods. The positive error line in the figure indicates the degree of data variability, where the black lines is the error lines of FT-NIR and the gray lines is the error line of Grain Density Meter.
Applsci 13 11368 g002
Figure 3. Comparison of dough extensibility of wheat genotypes measured via physicochemical and FT-NIR methods. The positive error line in the figure indicates the degree of data variability, where the black lines is the error lines of FT-NIR and the gray lines is the error line of Dough extensibility.
Applsci 13 11368 g003
Figure 4. Comparison of dough development time of wheat genotypes measured via physicochemical and FT-NIR methods. The positive error line in the figure indicates the degree of data variability, where the black lines is the error lines of FT-NIR and the gray lines is the error line of Dough Development Time Test.
Applsci 13 11368 g004
Figure 5. Comparison of stability time of wheat genotypes measured via physicochemical and FT-NIR methods. The positive error line in the figure indicates the degree of data variability, where the black lines is the error lines of FT-NIR and the gray lines is the error line of Dough stability time test.
Applsci 13 11368 g005
Figure 6. Comparison of wet gluten of wheat genotypes measured via physicochemical and FT-NIR methods. The positive error line in the figure indicates the degree of data variability, where the black lines is the error lines of FT-NIR and the gray lines is the error line of Wet Gluten Method.
Applsci 13 11368 g006
Figure 7. Comparison of extensibility area of wheat genotypes measured via physicochemical and FT-NIR methods. The positive error line in the figure indicates the degree of data variability, where the black lines is the error lines of FT-NIR and the gray lines is the error line of Extension Area Test.
Applsci 13 11368 g007
Figure 8. Comparison of different indicators of wheat genotypes measured via physicochemical and FT-NIR methods. ***, **, and * indicate significant at p < 0.001, 0.01 and 0.05, respectively, where the black lines is the error lines of FT-NIR and the gray lines is the error line of Extension Area Test. The positive error line in the figure indicates the degree of data variability: “1” for protein content, “2” for bulk density, “3” for dough extensibility, “4” for development time, “5” for stability time, “6” for wet gluten, and “7” for extension area.
Applsci 13 11368 g008
Table 1. Wheat planting information including sowing time, planting locations, wheat genotypes, and sowing amount.
NumberSowing TimePlanting LocationsWheat GenotypesSowing Amount/kg·ha−2
110.20ShanxiayuVS1403165
210.22JunbukouVS1403210
310.26XiyingVS5022240
410.27MiaobuVS5022255
510.27MiaobuVS5022255
610.28ChenjiaVS1403240
710.29LouziVS1403255
811.03ZhangfengchaobeiVS44300
911.14ZhangfengchaobeiVS44300
1011.15HexilingVS44300
1111.15ZhangjiaguanzhaungVS44300
1211.17DazhaiVS44300
1310.28ChangyijiangxiaojieVS1403180
1411.4HantingVS44195
1510.29AnqiuchangxingJimai22150
1610.22JunbukouVS1403210
1710.24JunbukouShannong48210
1811.18XuanjiashiyantianYannong15270
1911.15XuanjiashiyantianJiruo116300
2011.16XuanjiashiyantianVS44642300
2111.16XuanjiashiyantianVS44641300
2210.23Agricultural BureauVS7506165
2310.23Agricultural BureauVS25053195
2410.23Agricultural BureauVS116165
2510.23Agricultural BureauVS126195
2610.23Agricultural BureauVS40165
2710.23Agricultural BureauVS55180
2810.23Agricultural BureauVS44641195
2910.23ChangyixiadianVS1403195
Table 2. Output of the normality test for seven indicators of wheat via two methods.
Kolmogorov–SmirnovShapiro–Wilk
MethodsParametersStatisticpStatisticp
FT-NIRProtein content0.1310.20.9760.724
Bulk density0.1250.20.9370.083
Dough extensibility0.1250.20.9370.083
Development time0.1220.20.9690.537
Stability time0.0960.20.9670.48
Wet gluten0.1330.20.9660.453
Extension area0.1080.20.9780.794
Physicochemical measurementProtein content0.140.150.9510.191
Bulk density0.1930.0070.9090.016
Dough extensibility0.1930.0070.9090.016
Development time0.30100.7430
Stability time0.2080.0020.8760.003
Wet gluten0.1270.20.9460.146
Extension area0.1680.0360.9360.08
df = 29 in Kolmogorov–Smirnov and Shapiro–Wilk.
Table 3. Correlation analysis of wheat parameter measurement between FT-NIR and physicochemical methods.
FT-NIRProtein ContentBulk DensityExtensibilityForming TimeStability TimeWet GlutenExtension Area
Physicochemical
Protein Content0.916 ***0.487 **0.487 **0.364−0.1750.872 ***−0.085
Bulk Density0.415 *0.460 *0.460 *0.264−0.2300.436 *0.114
Extensibility0.415 *0.460 *0.460 *0.264−0.2300.436 *0.114
Forming Time0.457 *0.2890.2890.370 *0.3020.442 *0.107
Stability Time−0.0520.2580.2580.3070.487 **−0.0850.345
Wet Gluten0.506 **0.030.030.112−0.1010.544 **−0.223
Extension Area0.2630.561 **0.56 1**0.649 ***0.583 ***0.3110.630 ***
***, **, and * indicate significant at p < 0.001, 0.01 and 0.05, respectively.
Disclaimer/Publisher’s Note: The statements, opinions and data contained in all publications are solely those of the individual author(s) and contributor(s) and not of MDPI and/or the editor(s). MDPI and/or the editor(s) disclaim responsibility for any injury to people or property resulting from any ideas, methods, instructions or products referred to in the content.

