Article

Investigation of the Rock-Breaking Mechanism of Drilling under Different Conditions Using Numerical Simulation

1
China Coal Science & Technology Ecological Environment Technology Co., Ltd., Beijing 100013, China
2
School of Civil Engineering, Southwest Jiaotong University, Chengdu 610031, China
3
CCCC First Highway Consultants Co., Ltd., Xi’an 710000, China
4
State Key Laboratory of Eco-Hydraulics in Northwest Arid Region, Xi’an University of Technology, Xi’an 710048, China
*
Author to whom correspondence should be addressed.
Appl. Sci. 2023, 13(20), 11389; https://doi.org/10.3390/app132011389
Submission received: 18 September 2023 / Revised: 13 October 2023 / Accepted: 13 October 2023 / Published: 17 October 2023
(This article belongs to the Special Issue Application of Artificial Intelligence in Rock Mass Engineering)

Abstract

:
The interaction between the drill bit and rock is a complex dynamic problem in the process of drilling and breaking rock. In this paper, the dynamic process of drilling and breaking rock is analyzed using ABAQUS software. The rock-breaking mechanism of drilling is revealed according to the stress–strain state of the rock and the force of the drill bit. The effect of the size of the drill bit and the characteristics of the rock mass on the drilling parameters is studied during the drilling process. The results show that both thrust force and torque show a linear increase with the increasing drilling speed under each fixed rotational speed. The drill bit size has minimal impact on the correlation coefficient of the relationship curves between thrust force, torque, and rotation speed. The drilling results in a soft–hard interlayered rock formation show that there are significant differences in thrust force and torque during the drilling process of different rock types. Whether transitioning from a soft rock layer to a hard rock layer or vice versa, the relationship between thrust force and torque is distinctly manifested whenever there is a change in rock quality. The thrust force and torque increase correspondingly with the increase in confining pressure. When subjected to lateral pressure, thrust force and torque gradually increase with the rising confining pressure. Vertical drilling exhibits a larger increase in thrust force and torque compared to horizontal drilling. The thrust force and torque increase more significantly with the rise in confining pressure compared to lateral pressure.

1. Introduction

The interaction between the drill bit and rock is a complex dynamic problem in the process of drilling and breaking rock. During the process of rotary drilling, the drill bit engages in a sequence of actions involving compression, cutting, and friction against the rock. These actions transition the rock from its initial elastic deformation phase into a more pronounced state of plastic deformation. This ultimately facilitates the accomplishment of cutting and fragmentation. Most scholars use static or quasi-static equilibrium analysis methods to conduct research, which cause large errors between the monitoring data and theoretical analysis results during the drilling process. Therefore, they cannot accurately explain the complex physical and mechanical changes in the rock drilling process.
As technology advances, sensors and automation equipment are becoming widely used in mining. Sensors are used to monitor equipment status, environmental conditions and work processes. This provides critical data for maintaining equipment, ensuring safety and optimizing production. Self-driving trucks, drones and automated drilling equipment are used in the drilling process, which can help increase production efficiency and reduce risks [1,2,3,4]. With the rapid advancement of computer technology, individuals have harnessed numerical simulation techniques to engage in diverse forms of simulated research on the process of rock-drilling-induced damage. This approach has provided a clearer exposition of the patterns of rock fragmentation and a more comprehensive understanding of the mechanics underpinning rock drilling. Consequently, this has paved the way for the proposition of more efficient drilling methods aimed at achieving higher levels of rock-fracturing efficacy. With the rapid development of computer technology, people have carried out various simulation research on the rock drilling failure process with the help of numerical simulation technology. This shows the breaking law of rock more clearly, understands the mechanism of drilling and breaking rock more comprehensively, and then proposes a drilling method with higher rock-breaking efficiency. The stereoscopic crushing effect of rocks refers to the process of crushing hard rock materials into smaller particles or fragments. Wang et al. [5] used numerical simulation to study the rock-breaking process and mechanism of compound impact drilling. The research results show that under the action of compound impact, the rock will produce a stereoscopic crushing effect. Saksala [6] utilized a finite-element-based modeling approach to simulate the dynamic interaction between a drilling bit and rock. This simulation involved a numerical investigation into the impact of static hydrostatic pressure and confining pressure on the process of impact drilling in hard rock. Shi [7] employed the ABAQUS finite element software to establish a finite element model of a drilling system encompassing drill rods, borehole walls, drill bits, and coal rock. In the coal seam gas drainage operation, the gradual change in the interior of the coal rock after being damaged by cutting and the movement and force of the drill bit and drill pipe were simulated and analyzed. The results clarified the failure law of the coal rock and the force and movement law of the drill bit. Yan et al. [8] undertook a numerical simulation to investigate the cutting process of individual abrasive particles. The outcomes indicate that when the cutting depth reaches a certain critical value, both radial and tangential cutting forces experience a sudden surge. Furthermore, during low-speed cutting, this increase is more pronounced compared to the increase observed during high-speed cutting. Aiming at the influence of factors such as bit cutting angle and drilling speed during the drilling process, Xu et al. [9] and Luo [10] used LS-DYNA software to establish the finite element models of the twist drill bit and the polycrystalline diamond compact. The simulation analysis obtained the relationship between the change in cutting angle and the drilling efficiency, and analyzed the influence of cutting speed and drilling speed on the drilling process. A large number of scholars [5,11,12,13] have conducted numerical simulations on rock drilling, and the research results show that impact energy, impact speed, and impact angle have a significant impact on rock fragmentation. As the impact energy increases, the rock fragmentation effect increases. Both the impact angle and impact speed have an optimal value, which can maximize the rock-crushing effect. Cyclic loading will gradually weaken the strength of the rock through multiple loading and unloading processes, leading to fatigue failure, thus affecting the rock-crushing effect.
Many scholars have conducted a lot of research on the rock-breaking efficiency of different bit shapes, bit structures and drilling methods [14,15,16,17,18,19]. For instance, Pryhorovska et al. [14] established a finite element model of the cutting process for PDC drill bits, conducting numerical simulations on the cutting processes of PDC drill bits with varying shapes. The simulation results show that there is no essential difference between cross cutting and straight cutting, the cutting force relationship is oscillatory and non-uniform for all types of tools, and the increase in cutting depth leads to an increase in vibration amplitude. Yang et al. [15] combined experimental investigations with numerical simulations and delved into the rock-fracturing mechanisms of PDC drill bits. They established nonlinear dynamic models for rock units and analyzed stress states within rock units, sliding fracture characteristics, plastic energy dissipation, and stress distribution along cutting edges. In comparison to unidirectional cutting, lateral cutting generates greater tensile stress within rock units. It exhibits lower plastic energy dissipation, and the average stress on the cutting edge is significantly lower than that observed in unidirectional cutting. During the lateral cutting process, rocks undergo not only shear deformation but also brittle fracture. This dual mode of failure contributes to an enhancement in the rock’s fracturing efficiency. Li et al. [16] utilized the ABAQUS finite element method to construct a nonlinear dynamic simulation model for the dynamic rock fracturing of both PDC drill bits and roller-cone compound drill bits. Their study delved into the cutting and fracturing mechanisms of these two types of drill bits. It was discovered that, in hard formations, PDC drill bits experience more severe torsional vibration than roller-cone bits, resulting in relatively lower rock-fracturing efficiency. This discrepancy can be attributed to the fact that PDC drill bits rely on a combination of compression and tension for rock fracturing, while roller-cone bits primarily utilize tensile stress for fracturing. Friction and vibration phenomena are present during the drilling process, consequently leading to wear and tear of the drill bit. Therefore, Wang et al. [17] closely integrated the friction between the drill string and the wellbore. They introduced a model to compute the drill string’s surface swing response, simulating the redistribution of friction during stick-slip motion caused by swinging and friction. Tkalich et al. [18] constructed a representative 3D finite element model resembling the microstructure of hard metals. They employed macroscopic devices to conduct macroscopic finite element simulations on the normal and oblique frictional impact of elastic rocks using hard metal spherical tips. Through microstructure analysis, they elucidated that the tensile failure of hard alloy particles on the drill bit is the primary cause of drill bit wear. Peng [19] conducted a comparative study on numerical simulation finite element models, constitutive models, and the accuracy of simulation results for single-tooth and full-bit rock fracturing. They found that the Mohr–Coulomb model introduces slightly larger errors in results compared to the Drucker–Prager model. Furthermore, they employed finite element numerical simulations to analyze the force distribution on the main cutting teeth during drill bit rock cutting, allowing them to predict the wear trend of the drill bit’s cutting teeth. When drilling into rock using a drill bit, friction is generated that wears away the rock as the drilling reaches a steady state [20]. The contact stress acting on the rock drill bit and the inclination angle of the drill bit are important indicators that reflect the degree of drill bit wear [21]. Wang et al. [22] conducted laboratory drilling experiments to study drill bit wear during the drilling process. At present, the rock-breaking mechanism and theoretical research on the drilling process are not yet complete. Most of the previous studies used static or quasi-static equilibrium analysis methods [23,24,25,26,27,28,29,30,31,32,33,34,35,36], which resulted in large errors between the data monitored during the drilling process and the theoretical analysis results. The complex physical and mechanical changes in the rock-drilling process cannot be accurately explained [37,38,39,40,41,42]. The process of drilling and breaking rock is carried out by controlling the drilling speed and rotation speed of the drill bit. Changes in the drilling speed, rotation speed and rock properties will cause changes in the force on the drill bit. ABAQUS is a powerful finite element analysis software that can be used to simulate a variety of engineering and scientific problems, including the techniques used to drill bits into rock. Using ABAQUS to simulate drilling into rock with a drill bit can help engineers optimize the drilling process, reduce costs and risks, and ensure the successful completion of the project. Therefore, it is necessary to use ABAQUS to study the changing rules of drill bit stress during drilling under different drilling speeds, rotational speeds, confining pressures and rock structure conditions.
In this paper, the dynamic process of drilling and breaking rock is analyzed using the ABAQUS software. According to the stress–strain state of the rock and the force of the drill bit, the rock-breaking mechanism of drilling is revealed. The effect of the size of the drill bit, and the characteristics of the rock mass on the drilling parameters is studied during the drilling process.

2. Methodology and Model Establishment

This section mainly studies the establishment of the drill bit–rock mathematical model, rock-breaking criteria and the finite element model of the drill bit’s dynamic rock breaking. The control method of drill bit and rock is set for the model.

2.1. Mathematical Model for Drill Bit–Rock Contact

Based on the fundamental theory of the finite element method, considering the space domain occupied by the drill bit–rock contact at time t as Ω, the volume force, boundary load, and Cauchy internal stress acting within the contact region are denoted as b, q, qc, and σ, respectively. Therefore, the contact problem can be expressed as
Ω σ δ e d Ω Ω b δ u d Ω Γ f q δ e d S Γ c q c δ u d S + Ω ρ a δ u d Ω = 0
where Γf is the load boundary, Γc is the contact boundary, δu is the virtual displacement, δe is virtual strain, ρ is density, and a is acceleration.
By discretizing the domain Ω with finite elements and introducing a virtual displacement field, we can obtain
m u ¨ = p t + c u , α f u , β
where m is the mass matrix, ü is the acceleration vector, t is the time variable, p is the external force vector, c is the contact force and friction vector, f is the internal stress vector, u is the object displacement, α is a variable related to the contact surface properties, and β is a variable related to the material constitutive relation.

2.2. Rock-Breaking Criterion and Constitutive Relation of Rock

The strength criterion for rock commonly adopts the Drucker–Prager (D-P) criterion. Building upon the Mohr–Coulomb criterion, the D-P criterion incorporates the influence of intermediate principal stresses and accounts for the effect of static hydrostatic pressures. This criterion is suitable for explaining the yield or failure behavior of rock materials under static hydrostatic pressures. Therefore, the model opts for the D-P criterion as the yield criterion for rock. It can be specifically formulated as follows:
f = α I 1 + J 2 K = 0
I 1 = σ 1 + σ 2 + σ 3
J 2 = σ 1 σ 2 2 + σ 2 σ 3 2 + σ 3 σ 1 2 6
α = 2 sin ϕ 3 3 sin ϕ
K = 6 c cos ϕ 3 3 sin ϕ
where I1 is the first invariant of stress, J2 is the second invariant of stress deviation, α and K are experimental constants related only to rock internal friction angle φ and cohesion c, and σ1, σ2, σ3 are the first, second and third principal stresses, respectively.
As per Equation (3), during the process of cutting and drilling into rock, the stress within the rock progressively increases, inducing plastic deformation. When the rock’s plastic strain reaches a certain critical value, rock failure initiates. With the continuous increase in plastic strain, the rock’s strength gradually diminishes. Until the plastic strain of the rock reaches the equivalent plastic strain corresponding to complete failure, the surface layer of the rock detaches from the rock mass, resulting in the formation of debris. Therefore, the equivalent plastic strain is used as the criterion of rock failure, i.e.,
ε p     ε ¯ f p l
where ε p is the equivalent plastic strain, and ε ¯ f p l is the equivalent plastic strain of rock failure.
The concept of “damage factor” from damage mechanics is introduced into the context of rock failure and detachment. Currently, the elastic modulus is primarily employed to define the damage factor D, as follows:
D = 1 E E = 0       ε ε ¯ f p l 1 σ σ ¯ ε > ε ¯ f p l
where E is the elastic modulus of rock without failure, E′ is the equivalent elastic modulus of rock failure, ε is the strain, σ is the stress, σ ¯ is the equivalent stress, σ y 0 is the yield stress when the initial damage occurs to the rock, and the damage variable D = 0 at this time; when the plastic strain reaches ε ¯ f p l , D = 1, the rock fails.

2.3. Finite Element Model for Dynamic Rock Fragmentation by Drill Bit

In this section, the finite element model of the drill bit drilling into the rock-breaking process is established. In order to enhance computational efficiency and facilitate analysis, the assumptions are proposed by disregarding minor influencing factors within this model.

2.3.1. Establishing the Contact Model between the Drill Bit and the Rock

Taking into account the energy consumption of the drilling rig, the stiffness and toughness of the drill pipe, and the accuracy of the results, it can be seen from the geometric analysis that the drill bit model adopts a 75# impregnated diamond core drill bit with an outer diameter of 75 mm and an inner diameter of 59 mm, which can meet 80% of the demand. It is equipped with 7 evenly distributed waterways. To better align with real-world drilling conditions, the drill bit model is designed with an edge-worn shape, featuring a curved profile. During the rock drilling process, considering the drill bit’s significantly higher strength compared to the rock, the drill bit is defined as a rigid body. This implies that no deformation occurs during drilling. In addition, set a reference point RP to bind with the drill. The drilling and rotation of the drill bit are controlled by controlling the movement of the reference point. The rock model is a disc with a thickness of 20 mm and a diameter of 150 mm (twice the outer diameter of the drill bit), as shown in Figure 1. The diameter of 150 mm was chosen to ensure that the rock model was large enough to simulate conditions in actual drilling and to provide sufficient surface area for drilling operations. The rock thickness of 20 mm was chosen to use thinner rock samples in the simulations to simplify the experiments and reduce material costs. The mesh division of the contact part between the drill bit and the rock is denser, and the division of the edge part is looser, which can ensure the calculation accuracy and better simulate the exfoliation process of cuttings. Hence, a structured meshing method is employed for the rock, utilizing 8-node linear hexahedral reduced-integration elements with hourglass control (C3D8R). The mesh size in the contact region between the drill bit and the rock is approximately 1.5 mm, while around the edges, it is about 8 mm. The mesh size along the thickness direction is approximately 0.5 mm.
The diamond-impregnated core bit is suitable for the grid division method of free, and the tetrahedron unit (C3D10M) is used to divide the grid, and the overall grid size is about 4 mm.
In this model, the surface-to-surface method is employed to establish the contact interaction between the impregnated diamond core bit and the rock. The contact interaction between the impregnated diamond core bit and the rock comprises mainly two aspects: first, the normal interaction between the two; and second, the direct tangential interaction between them.
(1)
Normal contact model between drill bit and rock:
The normal contact relationship between the drill bit and the rock is relatively clear. Only when the drill bit comes into contact with the rock can the two contacting surfaces transmit loads to each other in a compressed state. This type of contact behavior is referred to as hard contact. Under the influence of normal load, the drill bit gradually compresses the rock, leading to an increasing deformation of the rock in the normal direction. However, this contact does not result in penetration through the rock; it merely compresses the rock material.
(2)
Tangential contact model between drill bit and rock:
Under the influence of normal loading, the drill bit comes into close contact with the rock. As the drill bit rotates around the axis of the drill rod, frictional forces arise at the contact surface between them. When this frictional force falls below a specific critical threshold, the drill bit remains in an adhering state with the contact surface, and the drill bit does not initiate rotation. Nevertheless, upon surpassing this critical threshold, the contact surface initiates relative sliding, indicating that the drill bit is in a sliding state.
In the contact sliding process, Coulomb’s friction law is usually used to calculate the tangential force during the sliding, i.e.,
τ = μ p
where μ is the coefficient of friction, τ is the tangential force when sliding, and p is the normal contact pressure.

2.3.2. Basic Assumptions

The simulation calculation of the drill bit drilling in the rock-breaking process is very complicated. This model focuses on the dynamic process of drilling and breaking the rock, the stress–strain state of the rock, the force of the drill bit, and the influence of factors such as drilling parameters, drill size, and rock mass characteristics on the force of the drill bit. Therefore, in order to enhance computational efficiency and facilitate analysis, we make the following assumptions by disregarding minor influencing factors within this model:
(1)
Given that the strength and hardness of the PDC core bit are significantly superior to those of the rock, we assume the bit to be rigid and neglect wear during the drilling process;
(2)
The rock is considered a continuous, homogeneous, isotropic elastic–plastic medium, and the temperature effects during the drilling process are disregarded;
(3)
After the failure of the rock unit failure, it is deleted from the rock mass, so that the peeled cuttings will not affect the subsequent drilling;
(4)
We neglect the jet effect in the process of flushing cuttings, and do not take into account the fluid resistance;
(5)
The bottom of the well and the surrounding rocks are in the far field of the wellbore.

2.3.3. Control Method of Drill Bit and Rock

The surface-to-surface contact is set for the model as the contact surface for judging the continuous damage and exfoliation of the rock, and the friction coefficient between the drill bit and the rock is taken as 0.5. Fixed boundary conditions are implemented at the bottom of the rock and along its surrounding edges, with the influence of confining pressure temporarily disregarded. An imposed drilling velocity of 2 mm/s along the negative Z-axis and a rotational speed of 100 rpm are applied to the reference point (RP) that constrains the drill bit’s rigid motion. During the drilling process, the translational and rotational motions of the drill bit in the X and Y directions are restricted. The drilling duration is set to 5 s. The settings of these drilling parameters are consistent with the parameter settings during the actual drilling process [38]. Since hard rock is generally more stable than soft rock, it is easier to control during simulations. This means that the model converges more easily and the results are more reliable. Therefore, in the selection of rock types, we take hard rock as the research object. The key parameters of the research materials are shown in Table 1.

3. Results

In this section, the rock-breaking mechanism of drilling is revealed according to the stress–strain state of the rock and the force of the drill bit. The effect of the size of the drill bit and the characteristics of the rock mass on the drilling parameters are studied during the drilling process.

3.1. Dynamic Rock Breaking Analysis of Impregnated Diamond Bit

The PDC diamond core bit gradually comes into contact with the rock surface under the influence of drilling speed and rotation speed. It fractures the surface rock units in contact, exposing the next layer of rock units as a new rock surface. Due to the continuous effect of drilling speed and rotational speed, the drill bit and the rock surface form a new contact relationship again. The drill bit and the surface rock unit undergo a repeated cycle of contact–destruction–re-contact, and finally form a wellbore. As shown in Figure 2a during drilling at 0.1 s, the drill bit just comes into contact with the rock surface, and an indentation is formed on the rock surface; as time increases, the contact area between the drill bit and the rock increases, eventually forming a ring with the same inner and outer diameter as the drill bit. The drilling process is shown in Figure 2a–h. Among them, the maximum stress value appears at the part where the drill bit contacts the rock, mainly distributed at the bottom of the hole and around the hole. When the arc edge of the drill bit penetrates the rock completely, the stress value distribution is basically stable.
Figure 3 is the cloud diagram of the major and minor principal stresses of the rock during the drilling process, and the principal stress value is specified to follow the principle of positive tension and negative pressure. At the contact point between the drill bit and the rock, there are tensile stress and compressive stress at the bottom of the hole and the rock units around the bottom of the drill hole, and the areas of tensile stress and compressive stress appear crosswise, but the failure is dominated by tensile stress. Due to the constraints of boundary conditions, the rock units are all under compression in the range far from the borehole.
Figure 4 shows the counter thrust force and counter torque of the rock on the drill bit during the drilling process. The increase in thrust and torque over time is divided into two stages, namely the unstable stage and the stable stage. During the unstable stage, thrust force and torque increase rapidly. This can be explained by the fact that when the drill bit comes into contact with the rock surface, a large impact pressure will be generated, so the torque and thrust will increase rapidly in a short period of time. When the time reaches 0.2 s, the thrust and torque are in a stable fluctuating state. The thrust fluctuates at 10,000 N and the torque fluctuates at 400 N·m. At this time, drilling is in a stable stage. This is because the drill bit gradually invades the rock, and the resistance of the rock to the drill bit remains stable. This is consistent with the research results of previous scholars [43]. During the phase of stable oscillations in thrust force and torque, if the combined effect of drilling speed and rotation speed is insufficient to break the rock, the drill bit is compelled to halt its advancement. Meanwhile, the drill string continues to twist and accumulate energy under the influence of the current drilling speed and rotation speed. At this time, the drill bit is in a viscous state, and the counter thrust force and counter torque of the rock subjected to the drill bit increase. When the accumulated energy within the drill string becomes sufficient to break the rock, the drill bit abruptly releases and continues drilling around the drill string axis. This phase is characterized by a sliding state of the drill bit, where the opposing pressure and torque decrease after reaching their peak values. This phenomenon is referred to as the adhesive-sliding vibration of the drill bit. It can be seen from Figure 4 that the back-and-forth fluctuations of thrust pressure and torque values indicate that the drill bit and the rock are constantly in a viscous–slip–stick cycle state. When the thrust pressure and torque increase, the drill bit is in a viscous state. When the thrust pressure and torque decrease in torque indicates that the bit is slipping.

3.2. Influence of Drilling Parameters on Bit Force

This section mainly studies the influence of drilling parameters on thrust force and torque and analyzes the influence of drilling speed and rotational speed on thrust force and torque and the relationship between thrust force and torque.

3.2.1. Influence of Drilling Speed on Bit Force

The effects of different drilling speeds on thrust and torque under the same rotational speed are shown in Figure 5. The rotation speeds are fixed at 50 rpm, 100 rpm, 200 rpm, and 300 rpm, respectively. Change the drilling speed at the same rotation speed, and the drilling speeds are 0.5 mm/s, 1.0 mm/s, 1.5 mm/s, and 2.0 mm/s, respectively. The rotation speed in Figure 5a is 50 rpm, the rotation speed in Figure 5b is 100 rpm, the rotation speed in Figure 5c is 200 rpm, and the rotation speed in Figure 5d is 300 rpm. Test parameter values are determined based on experimental test results. It can be seen from the figure that at any fixed rotation speed, the thrust force and torque curves have obvious levels of change. As the drilling speed increases, the thrust force and torque also increase. During the drilling process, due to the continuous drilling speed and rotation speed, the drill bit came into contact with the rock within 0.5 s, resulting in a large impact thrust and torque, which was in an unstable state at this stage. After about 0.5 s, the thrust force and torque fluctuate steadily back and forth within a certain fixed range, indicating that this stage is in a stable state. The fluctuations in the drilling weight and torque are oscillations caused by the continuous viscosity–slip–viscosity cycle between the drill bit and the rock.
For each drilling speed, the average values of thrust force and torque during their stable phases were computed, resulting in the relationship curves between thrust force, torque, and drilling speed at various rotational speeds, as illustrated in Figure 6. Under each fixed rotational speed, both thrust force and torque exhibit a linear increase with the augmentation of drilling speed. Additionally, as rotational speed decreases, the slope of the curves depicting the relationship between thrust force, torque, and drilling speed becomes steeper. This is the outcome of the drill bit’s vertical motion along the axis of the drill rod, its rotational motion around the drill rod axis, and the accumulation of energy resulting from the axial and lateral sliding frictional resistance between the drill rod wall and the drill bit. Hence, we can formulate the relationship expressions between thrust force, torque, and drilling speed as follows:
F = ξ 1 v + F 0 T = ξ 2 v + T 0
where F is the thrust force, T is the torque, v is the drilling speed, ξ 1 is the slope of the relationship between the weight on bit and the drilling speed, ξ 2 is the slope of the relationship between the torque and the drilling speed, F0 is the thrust force constant, and T0 is the torque constant.

3.2.2. Effect of Rotation Speed on Drill Bit Force

During the drilling process, considering the impact of rotational speed on the force on the drill bit, a specific drilling speed is first fixed, and then the rotational speed is changed. The thrust force and torque values at different rotational speeds are obtained, as shown in Figure 7a–d. Test parameter values are determined based on experimental test results. The drilling speeds are set at 0.5 mm/s, 1.0 mm/s, 1.5 mm/s, and 2.0 mm/s, and under each fixed drilling speed, and the rotational speeds are varied at 50 rpm, 100 rpm, 200 rpm, and 300 rpm, resulting in corresponding thrust force and torque curves. From the graph, it is evident that at any given fixed drilling speed, both the thrust force and torque curves exhibit noticeable disparities, gradually decreasing with the increase in rotational speed. Due to the continuous interplay between drilling speed and rotational speed during the drilling process, significant impact pressure and torque are generated shortly after the drill bit initially contacts the rock. At this point, drilling is in an unstable state. Subsequently, the thrust force and torque maintained steady fluctuations, marking the drilling entering a stable stage.
In the same manner, taking the average of the thrust force and torque curves during the stable phase for each rotational speed, we obtain the relationships between thrust force, torque, and rotational speed at different drilling speeds, as shown in Figure 8. For each fixed drilling speed, thrust force and torque both decrease with increasing rotational speed in a power law fashion. Moreover, as drilling speed increases, the influence of rotational speed on thrust force and torque becomes more pronounced. This behavior is a consequence of the drill bit’s vertical motion along the drill rod axis, its rotational movement around the drill rod axis, and the frictional resistance experienced by the drill rod’s wall and the drill bit’s end, both axially and laterally [44]. The increase in drilling speed leads to an accumulation of energy, resulting in higher thrust force and torque. Conversely, higher rotational speeds reduce the thickness of rock cut by each rotation, which in turn reduces thrust force and torque. It is evident that increasing rotational speed can greatly enhance drilling efficiency. Therefore, the relationship expressions for thrust force, torque, and rotational speed can be established as follows:
F = η 1 ω 2 + F 0 T = η 2 ω 2 + T 0
where F is thrust force, T is the torque, v is the drilling speed, ξ 1 is the slope of the relationship between the thrust force and the drilling speed, ξ 2 is the slope of the relationship between the torque and the drilling speed, F0 is thrust force constant, and T0 is the torque constant.

3.2.3. Relationship between Torque and Thrust Force

As drilling speed increases, the thrust force gradually rises, and torque correspondingly increases. Conversely, with an increase in rotational speed, both thrust force and torque gradually decrease. The relationship between torque and thrust force during the drilling process is illustrated in Figure 9. From the graph, it becomes evident that whether at the same drilling speed with different rotational speeds or at the same rotational speed with different drilling speeds, torque exhibits a linear increase with thrust force. Furthermore, the slope of the torque–pressure relationship curve remains almost constant under the same rotational speed with varying drilling speeds. Thus, it can be observed that for the same drill bit at the same rotational speed, both thrust force and torque exhibit a linear relationship.
From both Equations (11) and (12), we can obtain the relationship expression between torque and thrust force as:
T = ξ 2 ξ 1 ( F F 0 ) + T 0 T = η 2 η 1 ( F F 0 ) + T 0
From Equation (13), it is apparent that the relationship expressions between thrust force, torque, and drilling speed, as well as the relationship expressions between thrust force, torque, and rotational speed, yield identical forms for the relationship between thrust force and torque. Therefore, the relationship expression between torque and thrust force can be simplified as
T = κ F + T 0
where F is thrust force, T is torque, α a is the slope of the relationship curve between torque and thrust force, and β is the torque constant.

4. Discussion: Analysis of Factors Affecting Drilling Forces

This chapter analyzes the effects of drill bit size, rock mass structural characteristics, and confining pressure on thrust and torque.

4.1. Analysis of Drill Bit Size on Drilling Force

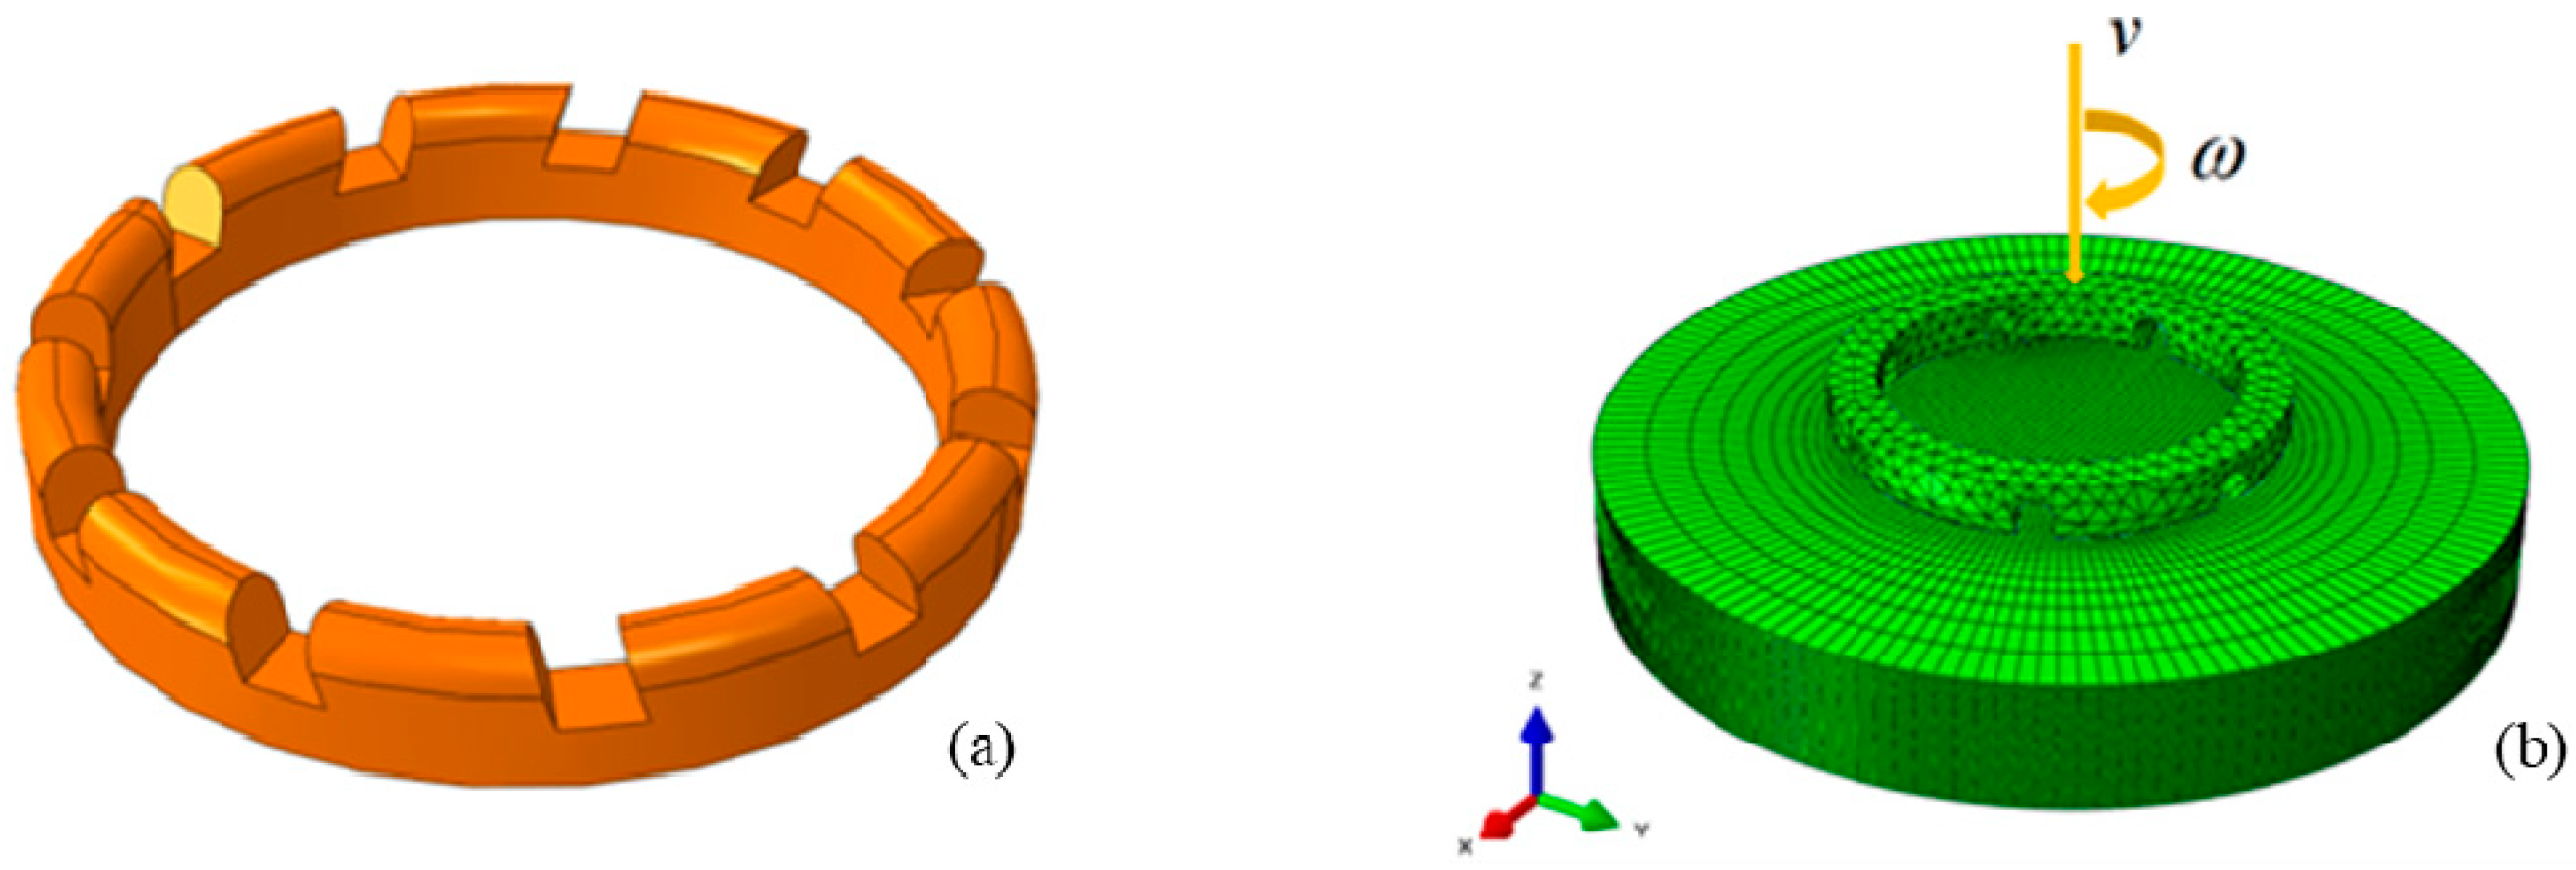
During the drilling process, the variation in drill bit dimensions can have different effects on drill bit forces. In this study, we selected these drill bit sizes because they are relatively common on the market and can meet most practical drilling conditions. These drill bit models are denoted as 59#, 75#, and 110#. Their corresponding outer diameters are 59 mm, 75 mm, and 110 mm, while their inner diameters are 43 mm, 59 mm, and 91 mm, respectively. Additionally, the number of water outlets for these drill bits is 6, 7, and 10, respectively. Finite element mesh models for these three drill bit models interacting with the rock are depicted in Figure 10.
By setting drilling speed and rotational speed, we control the drilling and rock-breaking process. We will separately discuss the variations in thrust force and torque with drilling speed for different-sized drill bits when the rotational speed is set at 200 rpm. Additionally, we will examine the changes in thrust force and torque with rotational speed for different-sized drill bits when the drilling speed is set at 2 mm/s.
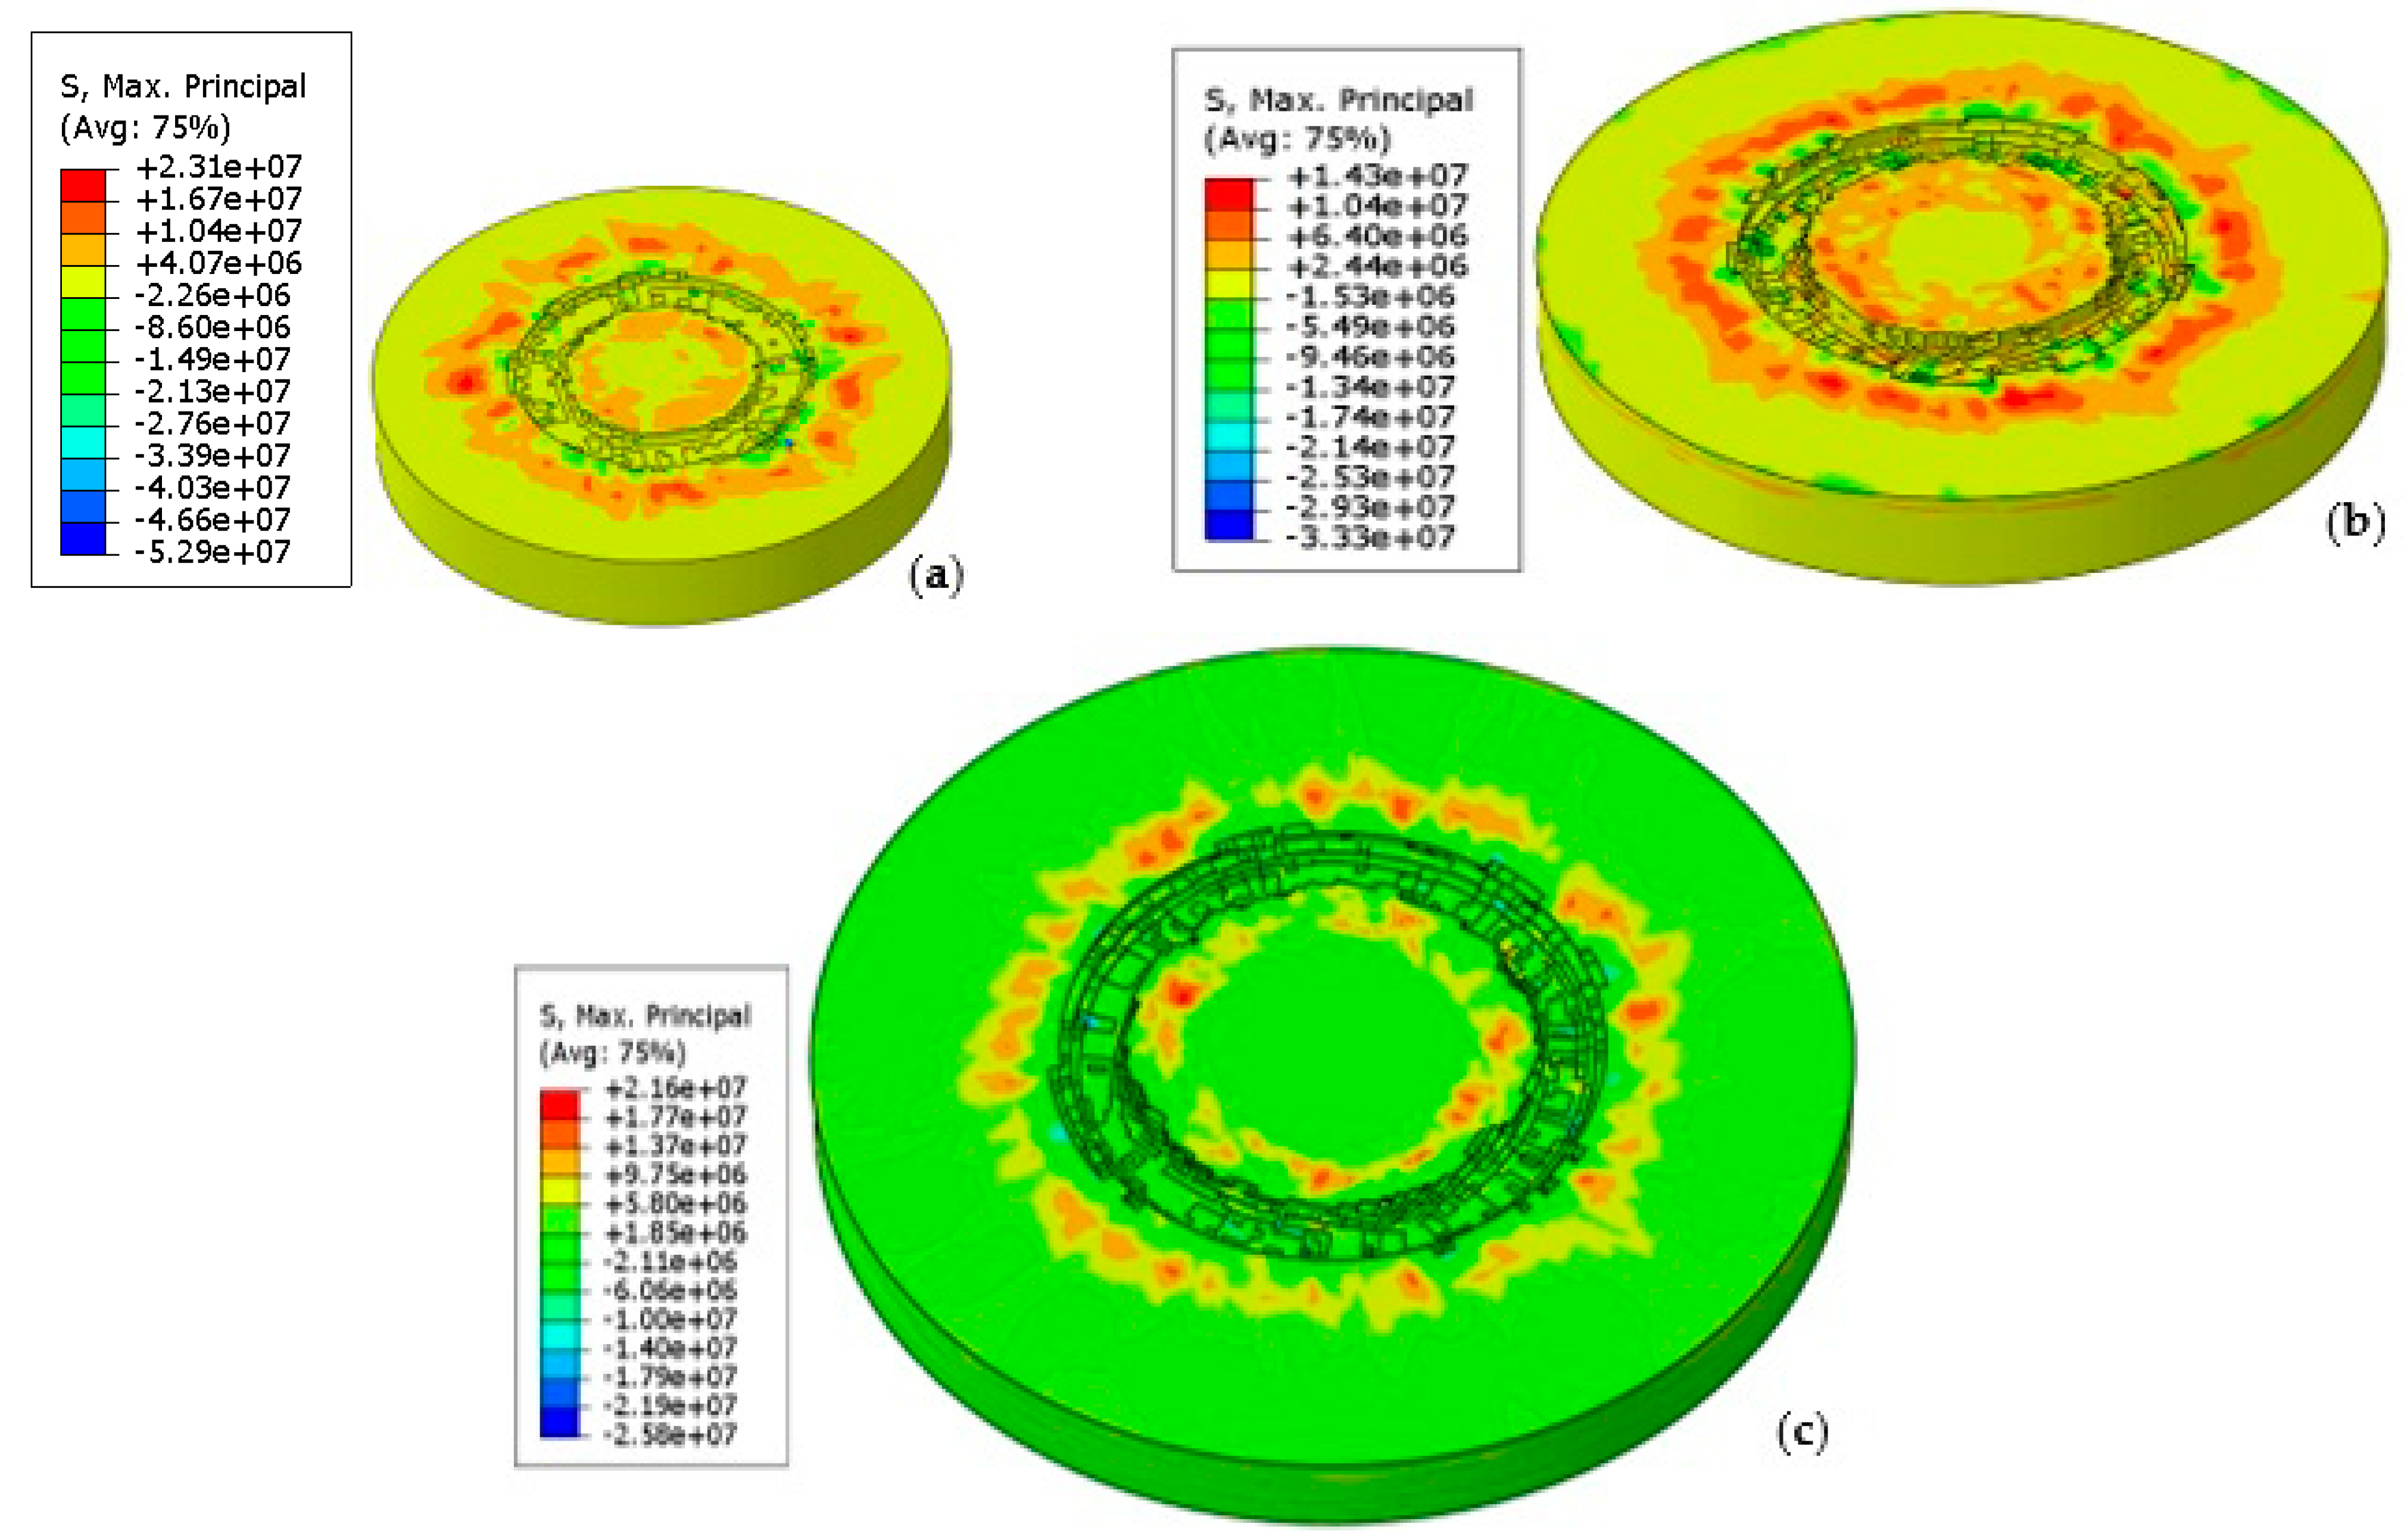
When the drilling speed is 2 mm/s, the rotation speed is 200 rpm, and the drilling time is 2.5 s. The large principal stress cloud diagrams of drilling with three sizes of drill bits are shown in Figure 11. The diameter of the drill bit in Figure 11a is 59, the diameter of the drill bit in Figure 11b is 75, and the diameter of the drill bit in Figure 11c is 110. There is a small difference in the stress values of the three sizes of drill bits. The maximum stress values appear at the contact point between the drill bit and the rock, mainly distributed at the bottom of the well and around the wellbore. Notably, the stress distribution region for the larger-sized drill bit extends over a wider range along the wellbore compared to the smaller-sized drill bits.
Figure 12 illustrates the relationship curves between thrust force, torque, and drilling speed for the three drill bit sizes, 59#, 75#, and 110#, all at the same rotational speed of 200 rpm. It is evident that both thrust force and torque exhibit a linear increase with the augmentation of drilling speed. Under the same drilling speed conditions, larger drill bit sizes result in higher thrust force and torque. However, the slope of the relationship curve between thrust force, torque, and drilling speed remains largely unaffected by drill bit size. The increase in drill bit size enlarges the effective contact area between the drill bit and the rock during drilling, consequently leading to increased thrust force and torque. Therefore, it is possible to calculate the required thrust force and torque for a given drill bit size by considering the effective contact area between the drill bit and the rock. For various drill bit sizes, the following relationship expressions between thrust force, torque, and drilling speed, taking into account the drill bit size effect, can be established:
F = α ( ξ 1 v + F 0 ) = α ξ 1 v + α F T = α ( ξ 2 v + T 0 ) = α ξ 2 v + α T
α = A n A 0
where F is thrust force, T is torque, v is drilling speed, ξ 1 is the slope of the relationship curve between thrust force and drilling speed, ξ 2 is the slope of the relationship curve between torque and drilling speed, F 0 is the thrust force constant, T 0 is the torque constant, α represents the drill bit size influence factor, A0 represents the effective contact area between the current drill bit and the rock, and An represents the effective contact area between the required drill bit size and the rock.
Figure 13 depicts the relationship curves between thrust force, torque, and rotational speed for the three drill bit sizes—59 #, 75 #, and 110 #—all at the same drilling speed of 2 mm/s. It can be observed that both thrust force and torque decrease in a power law manner with the increase in rotational speed. Under the same rotational speed conditions, larger drill bit sizes result in higher thrust force and torque. However, the correlation coefficient of the relationship curve between thrust force, torque, and rotational speed remains largely unaffected by drill bit size. The increase in drill bit size leads to an increase in thrust force and torque mainly due to the enlarged effective contact area between the drill bit and the rock during drilling. Therefore, it is possible to calculate the required thrust force and torque for a given drill bit size by considering the effective contact area between the drill bit and the rock. For various drill bit sizes, the following relationship expressions between thrust force, torque, and rotational speed, taking into account the drill bit size effect, can be established:
F = α ( η 1 ω 2 + F 0 ) = α η 1 ω 2 + α F 0 T = α ( η 2 ω 2 + M 0 ) = α η 2 ω 2 + α T 0
where F is thrust force, T is torque, ω is rotational speed, η 1 is the slope of the relationship between the thrust force and the rotation speed, η 2 is the slope of the relationship between the torque and the rotation speed, F 0 is thrust force constant, T 0 is the torque constant, and α is the drill bit size influence factor.
Figure 14 illustrates the relationship between torque and thrust force during the drilling process for different-sized drill bits. From the graph, it is evident that regardless of the drill bit size, the torque during the drilling process exhibits a linear increase with thrust force. Additionally, larger drill bit sizes correspond to steeper slopes in the torque–pressure curve. Similarly, both Equations (15) and (17) yield the relationship expression between torque and thrust force, taking into account the drill bit size effect as follows:
T = α ξ 2 ξ 1 ( F α F 0 ) + T 0 T = α η 2 η 1 ( F α F 0 ) + T 0
From Equation (18), it is evident that the two expressions are identical in form. Therefore, the relationship expression between torque and thrust force, considering the drill bit size effect, can be simplified to:
T = α κ F + T 0
where F is thrust force, T is torque, κ is the slope of the relationship curve between thrust force and drilling speed, T 0 is the torque constant, and α represents the drill bit size influence factor.
The changes in the relationships between thrust force, torque, drilling speed, and rotational speed, as well as the alteration in the torque–thrust force relationship during the drilling process with different-sized drill bits, primarily stem from variations in the effective contact area between the drill bit and the rock. Therefore, by introducing the drill bit size influence factor through the conversion relationship between different-sized drill bits and the effective contact area with the rock, we obtain the relationship expressions that consider the drill bit size effect for thrust force and torque concerning drilling speed and rotational speed. Additionally, we acquire the expression for the torque–thrust force relationship while considering the drill bit size effect.

4.2. Influence of Rock Mass Structural Characteristics on Drill Bit Forces

The structural characteristics of rock masses play a crucial role in controlling the deformation and failure of rock engineering, ultimately determining the overall stability of the rock mass. Therefore, investigating the impact of these structural characteristics on drill bit forces holds significant importance. In this section, the author primarily considers three influencing factors related to rock mass structure: the dip angle of structural planes, their thickness, and the presence of soft–hard interlayers between rock strata. Each of these factors will be separately discussed in terms of their influence on thrust force and torque during the rock drilling process.
The finite element mesh model containing the rock mass structural surface is shown in Figure 15. Among them, the inclination angle of the rock mass structural plane is 45° and 90°, respectively, and the thicknesses of the rock mass structural plane are 1 mm, 3 mm and 5 mm, respectively. The 75# drill bit is also used for drilling. The process of drilling and rock breaking is controlled by setting the drilling speed and rotation speed. The drilling speed and rotation speed are set to 2 mm/s and 200 rpm, respectively. The drilling time is 2.5 s. The physical and mechanical parameters of the rock mass whose basic quality level is Level II in Table 1 are selected, the structural plane is replaced by solid units with a lower rock mass quality level, and the physical and mechanical parameters of the Level IV rock mass are selected.
The inclination angles of the rock mass structural planes are 45° and 90°, respectively, and the large principal stress cloud diagrams with a structural plane thickness of 3 mm are shown in Figure 16. The maximum stress values appear at the contact point between the drill bit and the rock, mainly distributed at the bottom of the well and around the wellbore; the minimum stress values appear at the structural surface and around the boundary. The stress values in the two areas of the 90° structural plane are symmetrically distributed, and the stress values in the lower area of the 45° structural plane are slightly larger than those in the upper area. This is due to the extrusion of the upper rock mass on the lower rock mass on the structural plane during the drilling process.
Figure 17 displays the relationship curves between drill pressure and torque and the thickness of structural planes, with structural plane inclinations of 45° and 90°. A thickness of 0 mm indicates rock mass without structural planes. As observed from the graph, both drill pressure and torque decrease significantly as the thickness of the structural planes increases, indicating that the presence of structural planes in the rock mass has a substantial impact on drill pressure and torque. As shown in Figure 17a, for structural planes inclined at 45°, drill pressure and torque initially experience a sharp reduction as the thickness of the structural planes increases. This behavior can be attributed to the tilted orientation of the structural planes, causing a relatively larger contact area with the drill bit when the structural planes are initially encountered. However, as the drilling depth increases, the contact point between the drill bit and the structural planes gradually shifts away from the center until the drill completely penetrates the structural planes, resulting in a less pronounced reduction. As shown in Figure 17b, when the inclination angle of the structural surface is 90°, the thrust force and torque decrease in a relatively stable manner as the thickness of the structural surface increases. Since the structural plane separates the rock mass symmetrically, as the drilling depth increases, the drill bit and the structural plane are always in contact at the middle part, and thrust force and torque decrease by basically the same extent. Clearly, the presence of structural planes significantly influences the mechanical properties of the rock mass. Therefore, utilizing real-time drilling monitoring methods can effectively identify the existence of rock structural planes and provide insights into characteristics such as structural plane inclination and thickness.
The finite element mesh model for the rock mass with soft–hard interlayers is depicted in Figure 18. In this model, the upper rock layer has a thickness of 3 mm, while the lower rock layer has a thickness of 17 mm. The drilling process involves initial contact with the upper rock layer, followed by penetration through it and then contacting the lower rock layer. The distribution of soft and hard layers is considered in two scenarios: upper soft/lower hard rock layers and upper hard/lower soft rock layers. The same 75# drill bit is used, with drilling and rotation speeds set at 2 mm/s and 200 rpm, respectively. The drilling duration is set at 2.5 s. For the physical mechanical parameters, values are selected based on Table 1, with the physical parameters for the hard rock layer taken from rock mass quality Level II and those for the soft rock layer from rock mass quality Levels III and IV.
Figure 19 shows the thrust force and torque curves of soft and hard interbedded rock mass. Drilling analysis of the upper soft/lower hard rock layer and upper hard/lower soft rock layer were carried out, respectively. The hard rock layer is assigned properties corresponding to rock mass quality Level II, while the soft rock layer properties are selected from rock mass quality Levels III and IV. Regardless of the upper soft/lower hard rock layer distribution or the upper hard/lower soft rock layer distribution, the thrust force and torque values will change suddenly at the interface of the two rock layers, and there is an obvious boundary. During the drilling process, owing to the recurrent cycle of adhesion, slippage, and re-adhesion between the drill bit and the rock, the thrust force and torque consistently oscillate within a specific range during the stable phase.
As depicted in Figure 19a,b, when drilling in a rock formation with an upper layer of soft rock and a lower layer of hard rock, the drill bit initially comes into contact with the soft rock layer. After penetrating the upper soft rock layer, it reaches the lower hard rock layer, and drilling continues within the hard rock until completion. Upon the initial contact between the drill bit and the soft rock surface, significant impact pressure and torque are generated. Likewise, when the drill bit encounters the interface between the soft and hard rock layers, there is a notable increase in impact pressure and torque. This phenomenon is a result of the continuous action of drilling speed and rotational velocity during the transition from the soft rock surface to the hard rock layer. Once drilling stabilizes, both thrust force and torque remain within a certain range. During the stable drilling phase, the thrust force and torque in the soft rock layer are noticeably lower than those in the hard rock layer. When drilling through the soft rock layer, the thrust force and torque for the Level IV rock layer are notably lower than those for the Level III rock layer. Furthermore, it is worth noting that variations in the upper soft rock layer’s rock quality have a relatively minor impact on the thrust force and torque when drilling the lower hard rock layer.
As illustrated in Figure 19c,d, when drilling in a rock formation with an upper layer of hard rock and a lower layer of soft rock, the drill bit initially comes into contact with the hard rock layer. After penetrating the upper hard rock layer, it reaches the lower soft rock layer, and drilling continues within the soft rock until completion. Upon the initial contact between the drill bit and the hard rock surface, significant impact pressure and torque are generated. Subsequently, when the drill bit encounters the interface between the hard and soft rock layers, there is a slight reduction in pressure and torque. This phenomenon is a result of the continuous action of drilling speed and rotational velocity during the transition from the hard rock surface to the soft rock layer. Once drilling stabilizes, both thrust force and torque remain within a certain range. During the stable drilling phase, the thrust force and torque in the hard rock layer are noticeably higher than those in the soft rock layer. The variations in rock quality within the lower soft rock layer have a relatively minor impact on the thrust force and torque when drilling through the upper hard rock layer. When drilling through the soft rock layer, the thrust force and torque for the Level IV rock layer are slightly lower than those for the Level III rock layer.
The drilling results in the soft–hard interlayered rock formation clearly demonstrate significant differences in thrust force and torque during the drilling process in different rock layers. Whether transitioning from a soft rock layer to a hard rock layer or from a hard rock layer to a soft rock layer, whenever there is a change in rock quality, the thrust force and torque relationship curves are distinctly reflected. Therefore, it is possible to deduce the distribution pattern of rock layers by observing changes in thrust force and torque during the drilling process, which serve as indicators of specific variations in rock quality within the formation.

4.3. Effect of Rock Mass Confining Pressure on Drill Bit Stress

Due to limitations in model size and computational capacity, it is not possible to directly simulate the entire drilling process. Therefore, it is necessary to apply confining pressure at the model boundaries to simulate the in situ stress field in the rock mass. The study considers the variations in thrust force and torque when the drill bit penetrates under different Levels of static hydrostatic pressure and deviatoric stress. Consider the changes in the bit pressure and torque of the rock mass when drilling under different hydrostatic pressures and partial confining pressures. The effect of lateral confining pressure considers two different ways of drilling—vertical and horizontal.
The finite element grid model with applied rock confinement pressure is shown in Figure 20. Normal confinement pressure is applied to the upper part of the rock, and radial confinement pressure is applied at the lateral boundaries. The bottom of the rock is subjected to fixed constraints. A 75# drill bit is used for drilling, and the drilling process is controlled by setting the drilling speed and rotation speed to 2 mm/s and 200 rpm, respectively, with a drilling duration of 2.5 s. In the case where the normal confinement pressure ( σ z ) equals the radial confinement pressure ( σ r ), the rock is in a state of hydrostatic pressure. Different static water pressures of 0 MPa, 2 MPa, 10 MPa, and 20 MPa are applied to the rock. Figure 21 depicts the thrust force and torque for the rock under various static water pressures. When drilling vertically, the normal confining pressure is equal to the vertical stress, and the radial confining pressure is equal to the horizontal stress. The rock is subjected to normal pressures of 0 MPa, 2 MPa, 10 MPa, and 20 MPa in the vertical direction and radial pressures of 0 MPa, 0.6 MPa, 2.9 MPa, and 5.8 MPa in the radial direction.
When performing horizontal drilling, the normal pressure σ z is equal to the horizontal stress σ h , and the radial pressure σ r is equal to the vertical stress σ v . The rock is subjected to normal pressures of 0 MPa, 0.6 MPa, 2.9 MPa, and 5.8 MPa in the vertical direction and radial pressures of 0 MPa, 2 MPa, 10 MPa, and 20 MPa in the radial direction. With the increase in confining pressure, the thrust force and torque during the drilling process also increase accordingly.
The wear experienced by tools and equipment in the course of technological processes within geotechnology and mining carries substantial economic repercussions. On one hand, there are material costs stemming from the replacement of worn-out tools and equipment. On the other hand, there are expenses related to work process downtime [45]. Abrasivity is intricately linked to tool wear, rendering it imperative to ascertain the abrasivity rate specific to individual geological materials, contingent upon the nature of their interaction with the tools [46,47]. Numerous abrasivity tests have been meticulously developed within laboratory settings, establishing abrasivity as one of the most widely recognized index methods for evaluating the abrasive nature of rocks [45,46,47]. Abrasivity describes the ability of rocks to wear the surface of solid materials, primarily, but not limited to, metal. Such interactions transpire during various activities, including rock mining, drilling holes, loading, and both short and long-distance transportation. Abrasivity is responsible for how much the element in contact with it wears out. Crucially, it exerts a notable impact on the wear experienced by drill bits and contributes to increased forces acting upon the drill bit. Future research endeavors should aim to scrutinize the relationships between abrasivity and rock properties such as drilling properties, uniaxial compressive strength, point load strength, Brazilian tensile strength, Schmidt rebound hardness, and equivalent quartz content.

5. Conclusions

This paper uses ABAQUS software to simulate and analyze the rock-breaking process of diamond-impregnated drill bits and study the changing rules of rotation speed, drilling speed, drill bit size and confining pressure on thrust force and torque.
Considering the influence of drilling speed and rotation speed on thrust force and torque during drilling, the changing rules of drilling parameters on thrust and torque are obtained. This can reduce unnecessary energy consumption, improve drilling efficiency and reduce costs. When the rotational speed is fixed, the thrust and torque are linearly positively related to the drilling speed. As the rotation speed decreases, the slope of the relationship curve between thrust force and torque and drilling speed increases. When the drilling speed is constant, as the rotational speed increases, the thrust force and torque decrease as a power function.
When the drilling speed is constant, the larger the drill bit size, the greater the thrust force and torque. When the rotational speed is constant, the larger the drill bit size, the greater the thrust force and torque.
When the inclination angle of the structural surface is 45° and 90°, the thrust force and torque both decrease with the increase in the thickness of the structural surface. The thrust force and torque decrease sharply during the drilling process from not containing the structural surface to including the structural surface. The drilling results of soft and hard interbedded rock masses show that whether it is a transition from soft rock layer to hard rock layer, or from hard rock layer to soft rock layer, the relationship curve of thrust and torque can identify the transition process.
Thrust force and torque increase with increasing confining pressure. The thrust force and torque under the action of hydrostatic pressure increase with the confining pressure to a greater extent than those under the bias pressure. This paper uses numerical simulation software to simulate the dynamic process of the drill bit drilling into the rock, which can reduce the cost of actual testing and drilling.

Author Contributions

Conceptualization, X.L. and H.K.; methodology, H.K.; validation, X.M. and M.H.; investigation, X.L.; writing—original draft preparation, X.L. and M.H.; writing—review and editing, X.M. and M.H.; funding acquisition, M.H. All authors have read and agreed to the published version of the manuscript.

Funding

This study is sponsored by the National Natural Science Foundation of China (Grants No. 42177158, 11902249 and 11872301), Key Research and Development project of Shaanxi Province (No. 2022SF-412), Education Bureau of Shaanxi Province in China (Grant No. 20JS093). Opening fund of State Key Laboratory of Geohazard Prevention and Geoenvironment Protection Chengdu University of Technology (Grants No. SKLGP2022K005). Open subject of Urban Geology and Underground Space Engineering Technology Research Center of Shaanxi Province (2022KT-01). The financial support provided by this sponsor is greatly appreciated.

Institutional Review Board Statement

Not applicable.

Informed Consent Statement

Not applicable.

Data Availability Statement

The data used to support the findings of this study are available from the corresponding author upon request.

Conflicts of Interest

The authors declare no conflict of interest.

References

  1. Zhironkina, O.; Zhironkin, S. Technological and Intellectual Transition to Mining 4.0: A Review. Energies 2023, 16, 1427. [Google Scholar] [CrossRef]
  2. Zhironkin, S.; Gasanov, M.; Suslova, Y. Orderliness in Mining 4.0. Energies 2022, 15, 8153. [Google Scholar] [CrossRef]
  3. Xu, C.; Chen, X.; Dai, W. Effects of Digital Transformation on Environmental Governance of Mining Enterprises: Evidence from China. Int. J. Environ. Res. Public. Health 2022, 19, 16474. [Google Scholar] [CrossRef]
  4. Cacciuttolo, C.; Guzmán, V.; Catriñir, P.; Atencio, E.; Komarizadehasl, S.; Lozano-Galant, J.A. Low-Cost Sensors Technologies for Monitoring Sustainability and Safety Issues in Mining Activities: Advances, Gaps, and Future Directions in the Digitalization for Smart Mining. Sensors 2023, 23, 6846. [Google Scholar] [CrossRef]
  5. Wang, W.; Liu, G.H.; Li, J.; Zha, C.Q.; Lian, W. Numerical simulation study on rock-breaking process and mechanism of compound impact drilling. Energy Rep. 2021, 7, 3137–3148. [Google Scholar] [CrossRef]
  6. Saksala, T. Numerical study of the influence of hydrostatic and confining pressure on percussive drilling of hard rock. Comput. Geotech. 2016, 76, 120–128. [Google Scholar] [CrossRef]
  7. Shi, J.; Wang, J.W.; Liu, X.L. Nonlinear Dynamics Simulation Analysis of Drill Tool--Coal Rock System based on ABAQUS. J. Dalian Univ. 2015, 36, 32–35. [Google Scholar]
  8. Yan, L.; Jiang, F.; Rong, Y. Grinding Mechanism Based on Single Grain Cutting Simulation. J. Mech. Eng. 2012, 48, 172–182. [Google Scholar] [CrossRef]
  9. Xu, X.X.; Hu, Y.X.; Sun, Y.F.; Yao, Z.Q. Finite Element Simulation for Thin-panel Drilling Process With ANSYS/LS-DYNA. Mach. Des. Res. 2012, 28, 85–89. [Google Scholar]
  10. Luo, D.; Li, M.F.; Wu, B.; Fan, D. Simulation of the Drilling Process of Polycrystalline Diamond Compact Drilling Bit. J. Wuhan. Univ. Technol. 2010, 32, 112–115. [Google Scholar]
  11. Saksala, T.; Gomon, D.; Hokka, M.; Kuokkala, V.-T. Numerical and experimental study of percussive drilling with a triple-button bit on Kuru granite. Int. J. Impact Eng. 2014, 72, 56–66. [Google Scholar] [CrossRef]
  12. Chiang, L.E.; Elias, D.A. A 3D FEM methodology for simulating the impact in rock-drilling hammers. Int. J. Rock. Mech. Min. 2008, 45, 701–711. [Google Scholar] [CrossRef]
  13. Liu, S.; Chang, H.; Li, H.; Cheng, G. Numerical and experimental investigation of the impact fragmentation of bluestone using multi-type bits. Int. J. Rock. Mech. Min. 2017, 91, 18–28. [Google Scholar] [CrossRef]
  14. Pryhorovska, T.O.; Chaplinskiy, S.S.; Kudriavtsev, I.O. Finite element modelling of rock mass cutting by cutters for PDC drill bits. Pet. Explor. Dev. 2015, 42, 888–892. [Google Scholar] [CrossRef]
  15. Yang, Y.X.; Zhang, C.L.; Lin, M.; Chen, L. Research on rock-breaking mechanism of cross-cutting PDC bit. J. Petrol. Sci. Eng. 2018, 161, 657–666. [Google Scholar] [CrossRef]
  16. Li, Q.; Xie, D.; Huang, Z.Q.; Deng, R.; Yu, D.L.; Yuan, Y. Studying Rock Breaking Properties and Penetration Rate Improving Mechanisms for Hybrid Drill Bit in Hard Formation. Mech. Sci. Technol. Aerosp. Eng. 2017, 36, 347–353. [Google Scholar]
  17. Wang, X.Y.; Ni, H.J.; Wang, R.H.; Liu, T.K.; Xu, J.G. Modeling and analyzing the movement of drill string while being rocked on the ground. J. Nat. Gas. Sci. Eng. 2017, 39, 28–43. [Google Scholar] [CrossRef]
  18. Tkalich, D.; Yastrebov, V.A.; Cailletaud, G.; Kane, A. Multiscale modeling of cemented tungsten carbide in hard rock drilling. Int. J. Solids Struct. 2017, 128, 282–295. [Google Scholar] [CrossRef]
  19. Peng, Y.F. The Numerical Simulation Technology of PDC Bit; Southwest Petroleum University: Chengdu, China, 2015. [Google Scholar]
  20. Detournay, E.; Defourny, P. A phenomenological model for the drilling action of drag bits. Int. J. Rock. Mech. Min. 1992, 29, 13–23. [Google Scholar] [CrossRef]
  21. Rostamsowlat, I.; Akbari, B.; Evans, B. Analysis of rock cutting process with a blunt PDC cutter under different wear flat inclination angles. J. Pet. Sci. Eng. 2018, 171, 771–783. [Google Scholar] [CrossRef]
  22. Wang, H.T.; He, M.M.; Zhao, J.B.; Zhang, Y.H. Digital drilling-based determination of rock anisotropy and anisotropic effect on cutter wear. Q. J. Eng. Geol. Hydrogeol. 2023, 56, qjegh2022-103. [Google Scholar] [CrossRef]
  23. Patne, H.S.; Kumar, A.; Karagadde, S.; Joshi, S.S. Modeling of temperature distribution in drilling of titanium. Int. J. Mech. Sci. 2017, 133, 598–610. [Google Scholar] [CrossRef]
  24. Gao, X.J.; Li, P.; Yan, P.F.; Zou, P. Simulation of Stainless Steel Drilling Mechanism Based on Deform-3D. Tool. Eng. 2011, 45, 17–20. [Google Scholar] [CrossRef]
  25. He, M.M.; Ding, M.C.; Yuan, Z.Y.; Zhao, J.R.; Luo, B.; Ma, X.D. Numerical simulation of rock bursts triggered by blasting disturbance for deep-buried tunnels in jointed rock masses. Comput. Geotech. 2023, 161, 105609. [Google Scholar] [CrossRef]
  26. Kong, X.X.; Liu, Q.S.; Zhao, Y.F.; Pan, Y.C.; Liu, J.P. Numerical simulation on the effect of joint orientation on rock fragmentation by TBM disc cutters. J. China Coal Soc. 2015, 40, 1257–1262. [Google Scholar]
  27. Karasawa, H.; Ohno, T.; Kosugi, M.; Rowley, J.C. Methods to estimate the rock strength and tooth wear while drilling with roller-bits-part 2: Insert bits. J. Energy Resour. Technol. 2002, 124, 133–140. [Google Scholar] [CrossRef]
  28. Teale, R. The concept of specific energy in rock drilling. Int. J. Rock. Mech. Min. Sci. 1965, 2, 57–73. [Google Scholar] [CrossRef]
  29. Rostamsowlat, I. Effect of Cutting Tool Properties and Depth of Cut in Rock Cutting: An Experimental Study. Rock Mech. Rock Eng. 2018, 51, 1715–1728. [Google Scholar] [CrossRef]
  30. Deng, Y.; Chen, M.A.; Jin, Y.; Zou, D.W.; Lu, Y.H. Theoretical and experimental study on the penetration rate for roller cone bits based on the rock dynamic strength and drilling parameters. J. Nat. Gas Sci. Eng. 2016, 36, 117–123. [Google Scholar] [CrossRef]
  31. Li, G.; Yang, M.; Meng, Y.F.; Liu, H.B.; Han, L.; Zhou, F.; Zhang, H. The assessment of correlation between rock drillability and mechanical properties in the laboratory and in the field under different pressure conditions. J. Nat. Gas Sci. Eng. 2016, 30, 405–413. [Google Scholar] [CrossRef]
  32. Wyering, L.D.; Villeneuve, M.C.; Kennedya, B.M.; Gravley, D.M.; Siratovich, P.A. Using drilling and geological parameters to estimate rock strength in hydrothermally altered rock-A comparison of mechanical specific energy, R/N-W/D chart and Alteration Strength Index. Geothermics 2017, 69, 119–131. [Google Scholar] [CrossRef]
  33. Ataei, M.; KaKaie, R.; Ghavidel, M.; Saeidi, O. Drilling rate prediction of an open pit mine using the rock mass drillability index. Int. J. Rock Mech. Min. Sci. 2015, 73, 130–138. [Google Scholar] [CrossRef]
  34. Hoseinie, S.H.; Aghababaei, H.; Pourrahimian, Y. Development of a new classification system for assessing of rock mass drillability index (RDI). Int. J. Rock Mech. Min. Sci. 2008, 45, 1–10. [Google Scholar] [CrossRef]
  35. Kumar, B.R.; Vardhan, H.; Govindaraj, M.; Vijay, G.S. Regression analysis and ANN models to predict rock properties from sound levels produced during drilling. Int. J. Rock Mech. Min. 2013, 58, 61–72. [Google Scholar] [CrossRef]
  36. Vardhan, H.; Adhikari, G.R.; Raj, M.G. Estimating rock properties using sound levels produced during drilling. Int. J. Rock Mech. Min. 2009, 46, 604–612. [Google Scholar] [CrossRef]
  37. Kalantari, S.; Baghbanan, A.; Hashemolhosseini, H. An analytical model for estimating rock strength parameters from small-scale drilling data. J. Rock Mech. Geotech. Eng. 2019, 104, 135–145. [Google Scholar] [CrossRef]
  38. Li, Z.; Itakura, K. An analytical drilling model of drag bits for evaluation of rocks strength. Soils Found. 2012, 52, 216–227. [Google Scholar] [CrossRef]
  39. Munoz, H.; Taheri, A.; Chanda, E. Rock cutting characteristics on soft-to-hard rocks under different cutter inclinations. Int. J. Rock Mech. Min. Sci. 2016, 87, 85–89. [Google Scholar] [CrossRef]
  40. Franca, L.F.P. Drilling action of roller-cone bits: Modeling and experimental validation. J. Energy Resour. Technol. 2010, 132, 1–9. [Google Scholar] [CrossRef]
  41. Bingham, M.G. How rock properties are related to drilling. Oil Gas J. 1964, 62, 94–101. [Google Scholar]
  42. He, M.M.; Li, N.; Zhu, J.W.; Chen, Y.S. Advanced prediction for field strength parameters of rock using drilling operational data from impregnated diamond bit. J. Petrol. Sci. Eng. 2020, 187, 106847. [Google Scholar] [CrossRef]
  43. Wang, J.; He, M.M.; Yuan, Z.Y.; Luo, B.; Ma, X.D. Ductile-brittle failure transition of rocks in process of drilling with high confining pressure: Model and experiment. Geoenergy Sci. Eng. 2023, 223, 211505. [Google Scholar] [CrossRef]
  44. Kalantari, S.; Hashemolhosseini, H.; Baghbanan, A. Estimating rock strength parameters using drilling data. Int. J. Rock Mech. Min. Sci. 2018, 104, 45–52. [Google Scholar] [CrossRef]
  45. Mucha, K. Application of Rock Abrasiveness and Rock Abrasivity Test Methods-A Review. Sustainability 2023, 15, 11243. [Google Scholar] [CrossRef]
  46. Janc, B.; Jovičić, V.; Vukelić, Ž. Laboratory Test Methods for Assessing the Abrasivity of Rocks and Soils in Geotechnology and Mining Applications. Mater. Geoenviron. 2020, 67, 103–118. [Google Scholar] [CrossRef]
  47. Capik, M.; Yilmaz, A.O. Correlation between Cerchar abrasivity index, rock properties, and drill bit lifetime. Arab. J. Geosci. 2017, 10, 15. [Google Scholar] [CrossRef]
Figure 1. (a) Diamond core drill bit geometric model. (b) Finite element mesh model of rock.
Applsci 13 11389 g001
Figure 2. Borehole formation process under the action of the impregnated diamond bit. (a) 0.1 s (b) 0.2 s (c) 0.5 s (d) 1.0 s (e) 2.0 s (f) 3.0 s (g) 4.0 s (h) 5.0 s.
Applsci 13 11389 g002
Figure 3. Maximum and minimum principal stress cloud maps of rock during drilling.
Applsci 13 11389 g003
Figure 4. Thrust force and torque curves of rock acting on the bit during drilling.
Applsci 13 11389 g004
Figure 5. Curvature and torque curve at different drilling speeds during drilling. (a) Rotation speed is 50 rpm (b) Rotation speed is 100 rpm (c) Rotation speed is 200 rpm (d) Rotation speed is 300 rpm.
Applsci 13 11389 g005aApplsci 13 11389 g005b
Figure 6. Curve of thrust force, torque and drilling speed at different rotational speeds.
Applsci 13 11389 g006
Figure 7. Curves of thrust force and torque at different rotational speeds during drilling. (a) Drilling speed 0.5 mm/s (b) Drilling speed 1.0 mm/s (c) Drilling speed 1.5 mm/s (d) Drilling speed 2.0 mm/s.
Applsci 13 11389 g007aApplsci 13 11389 g007b
Figure 8. Thrust force, torque and rotational speed at different drilling speeds.
Applsci 13 11389 g008
Figure 9. Relationship between torque and thrust force during drilling.
Applsci 13 11389 g009
Figure 10. Finite element mesh model with different drill sizes. (a) 59# Drill bit (b) 75# Drill bit (c) 110# Drill bit.
Applsci 13 11389 g010
Figure 11. Drilling maximum principal stress cloud image of different size bits. (a) 59# Drill bit (b) 75# Drill bit (c) 110# Drill bit.
Applsci 13 11389 g011
Figure 12. Thrust force, torque and drilling speed for different bit sizes at 200 rpm.
Applsci 13 11389 g012
Figure 13. Curve of thrust force, torque and rotational speed for different bit sizes at a drilling rate of 2 mm/s.
Applsci 13 11389 g013
Figure 14. Curve of torque and thrust force on different drill sizes.
Applsci 13 11389 g014
Figure 15. Finite element mesh model with rock mass structure plane. (a) Structural surface inclination angle 45° (b) Structural surface inclination angle 90°.
Applsci 13 11389 g015
Figure 16. Maximum principal stress cloud image with rock mass structure plane. (a) Structural surface inclination angle 45° (b) Structural surface inclination angle 90°.
Applsci 13 11389 g016
Figure 17. Curve of thrust force, torque and thickness of the structural surface containing the rock mass structural plane. (a) Structural surface inclination angle 45° (b) Structural surface inclination angle 90°.
Applsci 13 11389 g017aApplsci 13 11389 g017b
Figure 18. Finite element mesh model of alternatively distributed soft and hard rock layers. (a) Soft at the top, hard at the bottom (b) Hard on top, soft on bottom.
Applsci 13 11389 g018
Figure 19. Curve of thrust force and torque in drilling of alternatively distributed soft and hard rock layers. (a) Soft at the top (Level III), hard at the bottom (Level II) (b) Soft at the top (Level IV), hard at the bottom (Level II) (c) Hard on top (Level II), soft on bottom (Level III) (d) Hard on top (Level II), soft on bottom (Level IV).
Applsci 13 11389 g019
Figure 20. Finite element mesh model of rock mass for having confining pressure.
Applsci 13 11389 g020
Figure 21. Curve of thrust force, torque and confining pressure of rock drilled under hydrostatic pressure. (a) Thrust force-Confining pressure (b) Torque-Confining pressure.
Applsci 13 11389 g021
Table 1. Physical and mechanical parameters of rock.
Density
ρ/(kg·m−3)
Deformation ModulusPoisson’s Ratio
c/MPa
Cohesion
c/MPa
Internal Friction AngleCompressive Strength
E/GPaφ/(°)Rc/MPa
2750330.22.16090
Disclaimer/Publisher’s Note: The statements, opinions and data contained in all publications are solely those of the individual author(s) and contributor(s) and not of MDPI and/or the editor(s). MDPI and/or the editor(s) disclaim responsibility for any injury to people or property resulting from any ideas, methods, instructions or products referred to in the content.

