Article

Direct Temperature Measurements of Cardiac Stent during MRI Examinations

by
Giuseppe Acri
1,*,
Francesco Campanella
2,
Giuseppe Vermiglio
3,
Carmelo Anfuso
4,
Barbara Testagrossa
1,
Daniela Cavallaro
4,
Domenica Urzì
4,
Antonio Sanzo
5,
Maria Antonietta D’Avanzo
2 and
Valentina Hartwig
6,*
1
Dipartimento di Scienze Biomediche, Odontoiatriche e Delle Immagini Morfologiche e Funzionali, Università Degli Studi di Messina, c/o A.O.U. Policlinico “G. Martino” Via Consolare Valeria, 98125 Messina, Italy
2
INAIL, Sezione di Supporto Tecnico al SSN in Materia di Radiazioni dell’INAIL, 00144 Rome, Italy
3
Medical Physicist (Freelance), 98122 Messina, Italy
4
IRCCS Centro Neurolesi Bonino-Pulejo, 98124 Messina, Italy
5
Fondazione IRCCS San Matteo, Arrhythmia and Electrophysiology Unit, 27100 Pavia, Italy
6
CNR, Institute of Clinical Physiology, 56124 Pisa, Italy
*
Authors to whom correspondence should be addressed.
Appl. Sci. 2023, 13(20), 11414; https://doi.org/10.3390/app132011414
Submission received: 8 September 2023 / Revised: 13 October 2023 / Accepted: 16 October 2023 / Published: 18 October 2023
(This article belongs to the Special Issue Electromagnetic Fields (EMF) Applications in Medicine)

Abstract

:
Nowadays, Magnetic Resonance Imaging (MRI) is considered the gold standard for imaging the brain, spinal cord, musculoskeletal system, head and neck, and complex congenital heart malformations; consequentially, the number of MRI scans in patients with implantable electronic devices has simultaneously increased. During the entire length of the MRI exam, patients are exposed to electromagnetic fields with different characteristics (static, low frequency, radiofrequency fields), which are related to different risks. The scarce available literature about MRI-induced heating on cardiac stents suggests that excessive temperature rise occurs only in unfavorable cases. Ideally, RF safety assessment could be performed during the anamnestic process, but this simulation process’s results are too slow to be performed before patient MRI examination. In this context, we developed a dedicated measurement set-up by focusing our target on the measurement of the heating of a cardiac stent during an MRI examination. Results for the temperature rise trend along the entire stent length during a clinical MRI protocol are shown together with the local Specific Absorption Rate (SAR) values and cumulative equivalent minutes at 43 °C (CEM43°C), in order to ensure the safety of patients with MR-conditional devices, also with a view to not inappropriately preclude their access to MRI scans. The obtained results show that the maximum temperature rise (4.12 °C) is within the limit of 5 °C stated in the stent manual for 15 min of continued scanning with the specific conditions. The maximum temperature rise was in correspondence with the stent tips and calculated SAR confirms the fact that two hotspots are present near the tips of the stent. Finally, the calculated CEM43°C remained well below the proposed threshold for muscle tissue.

1. Introduction

Magnetic Resonance Imaging (MRI) represents a diagnostic technique furnishing images of the human body without applying ionizing radiation [1]; for this reason, we can consider it a non-invasive diagnostic tool. But, this does not mean that MRI has no side effects. The major risks are related to (a) the static magnetic field, which can contribute to projectile effects; (b) the gradient magnetic field, which can cause current induction; and (c) the radio frequency (RF) field, used for nuclei excitation and interact with patient tissues causing heat [2,3,4]. In general, MRI staff are exposed to static magnetic field and, occasionally, to a radiofrequency field and time varying gradient fields [5], while patients during the MRI scan are exposed to all the three kind of magnetic fields [1].
The rate of RF deposition is well determined in terms of the Specific Absorption Ratio (SAR). Moreover, the accepted metric for thermal dose assessment that correlates well with thermal damage in a variety of tissues is cumulative equivalent minutes at 43 °C (CEM43°C). First proposed by Sapareto and Dewey [6], this metric quantifies thermal exposure in terms of the number of minutes of heating at 43 °C needed to obtain equivalent effects in biological tissues. CEM43°C thermal dose thresholds have been proposed as a potential guide for magnetic resonance radiofrequency exposure levels [7].
It is important to underline that MRI is now considered the gold standard for imaging the brain, spinal cord, musculoskeletal system, head and neck, and complex congenital heart malformations [8,9]; consequentially, the number of MRI scans in patients with implantable electronic devices has simultaneously increased [10]. Today, millions of patients have implanted devices. Initially, implantable medical devices were a firm contraindication for MRI [11], although advances in the technology have made sure that metallic implants such as mechanical heart valves, coronary stents, and sternal sutures are compatible with MRI because they are not ferromagnetic. On the other hand, these devices are electrically conducting structures that may interact with the electromagnetic fields (RF) of the scanner. They can concentrate the RF power, potentially causing high-power depositions in the vicinity of these objects. Severe MRI-related RF heating of electrically conducting structures and associated risks have been shown for interventional guide wires [12], implanted electrodes for deep brain stimulators [13] and cardiac pacemaker leads [14].
The European Medical Device Regulation [15] identifies that electromagnetic immunity is an essential requirement for both non-implantable and implantable medical devices. Manufacturers follow harmonized standards (not mandatory) to obtain the presumption of conformity [16]. Technical specifications for passive implanted medical devices and for active ones are available, ASTM F2182 and ISO/TS 10974, respectively [17,18]. From the above tests, an implantable device can obtain a label stating it is MRI safe, MRI conditional or MRI unsafe. Cardiac stents are labelled as MRI Conditional and limitations are placed during MRI scans (e.g., RF power). The RF field used during MRI examination can induce currents and these induced currents cause charge accumulation, creating areas where the temperature is drastically increased, causing tissue burns and damages [12]. Precise in vivo measurements of MRI-related heating are hard to achieve with any technique currently available.
Usually, these kinds of tests are conducted on phantoms during periodic quality controls procedures [19,20] to ensure patients’ safety and maintain acceptable diagnostic equipment performances [21].
Up to now, not too many studies were published about the specific analysis of the temperature changes and SAR on a cardiac stent during MRI examination [22,23,24,25,26]. One of these examined RF heating effects of stents in a 7 Tesla MRI scanner was observed using electromagnetic field simulations and phantoms with properties that mimic myocardium [22]. The authors then validated the simulation results with experimental RF heating paradigm using fiber optic probes and MR thermometry on an agarose phantom containing coronary stents. In this case, a single-pulse experiment, exceeding the regulatory limits, was performed using a set up very different to standard clinical cardiac MRI protocols.
In another similar study [23], RF-induced heating of coronary stents at 7.0 T is examined using electromagnetic field simulations. For the assessment of RF-induced temperature changes, RF heating experiments are executed using fiber optics and MR thermometry for 2D temperature mapping. Even in this study, this was not used as a standard clinical protocol in the experimental test.
Heating of a metallic coronary stent in MR was studied theoretically and experimentally also in [24]. In this study, the stent was modelled as a tubular flow heater to calculate the time-dependent temperature during an MRI examination. The model was tested experimentally by performing laboratory magnetic resonance heating in a standard 4.7 T vertical-bore NMR spectrometer. Once again, the exposure paradigm was far away from the clinical standard procedure. Interestingly, the time-dependent stent’s temperature was evaluated at different RF irradiation power levels.
Bassen et al. [25] performed experiments and computer modeling of heating of a cardiovascular stent by RF fields in a 1.5 T MRI birdcage coil fed by a quadrature power divider to allow the coil to produce circularly polarized B1 fields. The local (point) SAR was calculated from the initial linear temperature rise. However, again, the exposure conditions were very different to a clinical cardiac MRI examination paradigm.
RF-induced heating on cardiac stents has been evaluated also in vivo and post-mortem on pigs [26] during MRI in a 3T scanner using a sequence with a console SAR of approximately 5.5 W/kg, achieved by overriding the system SAR monitor, to test the hypothesis that the in vivo condition significantly reduces the RF-induced temperature rise near a medical device.
All of the above studies differed in terms of exposure conditions, and none of them used a standard clinical protocol typical of a comprehensive cardiac MRI examination.
In this context, we developed a dedicated measurement set-up by focusing our target on the direct measurement of the heating of a cardiac stent during an MRI examination, using a cardiac standard protocol. The main object of our study was to assess the temperature rise in exposure conditions as close as possible to reality. Starting from temperature measurements in three different points, maximum temperature change, local SAR, and thermal dose CEM43°C are calculated along the one-dimensional size of the stent.

2. Materials and Methods

2.1. Temperature Measurements

A commercial platinum–chromium metal cardiac stent, the SynergyTM XD Monorail (Boston Scientific, Marlborough, MA, USA) with a length of 24 mm and a diameter of 2.5 mm, was used during the experiments. The measurements were performed using a phantom consisting of an empty box (18.0 cm × 28.5 cm × 18.0 cm) and made in Polymetilmetacrilate (PMMA) material. The PMMA box was filled with nongelled saline solution for 4 cm in height. The stent was placed on a polystyrene cube (1 cm side). The temperature measurements were conducted using the M3300 fluorptic thermometer (Luxtron Corporation, Santa Clara, CA, USA). The device uses 4 channels coupled with fiber optic probes. The measurement temperature range of the probes is 0 °C–120 °C with an accuracy of ±0.2 °C. The M3300 probes are entirely nonmetallic in construction and are only 0.5 mm in diameter. The M3300 device was connected to a PC by a RS-232 serial port in order to store the acquired data. The four probes, named CH1, CH2, CH3 and CH4, were positioned in the box: CH1 far from the stent, to monitor the temperature of the environment surrounding the stent; on the tips of the stent (CH2 and CH4); and in the center of the stent (CH3), respectively, as illustrated in Figure 1.
Three different measurements were performed, in three different days to test the ability of the method to generate similar results for multiple experiments. This step was essential to understand the reliability of probes to detect the temporal and spatial patterns of temperature measurements. Before starting them, the box filled with saline solution and the stent were positioned inside the magnetic room for two hours to allow the system to reach thermal equilibrium.

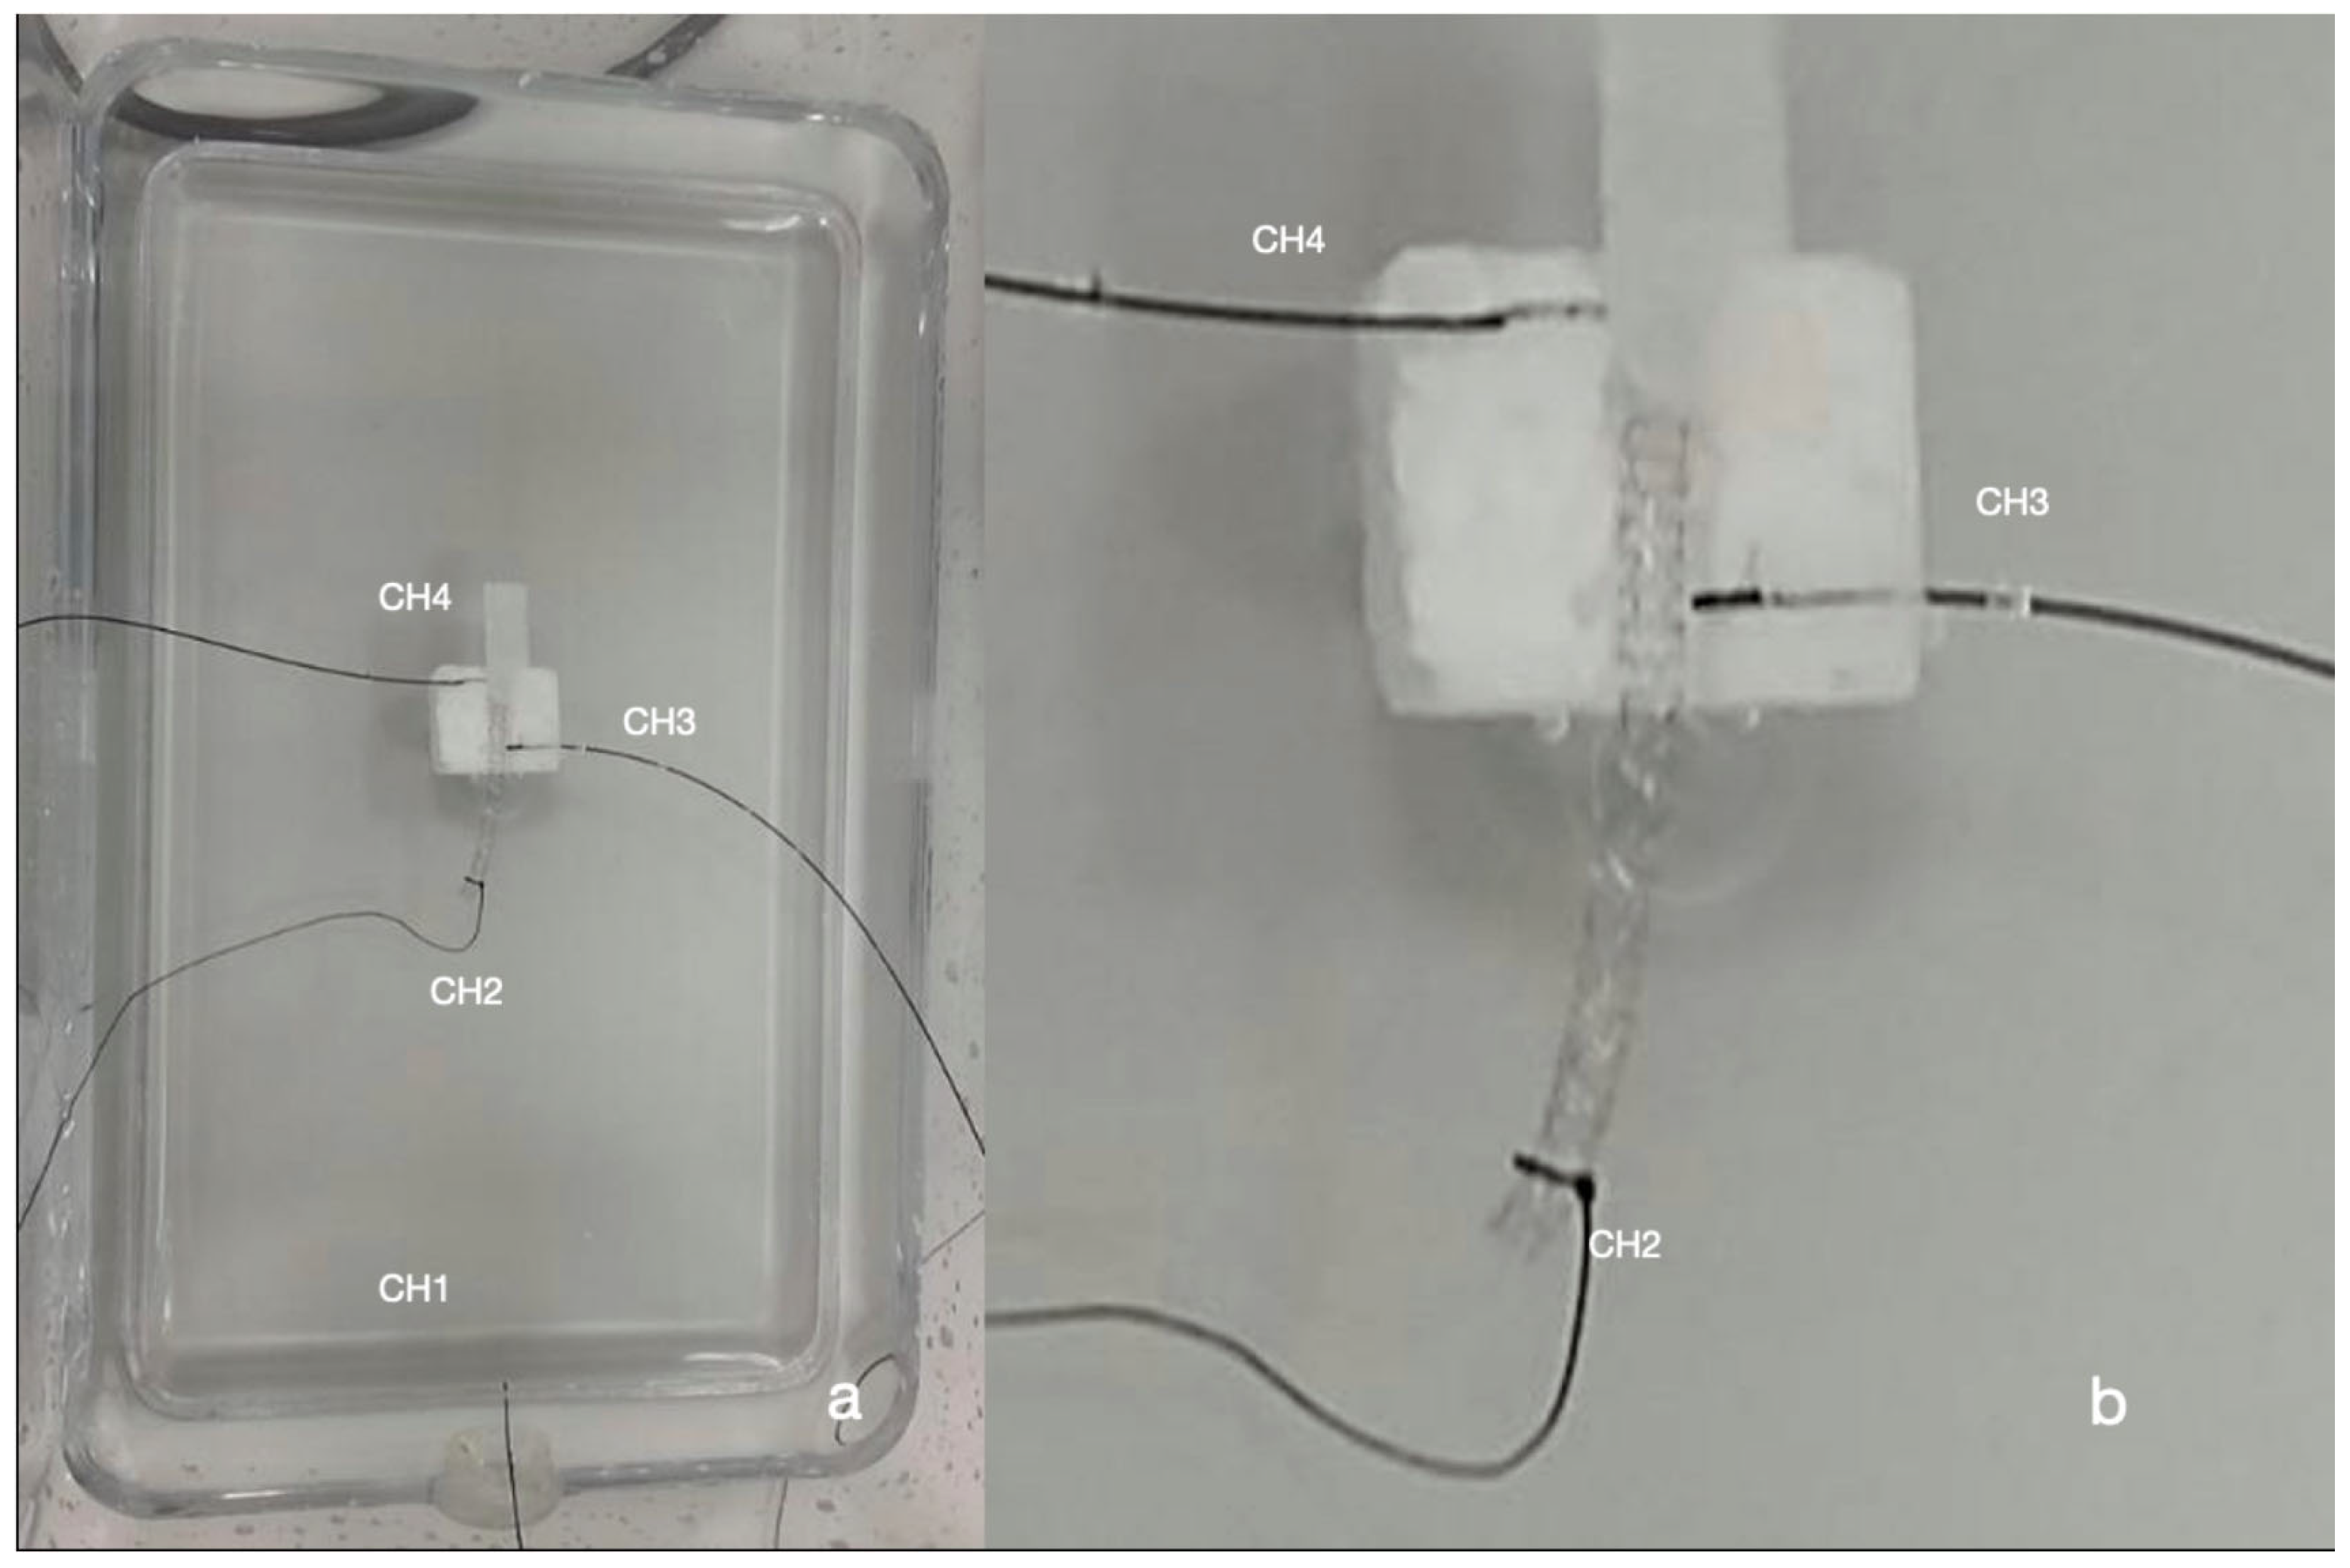
2.2. Exposure System

All MRI measurements were performed on a 3.0 T scanner (Philips Achieva, New Bedford, MA, USA).
The system body coil was used as transmit and receipt coil. A clinical protocol (Scan protocol: HEARTH) was performed for a scan total length of 715 s. Table 1 shows the sequences included in the protocol, with the specific parameters.
The total body SAR indicated for the specific protocol was 0.2 W/kg for a chosen phantom weight of 11 kg.
The temperature and humidity of the MR scan room were controlled and maintained at (22.0 ± 0.5) °C and 46%, respectively.

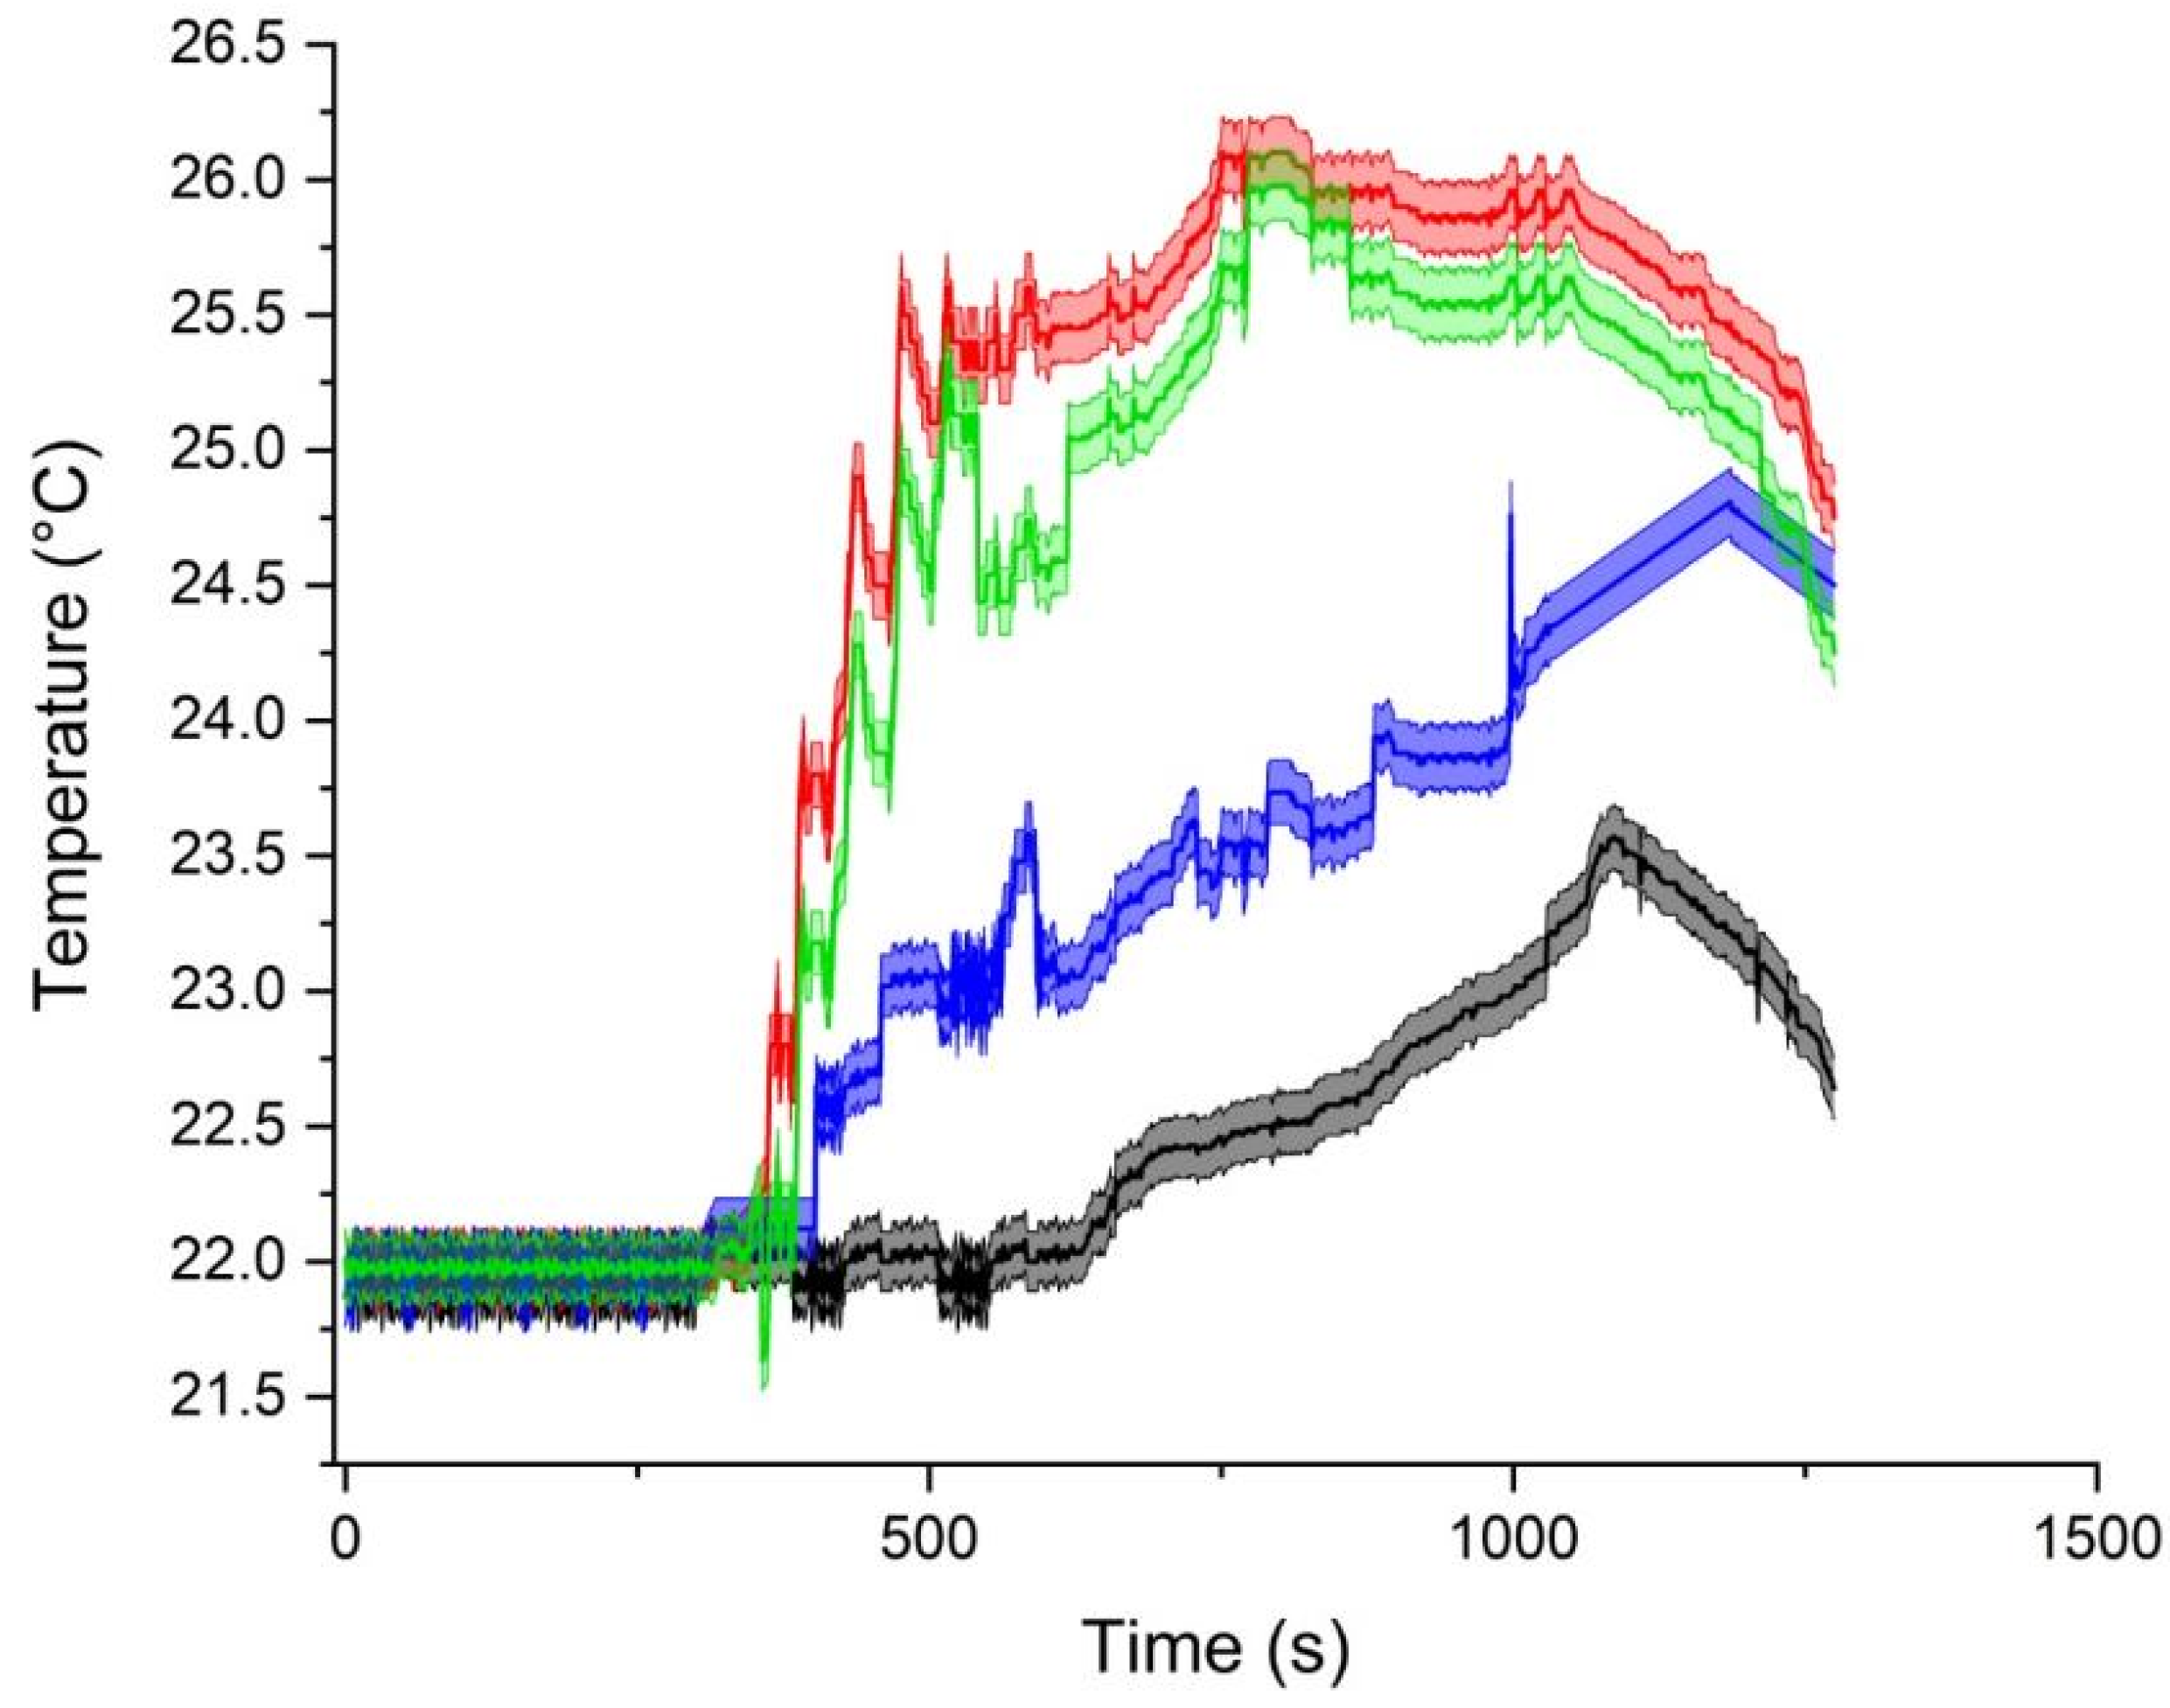
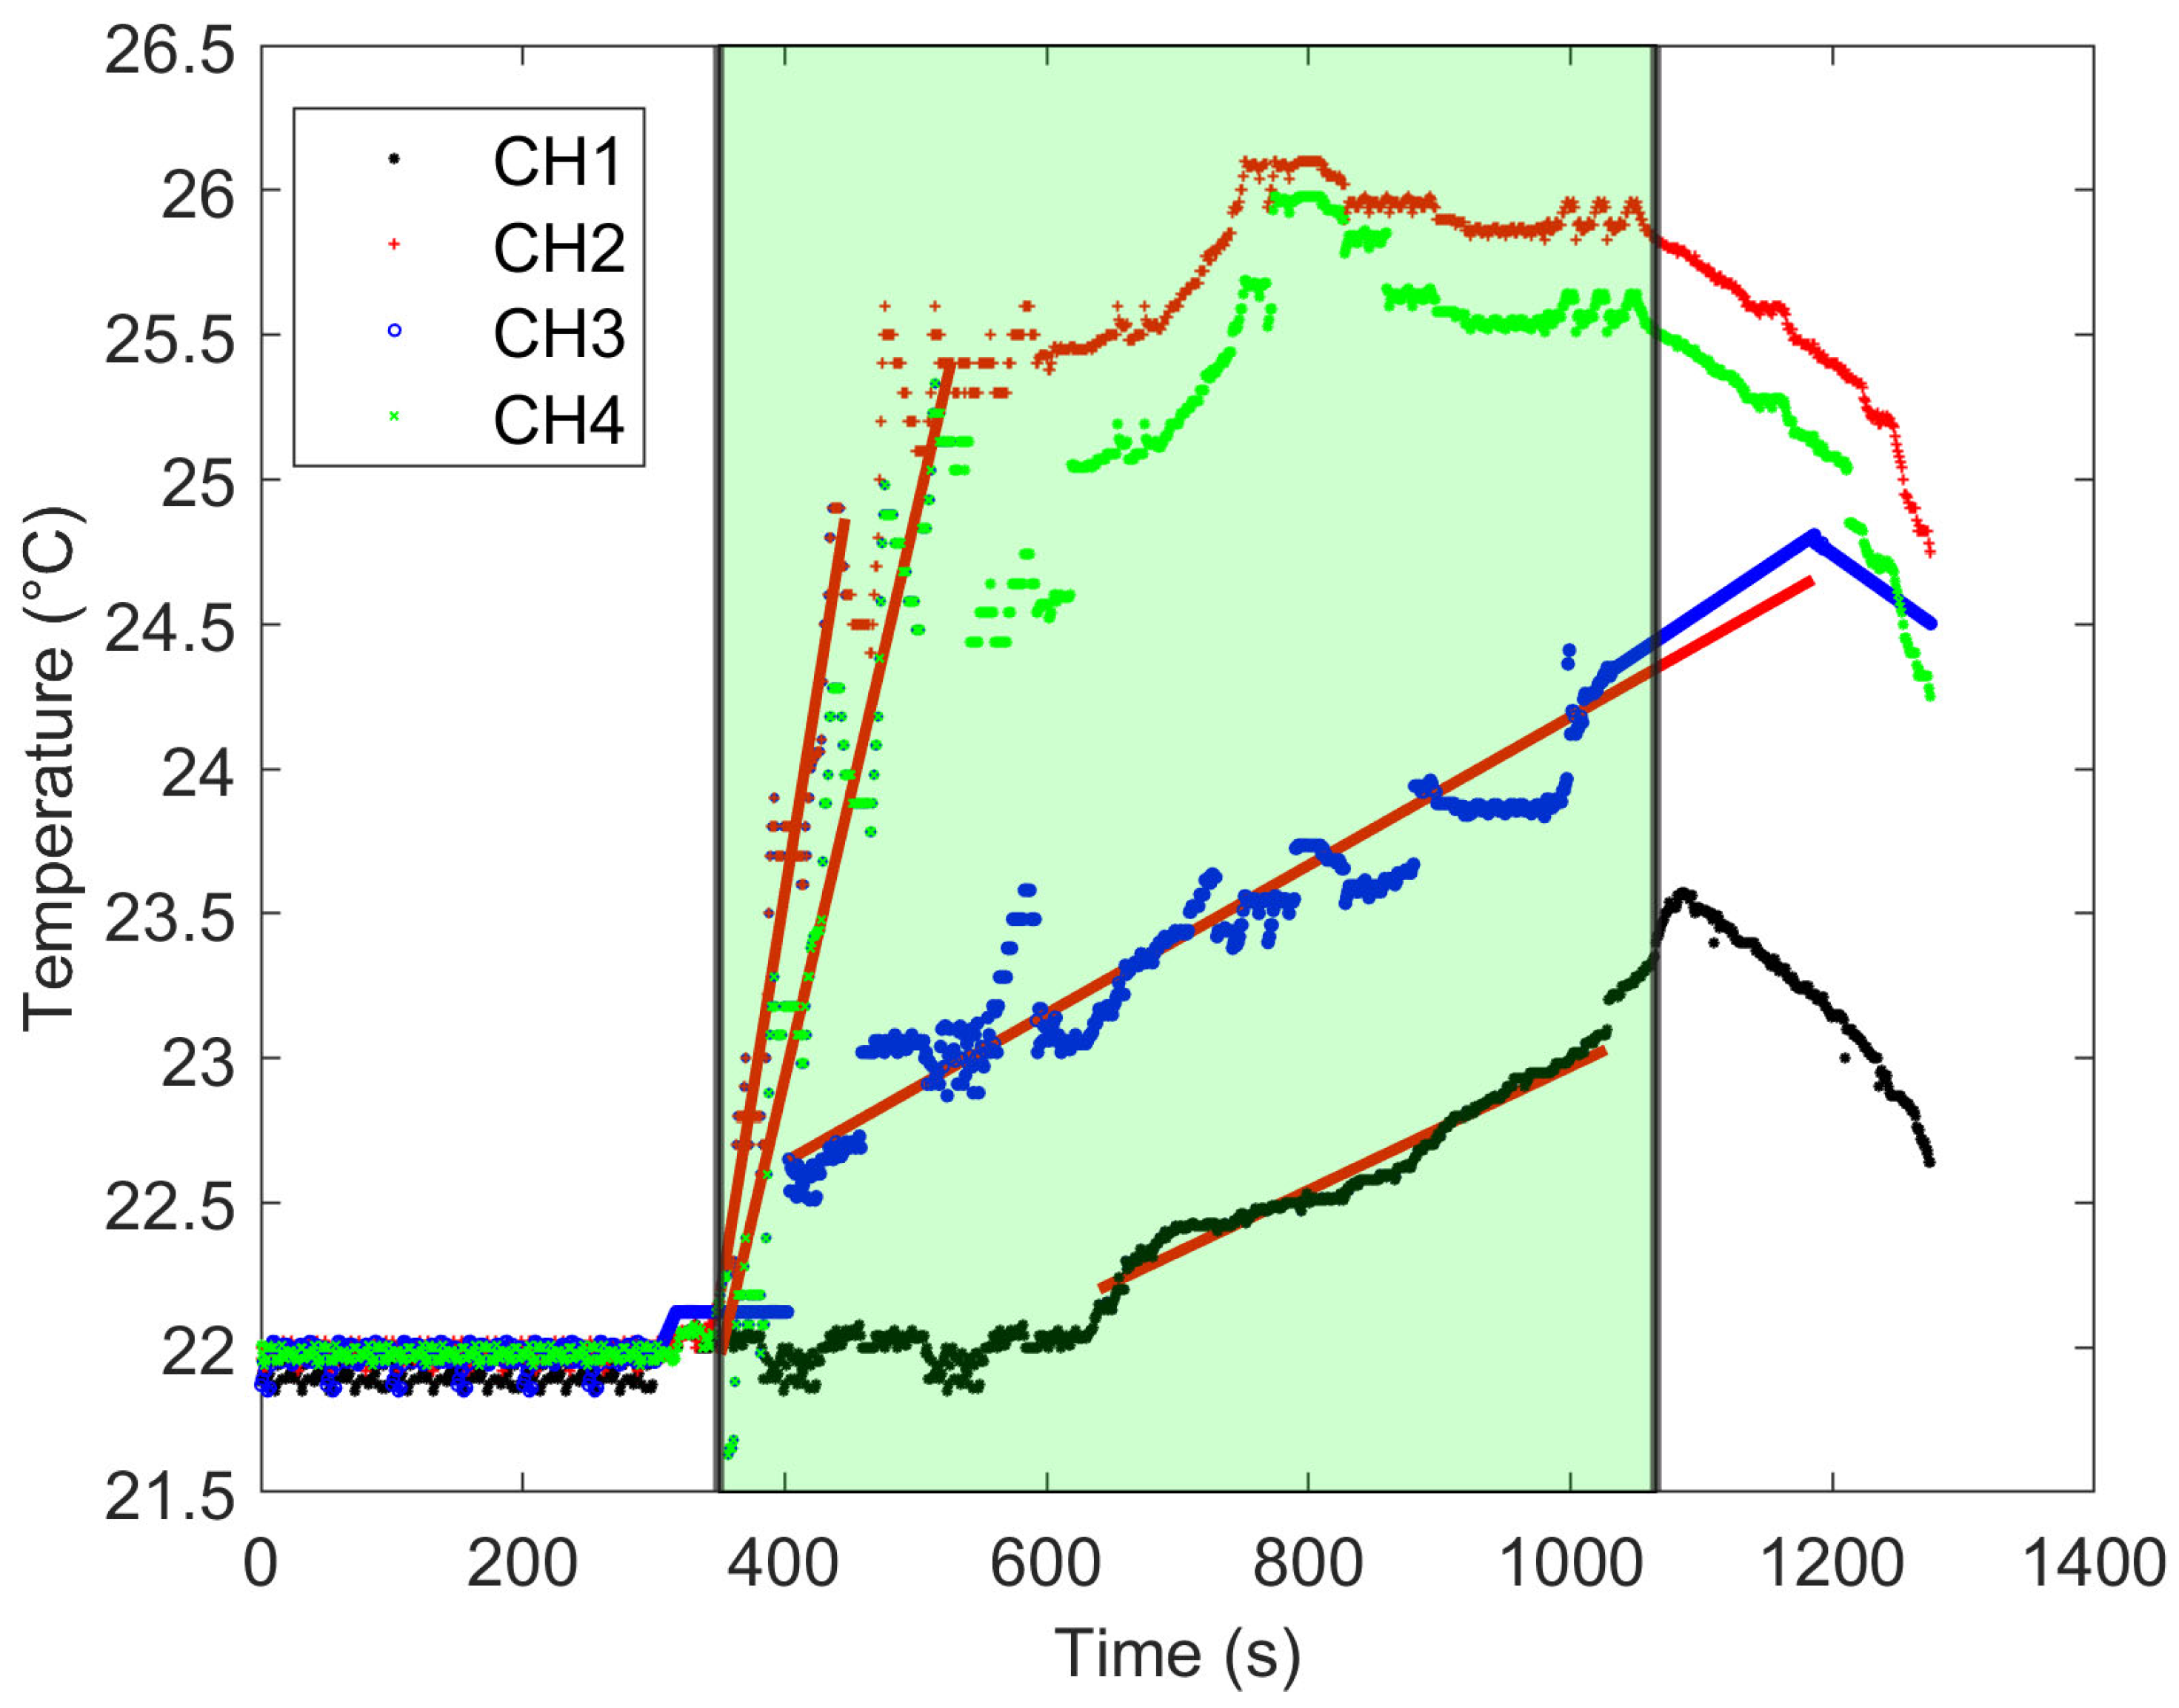
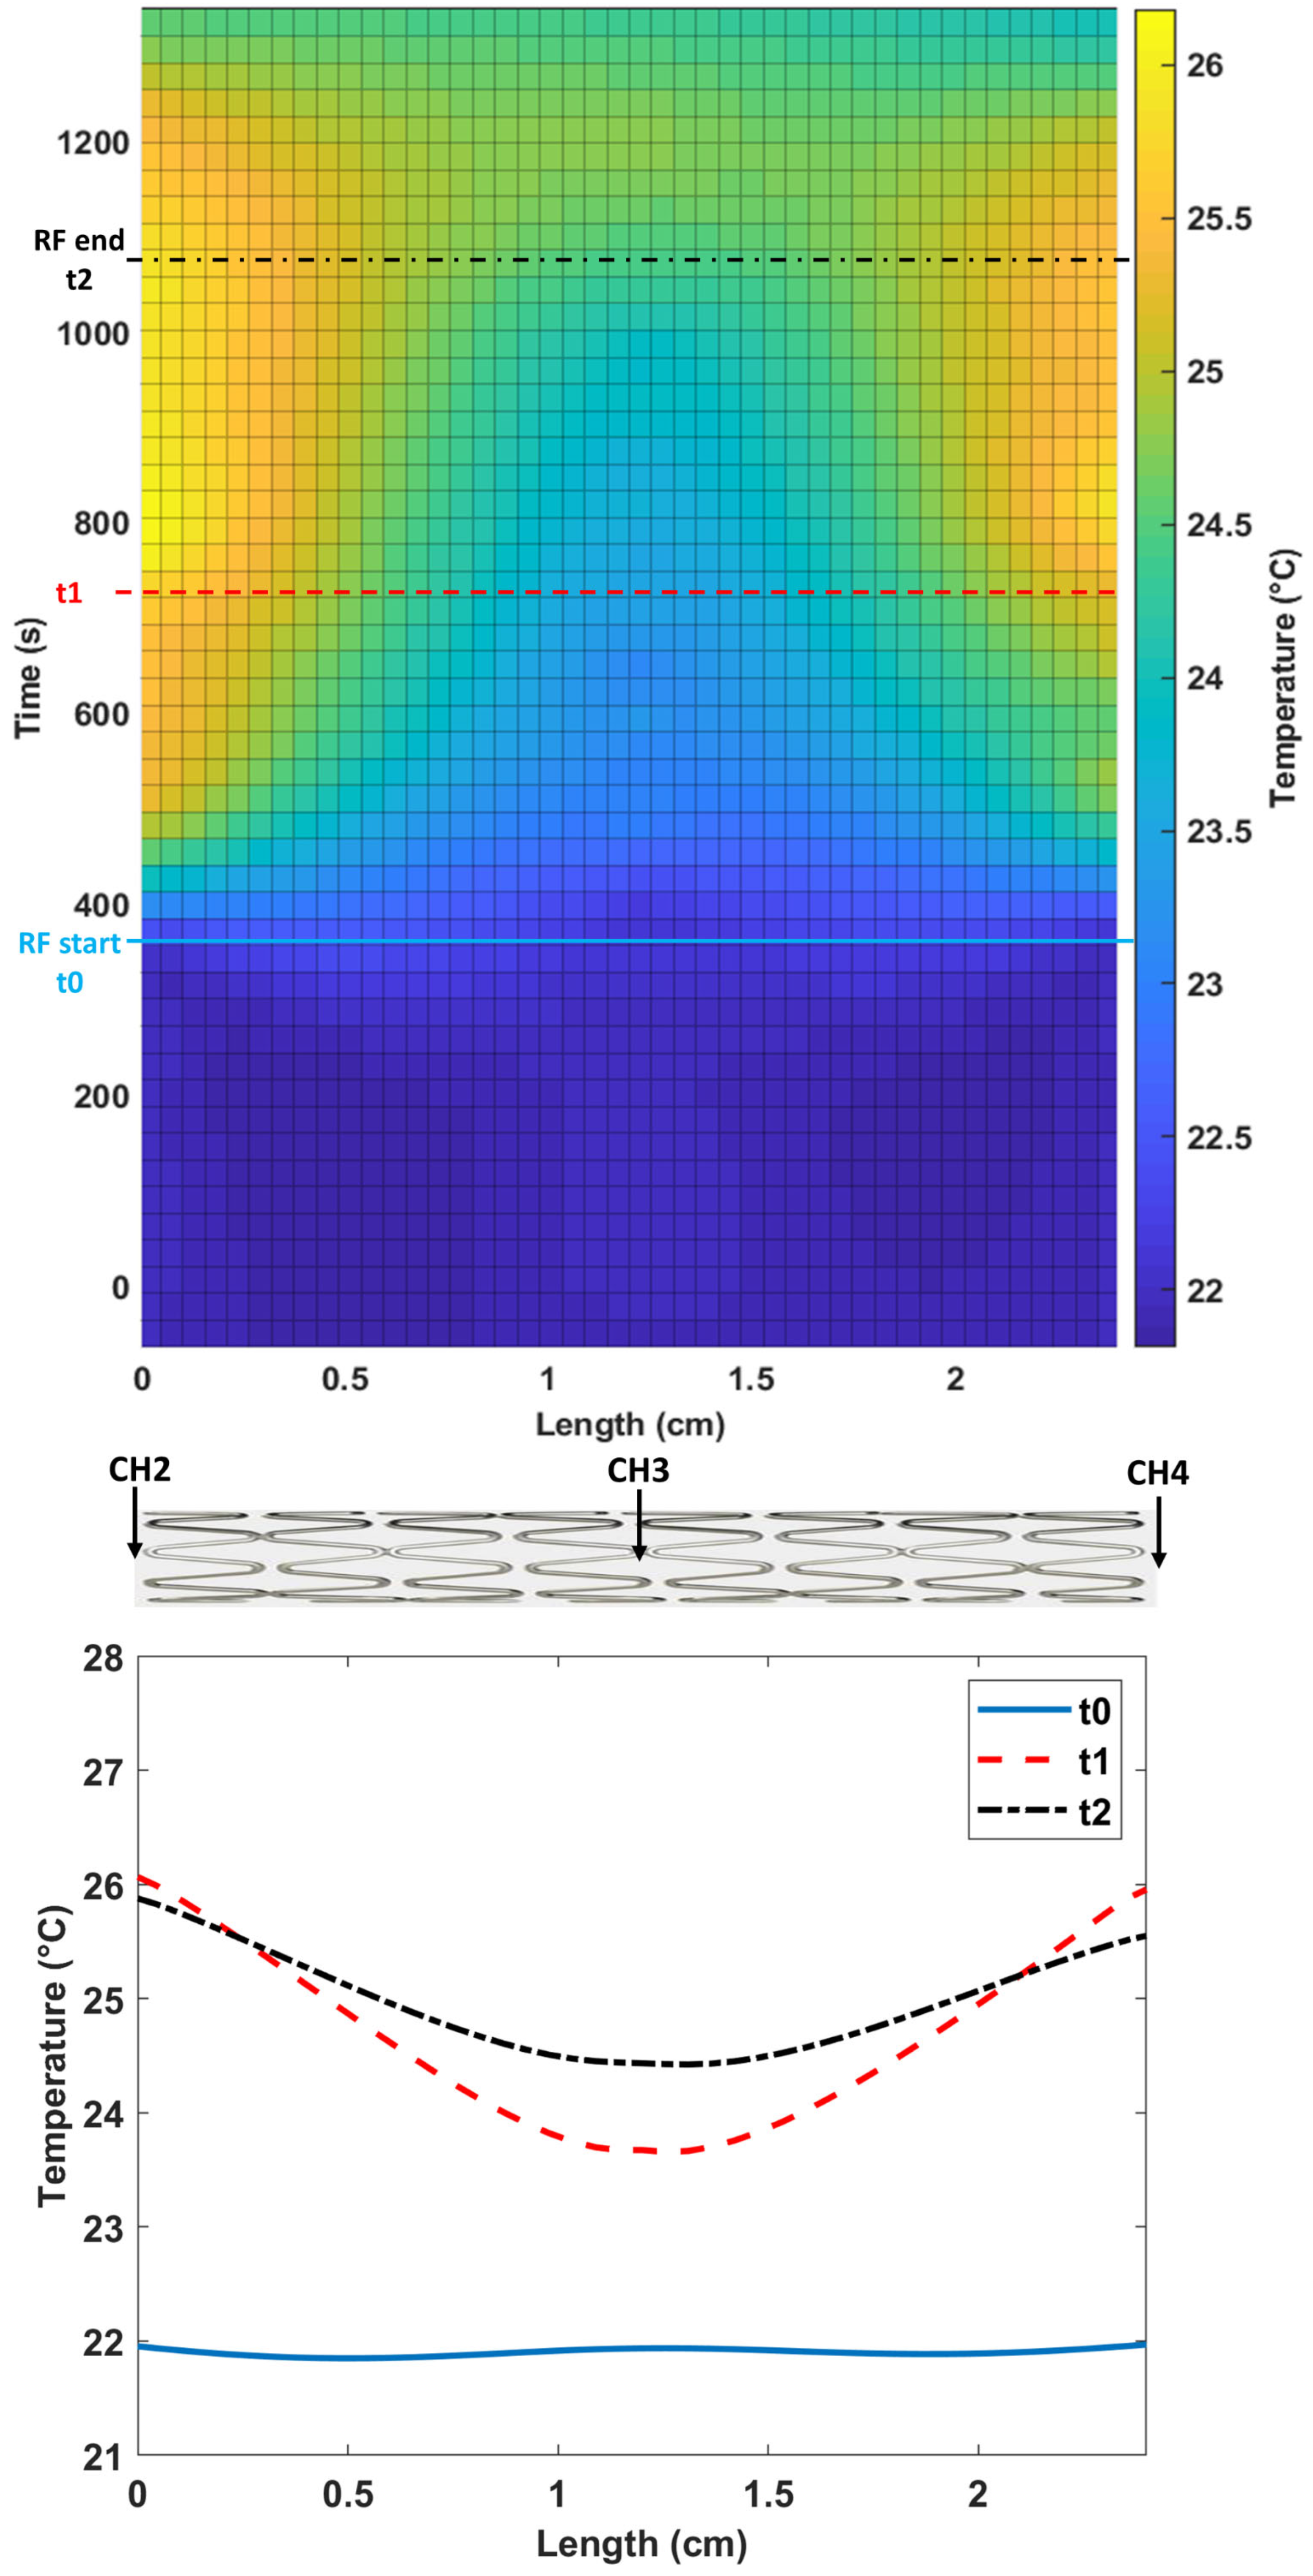
2.3. Temperature Data Analysis and SAR Computation

The SAR can be expressed as follows:
S A R = σ E 2 t 2 ρ
where σ is the electrical conductivity and ρ is the mass density of the considered tissue; the angle brackets represent the temporal averaging and E is the induced electric field.
The possible tissue hazard is related to power deposition and its temperature increasing. In vivo conditions, changing in tissue temperature is balanced of heat diffusion, perfusion cooling, metabolic heat and external heat, represented by SAR. Tissue parameters can vary by orders of magnitude among tissue types [27]. In case the heat loss due to thermal diffusion, heat radiation, or thermoregulation (blood flow, sweating, etc.) is absent or not significant, the temperature rise dT/dt is directly related to SAR as follows:
c d T d t = S A R
where c is the heat capacity.
According to Equation (2), local SAR at the chosen locations was calculated by multiplying the initial slope of the temperature rise with the specific heat capacity of the phantom material. For our phantom, the heat capacity was considered close to that of water, 4184 J/kg °C [17]. To avoid errors in the SAR estimation, we selected the initial linear portion of the temperature rise, choosing as the starting point the first temperature increment step (>0.2 °C) and using the number of samples that maximized the R coefficient of the regression model (Pearson coefficient) [28]. The SAR estimation was considered reliable if R > 0.95. Each sample represented the average of three temperature measurements.
We also reported the difference between the baseline and the highest temperature reached during the test for each probe (dTmax (°C)).
Using a thin-plate smoothing spline interpolation [29], we reconstructed the temperature trend along the entire length of the stent.
Since the thermal damage to tissue depends not only on the temperature rise but also on tissue sensitivity and exposure time, cumulative equivalent minutes can be used as a metric for thermal dose assessment [7]. To calculate this parameter, we converted our temperature vs. time trends to an equivalent number of minutes of heating at 43 °C (CEM43°C), according to this equation:
CEM 43 ° C = i = 1 n t i R ( 43 T i )
where ti is the i-th time interval, R is a constant equal to 0.25 for T < 43 °C and 0.5 for T > 43 °C, and Ti is the average temperature during the ti interval.
We assumed that the temperatures at the interface between tissue and device were similar. Also, the initial value of temperature (22 °C) was scaled to 37 °C (assuming normal human body temperature).

3. Results

Figure 2 shows the average temperature trend during MRI examination and standard deviation (indicated as gradient color).
Figure 3 shows the temperature trend for each probe during the entire MRI protocol described in Table 1. The colored box indicates the RF exposure length. Each temperature-versus-time curve was characterized by an initial base value (no RF exposure) of 22 °C ± 0.2 °C for a period of 350 s, followed by 715 s of exposure (temperature rise) and a 210 s cooling phase (temperature fall). The linear regression used for SAR calculation is also shown for each channel. In Table 2, the resulting SAR values together with R Pearson’s coefficient, dTmax, and CEM43°C are shown for each probe. CH2 and CH4 were located at the tips of the stent and, for this reason, have similar trends. CH3 was located at the center of the stent. CH1 is relative to the probe located in the phantom, away from the stent location: this trend reflects the heating of the material surrounding the implant.
Figure 4 shows the reconstruction of the stent temperature during the test along the stent length (0–2.4 cm). The horizontal lines show the start, the middle, and the end of the RF exposure. Below is also shown the 1D plot of the temperature along the stent length at different exposure times.
As expected, the maximum temperature changes during the RF exposure occur at the tips of the stent, while in the center of the stent, the temperature reaches a lower value and has a smoother trend.

4. Discussion

Patients with a medical implant can be excluded for an MRI examination because of the many safety concerns that exist when introducing metal inside the MRI room [30,31].
Short and compact passive metal implants, such as cardiac stent, do not appear to pose substantial contraindications for MRI, since only minor temperature changes have been reported and no cases of serious injuries have never been reported for this kind of implant. However, implant manufacturers have to test and label each device according to the standards: the evaluation of the device in terms of heating is particularly challenging due to the many factors that may impact the RF-related temperature increase (the type and the physical properties of the implant, its positioning inside the body and respect to the RF coil, the RF frequency generated by the MRI system and the type of RF coil used).
Generally, the RF safety assessment of implants is performed using simplified scenarios because the full analysis is computationally too time-consuming. Moreover, actual MR thermometry technique is not suitable to obtain information about RF heating pattern on the stent surface, due to the MR artifacts induced by the stent [23].
In this study, we have adopted a simplified state, leading to conservative results to ensure safety, and using RF exposure conditions matching a real MR cardiac exam. In this way, the obtained results are not relative to only one specific sequence but give indications regarding the temperature rise due to the entire standard clinical protocol.
The obtained results show that the maximum temperature rise (4.12 °C) is within the limit of 5 °C stated in the manual for 15 min of continued scanning with the specific conditions (MR conditional: static magnetic field of 3.0 and 1.5 T only, maximum whole-body SAR of <2 W/kg, maximum spatial gradient magnetic field of 23 T/m). As expected, the maximum temperature rise was in correspondence of the stent tips [23,32]. Calculated SAR confirms the fact that two hotspots are present near the tips of the stent.
Since the stent has a length shorter than λ/4π of the RF wavelength in tissues, we can use the local SAR at the tip of the device as surrogate metric for worst-case heating [32].
Regarding thermal dose assessment, for muscle tissue, CEM43°C > 80 min has been reported to cause chronic damage, whereas 41 < CEM43°C < 80 min was associated with acute but minor damages [7]. As can be observed in our study, CEM43°C remained well below 40. CEM43°C has a physical meaning when it is evaluated in the tissue: as an approximation, our calculation was based on the temperature measured on the stent assuming the temperature at the interface of the metal and tissue to be similar.
From the literature, different studies were conducted on the stent during MRI examinations. The comparison with our study is not simple because of the different setup used, in particular, the strength of static magnetic field of the scanners, the exposure parameters and the different stents used. However, although numerical results cannot be compared, the trend of temperature increase (over time and along the entire length of the stent), is consistent with that found in both simulation and experimental literature studies.
For example, in [23], the authors conducted experiments on RF heating induced by a coronary stent using a 7 T scanner. They found a maximum temperature increase of about 3 °C. This result cannot be directly compared with our results for temperature rise, due to the very different exposure conditions.
In [26], the authors measured the RF heating of a stents implanted on pigs and their results showed an average temperature rise of 2.4 °C in vivo and 2.7 °C postmortem near the distal end of the stent. In this case, the a 3T MRI scanner was used with an exposure time of 10 min, so the exposure conditions were similar to those used in our study. The temperature rise found in the postmortem test was comparable to that found in our study.
In [24], the authors investigated the heating of a coronary stent during an MRI examination (4.7 T and 200 MHz of proton resonance frequency). The experimental data were used for theoretical computation and the results, in the normal situation of a fully open stent, showed an increase in stent temperature of less of 1 °C. They also concluded that there is a risk of hazardous heating when the stent in the vessel partially reoccluded. The experimental results presented were valid for the particular geometrical parameters (length and diameter) and material of the stent, the exposure system and the average RF irradiation power. Despite the different test conditions with respect to our study, we found a very similar temperature trend.
In [33], the authors showed the cooling effect of the flow on RF-induced heating of a vascular stent. The temperature rise was less than 4 °C. Our results show a 1D temperature rise trend on the stent length very similar to that it is possible to obtain from the simulated 2D map of temperature rise on stent.
In [32], a numerical model of an RF birdcage body coil and an anatomically realistic virtual patient were used to simulate the in vivo electric field at 64 MHz (1.5 T MRI system). The results showed that peak SAR values in blood vessels were up to ten times higher than those found in the ASTM standard gel phantom. Peaks were found in the anatomical locations, where stents are usually implanted.
The above results indicate that the blood flow has a significant cooling effect that reduces the overall temperature rise of a vascular stent due to RF emission during the MR exam. On the other hand, the scenario changes in the event of partial reocclusion of the stent. In particular, the increase in temperature due to RF may enable protein coagulation and the formation of blood clots in stent surrounding (near the stent tips).

Limitations of This Study

The major limitation of this study is the material used for the phantom that is nongelled and hence it is not compliant with the specific indicated in the ASTM F2182 standard. Following the ACR magnetic resonance accreditation phantom [34] and other ones used during quality controls [35,36,37], we have filled the phantom with saline solution. In general, saline phantoms are easy and safe to handle, but they are influenced by vibrational effects. Some studies in literature have demonstrated that the measurement of the MRI-induced temperature changes is influenced by thermal convection but, if the phantom material has a sufficient viscosity, thermal transport does not influence the measurements. In case of nongelled phantom, such as our phantom, the measured temperature rise may underestimate that which would occur in vivo [38]. On the other hand, in vivo conditions are parameters (i.e., blood flow and perfusion) outside the scope of the standard test method that significantly lessen the RF-induced temperature rise near a medical device [26].
Anyway, the temperature rise measured in our study for each probe has a trend very similar to that obtained using standard phantom [38].
Another limitation of our study is relative to the position of the stent in the phantom: since superficial tissue have higher exposure compared to deep tissues, the position of the device plays a very important role in modelling for safety evaluation [33]. In our study, testing is performed with the stent placed in the center of the phantom and in correspondence of the center of the RF coil that is not the worst-case scenario.
An electromagnetic or thermal simulation approach, as well as an analytical mode, would validate our findings. On the other hand, some previous literature studies used RF heating experiments, very similar to those of the set-up described here, to validate an analytical or computational evaluation and, in most cases, the theoretical and experimental results were very similar [22,23,24,25]. Since the approach described here is based on a standard, well-known and validated method, our findings are consistent.

5. Conclusions

The scarce available literature about MRI-induced heating on cardiac stents suggests that excessive temperature rise occurs only in unfavorable cases. Nevertheless, such cases are possible. Accurate numerical simulations are the key to implant safety.
Ideally, RF safety assessment could be performed during an anamnestic process, but this simulation process’s results are too slow to be performed before patient MRI examination.
This study can help better understand how the distribution of temperature rise occurs during a real protocol used during clinical practice, along a cardiac “MR conditional” stent. This can be useful to ensuring safety of patients with MR-conditional devices also with a view to not inappropriately preclude their access to MRI scans.

Author Contributions

Conceptualization, G.A. and G.V.; methodology, G.A., G.V. and V.H.; software, V.H.; validation, F.C., M.A.D. and A.S.; formal analysis, B.T. and V.H.; investigation, G.A., C.A., D.C. and D.U.; data curation, V.H. and B.T.; writing—original draft preparation, G.A. and V.H.; writing—review and editing, G.A., V.H. and F.C.; supervision, G.V.; funding acquisition, G.A. and V.H. All authors have read and agreed to the published version of the manuscript.

Funding

The APC was funded by the BRiC INAIL 2022—ID 55 project.

Institutional Review Board Statement

Not applicable.

Informed Consent Statement

Not applicable.

Data Availability Statement

The data presented in this study are available in article.

Conflicts of Interest

The authors declare no conflict of interest.

References

  1. McRobbie, D.W. Essentials of MRI Safety; Wiley-Blackwell: Hoboken, NJ, USA, 2020; ISBN 9781119557173. [Google Scholar]
  2. Acri, G.; Testagrossa, B.; Vermiglio, G. Personal time-varying magnetic fields evaluation during activities in MRI sites. IFMBE Proc. 2015, 51, 741–744. [Google Scholar] [CrossRef]
  3. Maralani, P.J.; Schieda, N.; Hecht, E.M.; Litt, H.; Hindman, N.; Heyn, C.; Davenport, M.S.; Zaharchuk, G.; Hess, C.P.; Weinreb, J. MRI safety and devices: An update and expert consensus. J. Magn. Reson. Imaging 2019, 51, 657–674. [Google Scholar] [CrossRef] [PubMed]
  4. Acri, G.; Inferrera, P.; Denaro, L.; Sansotta, C.; Ruello, E.; Anfuso, C.; Salmeri, F.M.; Garreffa, G.; Vermiglio, G.; Testagrossa, B. dB/dt Evaluation in MRI Sites: Is ICNIRP Threshold Limit (for Workers) Exceeded? Int. J. Environ. Res. Public Health 2018, 15, 1298. [Google Scholar] [CrossRef] [PubMed]
  5. Hartwig, V.; Sansotta, C.; Morelli, M.S.; Testagrossa, B.; Acri, G. Occupational Exposure Assessment of the Static Magnetic Field Generated by Nuclear Magnetic Resonance Spectroscopy: A Case Study. Int. J. Environ. Res. Public Health 2022, 19, 7674. [Google Scholar] [CrossRef]
  6. Sapareto, S.A.; Dewey, W.C. Thermal dose determination in cancer therapy. Int. J. Radiat. Oncol. Biol. Phys. 1984, 10, 787–800. [Google Scholar] [CrossRef] [PubMed]
  7. van Rhoon, G.C.; Samaras, T.; Yarmolenko, P.S.; Dewhirst, M.W.; Neufeld, E.; Kuster, N. CEM43°C thermal dose thresholds: A potential guide for magnetic resonance radiofrequency exposure levels? Eur. Radiol. 2013, 23, 2215–2227. [Google Scholar] [CrossRef]
  8. Baikoussis, N.G.; Apostolakis, E.; Papakonstantinou, N.A.; Sarantitis, I.; Dougenis, D. Safety of Magnetic Resonance Imaging in Patients With Implanted Cardiac Prostheses and Metallic Cardiovascular Electronic Devices. Ann. Thorac. Surg. 2011, 91, 2006–2011. [Google Scholar] [CrossRef]
  9. Marcu, C.B.; Beek, A.M.; van Rossum, A.C. Clinical applications of cardiovascular magnetic resonance imaging. CMAJ Can. Med. Assoc. J. 2006, 175, 911–917. [Google Scholar] [CrossRef]
  10. Roguin, A.; Schwitter, J.; Vahlhaus, C.; Lombardi, M.; Brugada, J.; Vardas, P.; Auricchio, A.; Priori, S.; Sommer, T. Magnetic resonance imaging in individuals with cardiovascular implantable electronic devices. Europace 2008, 10, 336–346. [Google Scholar] [CrossRef]
  11. Pieri, C.; Bhuva, A.; Moralee, R.; Abiodun, A.; Gopalan, D.; Roditi, G.H.; Moon, J.C.; Manisty, C. Access to MRI for patients with cardiac pacemakers and implantable cardioverter defibrillators. Open Heart 2021, 8, e001598. [Google Scholar] [CrossRef]
  12. Nitz, W.R.; Oppelt, A.; Renz, W.; Manke, C.; Lenhart, M.; Link, J. On the heating of linear conductive structures as guide wires and catheters in interventional MRI. J. Magn. Reson. Imaging 2001, 13, 105–114. [Google Scholar] [CrossRef] [PubMed]
  13. Henderson, J.M.; Tkach, J.; Phillips, M.; Baker, K.; Shellock, F.G.; Rezai, A.R. Permanent Neurological Deficit Related to Magnetic Resonance Imaging in a Patient with Implanted Deep Brain Stimulation Electrodes for Parkinson’s Disease: Case Report. Neurosurgery 2005, 57, E1063. [Google Scholar] [CrossRef] [PubMed]
  14. Aissani, S.; Laistler, E.; Felblinger, J. MR safety assessment of active implantable medical devices. Radiologe 2019, 59, 40–45. [Google Scholar] [CrossRef] [PubMed]
  15. Regulation 2017/745 of the European Parliament of the Council of 5 April 2017 on Medical Devices, Amending Directive 2001/83/EC, Regulation EC n. 178/2002 and Regulation EC n. 1223/2009 and Repealing Council Directives 90/385/EEC and 93/42/EEC. Available online: https://eur-lex.europa.eu/legal-content/EN/TXT/PDF/?uri=CELEX:32017R0745 (accessed on 9 September 2022).
  16. Mattei, E.; Censi, F.; Calcagnini, G.; Falsaperla, R. Workers with Cardiac AIMD Exposed to EMF: Methods and Case Studies for Risk Analysis in the Framework of the European Regulations. Int. J. Environ. Res. Public Health 2021, 18, 9709. [Google Scholar] [CrossRef] [PubMed]
  17. ASTM F2182-19e2; Standard Test Method for Measurement of Radio Frequency Induced Heating on or Near Passive Implants during Magnetic Resonance Imaging. ASTM International: West Conshohocken, PA, USA, 2019.
  18. ISO/TS 10974; Assessment of the Safety of Magnetic Resonance Imaging of Patients with an Active Implantable Medical Device. International Organization for Standardization: Geneva, Switzerland, 2018.
  19. Bonanno, L.; Marino, S.; Morabito, R.; Barbalace, G.; Sestito, A.; Testagrossa, B.; Acri, G. Evaluation of US and MRI techniques for carotid stenosis: A novel phantom approach. Radiol. Medica 2019, 124, 368–374. [Google Scholar] [CrossRef]
  20. Och, J.G.; Clarke, G.D.; Sobol, W.T.; Rosen, C.W.; Mun, S.K. Acceptance testing of magnetic resonance imaging systems: Report of AAPM Nuclear Magnetic Resonance Task Group No.6. Med. Phys. 1992, 19, 217–229. [Google Scholar] [CrossRef]
  21. Acri, G.; Gurgone, S.; Iovane, C.; Romeo, M.B.; Borzelli, D.; Testagrossa, B. A Novel Phantom and a Dedicated Developed Software for Image Quality Controls in X-Ray Intraoral Devices. J. Biomed. Phys. Eng. 2021, 11, 151–162. [Google Scholar] [CrossRef]
  22. Winter, L.; Oberacker, E.; Özerdem, C.; Ji, Y.; von Knobelsdorff-Brenkenhoff, F.; Weidemann, G.; Ittermann, B.; Seifert, F.; Niendorf, T. On the RF heating of coronary stents at 7.0 Tesla MRI. Magn. Reson. Med. 2015, 74, 999–1010. [Google Scholar] [CrossRef]
  23. Santoro, D.; Winter, L.; Müller, A.; Vogt, J.; Renz, W.; Özerdem, C.; Grässl, A.; Tkachenko, V.; Schulz-Menger, J.; Niendorf, T. Detailing Radio Frequency Heating Induced by Coronary Stents: A 7.0 Tesla Magnetic Resonance Study. PLoS ONE 2012, 7, e49963. [Google Scholar] [CrossRef]
  24. Vrtnik, S.; Wencka, M.; Jelen, A.; Kim, H.J.; Dolinšek, J. Coronary stent as a tubular flow heater in magnetic resonance imaging. J. Anal. Sci. Technol. 2015, 6, 1. [Google Scholar] [CrossRef]
  25. Bassen, H.; Kainz, W.; Mendoza, G.; Kellom, T. MRI-induced heating of selected thin wire metallic implants—Laboratory and computational studies—Findings and new questions raised. Minim. Invasive Ther. Allied Technol. 2006, 15, 76–84. [Google Scholar] [CrossRef]
  26. Gross, D.C.; Simonetti, O.P. In vivo and post-mortem measurements of radio frequency induced heating during MRI of pigs implanted with vascular stents. J. Cardiovasc. Magn. Reson. 2016, 18, P53. [Google Scholar] [CrossRef]
  27. EM and Thermal Tissue Database. Available online: https://itis.swiss/virtual-population/tissue-properties/database/database-summary/ (accessed on 17 October 2023).
  28. Mattei, E.; Triventi, M.; Calcagnini, G.; Censi, F.; Kainz, W.; Mendoza, G.; Bassen, H.I.; Bartolini, P. Complexity of MRI induced heating on metallic leads: Experimental measure-ments of 374 configurations. Biomed. Eng. Online 2008, 7, 1–16. [Google Scholar] [CrossRef] [PubMed]
  29. Keller, W.; Borkowski, A. Thin plate spline interpolation. J. Geodesy 2019, 93, 1251–1269. [Google Scholar] [CrossRef]
  30. Panych, L.P.; Madore, B. The physics of MRI safety. J. Magn. Reson. Imaging 2018, 47, 28–43. [Google Scholar] [CrossRef] [PubMed]
  31. Winter, L.; Seifert, F.; Zilberti, L.; Murbach, M.; Ittermann, B. MRI-Related Heating of Implants and Devices: A Review. J. Magn. Reson. Imaging 2021, 53, 1646–1665. [Google Scholar] [CrossRef] [PubMed]
  32. Fujimoto, K.; Angelone, L.M.; Lucano, E.; Rajan, S.S.; Iacono, M.I. Radio-Frequency Safety Assessment of Stents in Blood Vessels During Magnetic Resonance Imaging. Front. Physiol. 2018, 9, 1439. [Google Scholar] [CrossRef]
  33. Scandling, B. Radio Frequency Induced Heating of a Medical Device with Vascular Flow Conditions. Bachelor’s Thesis, The Ohio State University, Columbus, OH, USA, 2016. [Google Scholar]
  34. Price, R.; Allison, J.; Clarke, G.; Dennis, M.; Keener, C.; Masten, J.; Nessaiver, M.; Och, J.; Reeve, D. 2015 MRI Quality Control Manual; American College of Radiology: Reston, VA, USA, 2015. [Google Scholar]
  35. Stupic, K.F.; Ainslie, M.; Boss, M.A.; Charles, C.; Dienstfrey, A.M.; Evelhoch, J.L.; Finn, P.; Gimbutas, Z.; Gunter, J.L.; Hill, D.L.G.; et al. A standard system phantom for magnetic resonance imaging. Magn. Reson. Med. 2021, 86, 1194–1211. [Google Scholar] [CrossRef]
  36. Hellerbach, A.; Schuster, V.; Jansen, A.; Sommer, J. MRI Phantoms—Are There Alternatives to Agar? PLoS ONE 2013, 8, e70343. [Google Scholar] [CrossRef]
  37. Keenan, K.E.; Ainslie, M.; Barker, A.J.; Boss, M.A.; Cecil, K.M.; Charles, C.; Chenevert, T.L.; Clarke, L.; Evelhoch, J.L.; Finn, P.; et al. Quantitative magnetic resonance imaging phantoms: A review and the need for a system phantom. Magn. Reson. Med. 2017, 79, 48–61. [Google Scholar] [CrossRef]
  38. Park, S.; Nyenhuis, J.; Smith, C.; Lim, E.; Foster, K.; Baker, K.; Hrdlicka, G.; Rezai, A.; Ruggieri, P.; Sharan, A.; et al. Gelled versus nongelled phantom material for measurement of MRI-induced temperature increases with bioimplants. IEEE Trans. Magn. 2003, 39, 3367–3371. [Google Scholar] [CrossRef]
Figure 1. (a) Experimental setup for direct temperature measurements; (b) enlargement of the details on the stent highlighting the positioning of the temperature probes.
Applsci 13 11414 g001
Figure 2. Raw temperature data as function of time: average temperature and standard deviation, as gradient color, acquired during MRI examination. CH1 (black line), CH2 (red line), CH3 (blue line), and CH4 (green line).
Applsci 13 11414 g002
Figure 3. The temperature trend during the MRI examination. For each probe, the linear regression (red line) used for SAR calculation is shown.
Applsci 13 11414 g003
Figure 4. Reconstructed temperature trend along the entire stent length. (Goodness of fit: SSE: 32.2, R-square: 0.9964).
Applsci 13 11414 g004
Table 1. Scan protocol characteristics.
#1#2#3#4#5#6#7#8#9#10
Scan duration (s)19294043502324610213018
Whole body SAR/level (W/kg)<0.2/normal<0.2/normal<0.2/normal<0.2/normal<0.2/normal<0.2/normal<0.1/normal<0.1/normal<0.1/normal<0.1/normal
Max B1 + rms (uT)2.382.342.392.382.342.331.601.281.811.54
SequenceT2W_TSE_Cor_BHT2W_SPAIR_Cor_BHT2W_TSE_BHTW2_SPAIR_BHBTFE_BHDual_FFE_BH3D_MRCP_RTe-THRIVE_dyn_BHDWI_3b_navE_THRIVE_BH
TR (ms)74114,50820,19021,4953.214611903.061983.0
TE (ms)808090901.581.156001.43611.43
Voxel (mm)1.30 × 1.50 × 6.001.70 × 1.91 × 6.001.20 × 1.40 × 6.001.20 × 1.40 × 6.001.59 × 1.70 × 6.001.99 × 1.90 × 71.00 × 1.25 × 1.801.49 × 1.50 × 3.003.02 × 3.07 × 6.001.49 × 1.50 × 3.00
FOV (mm)375 × 375 × 174375 × 450 × 174375 × 332 × 237375 × 332 × 244375 × 328 × 244375 × 297 × 199260 × 300 × 81375 × 299 × 200375 × 313 × 244375 × 299 × 200
Slice thickness (mm)6666671.80363
Number of slices253534353525na13335133
Acquisition matrix288 × 250220 × 236312 × 237312 × 237236 × 194188 × 156260 × 240252 × 199124 × 102252 × 199
Bandwidth (Hz)586.5502.8381.6381.62037.12606.9149.1718.931.9718.9
Table 2. Maximum temperature change dTmax, calculated SAR (with R Pearson’s coefficient) and CEM43°C, for each measurement location.
ProbedTmax (°C)SAR (W/kg)R PearsonCEM43°C
CH11.6428.9650.9820.011
CH24.120116.8700.9600.574
CH32.84510.7390.9710.059
CH44.00481.2970.9610.360
Disclaimer/Publisher’s Note: The statements, opinions and data contained in all publications are solely those of the individual author(s) and contributor(s) and not of MDPI and/or the editor(s). MDPI and/or the editor(s) disclaim responsibility for any injury to people or property resulting from any ideas, methods, instructions or products referred to in the content.

