
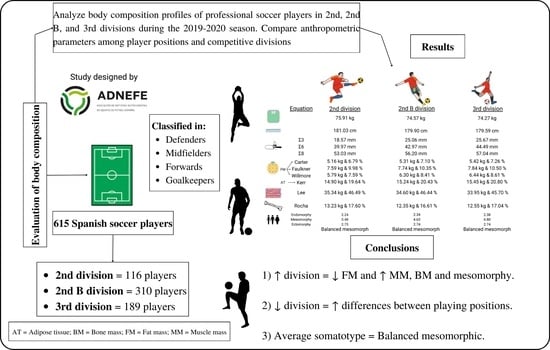
Anthropometric Values in Spanish Elite Soccer: Differences between Divisions and Playing Positions


 ,
,  ,
,
Abstract
:Featured Application
Abstract
1. Introduction
2. Materials and Methods
2.1. Study Design
2.2. Participants
2.3. Procedure
2.4. Anthropometric Measurements
2.5. Statistical Analysis
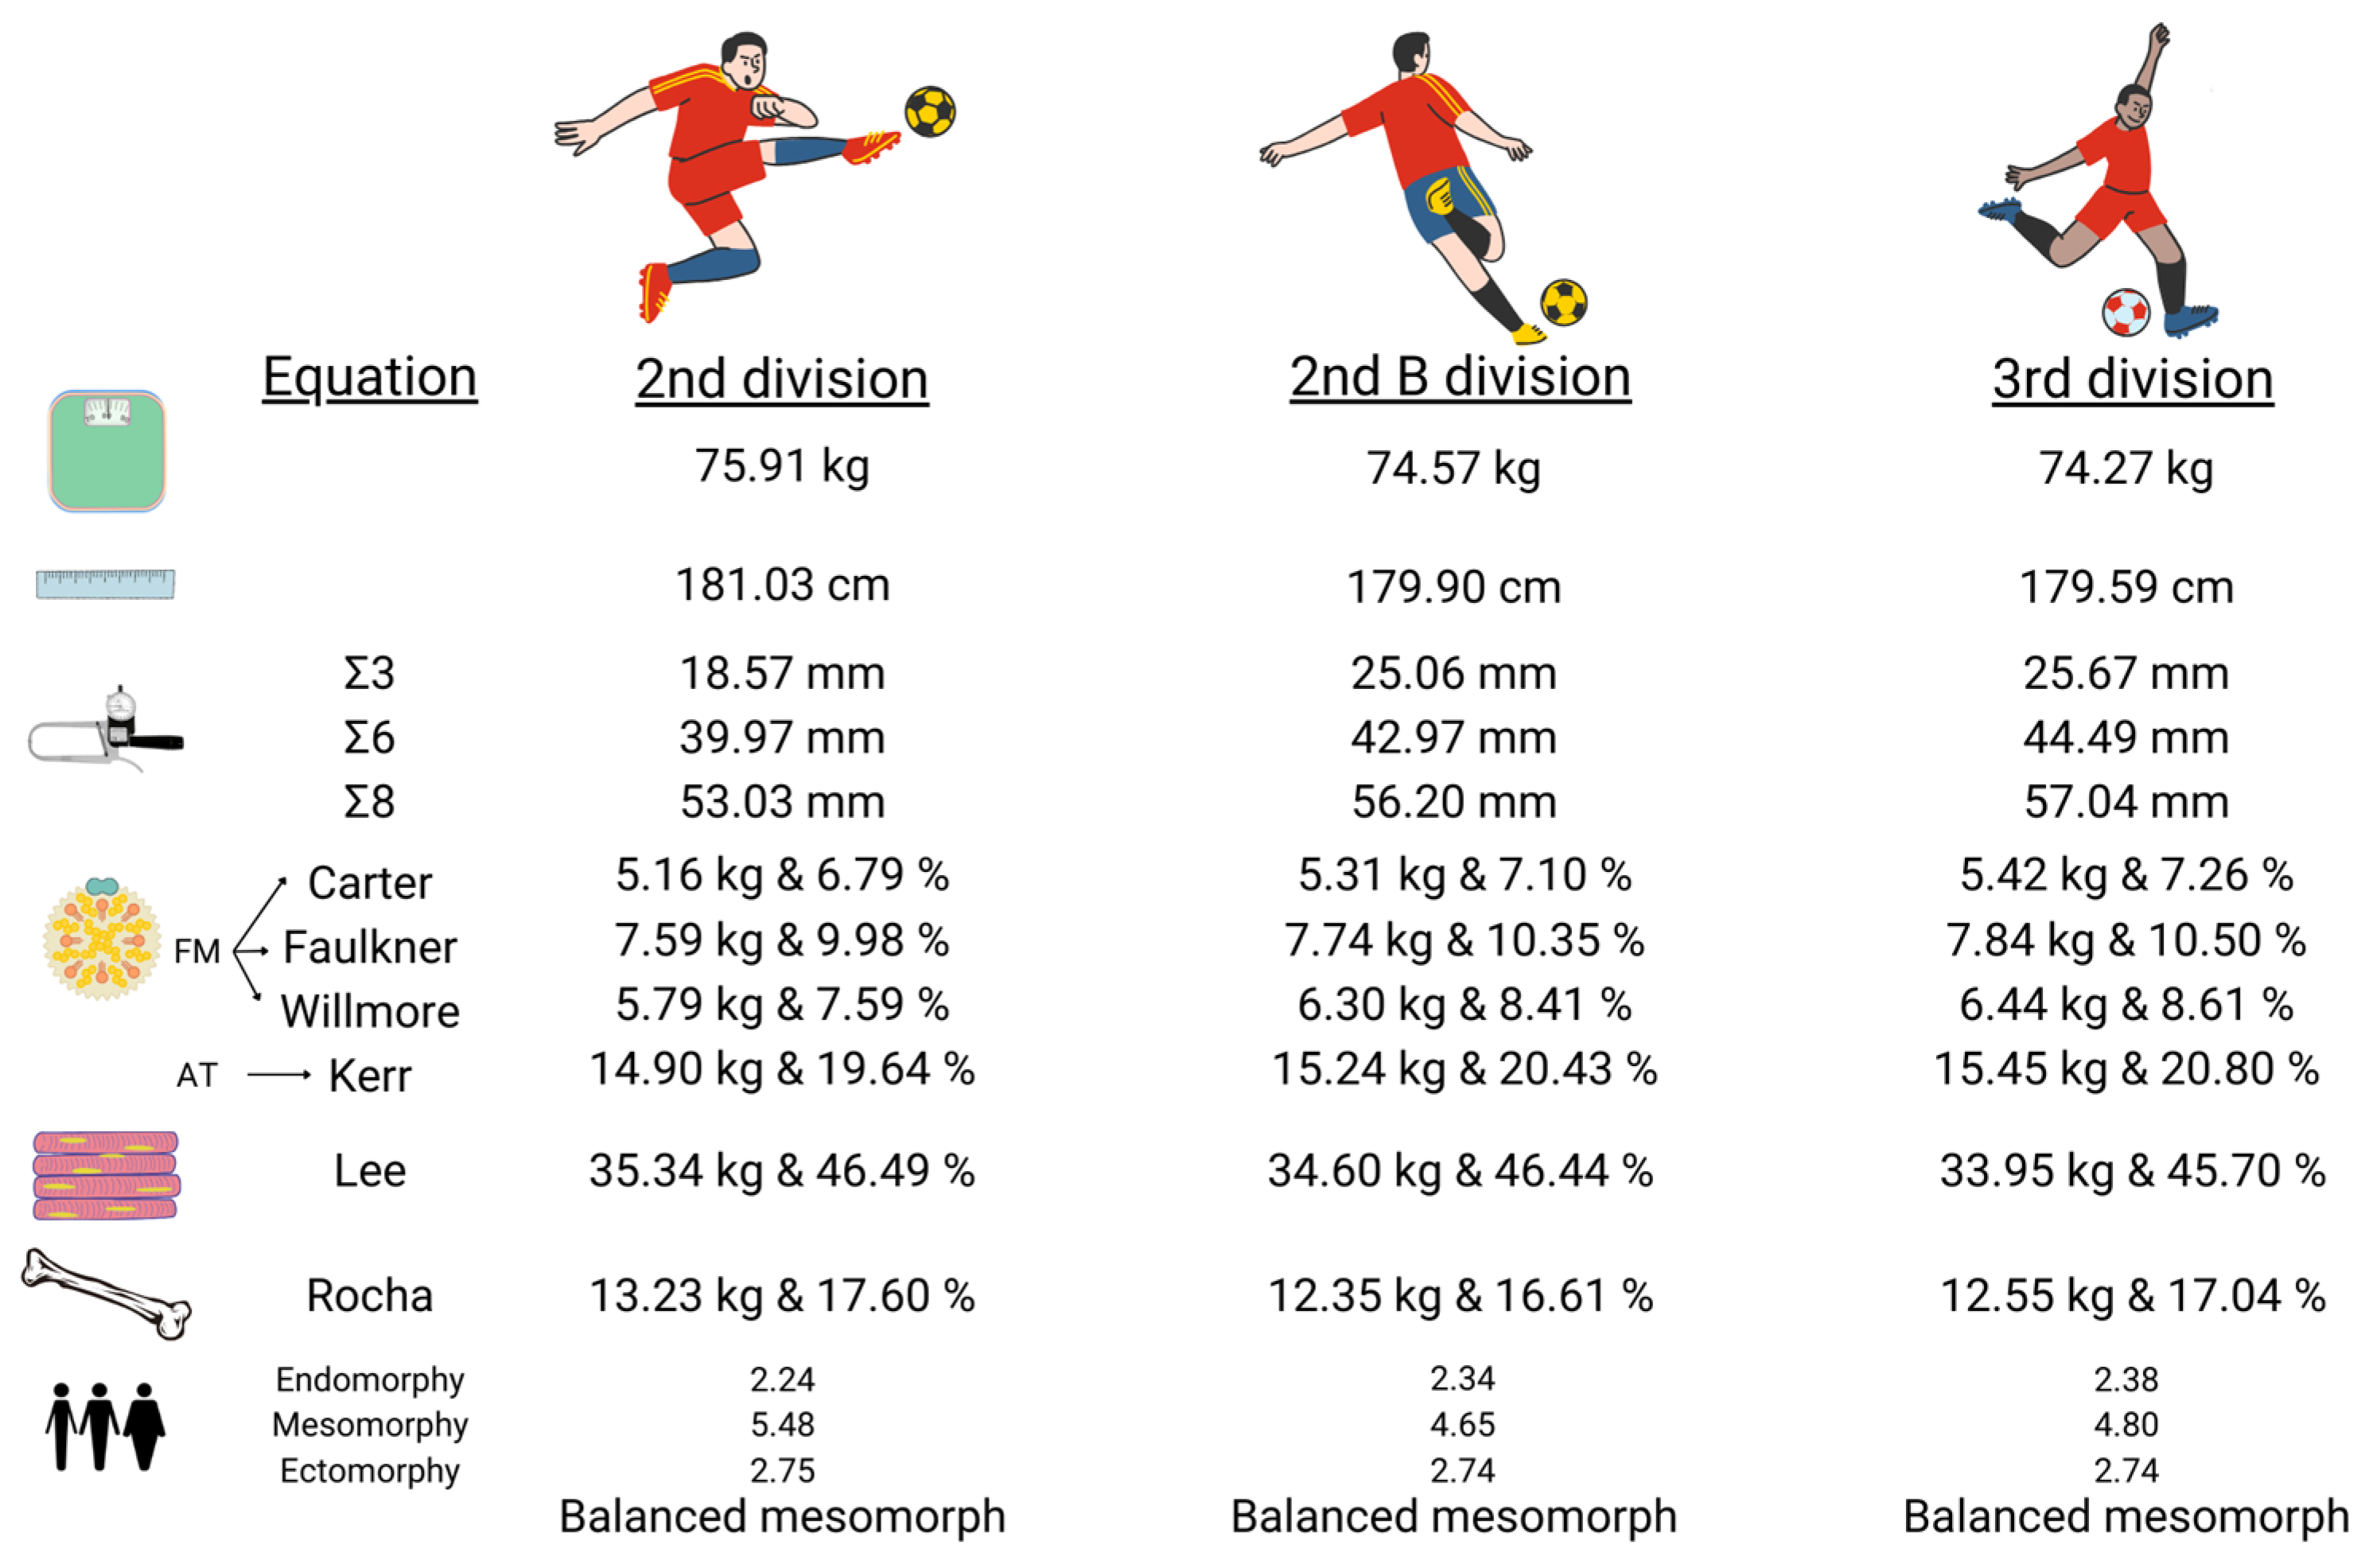
3. Results
4. Discussion
4.1. Body Composition Values
4.2. Somatotype Values
4.3. Application Percentiles
4.4. Limitations
4.5. Practical Application
5. Conclusions
Author Contributions
Funding
Institutional Review Board Statement
Informed Consent Statement
Data Availability Statement
Acknowledgments
Conflicts of Interest
Abbreviations
References
- Collins, J.; Maughan, R.J.; Gleeson, M.; Bilsborough, J.; Jeukendrup, A.; Morton, J.P.; Phillips, S.M.; Armstrong, L.; Burke, L.M.; Close, G.L.; et al. UEFA Expert Group Statement on Nutrition in Elite Football. Current Evidence to Inform Practical Recommendations and Guide Future Research. Br. J. Sports Med. 2021, 55, 416. [Google Scholar] [CrossRef]
- Anderson, L.; Orme, P.; Di Michele, R.; Close, G.L.; Morgans, R.; Drust, B.; Morton, J.P. Quantification of Training Load during One-, Two- and Three-Game Week Schedules in Professional Soccer Players from the English Premier League: Implications for Carbohydrate Periodisation. J. Sports Sci. 2016, 34, 1250–1259. [Google Scholar] [CrossRef] [PubMed]
- Dolci, F.; Hart, N.H.; Kilding, A.E.; Chivers, P.; Piggott, B.; Spiteri, T. Physical and Energetic Demand of Soccer: A Brief Review. Strength Cond. J. 2020, 42, 70–77. [Google Scholar] [CrossRef]
- Wallace, J.L.; Norton, K.I. Evolution of World Cup Soccer Final Games 1966-2010: Game Structure, Speed and Play Patterns. J. Sci. Med. Sport 2014, 17, 223–228. [Google Scholar] [CrossRef]
- Silva, J.R. The Soccer Season: Performance Variations and Evolutionary Trends. PeerJ 2022, 10, e14082. [Google Scholar] [CrossRef]
- López Cáceres, P.A.; Chena Sinovas, M.; Asín Izquierdo, I.; Moreno Ortega, A.; Moreno Rojas, R.; López Cáceres, P.A.; Chena Sinovas, M.; Asín Izquierdo, I.; Moreno Ortega, A.; Moreno Rojas, R. Efecto de Factores Contextuales En La Composición Corporal de Jugadores Profesionales de Fútbol. Un Estudio Retrospectivo. Nutr. Hosp. 2019, 36, 1324–1331. [Google Scholar] [CrossRef]
- Sutton, L.; Scott, M.; Wallace, J.; Reilly, T. Body Composition of English Premier League Soccer Players: Influence of Playing Position, International Status, and Ethnicity. J. Sports Sci. 2009, 27, 1019–1026. [Google Scholar] [CrossRef]
- Sebastiá-Rico, J.; Martínez-Sanz, J.M.; González-Gálvez, N.; Soriano, J.M. Differences in Body Composition between Playing Positions in Men’s Professional Soccer: A Systematic Review with Meta-Analysis. Appl. Sci. 2023, 13, 4782. [Google Scholar] [CrossRef]
- Sebastiá-Rico, J.; Soriano, J.M.; González-Gálvez, N.; Martínez-Sanz, J.M. Body Composition of Male Professional Soccer Players Using Different Measurement Methods: A Systematic Review and Meta-Analysis. Nutrients 2023, 15, 1160. [Google Scholar] [CrossRef] [PubMed]
- Abreu, R.; Figueiredo, P.; Beckert, P.; Marques, J.P.; Amorim, S.; Caetano, C.; Carvalho, P.; Sá, C.; Cotovio, R.; Cruz, J.; et al. Portuguese Football Federation Consensus Statement 2020: Nutrition and Performance in Football. BMJ Open Sport Exerc. Med. 2021, 7, e001082. [Google Scholar] [CrossRef] [PubMed]
- Bernal-Orozco, M.F.; Posada-Falomir, M.; Quiñónez-Gastélum, C.M.; Plascencia-Aguilera, L.P.; Arana-Nuño, J.R.; Badillo-Camacho, N.; Márquez-Sandoval, F.; Holway, F.E.; Vizmanos-Lamotte, B. Anthropometric and Body Composition Profile of Young Professional Soccer Players. J. Strength Cond. Res. 2020, 34, 1911–1923. [Google Scholar] [CrossRef] [PubMed]
- Tornero-Aguilera, J.F.; Villegas-Mora, B.E.; Clemente-Suárez, V.J. Differences in Body Composition Analysis by DEXA, Skinfold and BIA Methods in Young Football Players. Children 2022, 9, 1643. [Google Scholar] [CrossRef]
- Stanković, M.; Čaprić, I.; Đorđević, D.; Đorđević, S.; Preljević, A.; Koničanin, A.; Maljanović, D.; Nailović, H.; Muković, I.; Jelaska, I.; et al. Relationship between Body Composition and Specific Motor Abilities According to Position in Elite Female Soccer Players. Int. J. Environ. Res. Public Health 2023, 20, 1327. [Google Scholar] [CrossRef] [PubMed]
- Oliveira, R.; Francisco, R.; Fernandes, R.; Martins, A.; Nobari, H.; Clemente, F.M.; Brito, J.P. In-Season Body Composition Effects in Professional Women Soccer Players. Int. J. Environ. Res. Public Health 2021, 18, 12023. [Google Scholar] [CrossRef]
- Alvero Cruz, J.R.; Cabañas, M.D.; Herrero de Lucas, A.; Martinez Riaza, L.; Moreno Pascual, C.; Porta Manzañido, J.; Sillero Quintana, M.; Sirvent Belando, J.E. Protocolo de Valoración de La Composición Corporal Para El Reconocimiento Médico-Deportivo. Documento de Consenso Del Grupo Español de Cineantropometría (GREC) de La Federación Española de Medicina Del Deporte (FEMEDE). Versión 2010. Arch. Med. Deporte 2010, 27, 330. [Google Scholar]
- Chena Sinovas, M.; Pérez-López, A.; Álvarez Valverde, I.; Bores Cerezal, A.; Ramos-Campo, D.J.; Rubio-Arias, J.A.; Valadés Cerrato, D. Influencia de La Composición Corporal Sobre El Rendimiento En Salto Vertical Dependiendo de La Categoría de La Formación y La Demarcación En Futbolistas. Nutr. Hosp. 2015, 32, 299–307. [Google Scholar] [CrossRef]
- Reilly, T.; Bangsbo, J.; Franks, A. Anthropometric and Physiological Predispositions for Elite Soccer. J. Sports Sci. 2000, 18, 669–683. [Google Scholar] [CrossRef]
- Isak-¿Qué Es ISAK? Available online: https://www.isak.global/WhatIsIsak/#GoToKina (accessed on 22 May 2022).
- Kasper, A.M.; Langan-Evans, C.; Hudson, J.F.; Brownlee, T.E.; Harper, L.D.; Naughton, R.J.; Morton, J.P.; Close, G.L. Come Back Skinfolds, All Is Forgiven: A Narrative Review of the Efficacy of Common Body Composition Methods in Applied Sports Practice. Nutrients 2021, 13, 1075. [Google Scholar] [CrossRef]
- Carter, J.E.L. The Heath-Carter Anthropometric Somatotype-Instruction Manual; University SDS: San Diego, CA, USA, 2002. [Google Scholar]
- Cabañas, M.D.; Esparza, F. Compendio de Cineantropometría; CTO Editorial: Madrid, Spain, 2009. [Google Scholar]
- Clasificación Masculina. Available online: https://www.fifa.com/es/fifa-world-ranking/origin1904-p.cxm.fifa.com/fifa-world-ranking/men (accessed on 8 July 2023).
- Casajús, J.A. Seasonal Variation in Fitness Variables in Professional Soccer Players. J. Sports Med. Phys. Fit. 2001, 41, 463–469. [Google Scholar]
- Lago-Penas, C.; Rey, E.; Lago-Ballesteros, J.; Dominguez, E.; Casais, L. Seasonal Variations in Body Composition and Fitness Parameters According to Individual Percentage of Training Completion in Professional Soccer Players. Int. Sport. J. 2013, 14, 205–215. [Google Scholar]
- Manuel Vega, J.; Gonzalez-Artetxe, A.; Ander Aguinaco, J.; Los Arcos, A. Assessing the Anthropometric Profile of Spanish Elite Reserve Soccer Players by Playing Position over a Decade. Int. J. Environ. Res. Public Health 2020, 17, 5446. [Google Scholar] [CrossRef]
- Vandenbroucke, J.P.; von Elm, E.; Altman, D.G.; Gøtzsche, P.C.; Mulrow, C.D.; Pocock, S.J.; Poole, C.; Schlesselman, J.J.; Egger, M.; Strobe Initiative. Strengthening the Reporting of Observational Studies in Epidemiology (STROBE): Explanation and Elaboration. PLoS Med. 2007, 4, e297. [Google Scholar] [CrossRef]
- ISO 7250-1:2017; Basic Human Body Measurements for Technological Design—Part 1: Body Measurement Definitions and Landmarks. Spanish Association for Standardization: Madrid, Spain, 2017.
- Carter, J. The Physical Structure of Olympic Athletes—Part I—The Montreal Olympic Games Anthropometrical Project. Br. J. Sports Med. 1982, 16, 267. [Google Scholar]
- Faulkner, J.A. Physiology of Swimming. Res. Q. Am. Assoc. Health Phys. Educ. Recreat. 1966, 37, 41–54. [Google Scholar] [CrossRef]
- Wilmore, J.H.; Behnke, A.R. An Anthropometric Estimation of Body Density and Lean Body Weight in Young Men. J. Appl. Physiol. 1969, 27, 25–31. [Google Scholar] [CrossRef]
- Lee, R.C.; Wang, Z.; Heo, M.; Ross, R.; Janssen, I.; Heymsfield, S.B. Total-Body Skeletal Muscle Mass: Development and Cross-Validation of Anthropometric Prediction Models. Am. J. Clin. Nutr. 2000, 72, 796–803. [Google Scholar] [CrossRef]
- Stewart, A.; Marfell-Jones, M.; Olds, T. International Standards for Anthropometric Assessment; International Society for the Advancement of Kinanthropometry: Lower Hutt, New Zealand, 2011; ISBN 978-0-620-36207-8. [Google Scholar]
- Ross, W.D.K. Fraccionamiento de La Masa Corporal: Un Nuevo Método Para Utilizar En Nutrición Clínica y Medicina Deportiva. Apunt. Med. Esport. 1991, 28, 175–188. [Google Scholar]
- Hopkins, W.G.; Marshall, S.W.; Batterham, A.M.; Hanin, J. Progressive Statistics for Studies in Sports Medicine and Exercise Science. Med. Sci. Sports Exerc. 2009, 41, 3–12. [Google Scholar] [CrossRef] [PubMed]
- Radzimiński, Ł.; Szwarc, A.; Padrón-Cabo, A.; Jastrzębski, Z. Correlations between Body Composition, Aerobic Capacity, Speed and Distance Covered among Professional Soccer Players during Official Matches. J. Sports Med. Phys. Fit. 2020, 60, 257–262. [Google Scholar] [CrossRef] [PubMed]
- Figueiredo, D.H.; Dourado, A.C.; Stanganelli, L.C.R.; Gonçalves, H.R. Evaluation of Body Composition and Its Relationship with Physical Fitness in Professional Soccer Players at the Beginning of Pre-Season. Retos Nuevas Tend. Educ. Fís. Deporte Recreación 2021, 40, 117–125. [Google Scholar] [CrossRef]
- Campa, F.; Semprini, G.; Júdice, P.B.; Messina, G.; Toselli, S. Anthropometry, Physical and Movement Features, and Repeated-Sprint Ability in Soccer Players. Int. J. Sports Med. 2019, 40, 100–109. [Google Scholar] [CrossRef] [PubMed]
- Nikolaidis, P.T.; Ruano, M.a.G.; de Oliveira, N.C.; Portes, L.A.; Freiwald, J.; Leprêtre, P.M.; Knechtle, B. Who Runs the Fastest? Anthropometric and Physiological Correlates of 20 m Sprint Performance in Male Soccer Players. Res. Sports Med. 2016, 24, 341–351. [Google Scholar] [CrossRef]
- Vasquez-bonilla, A.A.; Rojas-Valverde, D.; Timon, R.; Olcina, G. Influence of Fat Percentage on Muscle Oxygen Uptake and Metabolic Power during Repeated-Sprint Ability of Footballers. Apunt. Sports Med. 2022, 57, 100395. [Google Scholar] [CrossRef]
- Suarez-Arrones, L.; Lara-Lopez, P.; Maldonado, R.; Torreno, N.; Hoyo, M.D.; Nakamura, F.Y.; Salvo, V.D.; Mendez-Villanueva, A. The Effects of Detraining and Retraining Periods on Fat-Mass and Fat-Free Mass in Elite Male Soccer Players. PeerJ 2019, 7, e7466. [Google Scholar] [CrossRef] [PubMed]
- Ayotte, B.; Carey, V.; Charron, J.; Ibo, J.; Ferland, P.-M.; Comtois, A.S. Increase In Body Mass Do Not Negatively Affect Aerobic Capacity in Elite Male Soccer Players: 67. Med. Sci. Sports Exerc. 2021, 53, 21. [Google Scholar] [CrossRef]
- Ishida, A.; Travis, S.K.; Stone, M.H. Associations of Body Composition, Maximum Strength, Power Characteristics with Sprinting, Jumping, and Intermittent Endurance Performance in Male Intercollegiate Soccer Players. J. Funct. Morphol. Kinesiol. 2021, 6, 7. [Google Scholar] [CrossRef]
- Yuhasz, M.S. The Effects of Sports Training on Body Fat in Man with Predictions of Optimal Body Weight; University of Illinois at Urbana-Champaign: Champaign, IL, USA, 1962. [Google Scholar]
- Matiegka, J. The Testing of Physical Efficiency. Am. J. Phys. Anthropol. 1921, 4, 223–230. [Google Scholar] [CrossRef]
- Zuniga Galaviz, U.; Osorio Gutierrez, A.; Toledo Dominguez, I.d.J.; Herrera Perea, R. Somatotype of Mexican Soccer Players from Different Competition Level. Retos-Nuevas Tend. Educ. Fis. Deporte Recreacion 2018, 34, 100–102. [Google Scholar] [CrossRef]
- Hazir, T. Physical Characteristics and Somatotype of Soccer Players According to Playing Level and Position. J. Hum. Kinet. 2010, 26, 83–95. [Google Scholar] [CrossRef]
- Vaquero-Cristóbal, R.; Albaladejo-Saura, M.; Luna-Badachi, A.E.; Esparza-Ros, F. Differences in Fat Mass Estimation Formulas in Physically Active Adult Population and Relationship with Sums of Skinfolds. Int. J. Environ. Res. Public Health 2020, 17, 7777. [Google Scholar] [CrossRef]

| Variables | Second Division (Mean ± SD) | Second B Division (Mean ± SD) | Third Division (Mean ± SD) | Division | Division with Position as a Covariable | ||||
|---|---|---|---|---|---|---|---|---|---|
| F | p | η2 | F | p | η2 | ||||
| Body mass (kg) | 75.91 ± 6.86 | 74.57 ± 6.87 | 74.27 ± 7.00 | 2.18 | 0.113 | 0.004 | 3.66 | 0.000 | 0.187 |
| Stretch stature (cm) | 181.03 ± 6.20 | 179.90 ± 6.38 | 179.59 ± 5.88 | 2.04 | 0.131 | 0.002 | 2.86 | 0.002 | 0.153 |
| Triceps skinfold (mm) | 5.54 ± 1.75 | 5.84 ± 2.31 | 6.67 ± 2.08 | 11.58 | 0.000 | 0.115 | 3.10 | 0.001 | 0.163 |
| Subscapular skinfold (mm) | 7.64 ± 1.61 | 7.77 ± 1.61 | 7.61 ± 1.40 | 0.61 | 0.542 | 0.012 | 0.65 | 0.783 | 0.039 |
| Biceps skinfold (mm) | 4.60 ± 2.10 | 3.91 ± 1.86 | 3.38 ± 0.97 | 13.06 | 0.000 | 0.043 | 1.09 | 0.370 | 0.064 |
| Iliac crest skinfold (mm) | 7.54 ± 2.08 | 8.88 ± 3.27 | 9.52 ± 3.07 | 9.70 | 0.000 | 0.028 | 0.79 | 0.654 | 0.116 |
| Supraspinale skinfold (mm) | 6.19 ± 1.94 | 6.84 ± 2.27 | 6.23 ± 1.99 | 5.91 | 0.003 | 0.066 | 2.09 | 0.023 | 0.047 |
| Abdominal skinfold (mm) | 8.09 ± 2.29 | 9.40 ± 3.62 | 10.33 ± 3.91 | 14.15 | 0.000 | 0.052 | 1.38 | 0.187 | 0.08 |
| Thigh skinfold (mm) | 8.02 ± 2.45 | 8.73 ± 2.73 | 9.34 ± 3.09 | 7.60 | 0.001 | 0.038 | 1.44 | 0.159 | 0.083 |
| Calf skinfold (mm) | 4.49 ± 1.21 | 4.92 ± 1.45 | 5.15 ± 1.74 | 6.62 | 0.001 | 0.051 | 1.70 | 0.076 | 0.097 |
| Arm relaxed girth (cm) | 30.75 ± 1.84 | 30.34 ± 1.64 | 30.21 ± 2.21 | 2.46 | 0.087 | 0.035 | 2.60 | 0.004 | 0.141 |
| Arm flexed and tensed girth (cm) | 33.98 ± 1.92 | 32.95 ± 1.81 | 32.76 ± 2.17 | 12.06 | 0.000 | 0.046 | 2.47 | 0.007 | 0.135 |
| Waist girth (cm) | 78.89 ± 3.31 | 77.89 ± 3.53 | 77.30 ± 4.32 | 2.71 | 0.068 | 0.011 | 1.63 | 0.094 | 0.093 |
| Hip girth (cm) | 99.26 ± 4.29 | 95.23 ± 3.71 | 95.50 ± 4.74 | 17.10 | 0.000 | 0.024 | 1.95 | 0.036 | 0.109 |
| Thigh middle girth (cm) | 54.72 ± 2.88 | 54.52 ± 3.10 | 53.72 ± 2.94 | 3.95 | 0.020 | 0.030 | 2.49 | 0.006 | 0.135 |
| Calf girth (cm) | 37.63 ± 1.99 | 37.18 ± 3.00 | 37.27 ± 1.99 | 1.28 | 0.278 | 0.001 | 0.80 | 0.640 | 0.048 |
| Humerus breadth (cm) | 7.36 ± 0.47 | 6.88 ± 0.44 | 7.03 ± 0.35 | 39.32 | 0.000 | 0.106 | 3.58 | 0.000 | 0.184 |
| Bi-styloid breadth (cm) | 5.92 ± 0.35 | 5.69 ± 0.38 | 5.87 ± 0.50 | 10.59 | 0.000 | 0.087 | 2.27 | 0.013 | 0.125 |
| Femur breadth (cm) | 10.22 ± 0.48 | 9.79 ± 0.48 | 9.77 ± 0.65 | 23.67 | 0.000 | 0.035 | 1.16 | 0.318 | 0.068 |
| Sum of three skinfolds (cm) | 18.57 ± 6.18 | 25.06 ± 7.55 | 25.67 ± 8.22 | 37.21 | 0.000 | 0.028 | 1.01 | 0.439 | 0.060 |
| Sum of six skinfolds (cm) | 39.97 ± 7.86 | 42.97 ± 9.63 | 44.49 ± 10.98 | 7.73 | 0.000 | 0.047 | 1.47 | 0.148 | 0.084 |
| Sum of eight skinfolds (cm) | 53.03 ± 9.81 | 56.20 ± 12.12 | 57.04 ± 14.07 | 2.49 | 0.084 | 0.040 | 1.34 | 0.205 | 0.078 |
| Corrected arm girth (cm) | 29.11 ± 2.05 | 28.53 ± 1.78 | 28.17 ± 2.13 | 6.55 | 0.002 | 0.067 | 2.58 | 0.005 | 0.139 |
| Corrected thigh girth (cm) | 52.18 ± 2.70 | 51.75 ± 3.10 | 50.83 ± 2.94 | 6.66 | 0.001 | 0.056 | 2.70 | 0.003 | 0.145 |
| Corrected calf girth (cm) | 36.22 ± 2.00 | 35.60 ± 3.05 | 35.72 ± 1.99 | 2.37 | 0.094 | 0.002 | 0.78 | 0.656 | 0.047 |
| Sum of corrected girths (cm) | 117.59 ± 5.50 | 116.18 ± 6.44 | 114.12 ± 9.34 | 6.32 | 0.002 | 0.042 | 2.30 | 0.012 | 0.127 |
| Fat mass (Carter) (kg) | 5.16 ± 0.88 | 5.31 ± 1.01 | 5.42 ± 1.14 | 2.17 | 0.115 | 0.017 | 2.51 | 0.006 | 0.136 |
| Fat mass (Carter) (%) | 6.79 ± 0.83 | 7.10 ± 1.01 | 7.26 ± 1.15 | 7.73 | 0.000 | 0.047 | 1.47 | 0.148 | 0.084 |
| Fat mass (Faulkner) (kg) | 7.59 ± 1.02 | 7.74 ± 1.25 | 7.84 ± 1.38 | 1.31 | 0.271 | 0.006 | 2.70 | 0.003 | 0.145 |
| Fat mass (Faulkner) (%) | 9.98 ± 0.82 | 10.35 ± 1.14 | 10.50 ± 1.24 | 7.57 | 0.001 | 0.031 | 1.14 | 0.333 | 0.067 |
| Fat mass (Willmore) (kg) | 5.79 ± 1.43 | 6.30 ± 1.57 | 6.44 ± 1.83 | 5.79 | 0.003 | 0.025 | 2.30 | 0.012 | 0.126 |
| Fat mass (Willmore) (%) | 7.59 ± 1.53 | 8.41 ± 1.73 | 8.61 ± 2.03 | 12.01 | 0.000 | 0.047 | 1.50 | 0.136 | 0.086 |
| Adipose tissue (Kerr) (kg) | 14.90 ± 2.08 | 15.24 ± 2.35 | 15.45 ± 2.49 | 1.98 | 0.139 | 0.023 | 2.46 | 0.007 | 0.134 |
| Adipose tissue (Kerr) (%) | 19.64 ± 2.12 | 20.43 ± 2.44 | 20.80 ± 2.59 | 8.27 | 0.000 | 0.063 | 1.50 | 0.136 | 0.086 |
| Muscle mass (Lee) (kg) | 35.34 ± 3.05 | 34.60 ± 3.94 | 33.95 ± 3.18 | 4.71 | 0.010 | 0.027 | 1.90 | 0.042 | 0.107 |
| Muscle mass (Lee) (%) | 46.49 ± 2.17 | 46.44 ± 3.90 | 45.70 ± 2.36 | 2.94 | 0.054 | 0.022 | 0.97 | 0.480 | 0.057 |
| Bone mass (Rocha) (kg) | 13.23 ± 1.22 | 12.35 ± 1.27 | 12.55 ± 1.42 | 11.19 | 0.000 | 0.033 | 2.17 | 0.018 | 0.120 |
| Bone mass (Rocha) (%) | 17.60 ± 1.13 | 16.61 ± 1.30 | 17.04 ± 1.61 | 13.07 | 0.000 | 0.046 | 1.51 | 0.131 | 0.087 |
| Residual mass (kg) | 13.21 ± 3.50 | 12.62 ± 4.26 | 12.37 ± 3.50 | 0.76 | 0.470 | 0.002 | 1.72 | 0.073 | 0.097 |
| Residual mass (%) | 17.24 ± 3.21 | 16.81 ± 4.54 | 16.60 ± 3.67 | 0.42 | 0.660 | 0.001 | 0.82 | 0.619 | 0.049 |
| Endomorphy | 2.24 ± 0.41 | 2.34 ± 0.54 | 2.38 ± 0.53 | 2.70 | 0.068 | 0.015 | 0.84 | 0.601 | 0.050 |
| Mesomorphy | 5.48 ± 0.98 | 4.65 ± 1.05 | 4.80 ± 0.89 | 22.12 | 0.000 | 0.034 | 1.55 | 0.116 | 0.089 |
| Ectomorphy | 2.75 ± 0.73 | 2.74 ± 0.70 | 2.74 ± 0.74 | 0.03 | 0.972 | 0.002 | 0.98 | 0.471 | 0.058 |
| Z sum of six skinfolds | −2.33 ± 0.20 | −2.25 ± 0.25 | −2.21 ± 0.28 | 7.73 | 0.000 | 0.047 | 1.47 | 0.148 | 0.084 |
| Body mass index (kg/m2) | 23.14 ± 1.46 | 23.01 ± 1.34 | 23.00 ± 1.48 | 0.43 | 0.653 | 0.004 | 1.96 | 0.035 | 0.110 |
| Waist-to-hip ratio | 0.80 ± 0.03 | 0.82 ± 0.03 | 0.81 ± 0.04 | 9.31 | 0.000 | 0.012 | 0.99 | 0.454 | 0.059 |
| Fat distribution index | 0.83 ± 0.16 | 0.83 ± 0.21 | 0.90 ± 0.21 | 5.19 | 0.006 | 0.067 | 1.90 | 0.042 | 0.107 |
| Variables | Second Division vs. Second B Division | Second Division vs. Third Division | Second B Division vs. Third Division | ||||||
|---|---|---|---|---|---|---|---|---|---|
| Mean Difference ± SD | p Value | 95% CI | Mean Difference ± SD | p Value | 95% CI | Mean Difference ± SD | p Value | 95% CI | |
| Triceps skinfold (mm) | −0.30 ± 0.24 | 0.647 | −0.87; 0.28 | −1.13 ± 0.26 | 0.000 | −1.75; −0.51 | −0.83 ± 0.21 | 0.000 | −1.35; −0.32 |
| Biceps skinfold (mm) | 0.69 ± 0.23 | 0.009 | 0.14; 1.24 | 1.21 ± 0.24 | 0.000 | 0.63; 1.80 | 0.53 ± 0.17 | 0.006 | 0.12; 0.93 |
| Iliac crest skinfold (mm) | −1.34 ± 0.42 | 0.005 | −2.36; −0.32 | −1.98 ± 0.45 | 0.000 | −3.06; −0.90 | −0.64 ± 0.31 | 0.122 | −1.39; 0.11 |
| Supraspinale skinfold (mm) | −0.65 ± 0.24 | 0.019 | −1.22; −0.08 | −0.04 ± 0.26 | 1.000 | −0.65; 0.58 | 0.61 ± 0.21 | 0.012 | 0.11; 1.12 |
| Abdominal skinfold (mm) | −1.31 ± 0.39 | 0.002 | −2.25; −0.38 | −2.24 ± 0.42 | 0.000 | −3.25; −1.23 | −0.92 ± 0.35 | 0.024 | −1.76; −0.09 |
| Thigh skinfold (mm) | −0.70 ± 0.31 | 0.074 | −1.46; 0.05 | −1.31 ± 0.34 | 0.000 | −2.13; −0.50 | −0.61 ± 0.28 | 0.089 | −1.28; 0.06 |
| Calf skinfold (mm) | −0.43 ± 0.17 | 0.031 | −0.84; −0.03 | −0.66 ± 0.18 | 0.001 | −1.09; −0.22 | −0.22 ± 0.15 | 0.405 | −0.59; 0.14 |
| Arm flexed and tensed girth (cm) | 1.03 ± 0.25 | 0.000 | 0.44; 2.63 | 1.21 ± 0.26 | 0.000 | 0.59; 1.84 | 0.18 ± 0.21 | 1.000 | −0.32; 0.69 |
| Hip girth (cm) | 4.02 ± 0.70 | 0.000 | 2.35; 5.69 | 3.76 ± 0.75 | 0.000 | 1.94; 5.57 | −0.26 ± 0.50 | 1.000 | −1.47; 0.94 |
| Thigh middle girth (cm) | 0.20 ± 0.41 | 1.000 | −0.79; 1.19 | 1.00 ± 0.40 | 0.035 | 0.05; 1.95 | 0.80 ± 0.37 | 0.092 | −0.09; 1.68 |
| Humerus breadth (cm) | 0.48 ± 0.05 | 0.000 | 0.35; 0.61 | 0.33 ± 0.06 | 0.000 | 0.19; 0.46 | 0.15 ± 0.05 | 0.006 | −0.27; −0.03 |
| Bi-styloid breadth (cm) | 0.23 ± 0.06 | 0.000 | 0.09; 0.38 | 0.06 ± 0.06 | 1.000 | −0.10; 0.21 | −1.78 ± 0.05 | 0.002 | −0.30; −0.05 |
| Femur breadth (cm) | 0.43 ± 0.07 | 0.000 | 0.27; 0.60 | 0.45 ± 0.07 | 0.000 | 0.28; 0.63 | 0.02 ± 0.06 | 1.000 | −0.13; 0.17 |
| Sum of three skinfolds (cm) | −6.49 ± 0.83 | 0.000 | −8.48; −4.49 | −7.10 ± 0.91 | 0.000 | −9.28; −4.92 | −0.62 ± 0.74 | 1.000 | −2.39; 1.16 |
| Sum of six skinfolds (cm) | −3.00 ± 1.06 | 0.015 | −5.55; −0.45 | −4.52 ± 1.15 | 0.000 | −7.29; −1.76 | −1.52 ± 0.90 | 0.275 | −3.69; 0.64 |
| Corrected arm girth (cm) | 0.58 ± 0.24 | 0.057 | −0.01; 1.16 | 0.94 ± 0.26 | 0.001 | 0.32; 1.56 | 0.36 ± 0.21 | 0.261 | −0.15; 0.87 |
| Corrected thigh girth (cm) | 0.42 ± 0.41 | 0.887 | −0.55; 1.40 | 1.34 ± 0.39 | 0.002 | 0.41; 2.28 | 0.92 ± 0.36 | 0.035 | 0.05; 1.79 |
| Sum of corrected girths (cm) | 1.41 ± 1.05 | 0.537 | −1.11; 3.92 | 3.47 ± 1.00 | 0.002 | 1.05; 5.88 | 2.06 ± 0.93 | 0.083 | −0.18; 4.30 |
| Fat mass (Carter) (%) | 0.31 ± 0.11 | 0.015 | −0.58; −0.05 | −0.47 ± 0.12 | 0.000 | −0.77; −0.18 | −0.16 ± 0.09 | 0.275 | −0.39 ± 0.07 |
| Fat mass (Faulkner) (%) | 0.37 ± 0.12 | 0.010 | −0.67; 0.07 | −0.52 ± 0.13 | 0.000 | −0.84; −0.19 | −0.15 ± 0.11 | 0.528 | −0.42; 0.12 |
| Fat mass (Willmore) (kg) | −5.04 ± 0.18 | 0.018 | −0.94; −0.06 | −0.65 ± 0.20 | 0.003 | −1.12; −0.18 | −0.15 ± 0.16 | 1.000 | −0.54; 0.25 |
| Fat mass (Willmore) (%) | −0.82 ± 0.20 | 0.000 | −1.30; −0.34 | −1.02 ± 0.22 | 0.000 | −1.54; −0.50 | −0.20 ± 0.18 | 0.811 | −0.63; 0.23 |
| Adipose tissue (Kerr) (%) | −0.79 ± 0.26 | 0.008 | −1.43; −0.16 | −1.16 ± 0.29 | 0.000 | −1.85; −0.47 | −0.37 ± 0.22 | 0.305 | −0.91; 0.17 |
| Muscle mass (Lee) (kg) | 0.74 ± 0.47 | 0.361 | −0.40; 1.87 | 1.39 ± 0.45 | 0.007 | 0.30; 2.48 | 0.65 ± 0.42 | 0.368 | −0.36; 1.67 |
| Bone mass (Rocha) (kg) | 0.88 ± 0.19 | 0.000 | 0.43; 1.33 | 0.68 ± 0.20 | 0.003 | 0.19; 1.18 | −0.20 ± 0.16 | 0.666 | −0.59; 0.19 |
| Bone mass (Rocha) (%) | 0.99 ± 0.20 | 0.000 | 0.51; 1.46 | 0.56 ± 0.21 | 0.028 | 0.04; 1.07 | −0.43 ± 0.17 | 0.037 | −0.82; −0.02 |
| Mesomorphy | 0.82 ± 0.13 | 0.000 | 0.52; 1.13 | 0.67 ± 0.14 | 0.000 | 0.35; 1.00 | 0.67 ± 0.14 | 0.000 | 0.35; 1.00 |
| Z sum of six skinfolds | −0.08 ± 0.03 | 0.015 | −0.14; −0.01 | −0.11 ± 0.03 | 0.000 | −0.19; −0.04 | −0.04 ± 0.02 | 0.275 | −0.09; 0.02 |
| Variable | Position Comparisons | Mean Difference ± SD | p Value | 95% CI | |
|---|---|---|---|---|---|
| Second division | |||||
| Body mass index (kg/m2) | Midfielders | Goalkeepers | −4.10 ± 1.52 | 0.047 | −8.16; −0.04 |
| Second B division | |||||
| Stretch stature (cm) | Midfielders | Defenders | −4.53 ± 1.56 | 0.026 | −8.70; −0.35 |
| Midfielders | Goalkeepers | −6.76 ± 2.24 | 0.017 | −12.73; −0.79 | |
| Third division | |||||
| Body mass (kg) | Forwards | Midfielders | 10.65 ± 2.31 | 0.000 | 4.48; 16.82 |
| Forwards | Defenders | 8.06 ± 2.36 | 0.005 | 1.75; 14.36 | |
| Midfielders | Goalkeepers | −8.39 ± 2.78 | 0.017 | −15.80; −0.99 | |
| Stretch stature (cm) | Forwards | Midfielders | 6.37 ± 2.02 | 0.011 | 0.99; 11.75 |
| Forwards | Defenders | 5.55 ± 2.06 | 0.047 | 0.05; 11.04 | |
| Midfielders | Goalkeepers | −6.73 ± 2.42 | 0.036 | −13.19; −0.27 | |
| Arm relaxed girth (cm) | Forwards | Midfielders | 1.78 ± 0.57 | 0.013 | 0.26; 3.29 |
| Arm flexed and tensed girth (cm) | Forwards | Midfielders | 1.74 ± 0.61 | 0.028 | 0.12; 3.37 |
| Thigh middle girth (cm) | Forwards | Midfielders | 3.11 ± 0.91 | 0.005 | 0.67; 5.55 |
| Humerus breadth (cm) | Forwards | Midfielders | 0.40 ± 0.13 | 0.016 | 0.05; 0.75 |
| Corrected thigh girth (cm) | Forwards | Midfielders | 2.99 ± 0.90 | 0.007 | 0.57; 5.40 |
| Sum of corrected girths (cm) | Forwards | Midfielders | 7.08 ± 2.02 | 0.004 | 1.68; 12.47 |
| Fat mass (Carter) (kg) | Forwards | Midfielders | 1.15 ± 0.34 | 0.005 | 0.25; 2.04 |
| Fat mass (Faulkner) (kg) | Forwards | Midfielders | 1.66 ± 0.40 | 0.000 | 0.58; 2.73 |
| Forwards | Defenders | 1.20 ± 0.41 | 0.025 | 0.10; 2.30 | |
| Fat mass (Willmore) (kg) | Forwards | Midfielders | 1.56 ± 0.52 | 0.018 | 0.18; 2.93 |
| Adipose tissue (Kerr) (kg) | Forwards | Midfielders | 2.21 ± 0.76 | 0.023 | 0.19; 4.23 |
| Muscle mass (Lee) (kg) | Forwards | Midfielders | 3.79 ± 1.17 | 0.009 | 0.66; 6.93 |
| Bone mass (Rocha) (kg) | Midfielders | Goalkeepers | −1.60 ± 0.53 | 0.017 | −3.02; −0.19 |
| Residual mass (kg) | Forwards | Midfielders | 3.65 ± 1.26 | 0.027 | 0.27; 7.02 |
| Body mass index (kg/m2) | Forwards | Midfielders | 1.60 ± 0.48 | 0.007 | 0.31; 2.88 |
| Percentile | 10 | 20 | 30 | 40 | 50 | 60 | 70 | 80 | 90 | 100 |
|---|---|---|---|---|---|---|---|---|---|---|
| Second division | ||||||||||
| Body mass (kg) | 66.57 | 69.00 | 72.45 | 74.88 | 76.00 | 77.12 | 80.17 | 82.50 | 84.13 | 90.90 |
| Stretch stature (cm) | 172.00 | 175.76 | 178.00 | 180.00 | 180.90 | 182.10 | 185.49 | 186.06 | 190.00 | 193.00 |
| Triceps skinfold (mm) | 3.20 | 3.80 | 4.21 | 4.96 | 5.40 | 6.00 | 6.40 | 7.32 | 8.06 | 9.40 |
| Subscapular skinfold (mm) | 5.80 | 6.28 | 7.00 | 7.08 | 7.45 | 7.82 | 8.40 | 8.86 | 9.52 | 13.30 |
| Biceps skinfold (mm) | 2.60 | 2.80 | 3.01 | 3.20 | 3.70 | 4.12 | 6.07 | 7.00 | 7.75 | 10.50 |
| Iliac crest skinfold (mm) | 4.97 | 5.70 | 6.20 | 7.00 | 7.10 | 7.82 | 8.79 | 9.52 | 10.60 | 13.40 |
| Supraspinale skinfold (mm) | 4.27 | 4.60 | 5.00 | 5.40 | 5.80 | 6.00 | 6.59 | 7.52 | 8.86 | 14.90 |
| Abdominal skinfold (mm) | 5.80 | 6.10 | 6.60 | 6.88 | 7.45 | 8.10 | 8.98 | 10.10 | 11.53 | 14.80 |
| Thigh skinfold (mm) | 5.20 | 6.00 | 6.22 | 7.00 | 7.60 | 8.24 | 9.19 | 10.10 | 11.29 | 14.40 |
| Calf skinfold (mm) | 3.20 | 3.60 | 3.80 | 4.00 | 4.20 | 4.52 | 4.80 | 5.20 | 6.00 | 10.10 |
| Arm relaxed girth (cm) | 28.24 | 29.16 | 29.92 | 30.16 | 30.60 | 31.20 | 31.50 | 32.20 | 33.12 | 35.70 |
| Arm flexed and tensed girth (cm) | 31.43 | 32.50 | 33.09 | 33.50 | 34.00 | 34.40 | 34.80 | 35.38 | 36.27 | 40.00 |
| Waist girth (cm) | 74.09 | 75.86 | 77.49 | 78.62 | 79.30 | 80.00 | 80.55 | 81.38 | 82.41 | 87.80 |
| Hip girth (cm) | 93.00 | 95.36 | 96.95 | 99.10 | 99.90 | 100.98 | 101.51 | 102.16 | 105.00 | 109.20 |
| Thigh middle girth (cm) | 50.64 | 52.00 | 53.22 | 54.16 | 55.00 | 55.62 | 56.08 | 56.84 | 58.50 | 62.50 |
| Calf girth (cm) | 35.00 | 35.98 | 36.60 | 37.10 | 37.65 | 38.02 | 38.70 | 39.30 | 40.16 | 42.20 |
| Humerus breadth (cm) | 6.70 | 7.00 | 7.10 | 7.20 | 7.30 | 7.40 | 7.60 | 7.70 | 7.97 | 8.80 |
| Bi-styloid breadth (cm) | 5.50 | 5.60 | 5.70 | 5.80 | 6.00 | 6.00 | 6.10 | 6.12 | 6.30 | 7.40 |
| Femur breadth (cm) | 9.60 | 9.80 | 10.00 | 10.20 | 10.20 | 10.30 | 10.50 | 10.60 | 10.90 | 11.40 |
| Sum of three skinfolds (cm) | 10.80 | 12.28 | 13.61 | 16.72 | 18.25 | 20.20 | 21.80 | 24.44 | 26.73 | 34.10 |
| Sum of six skinfolds (cm) | 30.14 | 33.34 | 34.92 | 37.16 | 38.95 | 40.74 | 44.77 | 46.80 | 49.81 | 64.40 |
| Sum of eight skinfolds (cm) | 40.70 | 44.08 | 47.65 | 49.16 | 51.60 | 56.22 | 57.97 | 60.06 | 64.85 | 80.30 |
| Corrected arm girth (cm) | 26.30 | 27.34 | 27.96 | 28.51 | 28.95 | 29.56 | 30.23 | 30.62 | 31.85 | 34.54 |
| Corrected thigh girth (cm) | 48.26 | 49.53 | 50.69 | 51.57 | 52.40 | 53.01 | 53.78 | 54.07 | 55.26 | 60.55 |
| Corrected calf girth (cm) | 33.56 | 34.50 | 35.23 | 35.59 | 36.23 | 36.63 | 37.13 | 37.90 | 38.84 | 41.01 |
| Sum of corrected girths (cm) | 109.30 | 112.83 | 114.27 | 116.46 | 118.33 | 119.61 | 120.68 | 122.29 | 124.45 | 131.87 |
| Fat mass (Carter) (kg) | 4.01 | 4.41 | 4.71 | 4.91 | 5.07 | 5.25 | 5.54 | 5.88 | 6.22 | 7.83 |
| Fat mass (Carter) (%) | 5.75 | 6.09 | 6.26 | 6.49 | 6.68 | 6.87 | 7.29 | 7.50 | 7.82 | 9.35 |
| Fat mass (Faulkner) (kg) | 6.26 | 6.75 | 7.09 | 7.35 | 7.54 | 7.74 | 7.95 | 8.42 | 9.02 | 10.37 |
| Fat mass (Faulkner) (%) | 8.99 | 9.33 | 9.49 | 9.64 | 9.84 | 10.09 | 10.39 | 10.72 | 11.02 | 12.53 |
| Fat mass (Willmore) (kg) | 3.97 | 4.60 | 5.14 | 5.44 | 5.67 | 5.98 | 6.23 | 6.60 | 7.70 | 10.75 |
| Fat mass (Willmore) (%) | 5.79 | 6.21 | 6.65 | 7.06 | 7.47 | 7.71 | 8.30 | 9.01 | 9.47 | 12.84 |
| Adipose tissue (Kerr) (kg) | 12.00 | 13.29 | 13.71 | 14.11 | 14.52 | 15.27 | 15.78 | 16.58 | 17.58 | 20.94 |
| Adipose tissue (Kerr) (%) | 17.00 | 17.90 | 18.49 | 18.70 | 19.22 | 19.83 | 20.70 | 21.47 | 22.84 | 25.03 |
| Muscle mass (Lee) (kg) | 31.23 | 33.01 | 33.68 | 34.37 | 35.15 | 36.36 | 37.16 | 38.03 | 38.77 | 42.93 |
| Muscle mass (Lee) (%) | 43.50 | 44.50 | 45.13 | 45.76 | 46.28 | 46.86 | 47.76 | 48.63 | 49.52 | 51.65 |
| Bone mass (Rocha) (kg) | 11.82 | 12.17 | 12.53 | 12.93 | 13.24 | 13.50 | 13.86 | 14.31 | 14.81 | 16.39 |
| Bone mass (Rocha) (%) | 16.30 | 16.68 | 16.99 | 17.27 | 17.55 | 17.86 | 18.03 | 18.41 | 18.99 | 21.20 |
| Residual mass (kg) | 8.77 | 10.31 | 11.30 | 12.09 | 12.47 | 13.85 | 15.30 | 16.42 | 17.80 | 22.14 |
| Residual mass (%) | 13.22 | 14.76 | 15.82 | 16.61 | 17.27 | 18.03 | 18.38 | 19.44 | 21.30 | 25.74 |
| Endomorphy | 1.73 | 1.87 | 2.04 | 2.12 | 2.22 | 2.30 | 2.45 | 2.56 | 2.72 | 3.48 |
| Mesomorphy | 4.33 | 4.72 | 4.91 | 5.13 | 5.47 | 5.65 | 6.02 | 6.38 | 6.79 | 8.09 |
| Ectomorphy | 1.76 | 2.13 | 2.44 | 2.64 | 2.84 | 2.96 | 3.16 | 3.37 | 3.71 | 5.01 |
| Z sum of six skinfolds | −2.58 | −2.50 | −2.46 | −2.40 | −2.35 | −2.31 | −2.21 | −2.15 | −2.08 | −1.71 |
| Body mass index (kg/m2) | 21.42 | 22.06 | 22.37 | 22.72 | 22.96 | 23.39 | 23.71 | 24.26 | 24.93 | 29.07 |
| Waist-to-hip ratio | 0.76 | 0.77 | 0.78 | 0.79 | 0.79 | 0.81 | 0.81 | 0.81 | 0.83 | 0.87 |
| Fat distribution index | 0.63 | 0.69 | 0.74 | 0.78 | 0.82 | 0.86 | 0.92 | 0.97 | 1.04 | 1.31 |
| Second B division | ||||||||||
| Body mass (kg) | 65.50 | 68.34 | 70.80 | 72.70 | 74.30 | 76.00 | 78.00 | 80.58 | 84.00 | 95.90 |
| Stretch stature (cm) | 172.00 | 174.00 | 176.00 | 178.00 | 180.00 | 181.50 | 184.00 | 185.26 | 188.00 | 197.00 |
| Triceps skinfold (mm) | 3.00 | 3.50 | 4.44 | 5.00 | 5.90 | 6.40 | 7.00 | 7.44 | 8.74 | 14.80 |
| Subscapular skinfold (mm) | 6.00 | 6.50 | 7.00 | 7.40 | 7.60 | 8.00 | 8.50 | 9.00 | 9.80 | 15.00 |
| Biceps skinfold (mm) | 2.33 | 2.50 | 3.00 | 3.00 | 3.20 | 3.58 | 4.00 | 5.00 | 6.94 | 12.50 |
| Iliac crest skinfold (mm) | 5.40 | 6.00 | 6.99 | 7.42 | 8.10 | 9.00 | 10.10 | 11.20 | 13.00 | 20.50 |
| Supraspinale skinfold (mm) | 4.50 | 5.00 | 5.40 | 6.02 | 6.50 | 7.00 | 7.50 | 8.50 | 9.50 | 16.60 |
| Abdominal skinfold (mm) | 5.80 | 6.46 | 7.00 | 7.60 | 8.60 | 9.50 | 10.31 | 11.50 | 14.91 | 23.00 |
| Thigh skinfold (mm) | 5.73 | 6.40 | 7.00 | 7.70 | 8.25 | 9.00 | 9.80 | 11.00 | 12.44 | 21.00 |
| Calf skinfold (mm) | 3.50 | 3.80 | 4.00 | 4.40 | 4.65 | 5.00 | 5.50 | 6.00 | 6.60 | 12.70 |
| Arm relaxed girth (cm) | 28.20 | 28.90 | 29.48 | 30.00 | 30.50 | 30.90 | 31.20 | 31.58 | 32.20 | 36.10 |
| Arm flexed and tensed girth (cm) | 30.50 | 31.30 | 32.10 | 32.60 | 33.00 | 33.40 | 33.90 | 34.58 | 35.04 | 38.90 |
| Waist girth (cm) | 73.56 | 74.80 | 76.00 | 76.84 | 77.50 | 78.26 | 79.50 | 80.98 | 82.38 | 93.90 |
| Hip girth (cm) | 90.86 | 92.00 | 92.80 | 93.82 | 94.90 | 95.96 | 97.02 | 98.00 | 100.58 | 107.00 |
| Thigh middle girth (cm) | 50.46 | 52.02 | 53.00 | 53.80 | 54.70 | 55.46 | 56.20 | 57.08 | 58.19 | 62.60 |
| Calf girth (cm) | 34.70 | 35.42 | 36.20 | 36.70 | 37.00 | 37.20 | 37.82 | 38.40 | 39.70 | 70.60 |
| Humerus breadth (cm) | 6.30 | 6.60 | 6.70 | 6.80 | 6.90 | 7.00 | 7.10 | 7.20 | 7.40 | 7.80 |
| Bi-styloid breadth (cm) | 5.20 | 5.40 | 5.50 | 5.60 | 5.70 | 5.70 | 5.80 | 6.00 | 6.20 | 7.50 |
| Femur breadth (cm) | 9.16 | 9.40 | 9.50 | 9.70 | 9.90 | 10.00 | 10.00 | 10.20 | 10.40 | 11.30 |
| Sum of three skinfolds (cm) | 17.30 | 19.00 | 20.00 | 21.50 | 23.50 | 25.06 | 27.26 | 30.48 | 36.04 | 53.00 |
| Sum of six skinfolds (cm) | 32.03 | 34.56 | 37.12 | 39.50 | 41.25 | 43.50 | 47.00 | 50.38 | 55.49 | 81.90 |
| Sum of eight skinfolds (cm) | 42.80 | 46.15 | 49.00 | 51.40 | 54.25 | 56.76 | 61.01 | 65.16 | 73.14 | 103.30 |
| Corrected arm girth (cm) | 26.27 | 27.01 | 27.50 | 28.05 | 28.50 | 28.94 | 29.40 | 29.93 | 30.84 | 35.63 |
| Corrected thigh girth (cm) | 47.92 | 49.19 | 50.14 | 51.40 | 52.16 | 52.48 | 53.30 | 54.07 | 55.60 | 60.12 |
| Corrected calf girth (cm) | 33.15 | 33.85 | 34.51 | 35.02 | 35.31 | 35.74 | 36.34 | 36.79 | 38.09 | 69.50 |
| Sum of corrected girths (cm) | 108.58 | 111.88 | 112.91 | 114.71 | 115.96 | 117.20 | 118.84 | 120.53 | 123.68 | 151.60 |
| Fat mass (Carter) (kg) | 4.24 | 4.48 | 4.69 | 4.91 | 5.24 | 5.45 | 5.66 | 6.03 | 6.52 | 10.63 |
| Fat mass (Carter) (%) | 5.95 | 6.22 | 6.49 | 6.74 | 6.92 | 7.16 | 7.52 | 7.88 | 8.42 | 11.19 |
| Fat mass (Faulkner) (kg) | 6.33 | 6.67 | 6.95 | 7.19 | 7.64 | 7.92 | 8.23 | 8.64 | 9.42 | 13.56 |
| Fat mass (Faulkner) (%) | 9.15 | 9.39 | 9.62 | 9.84 | 10.19 | 10.43 | 10.76 | 11.22 | 12.02 | 14.27 |
| Fat mass (Willmore) (kg) | 4.66 | 5.04 | 5.36 | 5.70 | 6.12 | 6.38 | 6.81 | 7.30 | 8.34 | 14.31 |
| Fat mass (Willmore) (%) | 6.48 | 6.98 | 7.48 | 7.80 | 8.16 | 8.50 | 9.08 | 9.70 | 10.82 | 15.07 |
| Adipose tissue (Kerr) (kg) | 12.51 | 13.24 | 13.86 | 14.31 | 14.89 | 15.64 | 16.30 | 17.01 | 18.15 | 24.60 |
| Adipose tissue (Kerr) (%) | 17.65 | 18.30 | 18.78 | 19.56 | 20.39 | 21.02 | 21.59 | 22.27 | 23.80 | 28.34 |
| Muscle mass (Lee) (kg) | 30.50 | 31.73 | 32.80 | 33.68 | 34.40 | 35.11 | 35.82 | 36.71 | 38.39 | 63.87 |
| Muscle mass (Lee) (%) | 43.07 | 44.32 | 45.17 | 45.64 | 46.15 | 46.63 | 47.21 | 48.22 | 49.62 | 79.53 |
| Bone mass (Rocha) (kg) | 10.67 | 11.09 | 11.55 | 12.13 | 12.45 | 12.75 | 13.09 | 13.39 | 14.14 | 15.76 |
| Bone mass (Rocha) (%) | 15.06 | 15.48 | 15.86 | 16.22 | 16.64 | 16.98 | 17.30 | 17.59 | 18.11 | 23.69 |
| Residual mass (kg) | 8.38 | 9.96 | 10.73 | 11.51 | 12.62 | 13.22 | 14.48 | 15.39 | 17.48 | 26.06 |
| Residual mass (%) | 12.82 | 14.49 | 15.20 | 16.13 | 16.77 | 18.26 | 19.07 | 19.80 | 20.86 | 27.17 |
| Endomorphy | 1.70 | 1.91 | 2.04 | 2.15 | 2.28 | 2.45 | 2.56 | 2.72 | 3.08 | 3.88 |
| Mesomorphy | 3.46 | 4.00 | 4.21 | 4.41 | 4.65 | 4.91 | 5.10 | 5.36 | 5.77 | 10.86 |
| Ectomorphy | 1.79 | 2.07 | 2.36 | 2.56 | 2.72 | 2.93 | 3.15 | 3.40 | 3.66 | 4.52 |
| Z sum of six skinfolds | −2.53 | −2.47 | −2.40 | −2.34 | −2.30 | −2.24 | −2.15 | −2.06 | −1.93 | −1.26 |
| Body mass index (kg/m2) | 21.47 | 21.83 | 22.21 | 22.54 | 22.90 | 23.23 | 23.75 | 24.14 | 24.76 | 27.46 |
| Waist-to-hip ratio | 0.78 | 0.79 | 0.80 | 0.81 | 0.82 | 0.82 | 0.83 | 0.84 | 0.85 | 0.91 |
| Fat distribution index | 0.59 | 0.67 | 0.72 | 0.78 | 0.82 | 0.85 | 0.91 | 0.98 | 1.14 | 1.87 |
| Third division | ||||||||||
| Body mass (kg) | 65.60 | 69.20 | 70.90 | 72.40 | 73.30 | 75.40 | 78.20 | 80.10 | 83.10 | 93.50 |
| Stretch stature (cm) | 172.10 | 175.00 | 176.30 | 178.00 | 180.00 | 181.00 | 182.50 | 184.00 | 187.00 | 194.80 |
| Triceps skinfold (mm) | 4.00 | 5.00 | 5.28 | 6.00 | 6.50 | 7.00 | 7.50 | 8.74 | 9.50 | 14.50 |
| Subscapular skinfold (mm) | 6.00 | 6.50 | 7.00 | 7.04 | 7.50 | 7.80 | 8.20 | 8.50 | 9.50 | 12.50 |
| Biceps skinfold (mm) | 2.40 | 2.58 | 2.80 | 3.00 | 3.00 | 3.50 | 4.00 | 4.02 | 4.91 | 6.50 |
| Iliac crest skinfold (mm) | 6.00 | 6.88 | 7.20 | 8.46 | 9.10 | 10.00 | 11.00 | 12.00 | 13.62 | 20.50 |
| Supraspinale skinfold (mm) | 4.20 | 4.72 | 5.00 | 5.40 | 5.80 | 6.20 | 6.62 | 7.40 | 8.88 | 14.00 |
| Abdominal skinfold (mm) | 6.00 | 7.00 | 7.60 | 8.40 | 9.00 | 10.46 | 12.04 | 14.48 | 16.00 | 23.10 |
| Thigh skinfold (mm) | 5.56 | 6.50 | 7.40 | 8.00 | 8.90 | 10.00 | 10.84 | 11.80 | 13.00 | 21.00 |
| Calf skinfold (mm) | 3.32 | 3.64 | 4.00 | 4.44 | 5.00 | 5.20 | 6.00 | 6.38 | 7.00 | 14.50 |
| Arm relaxed girth (cm) | 27.68 | 28.76 | 29.20 | 29.70 | 30.05 | 30.58 | 31.40 | 32.00 | 33.00 | 37.40 |
| Arm flexed and tensed girth (cm) | 30.30 | 31.04 | 31.70 | 32.00 | 32.55 | 33.20 | 33.98 | 34.50 | 35.50 | 40.20 |
| Waist girth (cm) | 71.91 | 73.94 | 75.23 | 76.32 | 77.00 | 77.76 | 78.84 | 80.68 | 82.89 | 91.30 |
| Hip girth (cm) | 90.00 | 91.52 | 93.80 | 94.44 | 95.30 | 96.52 | 98.20 | 99.64 | 101.63 | 110.60 |
| Thigh middle girth (cm) | 49.50 | 51.40 | 52.00 | 53.20 | 53.95 | 54.60 | 55.20 | 56.06 | 57.66 | 60.70 |
| Calf girth (cm) | 34.65 | 35.36 | 36.40 | 36.88 | 37.45 | 37.80 | 38.29 | 38.70 | 39.93 | 42.30 |
| Humerus breadth (cm) | 6.60 | 6.80 | 6.80 | 6.94 | 7.00 | 7.10 | 7.20 | 7.30 | 7.50 | 8.00 |
| Bi-styloid breadth (cm) | 5.30 | 5.50 | 5.60 | 5.80 | 5.80 | 5.90 | 6.02 | 6.10 | 6.30 | 9.50 |
| Femur breadth (cm) | 9.26 | 9.40 | 9.60 | 9.70 | 9.90 | 9.90 | 10.00 | 10.20 | 10.40 | 11.00 |
| Sum of three skinfolds (cm) | 17.06 | 18.54 | 20.16 | 21.66 | 23.80 | 26.00 | 29.42 | 32.96 | 36.96 | 52.00 |
| Sum of six skinfolds (cm) | 32.50 | 35.20 | 37.00 | 40.40 | 42.00 | 45.80 | 49.30 | 53.50 | 60.00 | 83.00 |
| Sum of eight skinfolds (cm) | 41.20 | 46.20 | 47.70 | 50.50 | 54.00 | 58.20 | 63.85 | 69.50 | 76.05 | 107.50 |
| Corrected arm girth (cm) | 25.64 | 26.50 | 27.16 | 27.52 | 28.02 | 28.50 | 29.20 | 29.92 | 30.77 | 35.26 |
| Corrected thigh girth (cm) | 46.78 | 48.25 | 49.21 | 50.04 | 51.01 | 51.65 | 52.32 | 53.21 | 54.66 | 57.68 |
| Corrected calf girth (cm) | 33.00 | 34.02 | 34.70 | 35.34 | 35.73 | 36.05 | 36.76 | 37.31 | 38.34 | 41.04 |
| Sum of corrected girths (cm) | 106.58 | 108.69 | 110.90 | 113.49 | 114.73 | 116.12 | 117.76 | 119.34 | 122.59 | 130.31 |
| Fat mass (Carter) (kg) | 4.18 | 4.51 | 4.73 | 4.95 | 5.20 | 5.40 | 5.86 | 6.28 | 7.15 | 10.01 |
| Fat mass (Carter) (%) | 6.00 | 6.28 | 6.47 | 6.83 | 7.00 | 7.40 | 7.77 | 8.21 | 8.89 | 11.31 |
| Fat mass (Faulkner) (kg) | 6.40 | 6.71 | 7.05 | 7.27 | 7.61 | 7.88 | 8.31 | 9.08 | 9.70 | 12.36 |
| Fat mass (Faulkner) (%) | 9.15 | 9.47 | 9.76 | 9.94 | 10.16 | 10.53 | 10.99 | 11.60 | 12.35 | 14.31 |
| Fat mass (Willmore) (kg) | 4.39 | 5.00 | 5.28 | 5.66 | 6.08 | 6.42 | 7.26 | 7.88 | 9.25 | 13.47 |
| Fat mass (Willmore) (%) | 6.39 | 6.93 | 7.23 | 7.74 | 8.33 | 8.88 | 9.50 | 10.39 | 11.43 | 15.23 |
| Adipose tissue (Kerr) (kg) | 12.67 | 13.31 | 13.85 | 14.55 | 15.15 | 15.67 | 16.38 | 17.78 | 19.07 | 24.11 |
| Adipose tissue (Kerr) (%) | 17.55 | 18.57 | 19.27 | 20.17 | 20.65 | 21.00 | 22.17 | 22.90 | 24.17 | 28.95 |
| Muscle mass (Lee) (kg) | 30.28 | 31.21 | 32.25 | 32.98 | 33.60 | 34.51 | 35.48 | 36.43 | 38.11 | 44.41 |
| Muscle mass (Lee) (%) | 42.78 | 43.85 | 44.33 | 45.10 | 45.60 | 46.36 | 46.79 | 47.73 | 49.05 | 51.91 |
| Bone mass (Rocha) (kg) | 10.86 | 11.47 | 11.84 | 12.19 | 12.48 | 12.91 | 13.36 | 13.71 | 14.31 | 17.53 |
| Bone mass (Rocha) (%) | 15.31 | 15.89 | 16.48 | 16.81 | 17.21 | 17.36 | 17.71 | 18.02 | 18.50 | 25.71 |
| Residual mass (kg) | 8.47 | 10.18 | 10.99 | 11.55 | 12.41 | 12.92 | 13.88 | 14.67 | 15.59 | 29.76 |
| Residual mass (%) | 12.50 | 14.08 | 15.45 | 16.28 | 17.07 | 17.67 | 17.99 | 18.66 | 20.05 | 32.81 |
| Endomorphy | 1.80 | 1.96 | 2.08 | 2.16 | 2.26 | 2.43 | 2.60 | 2.79 | 3.15 | 3.94 |
| Mesomorphy | 3.78 | 4.05 | 4.37 | 4.61 | 4.79 | 5.03 | 5.27 | 5.51 | 5.88 | 6.96 |
| Ectomorphy | 1.85 | 2.10 | 2.33 | 2.51 | 2.75 | 2.89 | 3.11 | 3.29 | 3.71 | 5.28 |
| Z sum of six skinfolds | −2.52 | −2.45 | −2.40 | −2.32 | −2.28 | −2.18 | −2.09 | −1.98 | −1.82 | −1.23 |
| Body mass index (kg/m2) | 21.36 | 21.82 | 22.19 | 22.63 | 22.99 | 23.28 | 23.65 | 24.19 | 25.17 | 26.62 |
| Waist-to-hip ratio | 0.76 | 0.77 | 0.79 | 0.80 | 0.81 | 0.82 | 0.83 | 0.84 | 0.86 | 0.92 |
| Fat distribution index | 0.66 | 0.73 | 0.78 | 0.80 | 0.86 | 0.91 | 0.97 | 1.04 | 1.18 | 1.61 |
Disclaimer/Publisher’s Note: The statements, opinions and data contained in all publications are solely those of the individual author(s) and contributor(s) and not of MDPI and/or the editor(s). MDPI and/or the editor(s) disclaim responsibility for any injury to people or property resulting from any ideas, methods, instructions or products referred to in the content. |
© 2023 by the authors. Licensee MDPI, Basel, Switzerland. This article is an open access article distributed under the terms and conditions of the Creative Commons Attribution (CC BY) license (https://creativecommons.org/licenses/by/4.0/).
Share and Cite
Porta, M.; Sebastiá-Rico, J.; Martínez-Sanz, J.M.; Contreras, C.; Vaquero-Cristóbal, R.; López-Cáceres, P.A. Anthropometric Values in Spanish Elite Soccer: Differences between Divisions and Playing Positions. Appl. Sci. 2023, 13, 11441. https://doi.org/10.3390/app132011441
Porta M, Sebastiá-Rico J, Martínez-Sanz JM, Contreras C, Vaquero-Cristóbal R, López-Cáceres PA. Anthropometric Values in Spanish Elite Soccer: Differences between Divisions and Playing Positions. Applied Sciences. 2023; 13(20):11441. https://doi.org/10.3390/app132011441
Chicago/Turabian StylePorta, Mireia, Jaime Sebastiá-Rico, José Miguel Martínez-Sanz, Carlos Contreras, Raquel Vaquero-Cristóbal, and Pablo A. López-Cáceres. 2023. "Anthropometric Values in Spanish Elite Soccer: Differences between Divisions and Playing Positions" Applied Sciences 13, no. 20: 11441. https://doi.org/10.3390/app132011441