Article

Experimental Study on the Electrical Resistivity Characteristics of Uniformly Graded Calcareous Sand

1
School of Civil Engineering and Architecture, Jiangsu University of Science and Technology, Zhenjiang 212100, China
2
Training Base, PLA Army Engineering University, Xuzhou 221000, China
*
Author to whom correspondence should be addressed.
Appl. Sci. 2023, 13(20), 11467; https://doi.org/10.3390/app132011467
Submission received: 10 July 2023 / Revised: 21 September 2023 / Accepted: 25 September 2023 / Published: 19 October 2023
(This article belongs to the Section Civil Engineering)

Abstract

:
The resistivity of calcareous sand is one of its inherent physical characteristic parameters, and the study of the resistivity characteristics of calcareous sand is of great significance in the subsequent study of the relationship between the resistivity of calcareous sand under different loads and its mechanical properties. This study uses alternating current (AC) electrical resistance testing equipment based on the two-electrode method to study the effects of pore water, temperature, relative density, saturation, and other factors on the resistivity of calcareous sand. We used the experimental results to analyze in detail the effects of various influencing factors on the resistivity of calcareous sand and established a relationship between them. Research has shown that as the temperature increases, the conductivity of the medium in the solution increases and the resistivity decreases. The resistivity of the calcareous sand of the three size fractions decreases with increasing saturation, and the relationship between them is a power function. The resistivity of saturated calcareous sand with three size fractions increases with increasing density, and the two show a good linear relationship. The results of this research can provide support for the study of the relationship between the resistivity and mechanical properties of calcareous sand under different loads.

1. Introduction

Resistivity testing has the advantages of continuity, non-destructiveness, speed, and convenience. The electrical resistivity of soil is a basic parameter that characterizes the electrical conductivity of soil and is one of the inherent characteristic physical parameters of soil. Currently, the application of resistivity testing in the field of geotechnical engineering has attracted increasing attention from scholars. By continuously testing the resistivity during the deformation of soil, the microstructure deformation characteristics of soil can be accurately measured, thus achieving quantitative evaluation of soil microstructure [1,2].
As one of the physical property indicators of soil, resistivity can reflect the structure and engineering characteristics of soil to a certain extent [1,3,4,5] and is influenced by many factors, such as water content, soil structure, pore solution properties, and environmental temperature [6,7,8,9].
When an electric current passes through rock and soil, the ions in the pore water of the rock and soil move under the action of the electric current, and the difficulty with which these ions pass through the pore system of the rock and soil under the action of the electric current determines the resistivity of the rock and soil [10]. The electrical resistivity of soil is actually the magnitude of the resistance that occurs when a current passes vertically through a cube of soil with a side length of 1 m. The unit of electrical resistivity is Ω·m. The resistivity of soil can be obtained by measuring the voltage drop ΔV between two electrodes under a constant current. The soil resistance R is calculated according to Ohm’s law, and the resistivity of a sample ρ is determined as follows:
ρ = R S L = Δ V S I L
For sandy soil, at a certain temperature, water content and pore water conductivity are the two determining factors of soil conductivity. The conductivity of saturated soil is composed of soil particle conductivity, pore water conductivity, and particle surface conductivity. For saturated sand, the surface of the particles carries no charge, so the surface conductivity of the particles is approximately zero [11].
Archie [8] established a resistivity model of saturated sand according to the relationship between the structure factor and porosity of sand.
ρ = α ρ w n m
In Formula (2), ρ is the electrical resistivity of the soil; ρw is the pore water resistivity; α is a soil parameter; m is the bonding coefficient; and n is the porosity.
Keller and Frischknecht [12] established a resistivity model for unsaturated sand based on the Archie model and considered the influence of saturation.
ρ = α ρ w n m S r p
In Formula (3), Sr is the soil saturation, and p is the saturation coefficient.
There is relatively little research on the resistivity characteristics of calcareous sand. Hu et al. [13] studied the relationship between the conductivity of calcareous sand, water content, and pore solution conductivity through on-site measurements and laboratory experiments and found a positive correlation. They also proposed a calculation model for the conductivity of calcareous sand. Zhu et al. [14] conducted laboratory experiments to study the changes in electrical conductivity of a single size fraction of calcareous sand with different dry densities, water contents, and pore solution concentrations but did not establish a relationship between them.
This study systematically investigates the effects of factors such as pore water resistivity, test temperature, sample saturation, and relative density on the resistivity of calcareous sand samples through laboratory experiments and establishes a quantitative relationship between the resistivity of calcareous sand and the salt content and saturation of pore water. This study can lay the foundation for establishing the relationship between resistivity and the fragmentation of calcareous sand particles.
The rest of this paper is organized as follows. The devices and plans are first introduced in Section 2. The correction of the electrical resistivity of calcareous sand is presented in Section 3. Test results and discussions are provided in Section 4. The main conclusions are drawn in Section 5.

2. Materials and Methods
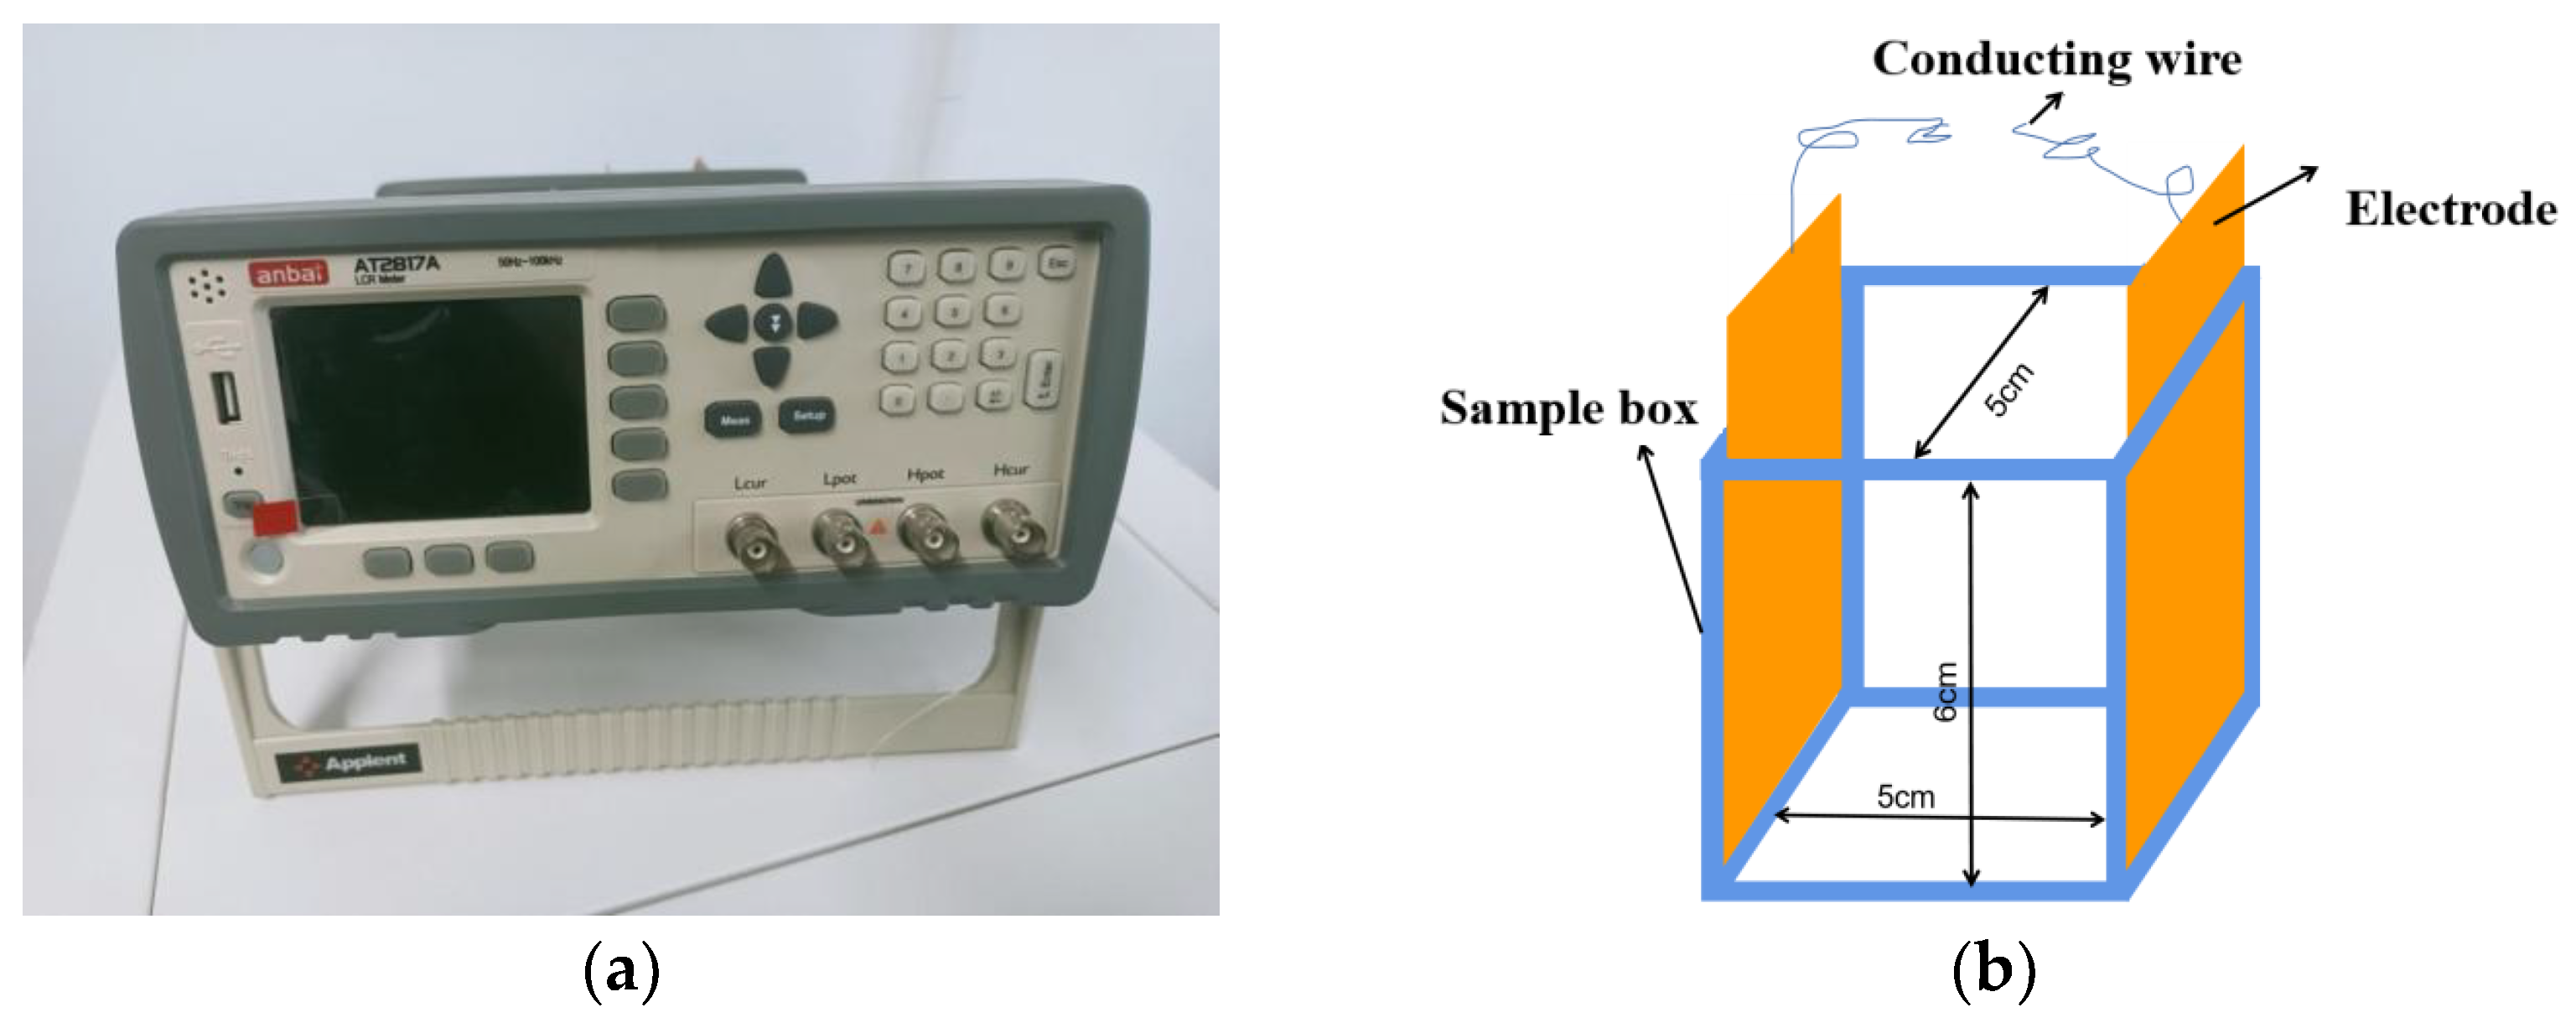
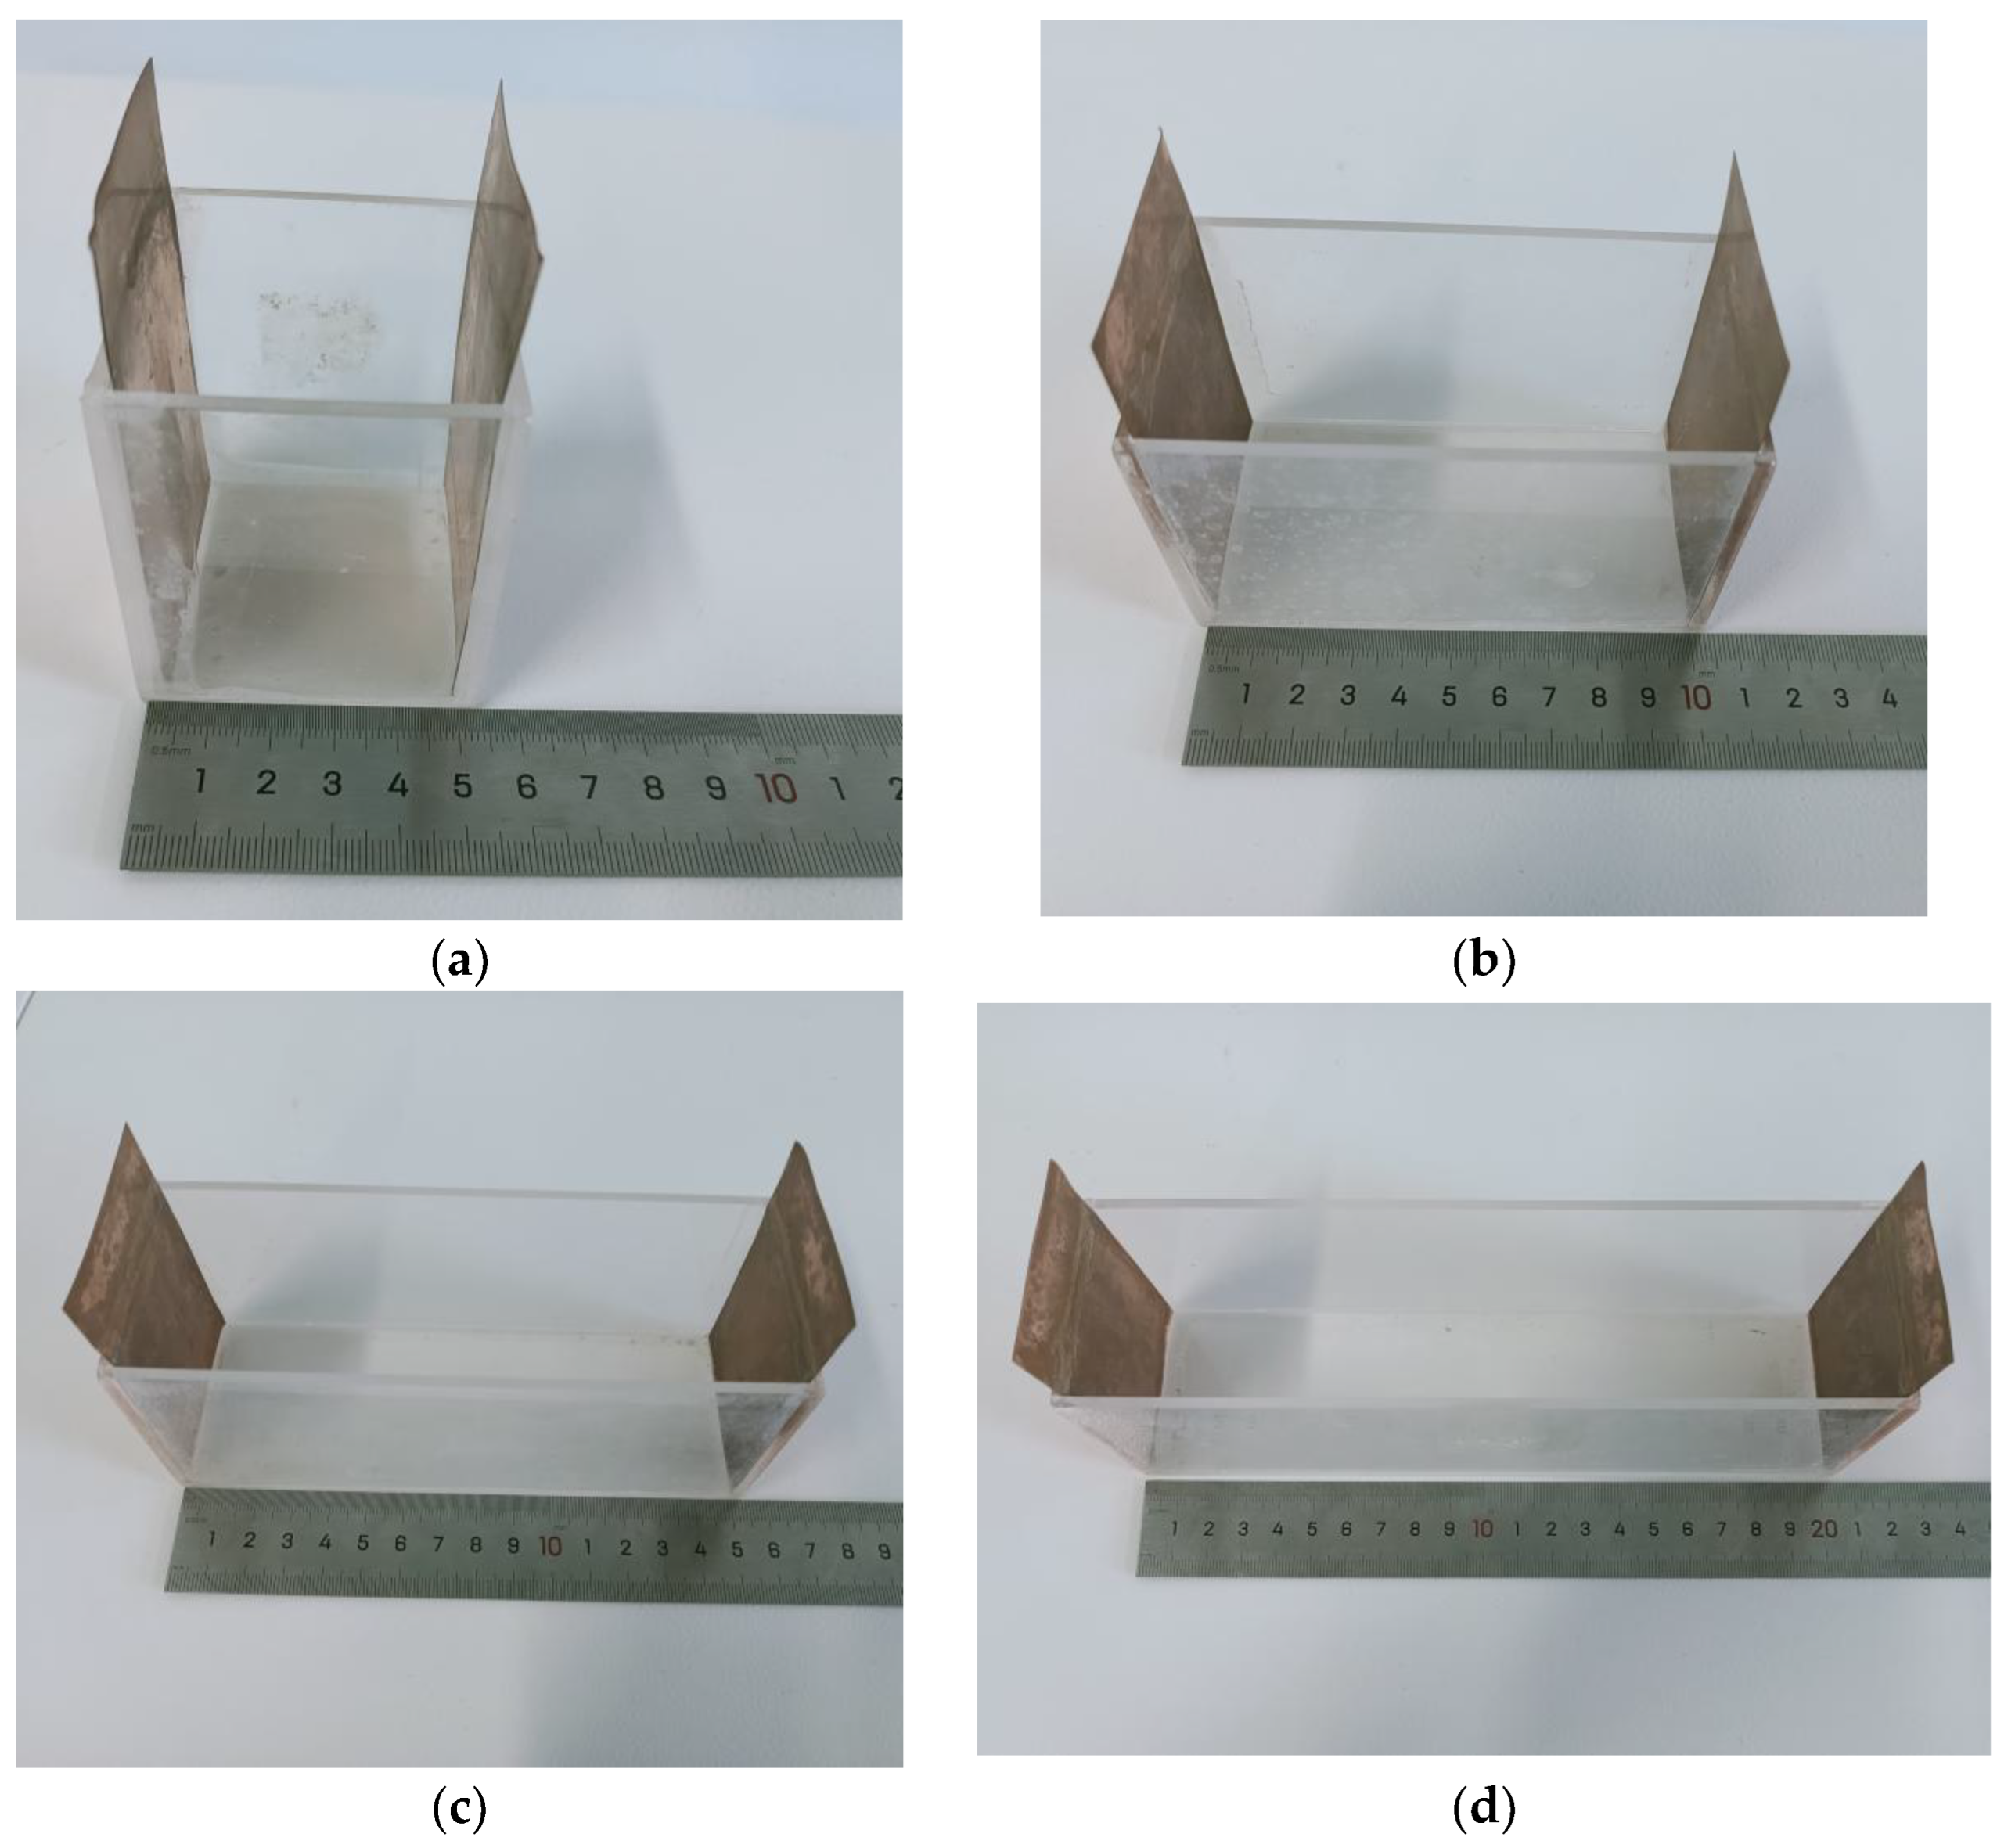
2.1. Test Devices

In this study, Anbo LCR digital bridge was used to test the resistance of calcareous sand samples under different experimental conditions, and the resistivity of calcareous sand samples was calculated using Formula (1) to study the resistivity characteristics of calcareous sand samples. This instrument was a two-electrode alternating current (AC) electrical testing instrument, which adopted a high-performance 32 ARM microprocessor to control fully automatic real-time monitoring with a micro desktop instrument. The instrument could choose any testing frequency between 10 Hz and 300 kHz and a testing signal level between 0.01 V and 2 V in steps of 0.01. The accuracy of resistance testing reached 0.05%, and the testing instrument is shown in Figure 1. Using an AC power source for testing could eliminate measurement errors caused by electrode polarization effects [15].

2.2. Test Material

The calcareous sand used in this experiment was obtained from a certain island and reef in the South China Sea. The calcareous sand samples were dried and screened using the screening method to obtain three types of samples with size fractions of 1–1.5 mm, 1.5–2 mm, and 2–2.5 mm, as shown in Figure 2. The basic physical characteristic parameters of the three types of calcareous sand are shown in Table 1.

2.3. Test Setup

(1)
The surface of the dried calcareous sand particles may have contained salt and dust. Pure water was used to repeatedly clean the dried calcareous sand.
(2)
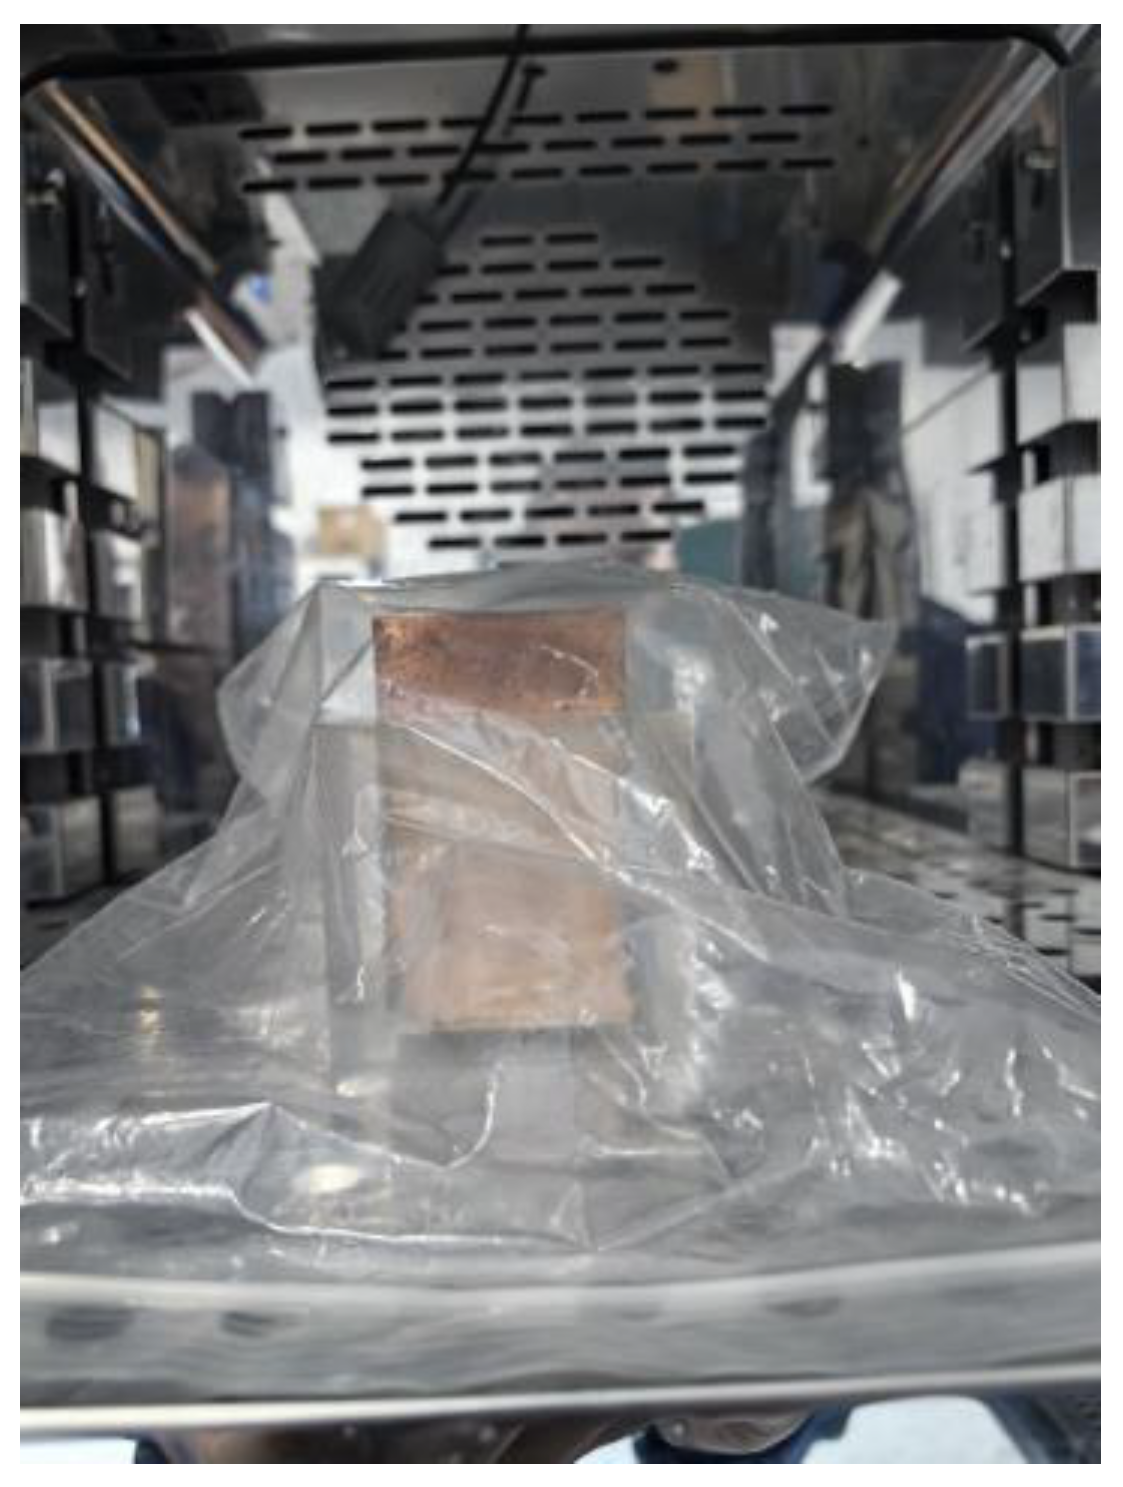
The cleaned calcareous sand was placed in an oven and dried at 105~110 °C for at least 8 h. The sand was taken out of the oven and placed in a bag for later use.
(3)
After drying, a soil sieve was used to shake and sieve the calcium sand for 10 min to obtain three types of calcium sand with size fractions of 1–1.5 mm, 1.5–2 mm, and 2–2.5 mm. They were placed in separate bags for future use.
(4)
According to the experimental plan, certain amounts of calcareous sand and water were weighed, mixed evenly, put into a bag, sealed, and allowed to stand for 24 h.
(5)
A sample was inserted into the sample box, the electrodes were connected at both ends of the sample to the digital bridge measurement port, and the resistance value was read. The data reading was completed within seconds, ignoring the impact of the sample’s previous electrification on the test results [16]. Simultaneously, the indoor temperature was controlled within the range of 20 ± 2 °C to reduce the impact of the test temperature on the results [17,18].

2.4. Test Plans

This experiment considered the effects of pore water resistivity, temperature, saturation, and relative density on the resistivity of calcareous sand. The specific test plan is shown in Table 2. To ensure the accuracy of the test results, five sets of parallel tests were conducted for each set. If at least three sets of data were similar, it indicated that the test was successful. At this time, one set of tests was considered as the test result, otherwise the test was repeated.

3. Correction of the Electrical Resistivity of Calcareous Sand

When the current passes through the contact point between the calcareous sand and the electrode, a contact resistance is generated at the contact point, mainly caused by the contraction resistance between the electrode and the medium and the oxide film on the surface of the metal electrode. Studies [16,19,20] have shown that, in the process of using the two-electrode method to test the resistivity of soil, the contact resistance between the sample and the electrode affects the results. To eliminate the influence of contact resistance, in this study, the contact resistance between the calcareous sand sample and the electrode was obtained through experiments and then corrected for the subsequent experimental results.
To obtain contact resistance, sample boxes with lengths of 5, 10, 15, and 20 cm were made, as shown in Figure 3. This experiment used a digital bridge to test the resistance of calcareous sand samples under different test conditions to calculate the corresponding contact resistance.
The following is an example to illustrate the correction method for the resistivity of calcareous sand using samples with a size fraction range of 1.5–2 mm. Figure 4 shows the relationship between the resistance and electrode spacing of samples with relative density Dr = 0.6, saturation Sr = 80% and 100%, and size fraction of 1.5–2 mm. According to the linear fitting results shown in the figure, the contact resistance R0 with saturation values Sr = 80% and 100% under this condition were 0.0768 kΩ and 0.0656 kΩ (intercept of fitting curve), respectively. The calculation method for contact resistance under other conditions is the same as above.
Based on the calculation results for the contact resistance between the calcareous sand sample and the electrode, the resistivity of the calcareous sand sample was corrected using the following formula:
ρ = R R 0 S L
In Formula (4), R is the test resistance, R0 is the contact resistance, and the meanings of the other quantities are the same as above.
The resistivity in subsequent analysis was the result corrected using Formula (4).

4. Results and Discussion

Influencing factors such as pore water resistivity, test temperature, sample saturation, and relative density have a significant impact on the resistivity of calcareous sand. The paper’s study establishes a quantitative relationship between the resistivity of calcareous sand and the salt content and saturation of pore water through laboratory experiments.

4.1. Effect of Temperature on the Electrical Resistivity of Single Size Fraction of Saturated Calcareous Sand

The resistivity reflects the conductivity of calcareous sand and is closely related to the activity of ions in the solution. The change in temperature leads to a change in ion activity, which inevitably leads to a change in resistivity.
To investigate the effect of temperature on the resistivity of saturated calcareous sand with different size fractions, an experiment was conducted to study the effect of temperature on resistivity. To prevent uneven temperature distribution in the sample caused by the heating device, which affected the resistivity test results, a constant temperature and humidity incubator was used to achieve temperature control of saturated calcareous sand samples, as shown in Figure 5. To prevent the evaporation of moisture from the sample, the sample was sealed after being placed in the sample box and then placed in the incubator. The temperature of the incubator was adjusted, and a constant temperature was maintained for at least 12 h.
Saturated calcareous sand with relative density Dr = 0.6 and size fractions of 1–1.5 mm, 1.5–2 mm, and 2–2.5 mm were selected for electrical measurements. The current frequency f = 1000 Hz and saturation Sr = 100% were used to obtain the relationship curve between the resistivity of calcareous sand and temperature, as shown in Figure 6. Temperature had a significant impact on the resistivity of calcareous sand. As the temperature increased, the resistivity gradually decreased, and the conductivity of the sample increased. The possible reasons for this behavior included the following: (1) an increase in pore water temperature will reduce its viscosity and (2) as the temperature increased, the dissociation degree of pore water increased, and at the same time, the mineralization degree of pore water also increased, leading to a decrease in electrical resistivity [21].
The relationship between the resistivity and temperature of calcareous sand samples with different size fractions could be fitted using a logarithmic function. The fitting results are shown in Table 3, and all the fitting coefficients were greater than 0.95. For calcareous sands with size fractions of 1–1.5 mm, 1.5–2 mm, and 2–2.5 mm, for each 1 °C increase in temperature, the resistance decreased by 8 Ω, 15.683 Ω, and 19.088 Ω, respectively, while the resistivity decreased by 0.48 Ω·m, 0.94 Ω·m, and 1.15 Ω·m, respectively. A further explanation was that temperature significantly affected the conductivity of calcareous sand with larger particle sizes [22]. Therefore, when conducting research on different soil resistivities, it is necessary to pay attention to the influence of temperature.
To prevent experimental errors caused by temperature, the solution and samples used in subsequent experiments were placed in a constant temperature and humidity curing box one day in advance, and the temperature was set at 20 °C.

4.2. Effect of Pore Water Resistivity on the Electrical Resistivity of Single Size Fraction of Calcareous Sand

Pore water, as an important component of soil, has a significant impact on its electrical resistivity [23]. Pure water, tap water, and NaCl solutions with concentrations of 1%, 2%, 4%, and 6% were selected as pore solutions to conduct experiments on the influence of pore water resistivity on the resistivity of calcareous sand. Six solutions were loaded into the sample box for resistivity testing, and the test results are shown in Figure 7. The electrical resistivities of pure water, tap water, and NaCl solutions with concentrations of 1%, 2%, 4%, and 6% decreased sequentially, with significant differences in electrical resistivity values. The resistivity of the pure water was as high as 550 Ω·m (not shown in Figure 7), and the resistivity of tap water was 35.316 Ω·m. The maximum resistivity of the NaCl solution was 0.862 Ω·m.
Using the above six solutions, saturated calcareous sand samples with relative density Dr = 0.6 were prepared, consisting of three size fractions: 1–1.5 mm, 1.5–2 mm, and 2–2.5 mm. To prevent differences in ion adsorption by particles [16], calcareous sand was not reused. The electrical resistivity results of these saturated calcareous sands obtained through testing are shown in Figure 8. Due to significant differences in the resistivity values of saturated calcareous sand with different solutions, the relationship between some resistivity and solution concentration is highlighted in Figure 8. The resistivity of saturated calcareous sand prepared with these six solutions showed a decreasing trend. The higher the ion concentration in pore water was, the smaller the influence of particle size on resistivity was. When the NaCl concentration reached 2%, the influence of particle size on the resistivity of saturated calcareous sand did not exceed 1 Ω·m, and the influence of particle size on the resistivity of the sample could be ignored.
The resistivity of the calcareous sand samples of the three size fractions changed with the pore water salt concentration in a power function relationship (Figure 9). As the concentration of pore water salt increased, the decrease in resistivity of calcareous sand gradually decreased. This was because as the concentration of pore water salt increased, the number of conductive ions gradually met the conductive needs of the pore water solution. When the conductive ions reached a certain amount, increasing the salt concentration no longer affected the resistivity of calcareous sand samples, and this result was the same as the research result of Song et al. [24].

4.3. Effect of Saturation on the Electrical Resistivity of Single Size Fraction of Calcareous Sand

G. Keller and F Frischknecht [12] noted that soil saturation is one of the key parameters affecting the resistivity of unsaturated soil. To study the effect of saturation on the resistivity of single size fraction of calcareous sand, a series of electrical measurement tests were conducted on calcareous sand samples with different saturation levels. The experiment was conducted at the same temperature (20 °C), relative density Dr = 0.6, and saturation Sr = 20%~100% using three size fractions of calcareous sand. Before configuring the calcareous sand sample, the pore water (20 °C, tap water) resistivity was tested to 35.316 Ω·m. The resistivity test results of calcareous sand with different saturations are shown in Figure 10.
Figure 10 shows that within the tested saturation range, the resistivity of the calcareous sand of the three size fractions decreased with increasing saturation, and the relationship between them was a power function. When the saturation reached a certain value, the rate of resistivity decline gradually decreased. When calcareous sand was fully saturated, its resistivity reached the minimum, which was similar to that of quartz sand [25]. When the three types of calcareous sand were at low saturation, the resistivity values of loose, medium dense, and dense calcareous sand all differed significantly. Especially when the saturation was between 20% and 40%, the decrease in resistivity value was the largest, and the decrease in resistivity decreased with increasing saturation.
When the saturation was low, increasing the saturation of calcareous sand improved the connectivity of pore water, resulting in a significant decrease in soil resistivity with increasing saturation. When the saturation exceeded a certain value (60% in this experiment), the connectivity of pore water in calcareous sand reached a good state. The continued increase in saturation of calcareous sand had little effect on the connectivity of pore water. Therefore, a decrease in the resistivity of calcareous sand was relatively small as the saturation continued to increase, indicating that the change in the saturation of calcareous sand had little effect on its resistivity. This was because an increase in pore water simultaneously led to an increase in the number of charges and enhanced mobility, and a reduction in resistance caused by the continuous water film compared to the initial stage.
Archie [8] proposed the concept of the structure factor in the process of studying soil resistivity, which is defined as the ratio of soil resistivity to pore liquid resistivity. The soil structure factor F was used to analyze the test results, and the results shown in Figure 11 were obtained. There was a power function relationship between the structure factor F and saturation Sr.
F = A S r p
In Formula (5), A and p are the fitting parameters related to soil properties (excluding saturation), and the structure factor F is the ratio of the resistivity of calcareous sand to the pore water resistivity.
Here, the fitting parameter p was taken as the fitting average, with values of 1.9722, 1.9900, and 1.9137 for 1–1.5 mm, 1.5–2 mm, and 2–2.5 mm, respectively. According to the model proposed by Archie [8] and Keller et al. [12], the relationship between fitting parameter A and porosity n is as follows:
A = B n m
In Formula (6), B is the fitting parameter.
The relationship curve between fitting coefficient A and porosity n was drawn, as shown in Figure 12, and a power function was used for fitting. The fitting results are shown in Table 4.
Table 4 shows that all the fitting correlation coefficients were greater than 0.96, and a stronger correlation could be obtained by using the power function relationship. For sandy soil, when the porosity n was 0.12–0.50, the coefficient m was between 1.3 and 2.8 [16,26,27]. Compared with sandy soil, the coefficient m of calcareous sand was larger, indicating that the resistivity of the calcareous sand used in this study decreased rapidly with increasing porosity, which may have been related to the pore structure of the calcareous sand itself.
The relationship between the structure factor and saturation of the three size fractions is shown in Table 5 by incorporating the above results into Formulas (5) and (6).
According to the relationship shown in Table 5, the saturation and void ratio jointly affected the structure factor, and there was a complex coupling relationship between them. Under the condition of low saturation, the pore ratio had a slightly greater impact on the structure factor, so the next step was to further study the impact of the pore ratio (relative density) on the resistivity of single size fraction of saturated calcareous sand.

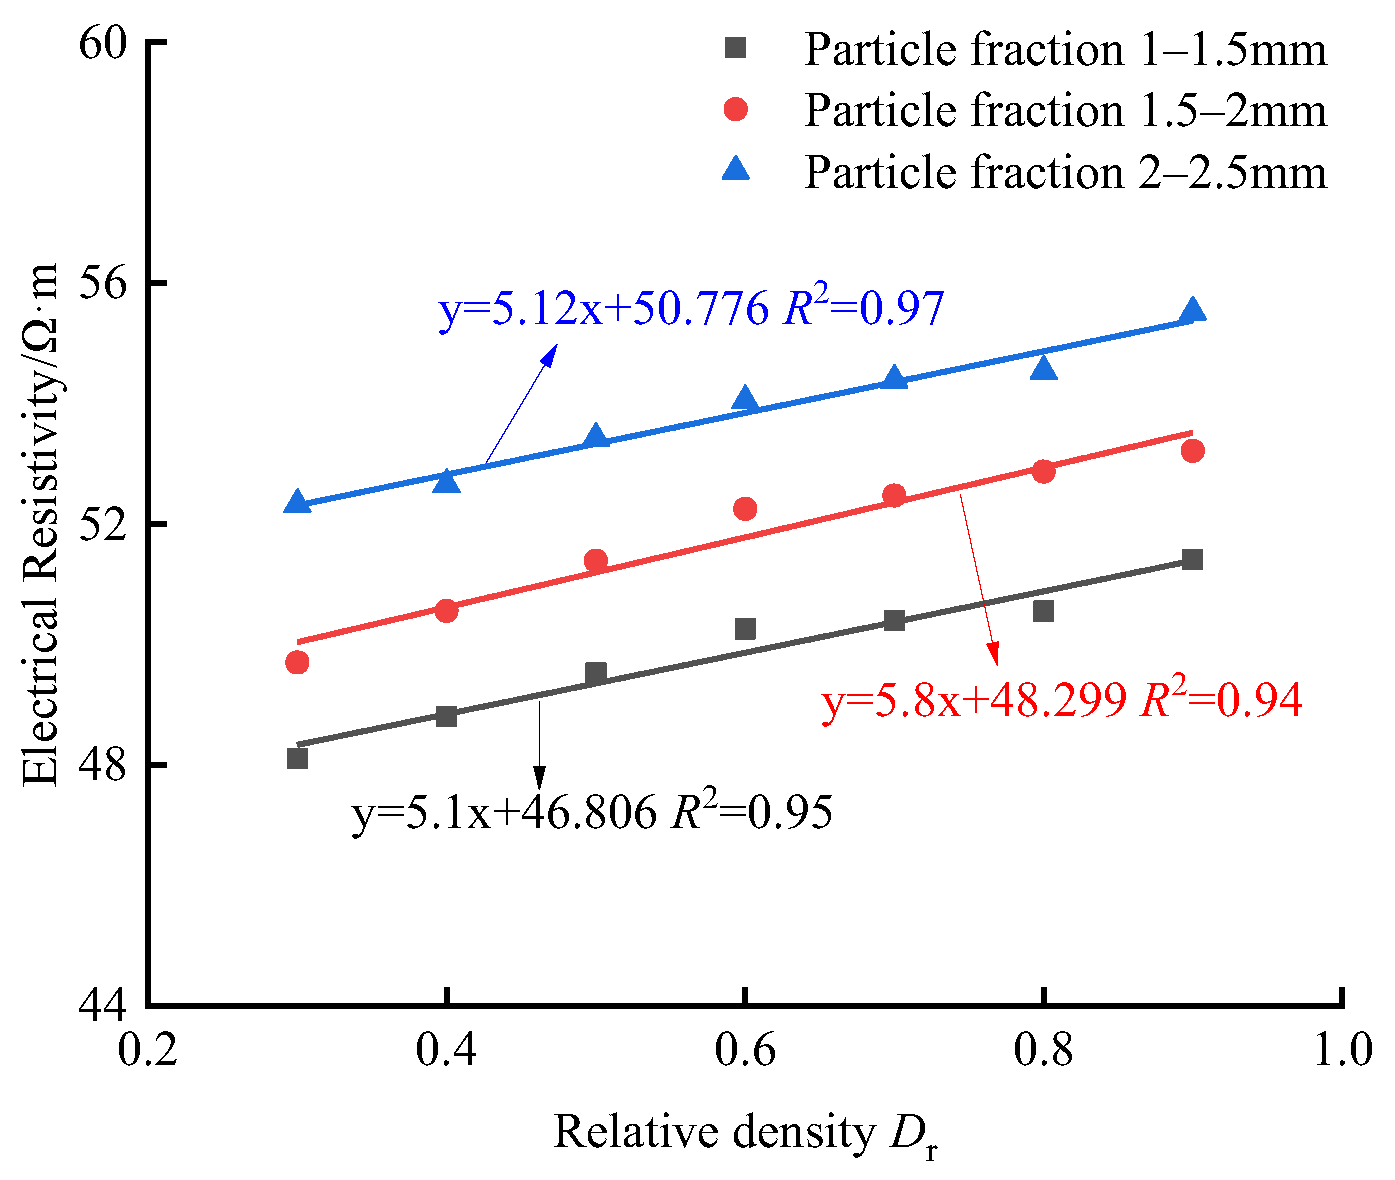
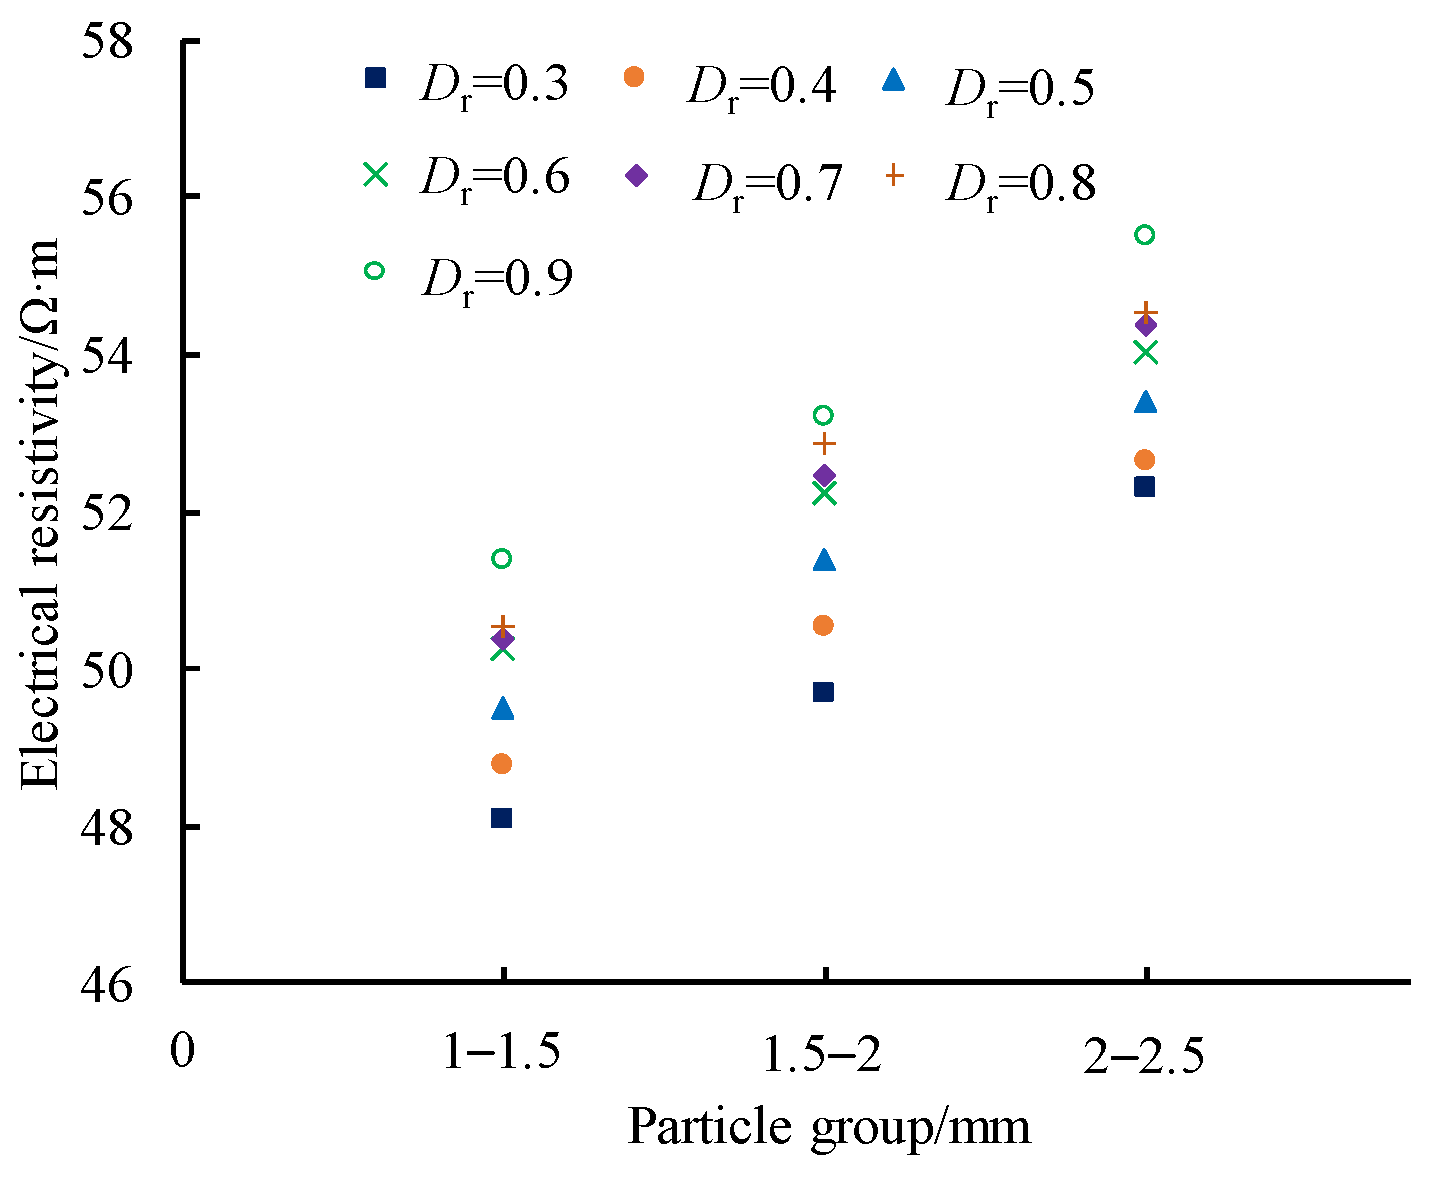
4.4. Effect of Relative Density on the Electrical Resistivity of Single Size Fraction of Calcareous Sand

The conductivity of soil increased with increasing porosity, and the effect of porosity on conductivity was independent of the type of soil. For saturated sand, an increase in porosity caused an increase in soil conductivity [11].
To study the effect of relative density on the resistivity of calcareous sand, a series of electrical measurement experiments were conducted on three types of saturated calcareous sand particles. The relative density Dr of the experiment was 0.3, 0.4, 0.5, 0.6, 0.7, 0.8, and 0.9, the current frequency f was 1000 Hz, and the pore liquid was treated with tap water (with a resistivity of 35.316 Ω·m). The relationship between resistivity and relative density was plotted using the experimental results, as shown in Figure 13. From the figure, it can be seen that the resistivities of the three types of single size fractions of saturated calcareous sand gradually increased with increasing relative density; that is, the larger the porosity of calcareous sand was, the smaller the resistivity was. This was because the larger the pore ratio was, the better the connectivity of its pores was and the better the continuity of pore water was, which resulted in a decrease in the resistivity of calcareous sand. There was a linear relationship between the resistivity and relative density of calcareous sand, and their linear fitting coefficients were not less than 0.94.
The fitting parameters between the resistivity and relative density of calcareous sand are shown in Table 6. As shown in the table, the intercept of the fitting line between the resistivity and relative density of saturated calcareous sand increased with increasing particle size.
Figure 14 shows the relationship between the resistivity and particle size of calcareous sand for the same relative density. The figure shows that the particle size has a certain impact on the resistivity of saturated calcareous sand, and there are certain differences in the resistivity of different particle sizes of calcareous sand. Under the same density conditions, the resistivity of calcareous sand tended to increase with increasing particle size, which was consistent with the variation pattern of saturated sand resistivity under the influence of the size fractionation studied by Gao et al. [28].

5. Conclusions

In this study, the two-electrode method was used to investigate the electrical resistivity characteristics of calcareous sand samples with different size fractions under different conditions, such as temperature, pore water solution, saturation, and relative density. The main research results are as follows:
(1)
As the temperature increased, the resistance of the calcareous sand sample gradually decreased, and the relationship between temperature and resistance was approximately linear. For calcareous sand with size fractions of 1–1.5 mm, 1.5–2 mm, and 2–2.5 mm, the resistivity decreased by 0.48 Ω·m, 0.94 Ω·m, and 1.15 Ω·m for each 1 °C increase. The research results can provide support for temperature correction of calcareous sand resistivity.
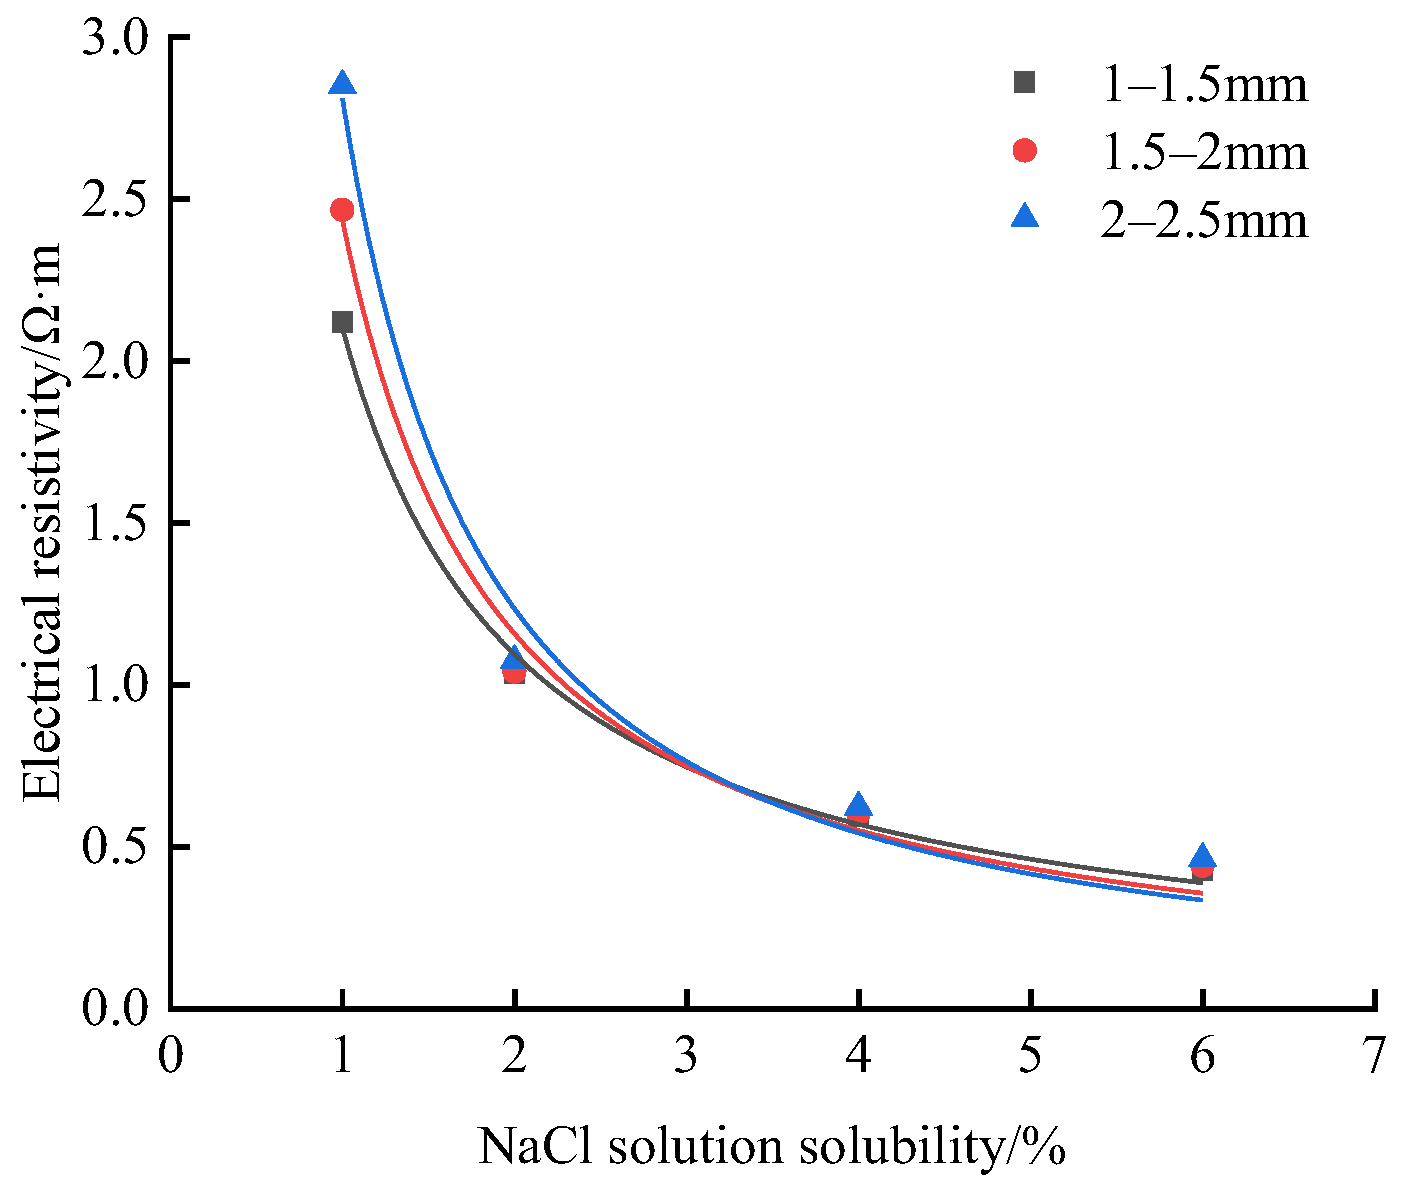
(2)
When the pore solutions were pure water, tap water, 1% NaCl salt solution, 2% NaCl salt solution, 4% NaCl salt solution, and 6% NaCl salt solution, the resistivity of calcareous sand showed a significant downwards trend, and the differences in resistivity values were significant. When the concentration of NaCl was high, the influence of particle size on the resistivity of saturated calcareous sand could be ignored.
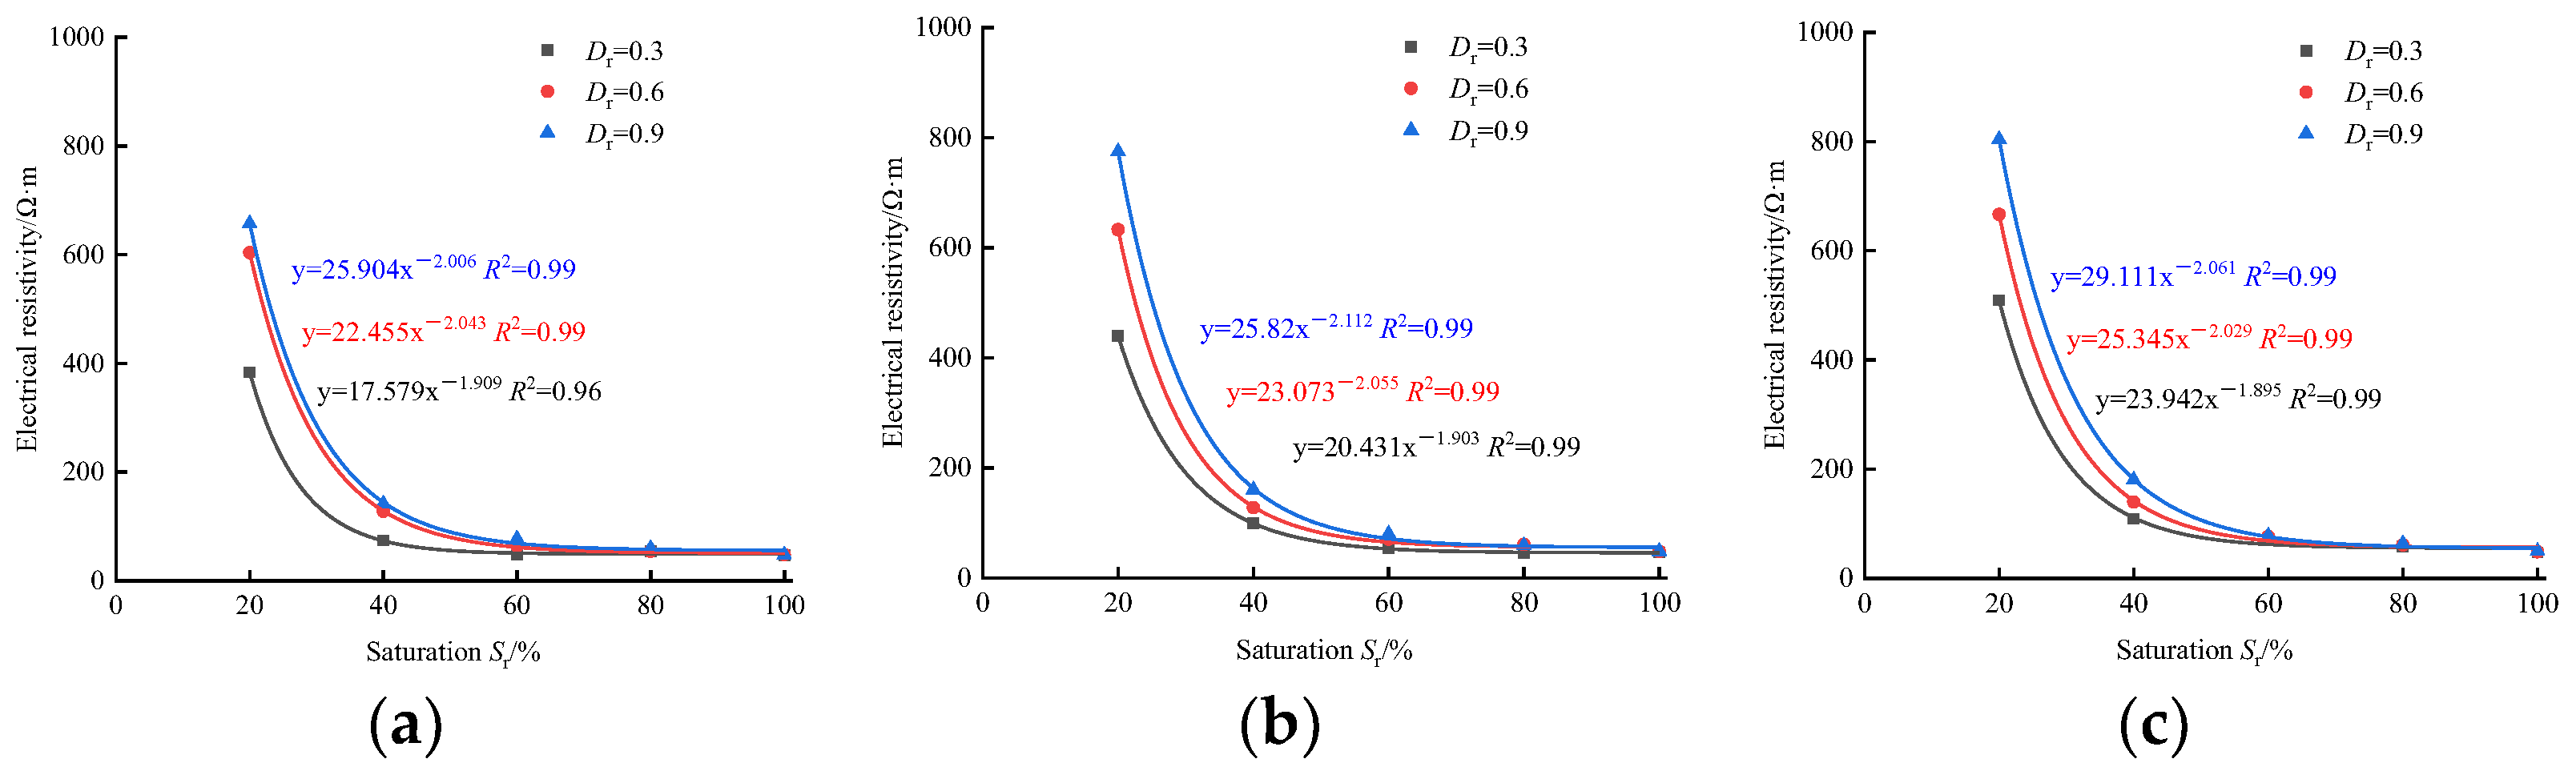
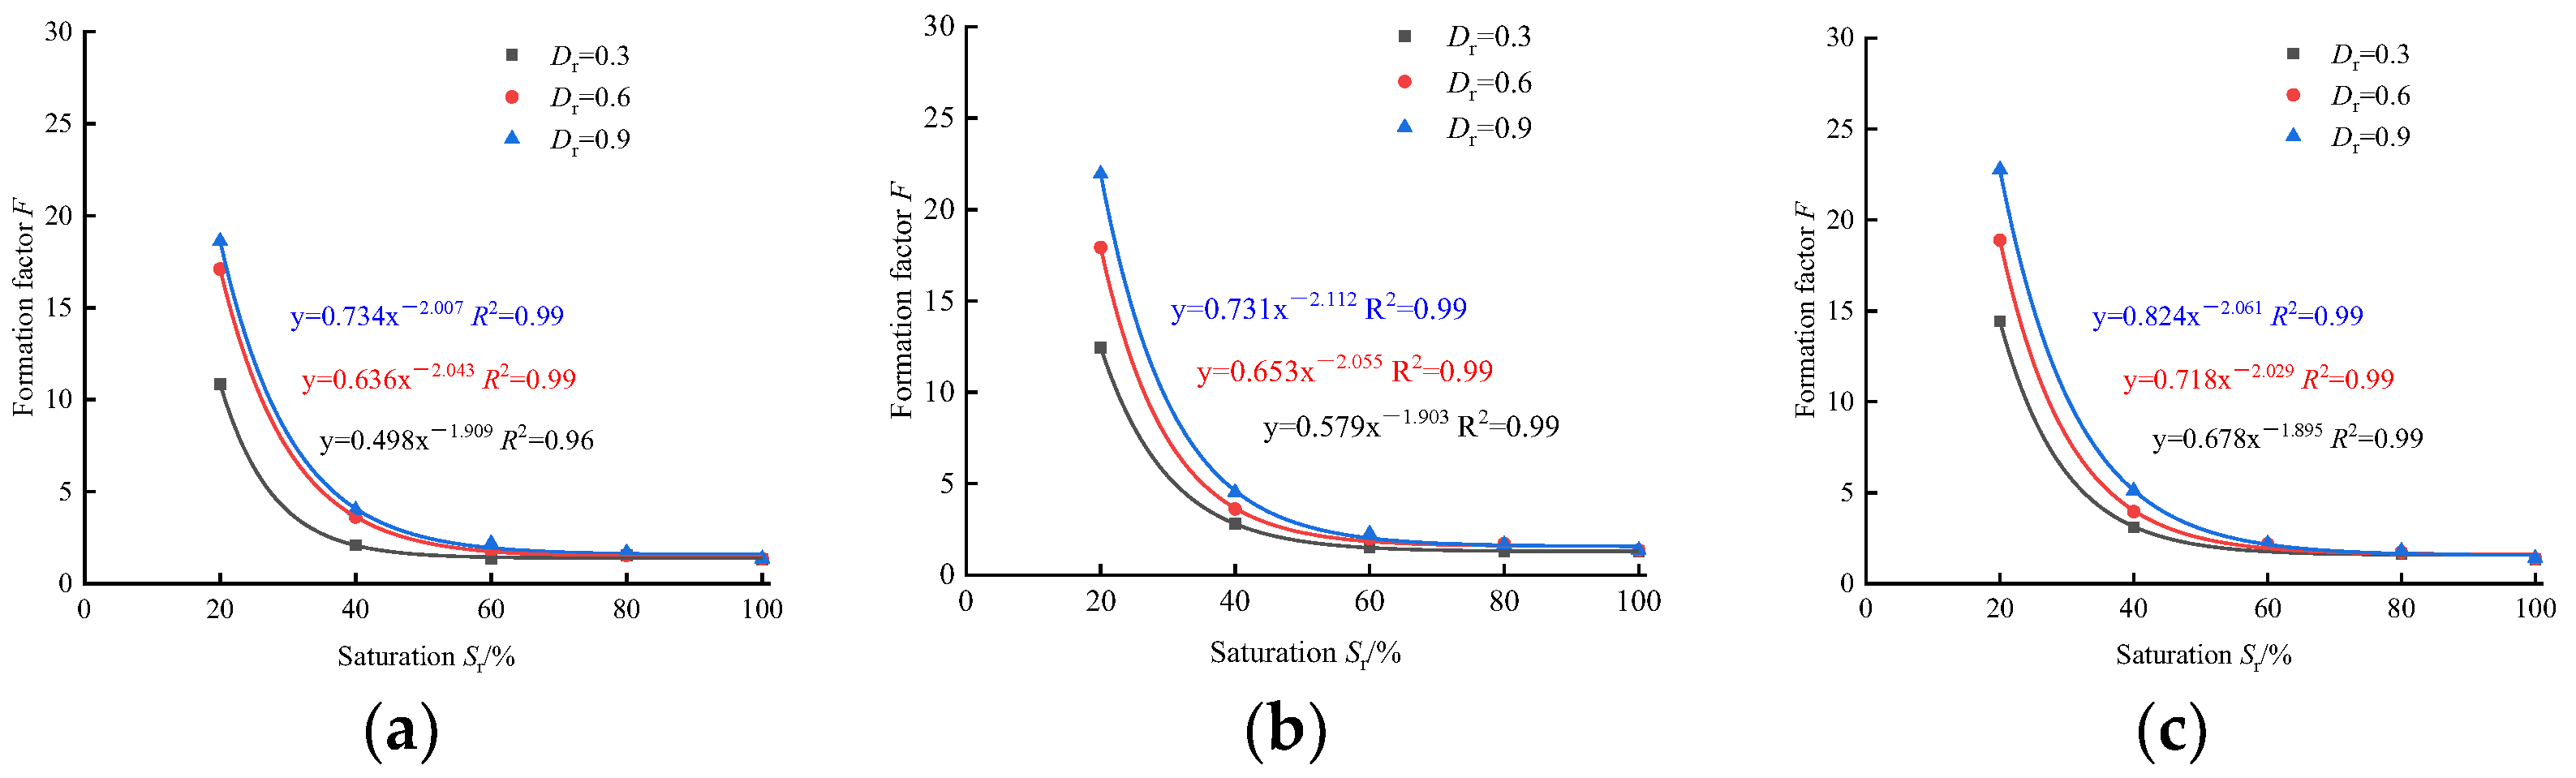
(3)
The resistivities of three size fractions of calcareous sands decreased with increasing saturation, and the relationship between them was a power function. When they were close to full saturation, the rate of resistivity decline gradually decreased. When the calcareous sands were fully saturated, their resistivity reached the minimum.
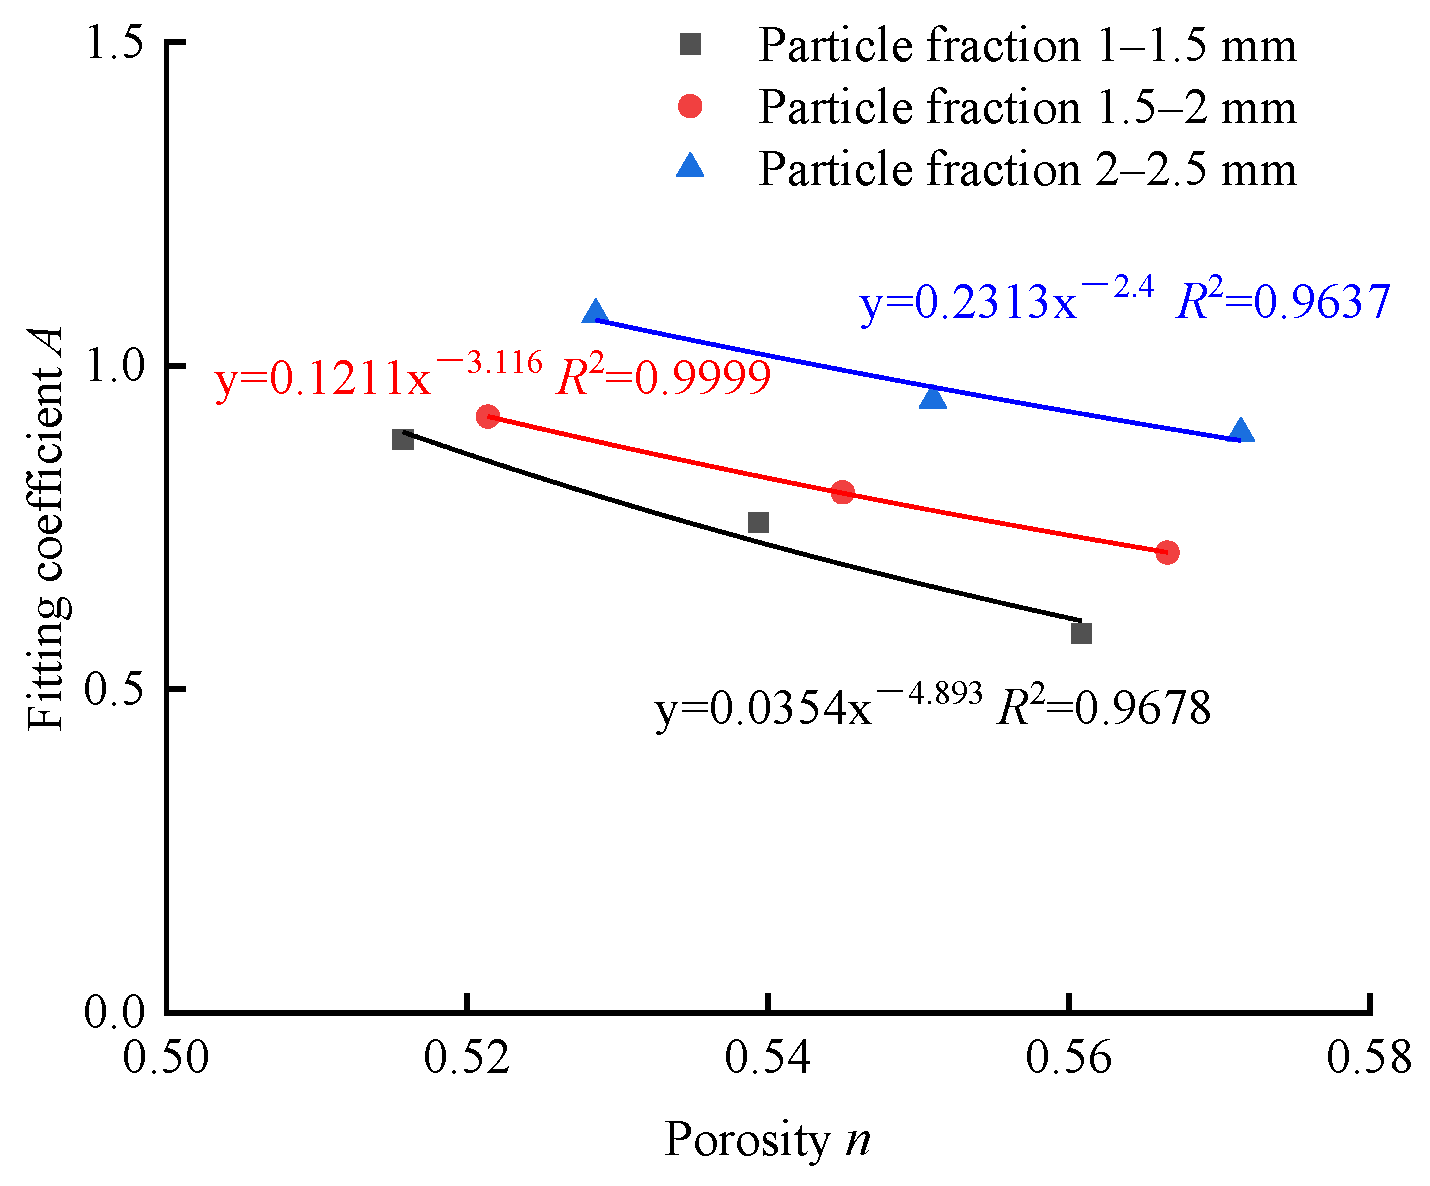
(4)
The larger the porosity of calcareous sands was, the lower the resistivity was. The relationship between the resistivity and relative density of calcareous sand was established using a linear function. The research results can provide support for the establishment of the relationship between particle breakage and electrical resistivity of calcareous sand in the future.

Author Contributions

Conceptualization, H.H. and W.H.; data curation, X.D. and T.L.; formal analysis, H.W., Z.L. and L.W.; methodology, H.H. and W.H.; writing—original draft, H.H. and W.H.; writing—review and editing, W.H. All authors have read and agreed to the published version of the manuscript.

Funding

This research was funded by two grants from the National Science Foundation of China (51978317 and 51979128).

Institutional Review Board Statement

Not applicable.

Informed Consent Statement

Not applicable.

Data Availability Statement

The data used to support the findings of the study are available from the corresponding author upon request.

Acknowledgments

The authors appreciate the comments and suggestions provided by the editors and anonymous reviewers.

Conflicts of Interest

The authors declare no conflict of interest.

References

  1. Fukue, M.; Minato, T.; Horibe, H.; Taya, N. The micro-structures of clay given by resistivity measurements. Eng. Geol. 1999, 54, 43–53. [Google Scholar] [CrossRef]
  2. Yu, X.J.; Liu, S.Y. Researches on application of electrical resistivity indices to the microstructure of expansive soils. Chin. J. Geo. Eng. 2004, 26, 393–396. [Google Scholar] [CrossRef]
  3. Zha, F.S.; Liu, S.Y.; Du, Y.J.; Cui, K.R.; Xu, L. Quantitative assessment on change in microstructure of loess during collapsing using electrical resistivity measurement. Rock Soil Mech. 2010, 31, 1692–1698. [Google Scholar] [CrossRef]
  4. Lévesque, Y.; Walter, J.; Chesnaux, R.; Dugas, S.; Noel, D. Electrical resistivity of saturated and unsaturated sediments in northeastern Canada. Environ. Earth Sci. 2023, 82, 303. [Google Scholar] [CrossRef]
  5. Cao, Z.G.; Xiang, L.; Peng, E.X.; Li, K. Experimental Study on Electrical Resistivity of Cement-Stabilized Lead-Contaminated Soils. Adv. Civ. Eng. 2018, 2018, 4628784. [Google Scholar] [CrossRef]
  6. Shen, J.; Mao, H.; Wang, Z.; Yan, L.; Tang, X. Influence of Electrode Contact and Distance on Soil Resistivity Measuremen. Acta Pedol. Sin. 2019, 56, 1247–1258. [Google Scholar] [CrossRef]
  7. Rinaldi, V.A.; Cuestas, G.A. Ohmic Conductivity of a Compacted Silty Clay. J. Geo. Geoenviron. Eng. 2002, 128, 824–835. [Google Scholar] [CrossRef]
  8. Archie, G.E. The Electrical Resistivity Log as an Aid in Determining Some Reservoir Characteristics. Soc. Pet. Eng. 1942, 146, 54–62. [Google Scholar] [CrossRef]
  9. Qi, Y.; Wang, M.; Zhang, D.; Lin, W. Correction method of Archie resistivity model for methyl tert-butyl ether contaminated clay. Rock Soil Mech. 2023, 44, 1719–1728. [Google Scholar] [CrossRef]
  10. Chu, Y.; Liu, S.Y.; Cai, G.J.; Bian, H.L. Research Progress of Resistivity Models for Geotechnical Engineering. J. Nanjing Inst. Technol. (Nat. Sci. Ed.) 2017, 15, 1–9. [Google Scholar]
  11. Chen, R.P.; Chen, W.; Wang, J.X.; Chen, Y.M. Electrical conductivity of pore water in saturated sand and its measurement technology. Chin. J. Geo. Eng. 2010, 32, 780–783. [Google Scholar]
  12. Keller, G.V.; Frischknecht, F.C. Electrical Methods in Geophysical Prospecting; Pergamom Press: New York, NY, USA, 1966. [Google Scholar]
  13. Hu, M.J.; Jiang, H.H.; Cui, X.; Ruan, Y.; Liu, H.F.; Zhang, C.Y. Preliminary study of conductivity and correlation problems of calcareous sand. Rock Soil Mech. 2017, 38, 158–162. [Google Scholar] [CrossRef]
  14. Zhu, C.Q.; Cui, X.; Hu, M.J.; Wang, X.Z.; Tang, J.J. Study of electric conductivity and permeability of calcareous soil. Rock Soil Mech. 2018, 39, 142–148. [Google Scholar] [CrossRef]
  15. Dias, C.A. Analytical model for a polarizable medium at radio and lower frequencies. J. Geophys. Res. 1972, 77, 4945–4956. [Google Scholar] [CrossRef]
  16. Wang, B.H.; Wang, Z.H.; Jiang, P.M.; Zhou, A.Z. Electrical resistivity characteristics of saturated sand with varied porosities. Chin. J. Geo. Eng. 2017, 39, 1739–1745. [Google Scholar] [CrossRef]
  17. Bai, W.; Kong, L.W.; Guo, A.G. Effects of physical properties on electrical conductivity of compacted lateritic soil. J. Rock Mech. Geo. Eng. 2013, 5, 406–411. [Google Scholar] [CrossRef]
  18. Campbell, R.B.; Bower, C.A.; Richards, L.A. Change of Electrical Conductivity with Temperature and the Relation of Osmotic Pressure to Electrical Conductivity and Ion Concentration for Soil Extracts. Soil Sci. Soc. Am. J. 1949, 13, 66–69. [Google Scholar] [CrossRef]
  19. Zhuang, Y.F.; Wang, Z. Interface Electric Resistance of Electroosmotic Consolidation. J. Geo. Geoenviron. Eng. 2007, 133, 1617–1621. [Google Scholar] [CrossRef]
  20. López-Sánchez, M.; Mansilla-Plaza, L.; Sánchez-de-Laorden, M. Geometric factor and influence of sensors in the establishment of a resistivity-moisture relation in soil samples. J. Appl. Geophys. 2017, 145, 1–11. [Google Scholar] [CrossRef]
  21. Abu-Hassanein, Z.S.; Benson, C.H.; Blotz, L.R. Electrical Resistivity of Compacted Clays. J. Geo. Eng. 1996, 122, 397–406. [Google Scholar] [CrossRef]
  22. Xie, R.Z.; Chen, Z.G.; Feng, C.; He, B.; Ma, F.L.; Han, P.J. Electrochemical impedance spectroscopy of sand of varied particle size and water content using the three-electrode system. Mater. Test. 2018, 60, 841–847. [Google Scholar] [CrossRef]
  23. Liu, G.H.; Wang, Z.Y.; Huang, J.P. Research on electrical resistivity feature of soil and its application. Chin. J. Geo. Eng. 2004, 26, 83–87. [Google Scholar] [CrossRef]
  24. Song, Z.W.; Dong, X.Q.; Gao, Y.T.; Shen, J.W.; Liu, X.F. Experimental analysis of AC resistivity properties of zinc contaminated sand. J. Civ. Archit. Environ. Eng. 2015, 37, 60–65. [Google Scholar]
  25. Zhou, M.; Wang, J.G.; Huang, S.B.; Dou, P.; Zhang, L.Q.; Yao, W. Experimental investigation on influencing factors in soil resistivity measurement. Rock Soil Mech. 2011, 32, 3269–3275. [Google Scholar] [CrossRef]
  26. Friedman, S.P.; Robinson, D.A. Particle shape characterization using angle of repose measurements for predicting the effective permittivity and electrical conductivity of saturated granular media. Water Resour. Res. 2002, 38, 1–11. [Google Scholar] [CrossRef]
  27. Jackson, P.D.; Smith, D.T.; Stanford, P.N. Resistivity-Porosity-Particle Shape Relationships for Marine Sands. Geophysics 1978, 43, 1250–1268. [Google Scholar] [CrossRef]
  28. Gao, Y.C.; Zhang, C.X.; Wang, B.H. Effect of particle size on resistivity of saturated sand. J. Yangzhou Univ. (Nat. Sci. Ed.) 2017, 20, 66–69. [Google Scholar] [CrossRef]
Figure 1. Resistance testing equipment and experimental testing. (a) Resistance testing equipment. (b) Schematic diagram of experimental testing.
Applsci 13 11467 g001
Figure 2. Three types of calcareous sand: (a) 1–1.5 mm; (b) 1.5–2 mm; and (c) 2–2.5 mm.
Applsci 13 11467 g002
Figure 3. Sample boxes with different electrode spacings. (a) electrode spacing of 5 cm; (b) electrode spacing of 10 cm; (c) electrode spacing of 15 cm; and (d) electrode spacing of 20 cm.
Applsci 13 11467 g003
Figure 4. Contact resistance test results of calcareous sand.
Applsci 13 11467 g004
Figure 5. Constant temperature and humidity incubator and test samples.
Applsci 13 11467 g005
Figure 6. Effect of temperature on the resistivity of saturated calcareous sand with different size fractions.
Applsci 13 11467 g006
Figure 7. Resistivity of different pore solutions.
Applsci 13 11467 g007
Figure 8. Electrical resistivity test values of saturated calcareous sand with different pore water contents.
Applsci 13 11467 g008
Figure 9. Relationship between NaCl solution concentration and resistivity test values of calcareous sand.
Applsci 13 11467 g009
Figure 10. Relationship between resistivity and saturation of single size fraction of calcareous sand: (a) 1–1.5 mm; (b) 1.5–2 mm; and (c) 2–2.5 mm.
Applsci 13 11467 g010
Figure 11. Relationship between structure factor F and saturation of calcareous sands of different size fractions: (a) 1–1.5 mm; (b) 1.5–2 mm; and (c) 2–2.5 mm.
Applsci 13 11467 g011
Figure 12. Relationship between porosity and fitting parameter A of calcareous sand of different size fractions.
Applsci 13 11467 g012
Figure 13. Relationship between relative density and electrical resistivity of single size fraction of calcareous sand.
Applsci 13 11467 g013
Figure 14. Electrical resistivity of single size fraction of saturated calcareous sand with different relative densities.
Applsci 13 11467 g014
Table 1. Physical properties of calcareous sand.
Size Fraction
/mm
Specific Gravity
Gs
Maximum Dry Density
/g·cm−3
Minimum Dry Density
/g·cm−3
1–1.52.741.351.15
1.5–22.731.331.13
2–2.52.711.301.11
Table 2. Test plans.
Influencing FactorsSize Fraction/mmSaturation/%Relative DensityTemperature/°CPore Water TypeTest Frequency/Hz
Pore water resistivity1–1.5
1.5–2
2–2.5
1000.620Pure water, tap water, NaCl solutions with concentrations of 1%, 2%, 4%, and 6%1000
Temperature1–1.5
1.5–2
2–2.5
1000.65, 10, 15, 20, 25, 30, 35, 40Tap water1000
Saturation1–1.5
1.5–2
2–2.5
20, 40, 60, 80, 1000.620Tap water1000
Relative density1–1.5
1.5–2
2–2.5
1000.3, 0.4, 0.5, 0.6, 0.7, 0.8, 0.920Tap water1000
Table 3. Fitting relationship between resistivity and temperature of calcareous sand for different size fractions.
Size Fraction/mmRelationship between Resistivity and TemperatureR2
1–1.5ρ = −0.5076ln(T) + 33.400.955
1.5–2ρ = −0.9410ln(T) + 60.570.977
2–2.5ρ = −1.1453ln(T) + 73.670.972
Table 4. Fitting results of porosity and fitting parameter A of calcareous sand with different size fractions.
Size Fraction
/mm
Relative Density DrAnBmR2
1–1.50.30.5860.56090.03584.8930.9678
0.60.7580.5394
0.90.8860.5157
1.5–20.30.7110.56660.12113.1160.9999
0.60.8040.5450
0.90.9210.5214
2–2.50.30.8960.57140.23132.40.9637
0.60.9470.5510
0.91.0790.5285
Table 5. Relationship between saturation of calcareous sand of different size fractions and structure factor.
Size Fraction/mmRelationship between Saturation and Structure Factor
1–1.5 F = 0.0358 × n 4.893 S r 1.9722
1.5–2 F = 0.1211 × n 3.116 S r 1.99
2–2.5 F = 0.2313 × n 2.4 S r 1.9137
Table 6. Linear data table for fitting the relative density and resistivity of single size fraction of saturated calcareous sand.
Size Fraction/mm1–1.51.5–22–2.5
Slope5.15.85.12
Intercept46.80648.29950.776
Fitting coefficient0.950.940.97
Disclaimer/Publisher’s Note: The statements, opinions and data contained in all publications are solely those of the individual author(s) and contributor(s) and not of MDPI and/or the editor(s). MDPI and/or the editor(s) disclaim responsibility for any injury to people or property resulting from any ideas, methods, instructions or products referred to in the content.

