1. Introduction
The identification of surface irregularities on metal workpieces plays a pivotal role in guaranteeing the quality of industrial manufacturing during the production process. During the fabrication and manufacturing of metal workpieces, factors such as machining methods and manufacturing conditions can result in the emergence of imperfections like scratches, protrusions, and abrasions on the surface of material. These defects exert a substantial influence on the quality and functionality of the products, diminishing their longevity and potentially leading to the production mishaps in more serious instances. Manual screening is typically employed for detecting metal surface defects in industrial production currently. Nevertheless, this method is marked by elevated expenses, reduced efficiency, and the quality of detection is significantly affected by factors like the skill level of workers, posing challenges in fulfilling the requirements of large-scale product inspection.
There are two main categories of methods for metal surface defect detection [
1]. One relies on conventional image processing methodologies, and the other is rooted in deep learning techniques.
Ren et al. [
2] introduced a similarity assessment approach reliant on color histograms to evaluate the Electromagnetic Resonance Tomography (ERT) imagery of resistor blocks. An Adaptive Cuckoo Search (ACS) algorithm is used to compute the optimal threshold for multi-level grayscale image thresholding improvement. Chen et al. [
3] used a Genetic Algorithm (GA) to calculate the optimal Gabor filters to suppress texture interference. A novel fabric defect detection method is proposed, which used ACS-based thresholding and GA-based optimal Gabor filters. Wang et al. [
4] introduced a technique for detecting color-based point defects. This approach relies on factors such as local contrast analysis, point defect enhancement, noise reduction, and background suppression, all in conjunction with the utilization of the OR operation.
Defect detection methods based on deep learning primarily encompass the Faster R-CNN, various networks from the YOLO series, and the SSD network. Bayraktar et al. [
5] leveraged the strengths of GANs while addressing the limitations of conventional approaches, ultimately improving the overall performance of surface defect detection. Xia et al. [
6] proposed an innovative defect detection approach utilizing Faster R-CNN specifically designed for identifying plate surface imperfections. A bilateral filtering algorithm was used, in which a shape-adaptive convolution with ResNet50 was applied to obtain defect semantic feature mapping in the feature pyramid network. Zhang et al. [
7] introduced a surface defect detection approach utilizing MobileNet-SSD as the foundation. They streamlined the detection model by making adjustments to both the network structure and parameters. Zheng et al. [
8] improved the YOLOv4-Tiny algorithm by employing a parallel feature processing strategy to extract features from bimodal images. Features from different layers were fused to enhance the defect feature extraction approach.
However, the ACS algorithm may require a large number of iterations to find a satisfactory optimization solution, especially for complex optimization problems. This may result in long runtimes. Faster R-CNN only employs features extracted from the final convolutional layer of the underlying network for detection. This deficiency in incorporating shallow features results in subpar performance when identifying minor defects in small targets, and it also results in a relatively bulky model that hampers detection speed. Although the SSD algorithm predicts smaller targets using shallow features, it still lacks sufficient deep feature information, resulting in limited capability in detecting small targets. The YOLOv4-Tiny algorithm has faster detection speed but requires improvement in accuracy.
Facing the challenges of general object detectors and their backbone networks in small object defect detection tasks, as well as the difficulty in balancing the detection accuracy and efficiency of existing metal surface defect detection, a surface defect detection network called the Information Enhancement YOLOv5 network (IE-YOLOv5) is proposed in this paper. The standard convolution block in the neck module is replaced with a lightweight one in the IE-YOLOv5 network to construct a lightweight Neck module-GSConv, which can enhance the feature extraction efficiency. A slim neck structure with feature fusion based on the federated learning algorithm (FedFusion) [
9], FF-Slim-neck, is proposed to optimize the Neck module. The Parameter-free Spatial Attention mechanism (PSA) is introduced into the YOLOv5 network to enhance the feature extraction capability, enabling swift and precise detection of defects on metal surfaces.
In summary, the contributions of this study are as follows:
- (1)
The novel lightweight convolution module GSConv is employed to replace the standard convolution in the original YOLOv5 network’s Neck module, which allows efficient preservation of hidden links for each channel and feature extraction efficiency improvement.
- (2)
Utilizing the federated learning algorithm known as FedFusion, we introduce a feature fusion module designed to aggregate features from both local and global models at the feature extraction stage. Combined with GSConv, the FF-Slim-Neck structure is constructed to optimize the Neck module of the network and reduce additional computational costs.
- (3)
A lightweight Parameter-free Spatial Attention mechanism called PSA is proposed to reduce network parameters and enhance network representation capacity. Additionally, the YOLOv5’s CIoU loss function is optimized to EIoU loss function, which improves prediction accuracy and speeds up model convergence.
2. Methods
2.1. Network Architecture of YOLOv5
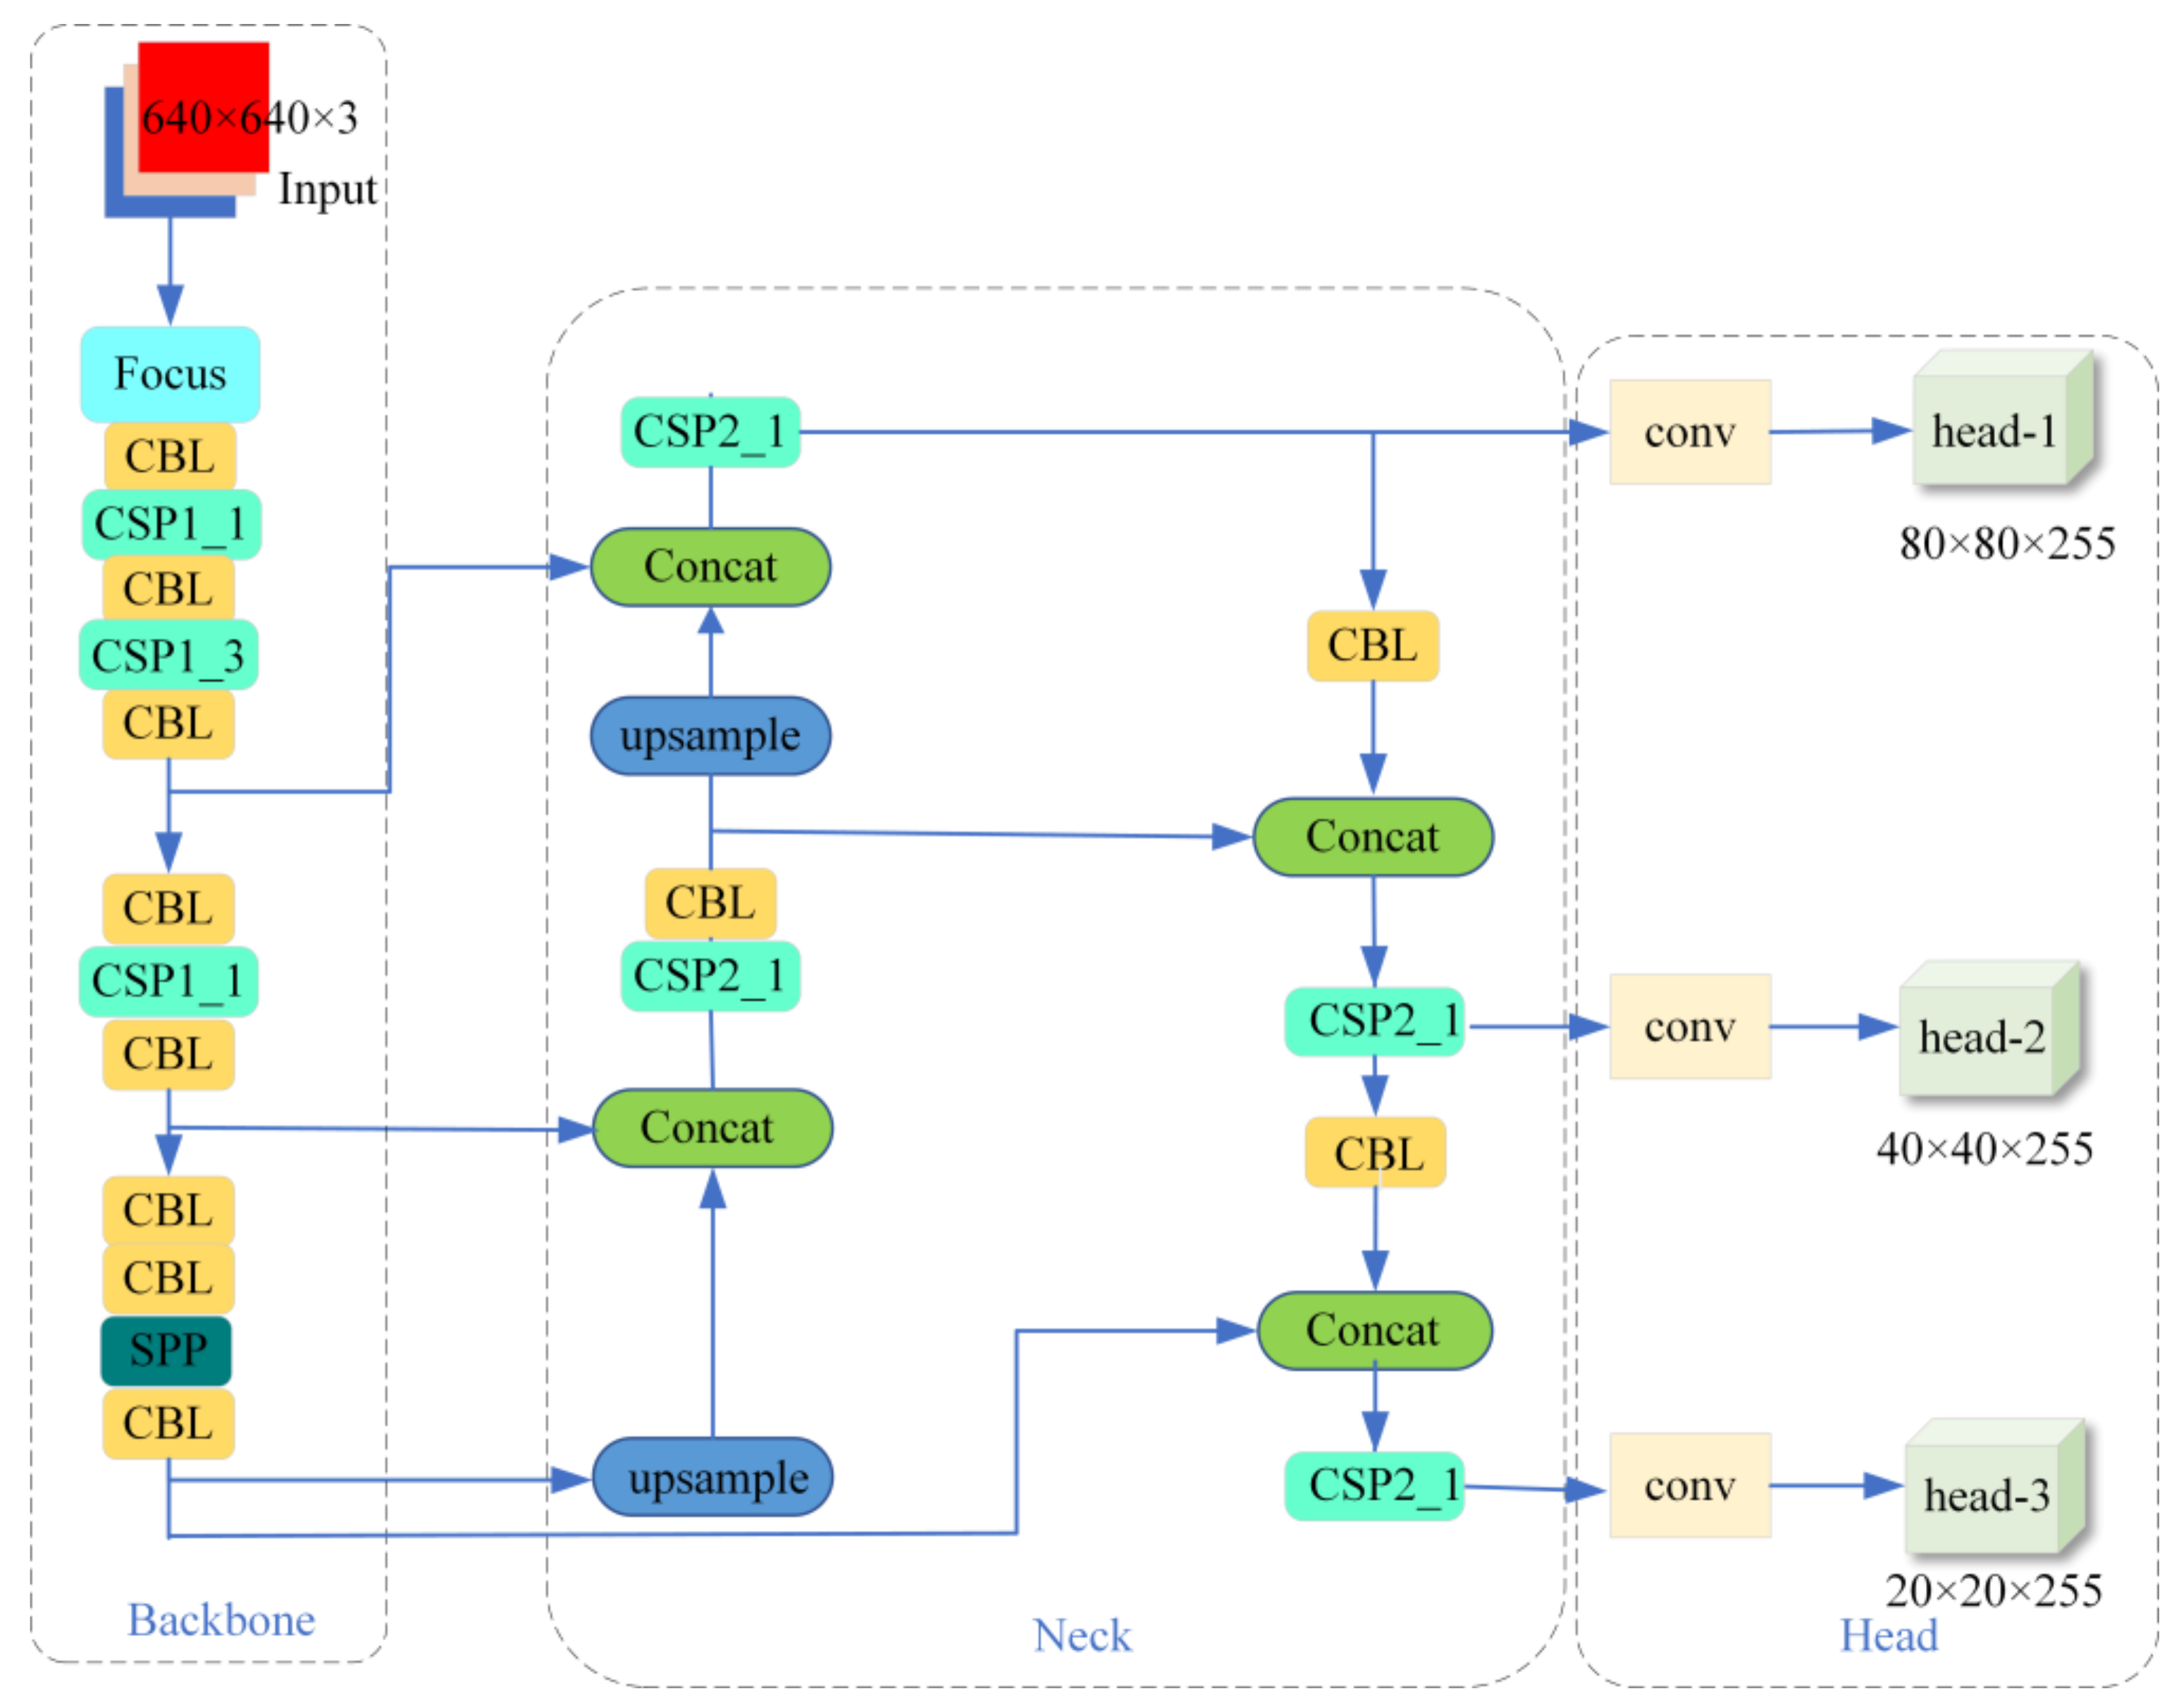
The YOLOv5 network consists primarily of four components: Input, Backbone, Neck, and Head.
Figure 1 presents an illustration of the holistic structure of YOLOv5. The input is a preprocessed 640 × 640 × 3 image. CBL represents the basic convolutional unit; CSP_x denotes the feature extraction module; Concat represents the concatenation module; upsample denotes the upsampling module; and SPP refers to the Spatial Pyramid Pooling layer for efficient spatial pooling; The dimensions of the output feature maps are 20 × 20 × 255, 40 × 40 × 255, and 80 × 80 × 255, representing the length, width, and depth, respectively. These dimensions correspond to the network’s detection tasks for large, medium, and small objects of different scales.
2.2. Network Architecture of IE-YOLOv5
In the original YOLOv5 [
10], the input image is processed through convolution and upsampling in the Neck module, which results in the gradual transfer of spatial information to the channels. When the feature map’s spatial dimensions are compressed and the channels are expanded, there is a partial loss of semantic information. The GSConv structure can be introduced into the Neck module to address this issue.
We introduce the FF-Slim-Neck to strike a balance among detection accuracy, detection speed, and computational cost within GSConv. This addition aids in addressing the challenge of small object detection while upholding overall efficiency.
To further enhance the performance of the detection algorithm, we have implemented various improvements in image feature extraction, feature aggregation, fusion, and network lightweight design. The original FPN + PAN feature fusion network in the Neck structure is replaced with FF-Slim-Neck and the GSConv combined feature fusion network. This novel design enhances the network’s capacity for crucial information extraction while also optimizing the efficiency of feature fusion.
Additionally, the Head layer incorporates the PSA attention mechanism using the concept of three-dimensional weights to assess statements. This results in a reduction in inference time and an enhancement of the network’s detection speed.
The improved algorithm framework IE-YOLOv5 based on YOLOv5 is shown in
Figure 2. These modifications collectively enhance the detection algorithm’s performance, particularly in detecting small objects in the industrial environment.
2.3. GSConv Structure
In the original YOLOv5 [
11], the input image is processed through convolution and upsampling in the Neck module, which results in the gradual transfer of spatial information to the channels. When the feature map’s spatial dimensions are compressed and the channels are expanded, there is a partial loss of semantic information. The GSConv structure can be introduced into the Neck module to address this issue.
GSConv is a lightweight convolutional layer design that significantly reduces the number of parameters and the computational complexity of the model. With GSConv, IE-YOLOv5 is able to reduce the computational requirements of the model while maintaining good performance, thus improving the efficiency of feature extraction. The GSConv can preserve hidden connections for each channel efficiently. Given an input feature map of size
C1 ×
H ×
W, the GSConv module applies two types of convolutions: standard Convolution (SC) and depth-wise separable convolution (DSC) [
12]. SC is applied to conduct convolution on individual groups within the input feature map, utilizing a convolution kernel sized
C2/2 ×
C1 ×
h1 ×
w1, yielding a feature map of dimensions
C2/2 ×
H ×
W. DSC is then used for feature map segmentation and channel fusion, producing an output feature map with channels still at
C2/2 ×
H ×
W. The feature maps from SC and DSC are fused using the Concat operation to obtain a feature map of dimensions
C2 ×
H ×
W. Finally, the Shuffle module is employed for feature reorganization, yielding an output feature map of dimensions
C2 ×
H ×
W, as depicted in
Figure 3. The GSConv module facilitates the propagation of information generated by SC into all segments of the information produced by DSC. The processed image features contain less redundant and repetitive information, reducing the parameter count and floating-point operations, thereby improving the efficiency of feature extraction.
2.4. FF-Slim-Neck Structure
The depth of the network is increased with the introduction of GSConv, which increases the detection time significantly as shown in
Figure 4. p1, p2, and p3 refer to the images whose sizes are 128 × 80 × 80, 256 × 40 × 40, 512 × 20 × 20 after the original images are processed by Backbone. Deeper networks can introduce more resistance to data flow, significantly increasing detection time. To address this issue, the design of the FedFusion Slim Neck (FF-Slim-Neck) structure is inspired by generalized approaches to CNN learning capabilities found in methods like DensNet [
13], VoVNet [
14], and CSPNet [
15].
The FF-Slim-Neck structure incorporates GSConv, which may balance the trade-off between network depth and efficiency. This design allows the network to extract important features while keeping the computational cost and detection time at a reasonable level. The FF-Slim-Neck structure combines the advantages of GSConv with the principles of these generalized CNN learning methods to achieve improved performance in detecting metal part defects.
Local features pertain to data extracted from relatively compact or specific regions within the dataset. These features are generally employed to capture details and fluctuations in the data, focusing on local structures, and do not take into account the broader context of the entire dataset. In the case of images, local features might encompass small segments of an image, like edges, corners, or texture patterns. In contrast, global features encompass the information gathered from the entirety of the dataset or the entire data range. They are utilized to grasp the overarching context and global relationships within the data, facilitating a more comprehensive comprehension of the entire dataset.
Incorporated into the FCConv model, as depicted in
Figure 5, is the Federated Learning algorithm known as FedFusion [
16], which is based on feature fusion techniques. The input image X undergoes transformation into two feature spaces, with the local feature extractor represented as
El and the global feature extractor as
E. This transformation results in the generation of feature mappings, denoted as
El(
x),
Eg(
x) ∈
RC×H×W. Subsequently,
El and
Eg are embedded into the fusion feature space using a 1 × 1 convolution. The utilization of 1 × 1 convolutions serves as an effective strategy for dimensionality reduction within feature channels, imparting significant advantages in terms of computational complexity and model parameter count reduction. This approach effectively mitigates computational and storage requirements.
represents the learned weight matrix, and || denotes the operation of concatenating feature maps along the channel axis.
The GSConv and FedFusion are utilized in the Neck module to design the FF-Slim-Neck structure. The design of the cross-stage partial network FC module employs a one-step aggregation technique. This approach effectively lowers the computational complexity and reduces the inference time during the detection process. The FF-Slim-Neck architecture, depicted in
Figure 6, streamlines the feature fusion process between local and global models at the feature extraction stage. The input feature map has the dimensions
C1 ×
H ×
W. It is processed through the Conv module, resulting in an output feature map of
C1/2 ×
H ×
W. Subsequently, the GSconv module generates another output feature map of
C2/4 ×
H ×
W. The feature fusion takes place through the FCConv module, resulting in an output feature map of
C2/2 ×
H ×
W. In the final step, we concatenate the outputs of the Conv and FCConv modules to acquire an output feature map sized
C2 ×
H ×
W.
2.5. PSA Attention Mechanism
The attention mechanism known as the squeeze-and-excitation module (SE) [
17] captures contextual information by Global Max Pooling (GMP) to determine the significance of different channels. However, the SE attention mechanism treats all neurons in a channel or spatial position equally, limiting its effectiveness in computing true 3D weights. Furthermore, the weight calculation in SE requires substantial computation, increasing the network’s computational cost and hindering its ability to extract more information from neurons.
To overcome these challenges, we introduce the parameter-free spatial attention mechanism (PSA) as a parameter-free alternative, as depicted in
Figure 7.
W and
H, respectively, denote the feature map’s width and height.
C represents the number of channels. The size of the input feature map is represented as
W ×
H ×
C, where various colors correspond to distinct channels, spatial positions, or points on the feature map, each linked to an individual scalar value. The PSA distinguishes between different positions and treats all channels individually, assigning a unique weight to each neuron. Consequently, the PSA provides 3D weights that surpass the capabilities of traditional 1D and 2D attention mechanisms. Moreover, the PSA incorporates existing attention modules into each block, enhancing the output from the leading layer.
In order to incorporate both spatial and channel dimensions in 3D weights and effectively distinguish the target neuron from other, it is necessary to measure a value that distinguishes the target neuron from the rest, which enables the network to acquire more discriminative features. Consequently, we define the energy function for each neuron as follows:
where
and
are the weights and biases of the neuron transformation,
is the target neuron,
is the other neurons,
i and
j are spatial indices, and each channel has
N =
H ×
W energy functions. Therefore, the analytical solution for Equation (3) is:
We can compute the minimum energy
utilizing the following formula:
Enhancement processing of features improve their quality or emphasize specific characteristics:
Among the steps in the enhancement processing, the operation E groups all values in both channel and spatial dimensions and applies a Sigmoid function to limit the value of E. Except for the calculation of channel mean and variance , all computations in this module are element-wise operations. This attention mechanism is unique compared to other attention mechanisms and greatly enhances the flexibility of the network.
2.6. Loss Function
The CIoU loss, as outlined in [
18], can expedite the bounding box regression process. During the regression process, in the regression phase, if there exists a linear relationship between the aspect ratio of the predicted box and the ground truth box, the penalty term introduced in CIoU for the relative ratio loses its effectiveness. When one of the dimensions (either width or height) experiences an increase, the corresponding other dimension must decrease; it is not possible for both dimensions to increase or decrease simultaneously. To address this problem, we employ the EIoU loss function, which decomposes the loss into three components: the overlap loss
LEIoU measuring the overlap between the predicted box and the ground truth box, the center distance loss
Ldis quantifying the distance between the centers of the predicted box and the ground truth box, and the aspect ratio loss
Lasp characterizing the aspect ratio disparity between the predicted box and the ground truth box. The EIoU directly penalizes the predicted values of width
w and height
h, as shown below:
IoU denotes the intersection over union, while and represent the width and height of the minimum bounding rectangle for the predicted box and ground truth (GT) box, respectively. represents the Euclidean distance between the predicted box and the target box, denotes the difference in width between the predicted box and the target box, and represents the difference in height between the predicted box and the target box.
The first two components of the EIoU loss maintain the approach employed in the CIoU. However, the loss associated with width and height directly minimizes the dissimilarity between the predicted box and the ground truth box concerning their width and height, consequently accelerating the convergence process.
2.7. Evaluation Criteria
The evaluation metrics for IE-YOLOv5 include precision, recall, average precision (AP), mean average precision (mAP), and frames per second (FPS). FPS denotes the model’s processing capacity, indicating the number of images processed per second, which directly reflects the detection speed. Precision signifies the likelihood that all positive samples detected by the model are indeed positive samples, whereas recall quantifies the probability of detecting positive samples within the actual positive sample set. Equations (7) and (8) express precision and recall.
True positives (TP) denote the count of positive samples accurately predicted by the model and False positives (FP) signify the quantity of positive samples erroneously predicted by the model, while false negatives (FN) denote the quantity of negative samples overlooked by the model. After calculating the intersection over union (IoU) between each detection box and ground truth box, we can derive TP, FP, and FN values using a specified IoU threshold.
AP (average precision) denotes the area under the precision–recall curve pertaining to a particular class. It can be calculated using Equation (9), where
K signifies the count of classes,
P represents precision, and
R represents recall.
mAP (mean average precision) represents the mean value of
AP across all classes, and it can be computed using Equation (10):
3. Experiments
3.1. Experimental Data Set
The experimental dataset used is the NEU (Northeastern University) Steel Surface Defect Dataset [
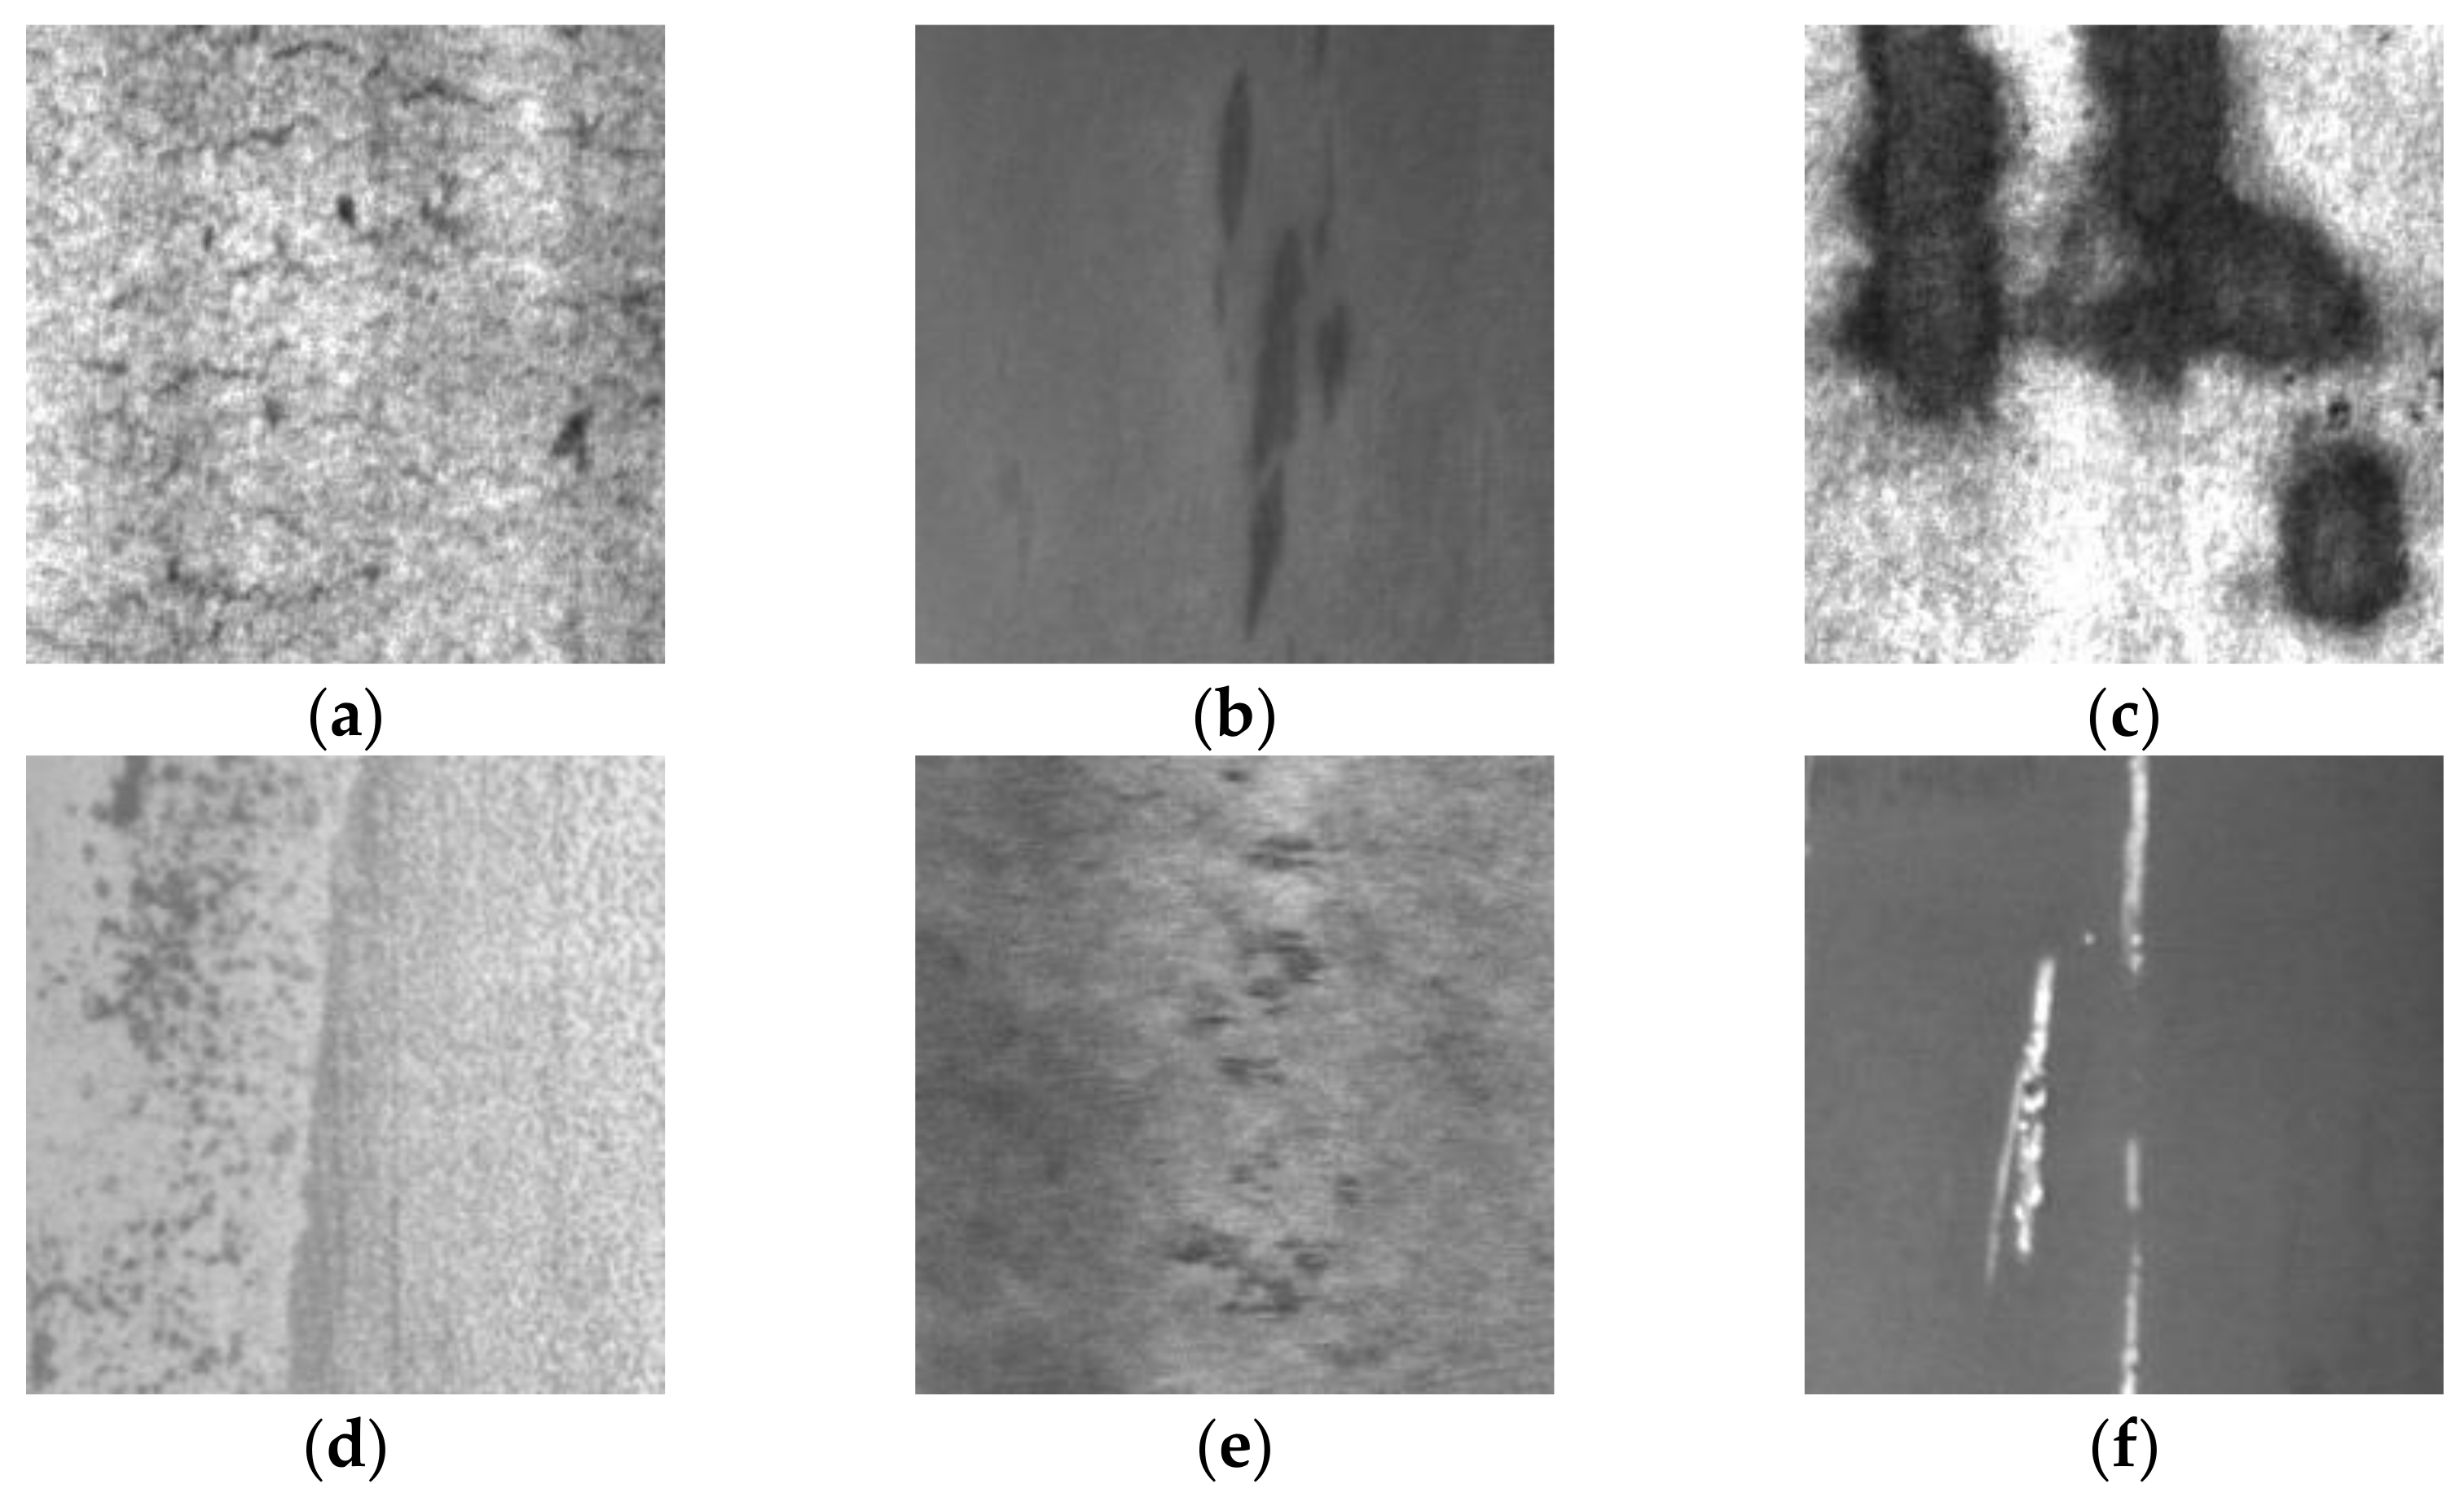
19]. This dataset consists of 6 categories of defect types, specifically crazing, inclusion, patches, pitted surface, rolled-in scale, and scratches, totaling 1800 defect images. Each class contains 300 images. To further enhance the NEU-DET dataset, we randomly selected 600 images from the training set. Due to the dataset having too few images and the images not being sufficiently distinct in terms of inter-class gaps as well as too large category gaps, we applied data augmentation techniques, including horizontal flipping, vertical flipping, and random cropping [
20]. The dataset was expanded to 2000 images.
Figure 8 displays the images for each defect class, and we divided the dataset into training, testing, and validation sets with a distribution ratio of 6:2:2.
3.2. Experimental Platform
All experiments were conducted on a unified platform as outlined in
Table 1.
3.3. Experimental Method
To assess the detection capabilities of the IE-YOLOv5 network using the NEU-DET defect detection dataset, ablation experiments were conducted to validate the optimization effects of each improvement module. Specifically, the following variants of YOLOv5 were compared:
YOLOv5-A uses the lightweight convolution method GSConv to replace the standard convolution in the Neck module.
YOLOv5-B builds upon YOLOv5-A by incorporating feature fusion using FF-Slim-Neck structure.
YOLOv5-C implements the PSA attention mechanism at the conclusion of the backbone network.
IE-YOLOv5 is the proposed model that combines all three improvement modules.
Through a comparative analysis of the performance of these various versions, we can evaluate the impact of each module on detection accuracy and efficiency.
To further substantiate the superiority of the proposed algorithm, we conducted comparative experiments with other widely recognized object detection algorithms, such as Faster R-CNN, SSD, YOLOv3, and YOLOv4. These algorithms find extensive application in the domain of object detection and serve as benchmarks for performance evaluation.
By comparing the detection accuracy, efficiency, and other metrics of the proposed algorithm (IE-YOLOv5) with these baseline algorithms, we can evaluate its performance and determine whether it outperforms or matches the most advanced methods in metal surface defect detection tasks.
4. Experimental Results and Analysis
4.1. Experimental Results
Based on the algorithm proposed in this study, the network model of IE-YOLOv5 was constructed.
Figure 9a illustrates the training and validation loss curves of the IE-YOLOv5 network. The curves show a significant decrease in loss during the initial training stages. After approximately 100 iterations, both the training and validation loss curves stabilize and converge to around 0.2. A loss curve that stabilizes around 0.2 indicates that the model gradually converges to a relatively low level of loss during training. A stable loss curve means that the model is no longer improving significantly and that it has learnt the patterns in the training data.
Figure 9b illustrates the average accuracy value curve for the IE-YOLOv5 network. After approximately 80 iterations, both the training and validation sets exhibit a stable trend, with the final mean average precision exceeding 96%. An average accuracy of over 96% indicates that the model has performed very well on the test data and was able to accurately classify most of the samples. This indicates that the model has learnt the important features of the data and is able to achieve highly accurate predictions on new data.
Figure 10a depicts the comparison of mean average precision curves for YOLOv5, YOLOv5-A, YOLOv5-B, YOLOv5-C, and IE-YOLOv5. After approximately 120 iterations, YOLOv5 stabilizes, achieving a final mean average precision of around 94%. YOLOv5-A stabilizes after approximately 110 iterations, achieving a final mean average precision of around 95%. YOLOv5-B stabilizes after approximately 100 iterations, achieving a final mean average precision of around 96%. Similarly, YOLOv5-C stabilizes after approximately 100 iterations, achieving a final mean average precision of around 96%.
The IE-YOLOv5 network exhibits improved accuracy, with a respective increase of 2.4%, 1.2%, 0.6%, and 0.7%, compared to YOLOv5, YOLOv5-A, YOLOv5-B, and YOLOv5-C.
As illustrated in
Figure 10b, it is evident that the enhanced model (IE-YOLOv5) achieves the convergence state more rapidly compared to the original YOLOv5 model as well as the YOLOv5-A, YOLOv5-B, and YOLOv5-C models. The original YOLOv5 algorithm exhibits significant instability in the initial stages, while the IE-YOLOv5 algorithm demonstrates smoother training loss curves. At the end of training, the training loss of IE-YOLOv5 was 27% lower compared to YOLOv5.
The findings demonstrate that the proposed approach minimizes loss and effectively addresses overfitting, resulting in a more stable and efficient training process for the IE-YOLOv5 model.
4.2. Analysis of Ablation Experiments
The model parameters of YOLOv5, YOLOv5-A, YOLOv5-B, YOLOv5-C, and IE-YOLOv5 are presented in
Table 2.
Table 2 presents the results, with the “Inference Time” column displaying the average time needed for the model to infer a single image, and the “Weight” column indicating the model’s volume or size.
Table 3 illustrates the results of the comparative experiments, showcasing how various model variants affect the performance of the YOLOv5 model:
Model YOLOv5-A achieved notable improvements compared to the original YOLOv5 model. It showed a 3.6% reduction in inference time, a 0.8% increase in mean average precision (mAP), and a 1.6% boost in frames per second (FPS). This indicates that replacing the standard convolution (Conv) with GSConv not only reduced inference time but also improved the detection accuracy and speed.
The YOLOv5-B model demonstrated a 1.3% mAP improvement over the original YOLOv5 model. It validates the effectiveness of incorporating the FF-Slim-Neck structure while keeping the model’s size and inference time nearly unchanged. The findings indicate that the FF-Slim-Neck structure enhanced the model’s ability to generalize and improved its accuracy in detecting defects.
Model YOLOv5-C, which incorporated the PSA attention mechanism, showed significant improvements. It experienced a 21.6% increase in volume, which may have led to a 3.6% decrease in detection speed. However, this was balanced by a 1% increase in mAP, demonstrating the effectiveness and efficiency of the proposed PSA attention mechanism. The improved feature fusion network played a significant role in performance enhancement.
Table 3.
Comparison of Evaluation Indicators of Models.
Table 3.
Comparison of Evaluation Indicators of Models.
| Model | AP | mAP | FPS |
|---|
| Craze | Inclusion | Patch | Pit | Roll | Scratch |
|---|
| YOLOv5 | 93.9% | 93.8% | 94.7% | 94.3% | 93.4% | 95.7% | 94.3% | 48.65 |
| YOLOv5-A | 95.2% | 96.1% | 95.2% | 95.5% | 94.2% | 96.5% | 95.5% | 49.45 |
| YOLOv5-B | 95.7% | 96.5% | 95.6% | 96.3% | 95.1% | 97.1% | 96.1% | 48.69 |
| YOLOv5-C | 94.6% | 96.3% | 95.3% | 96.3% | 95.6% | 97.9% | 96.0% | 46.29 |
| IE-YOLOv5 | 95.7% | 97.2% | 96.3% | 96.5% | 96.4% | 98.1% | 96.7% | 46.17 |
In this study, the comparison between the proposed IE-YOLOv5 model and the original YOLOv5 model yields the following results:
The IE-YOLOv5 model shows a 21.6% increase in volume, which indicates more parameters and potentially better representation capacity.
There was a 5.1% decrease in detection speed for the IE-YOLOv5 model compared with the original YOLOv5 model, suggesting a slight reduction in real-time inference performance.
The inference time was significantly reduced by 10.7% compared to the original YOLOv5, which shows overall computational efficiency improvement.
There was a 2.4% improvement in mean average precision (mAP) compared to original YOLOv5, which indicates enhanced detection accuracy across different defect types.
The IE-YOLOv5 model demonstrated increased detection accuracy for inclusion, roll, and scratch defects by 3.4%, 3.0%, and 2.4%, compared to the original YOLOv5, respectively.
These findings demonstrate that the improved feature fusion network in the IE-YOLOv5 model effectively contributes to enhancing the algorithm’s performance, especially with regard to detection accuracy and inference efficiency.
The defect detection speed of IE-YOLOv5 exhibits a marginal decrement of 5.1% when compared to the original YOLOv5. This signifies that under identical hardware and environmental conditions, IE-YOLOv5 necessitates a slightly longer duration to process images and generate defect detection outcomes. This diminished detection speed could potentially impact real-time applications that require swift responses, such as defect detection tasks on production lines, where sluggish performance may lead to reduced production efficiency.
Despite the slight reduction in detection speed, IE-YOLOv5 showed a 10.7% reduction in inference time. This denotes that the computational time required for each model inference is truncated. A shortened inference time holds particular significance for applications that mandate frequent model inferences, as it can enhance the overall system efficiency.
IE-YOLOv5 has struck a balance between performance and efficiency, rendering it suitable for certain scenarios. However, for real-time applications necessitating high-speed detection, the adoption of swifter models or hardware acceleration may be imperative.
4.3. Algorithm Performance Analysis
Table 4 displays the detection outcomes obtained using different algorithms. As indicated by the results in
Table 4, the proposed algorithm in this study demonstrates outstanding performance in detecting metal surface defects, achieving the best overall metrics. The average precision for three types of metal surface defects, namely inclusion, pit, and scratch, reaches an impressive 97%, surpassing SSD’s lower recall rate for dense defects and enhancing the detection accuracy by 5.3%.
Moreover, in terms of algorithm speed, the adoption of the slender-neck structure in this study leads to minimal computational overhead, resulting in an impressive detection frame rate of 46.17 fps. This is significantly higher compared to Faster R-CNN and SSD networks, with an improvement of 28.5 fps and 17.28 fps, respectively. The implementation of the slender-neck structure is a key contributing factor to this remarkable speed enhancement.
The application of the improved IE-YOLOv5 algorithm, trained using the proposed method, to NEU-DET defect detection is depicted in
Figure 10. From
Figure 11, the enhanced algorithm presented in this research is better suited for real-world production processes compared to the original network.
5. Application Notes
Successful implementation of the IE-YOLOv5 method in an industrial setting entails a series of crucial steps and considerations. The following are key points to take into account:
Data collection and preparation: gather diverse image data representing industrial environments, including various types of metal defects and different environmental conditions. Cleaning, labelling, and pre-processing of data to prepare datasets for training and testing IE-YOLOv5 models.
Model training: select IE-YOLOv5 as the base model and fine-tune it according to industrial requirements. Perform hyperparameter tuning to achieve optimal performance. Train the model on large-scale datasets to improve its generalization capabilities.
Hardware and the infrastructure: choose the appropriate hardware platform, such as GPUs or edge devices, to support the real-time performance of IE-YOLOv5. Configure a suitable computer vision workstation or server for model training and inference.
Model deployment: deploy the trained IE-YOLOv5 model onto target devices or systems in the industrial environment. Integrate the model with existing industrial automation systems to ensure smooth data flow and collaboration with other devices.
Performance evaluation and fine-tuning: assess the performance of IE-YOLOv5 in the actual industrial environment, including accuracy, detection speed, and robustness. Fine-tune the model further based on specific task requirements.
Security and privacy: address data security and privacy concerns to ensure compliance with regulations and standards for handling and storing image data. Implement measures to prevent potential attacks and data leaks.
Operator training: provide appropriate training for personnel to ensure they can use the IE-YOLOv5 system correctly, understand its outputs, and take appropriate actions in response to detected defects.
Maintenance and updates: establish a maintenance plan to regularly monitor and maintain the IE-YOLOv5 system to ensure stable performance and keep it up-to-date. Over time, update the model to adapt to new defect types or changes in environmental conditions.
When implementing the IE-YOLOv5 method, you may encounter the following challenges and considerations:
Data quality: Data quality is crucial for model training and deployment. Noise, inconsistency, or labeling errors can negatively impact model performance.
Real-time requirements: some industrial applications demand real-time performance, necessitating hardware and model capabilities to meet these requirements.
Hardware costs: selecting the right hardware can involve high costs, particularly for large-scale deployments.
Compliance: ensure that the implementation of IE-YOLOv5 complies with industrial and regulatory standards, especially in highly regulated industries such as healthcare and aerospace.
Environmental variability: industrial environments can be influenced by factors such as temperature, humidity, and lighting, which may adversely affect model performance.
False positives and negatives: models may produce false positives or negatives, potentially leading to issues in production.
Maintenance and updates: models require regular maintenance and updates to adapt to new defect types and changing environmental conditions.
Successful implementation of the IE-YOLOv5 method requires careful planning, resource allocation, and collaboration across cross-functional teams. Addressing these challenges and considering these factors will help ensure that defect detection systems in industrial environments operate efficiently and provide accurate results.
6. Conclusions
A novel method based on the Information Enhancement YOLOv5 Network (IE-YOLOv5) for detecting surface defects of metal part is proposed in this paper. A slender neck module, FF-Slim-Neck, which combined GSConv and federated learning-based feature fusion is introduced in IE-YOLOv5, which can realize a lightweight network with high detection efficiency. A parameter-free spatial attention module (PSA) was used in IE-YOLOv5, which can realize poor information feature extraction in crucial areas without the need for excessive structural adjustments. Overall optimization and adjustments were made to the backbone network of IE-YOLOv5, which significantly reduces the model’s parameters and improves its efficiency. Experiments were carried out with the NEU-DET public dataset from Northeastern University. The experimental results indicate that the proposed algorithm for detecting defects on metal surfaces achieves an average precision of 96.7% when identifying six different types of surface imperfection: crazing, inclusions, patches, pitting, scaling, and scratches. This represents a 2.4% enhancement in precision compared to the YOLOv5 algorithm. This enhancement aligns well with the demands of defect detection in industrial settings for metal parts. IE-YOLOv5 has important practical implications for the actual detection of metal defects on a number of levels, including increased productivity, reduced inspection times in the metal manufacturing process, which is essential for increased productivity, and more accurate detection and identification of metal defects resulting in a reduction in reject rates. Reducing defect rates not only saves money, but also improves product quality and improves safety, reducing the need for manual intervention and lowering the risk of operator injury.
In considering the future research directions for the IE-YOLOv5 method, we propose an exploration of semi-supervised or self-supervised learning approaches to reduce its dependency on large-scale annotated data. This endeavor aims to enhance the utility of IE-YOLOv5 in scenarios characterized by data scarcity. Additionally, we will investigate the fusion of multi-modal data from various sensors, such as images, audio, and temperature readings, into the IE-YOLOv5 framework to enhance defect detection and recognition capabilities. This approach holds the potential to elevate the algorithm’s robustness in complex environments.
Author Contributions
Methodology, Y.Z.; software, H.W.; validation, Y.Z., H.W. and X.X.; investigation, Y.X.; resources, H.W.; writing—original draft preparation, Y.Z.; writing—review and editing, Y.Z.; visualization, H.W.; supervision, C.Y.; project administration, H.W. All authors have read and agreed to the published version of the manuscript.
Funding
This research was funded by “The overseas study visit and training program for out-standing young backbone talents of Anhui Province, grant number gxgwfx2021035”, “The innovation team of Anhui Polytechnic University”, “Graduate Student Innovation Project of Anhui Province, grant number 2022xscx097”, “Anhui Polytechnic University-Jiujiang District Industrial Collaborative Innovation Special Fund Project, grant number 2022cyxtb4” and Anhui Future Technology Research Institute Enterprise Cooperation Project, grant number 2023qyhz16.
Institutional Review Board Statement
Not applicable.
Informed Consent Statement
Not applicable.
Data Availability Statement
The data that support the findings of this study are available from the corresponding author at the time the paper is accepted, upon reasonable request.
Acknowledgments
I would first like to thank my supervisor, Jingsong Gui, whose expertise was invaluable in formulating the research questions and methodology. Your insightful feedback pushed me to sharpen my thinking and brought my work to a higher level. I would also like to thank my tutor, Ronghua Fu, for their valuable guidance throughout my studies. You provided me with the tools that I needed to choose the right direction and successfully complete my dissertation.
Conflicts of Interest
The authors declare no conflict of interest.
References
- Lv, X.; Duan, F.; Jiang, J.-j.; Fu, X.; Gan, L. Deep metallic surface defect detection: The new benchmark and detection network. Sensors 2020, 20, 1562. [Google Scholar] [CrossRef] [PubMed]
- Ren, H.; Tian, K.; Hong, S.; Dong, B.; Xing, F.; Qin, L. Visualized investigation of defect in cementitious materials with electrical resistance tomography. Constr. Build. Mater. 2019, 196, 428–436. [Google Scholar] [CrossRef]
- Chen, M.; Yu, L.; Zhi, C.; Sun, R.; Zhu, S.; Gao, Z.; Ke, Z.; Zhu, M.; Zhang, Y. Improved faster R-CNN for fabric defect detection based on Gabor filter with Genetic Algorithm optimization. Comput. Ind. 2022, 134, 103551. [Google Scholar] [CrossRef]
- Wang, Z.; Xie, W.; Chen, H.; Liu, B.; Shuai, L. Color Point Defect Detection Method Based on Color Salient Features. Electronics 2022, 11, 2665. [Google Scholar] [CrossRef]
- Bayraktar, E.; Tosun, B.; Altintas, B.; Celebi, N. Combined GANs and Classical Methods for Surface Defect Detection. In Proceedings of the 2022 30th Signal Processing and Communications Applications Conference (SIU), Safranbolu, Turkey, 15–18 May 2022; pp. 1–4. [Google Scholar]
- Xia, B.; Luo, H.; Shi, S. Improved faster R-CNN based surface defect detection algorithm for plates. Comput. Intell. Neurosci. 2022, 2022, 3248722. [Google Scholar] [CrossRef] [PubMed]
- Zhang, J.; Xu, J.; Zhu, L.; Zhang, K.; Liu, T.; Wang, D.; Wang, X. An improved MobileNet-SSD algorithm for automatic defect detection on vehicle body paint. Multimed. Tools Appl. 2020, 79, 23367–23385. [Google Scholar] [CrossRef]
- Zheng, J.; Han, Q.; Wang, L.; Wang, S.; Zhang, Z.; Wang, L.; Wang, L. Lightweight Bimodal Rail Surface Defect Detection Method: Parallel-YOLOv4-Tiny. In Proceedings of the 2021 5th International Conference on Video and Image Processing, Guangzhou, China, 22–25 December 2021; pp. 98–103. [Google Scholar]
- Khan, L.U.; Saad, W.; Han, Z.; Hossain, E.; Hong, C.S. Federated learning for internet of things: Recent advances, taxonomy, and open challenges. IEEE Commun. Surv. Tutor. 2021, 23, 1759–1799. [Google Scholar] [CrossRef]
- Wu, W.; Liu, H.; Li, L.; Long, Y.; Wang, X.; Wang, Z.; Li, J.; Chang, Y. Application of local fully Convolutional Neural Network combined with YOLO v5 algorithm in small target detection of remote sensing image. PLoS ONE 2021, 16, e0259283. [Google Scholar] [CrossRef] [PubMed]
- Kattenborn, T.; Leitloff, J.; Schiefer, F.; Hinz, S. Review on Convolutional Neural Networks (CNN) in vegetation remote sensing. ISPRS J. Photogramm. Remote Sens. 2021, 173, 24–49. [Google Scholar] [CrossRef]
- Li, G.; Yun, I.; Kim, J.; Kim, J. Dabnet: Depth-wise asymmetric bottleneck for real-time semantic segmentation. arXiv 2019, arXiv:1907.11357. [Google Scholar]
- Huang, G.; Liu, Z.; Van Der Maaten, L.; Weinberger, K.Q. Densely connected convolutional networks. In Proceedings of the IEEE Conference on Computer Vision and Pattern Recognition, Honolulu, HI, USA, 21–26 July 2017; pp. 4700–4708. [Google Scholar]
- Lee, Y.; Hwang, J.-w.; Lee, S.; Bae, Y.; Park, J. An energy and GPU-computation efficient backbone network for real-time object detection. In Proceedings of the IEEE/CVF Conference on Computer Vision and Pattern Recognition Workshops, Long Beach, CA, USA, 16–20 June 2019; pp. 752–760. [Google Scholar]
- Wang, C.-Y.; Liao, H.-Y.M.; Wu, Y.-H.; Chen, P.-Y.; Hsieh, J.-W.; Yeh, I.-H. CSPNet: A new backbone that can enhance learning capability of CNN. In Proceedings of the IEEE/CVF Conference on Computer Vision and Pattern Recognition Workshops, Seattle, WA, USA, 14–19 June 2020; pp. 390–391. [Google Scholar]
- Yao, X.; Huang, T.; Wu, C.; Zhang, R.; Sun, L. Towards faster and better federated learning: A feature fusion approach. In Proceedings of the 2019 IEEE International Conference on Image Processing (ICIP), Taipei, Taiwan, 22–25 September 2019; pp. 175–179. [Google Scholar]
- Hu, J.; Shen, L.; Sun, G. Squeeze-and-excitation networks. In Proceedings of the IEEE Conference on Computer Vision and Pattern Recognition, Salt Lake City, UT, USA, 18–22 June 2018; pp. 7132–7141. [Google Scholar]
- Yu, J.; Jiang, Y.; Wang, Z.; Cao, Z.; Huang, T. Unitbox: An advanced object detection network. In Proceedings of the 24th ACM International Conference on Multimedia, Amsterdam, The Netherlands, 15–19 October 2016; pp. 516–520. [Google Scholar]
- Bao, Y.; Song, K.; Liu, J.; Wang, Y.; Yan, Y.; Yu, H.; Li, X. Triplet-graph reasoning network for few-shot metal generic surface defect segmentation. IEEE Trans. Instrum. Meas. 2021, 70, 5011111. [Google Scholar] [CrossRef]
- Bayraktar, E.; Yigit, C.B.; Boyraz, P. A hybrid image dataset toward bridging the gap between real and simulation environments for robotics: Annotated desktop objects real and synthetic images dataset: ADORESet. Mach. Vis. Appl. 2019, 30, 23–40. [Google Scholar] [CrossRef]
| Disclaimer/Publisher’s Note: The statements, opinions and data contained in all publications are solely those of the individual author(s) and contributor(s) and not of MDPI and/or the editor(s). MDPI and/or the editor(s) disclaim responsibility for any injury to people or property resulting from any ideas, methods, instructions or products referred to in the content. |
© 2023 by the authors. Licensee MDPI, Basel, Switzerland. This article is an open access article distributed under the terms and conditions of the Creative Commons Attribution (CC BY) license (https://creativecommons.org/licenses/by/4.0/).


 ,
, 