Featured Application
In this study, the impact of errors and missing information in the inventory data of highway–rail grade crossings (HRGCs) on the crash frequency prediction models currently used in the US is investigated. Transportation authorities and safety regulators can apply the insights gained from this research to enhance the accuracy of crash frequency prediction models for HRGCs. By utilizing more accurate and complete inventory data, these models provide more reliable crash frequency predictions, enabling better resource allocation and more targeted safety interventions.
Abstract
The highway–rail grade crossings (HRGCs) crash frequency models used in the US are based on the Federal Railroad Administration’s (FRA) database for highway–rail crossing inventory. Inaccuracies or missing values within this database directly impact the estimated parameters of the crash models and subsequent crash predictions. Utilizing a set of 560 HRGCs in Nebraska, this research demonstrates variations in crash predictions estimated by the FRA’s 2020 Accident Prediction (AP) model under two scenarios: firstly, employing the unchanged, original FRA HRGCs inventory dataset as the input, and secondly, utilizing a field-validated inventory dataset for the same 560 HRGCs as input to the FRA’s 2020 Accident Prediction (AP) model. The findings indicated a significant statistical disparity in the predictions made with the two input datasets. Furthermore, two new Zero-inflated Negative Binomial (ZINB) models were estimated by employing 5-year reported HRGCs crashes and the two inventory datasets for the 560 HRGCs. These models facilitated the comparison of model parameter estimates and estimated marginal values. The results indicated that errors and missing values in the original FRA HRGCs inventory dataset resulted in crash predictions that statistically differed from those made using the more accurate and complete (validated in the field) HRGCs inventory dataset. Furthermore, the crash prediction model estimated upon the corrected inventory data demonstrated enhanced prediction performance, as measured by the statistical fitness criteria. The findings emphasize the importance of collecting complete and accurate inventory data when developing HRGCs crash frequency models. This will enhance models’ precision, improve their predictive capabilities to aid in better resource allocation, and ultimately reduce HRGCs crashes.
1. Introduction
Highway–rail grade crossings (HRGCs) hold significance within the transportation network landscape due to their role in the intersection of rail and highway networks. Traffic crashes at HRGCs are often more severe compared to crashes at other locations, and they present the risk of multimodal traffic disruption (i.e., interruption of rail, motor vehicle, bicyclist, and pedestrian traffic). The involvement of hazardous materials may further aggravate crash consequences at HRGCs. The Federal Railroad Administration (FRA) reported 2195 crashes at HRGCs in 2022 across the US, including 274 fatalities and 810 injuries. Fatal crashes accounted for 12.48% of the total reported crashes []. Identification of the factors contributing to HRGCs crashes and their frequency are important aspects to improve safety at these locations.
Different types of statistical and machine learning models are available for understanding crash phenomenon and to predict future crashes at HRGCs. Transportation agencies often use crash predictions from such models for the identification of problematic HRGCs, further investigation, and allocation of safety improvement resources. These models invariably utilize reported crashes and HRGCs inventory characteristics, such as roadway and track features, signage, train, and motor vehicle traffic volume. The main source of HRGCs inventory data in the US is the FRA’s Office of Railroad Safety highway–rail crossing database files []. The accuracy and completeness of the HRGCs inventory data are important as they can affect the estimated model parameters and consequently crash predictions from the estimated model [].
The purpose of this research was to assess the effects of errors and missing information in the FRA’s HRGCs inventory data on crash frequency model estimation and HRGCs crash predictions. The research was based on the original (unaltered) FRA HRGCs inventory dataset for 560 HRGCs located in Nebraska, and a field/site verified the HRGCs inventory database for those 560 HRGCs obtained by comparing the unaltered FRA HRGCs inventory data to on-site conditions and correcting any erroneous and/or missing data. This research illustrates the importance of having accurate and complete HRGCs data by identifying differences in crash predictions using the two datasets in the newly published FRA’s 2020 Accident Prediction (AP) model []. The two inventory datasets were utilized to estimate two comparative Zero-inflated Negative Binomial (ZINB) models, and an examination of model performance was conducted, considering fitness criteria such as Akaike Information Criteria (AIC) and Bayesian Information Criteria (BIC). The following two hypothesis were tested for this research: (1) there is no difference in the expected value of crashes (crash predictions) estimated by utilizing FRA and field-validated data (α = 5%), and (2) there is no statistical difference in the estimated parameters’ coefficients and performance of new crash frequency prediction models based on the two datasets (FRA vs field-validated) (α = 5%).
Figure 1 shows the approach used for this research and provides a framework to explain data collection, the methodology employed, and the analysis conducted. It is important to mention that this paper constitutes a segment of a doctoral dissertation [], with its primary focus centered on the analysis of the impacts of inaccuracies and missing values within the HRGCs inventory data on the crash frequency and severity prediction models; the research utilized the Federal Railroad Administration (FRA) and the field-validated HRGCs inventory datasets.
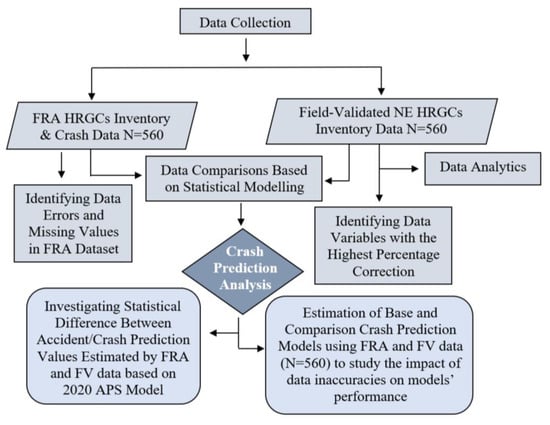
Figure 1.
Research framework for crash prediction analysis [].
The remainder of this paper is organized as follows. The next section presents a review of the literature on crash frequency prediction models and methods to deal with over-dispersion issues regarding HRGCs crashes. A section describing the inventory data verification follows. The next section covers the methodology, including tested hypotheses, a detailed explanation of the Zero-inflated Negative Binomial (ZINB) model, and the results of the analysis, including model comparisons. The last section summarizes key results and presents the study’s conclusions, along with its limitations and recommendations for future research. This paper preferentially refers to train-involved collisions at HRGCs as crashes but also uses accidents in certain contexts (e.g., Accident Prediction and Severity Model). Additionally, the word “Data” is treated as a plural noun in this manuscript.
2. Literature Review
Crash modeling and prediction are critical for establishing systems for evaluating and managing traffic safety [,,,,]. Policymakers and traffic engineers often use these models to analyze the performance of safety interventions and assess the safe functioning of the transportation system. For highway intersections or segments, as well as HRGCs, the links between vehicle crashes and geometric design, traffic characteristics, and engineering factors have been well researched using statistical models. Train–vehicle crash injury and mortality rates are greater than other forms of traffic crashes, mostly due to the significant mass difference between trains and motor vehicles, making HRGCs just as significant as highway intersections for crash modeling and prediction [,].
The Poisson regression model, including its variants, have served as examination tools for vehicular crash frequency [], as well as drivers’ unsafe maneuvers at HRGCs in the presence of trains []. Negative Binomial (NB) and Zero-inflated Poisson (ZIP) are two widely used Poisson model variations []. These models cope with issues like data over-dispersion (when the sample variance is greater than the sample mean) and prevalence of zeros in crash data. On occasion, crash data may be under-dispersed, i.e., sample variance is less than sample mean. Standard distributions such as Poisson and Negative Binomial do not handle this well [,], but a family of Generalized Poisson (GP) regression models are suitable in such situations []. To elucidate further, the published literature provides several studies focused on crash modeling for HRGCs [,,,,,]. Table 1 presents an overview of the studies on HRGCs crash prediction models, including the methodology used, data resources utilized, and explanatory variables considered in the predictive modeling process.

Table 1.
Salient features of relevant HRGCs crash frequency modeling studies [].
With the availability of machine learning methods, new strategies for modeling crash predictions at HRGCs have emerged that overcome the limitations of Generalized Linear Modeling (GLM) [,]. The Generalized Linear Modeling methods use a mathematical formula to represent the relationship between dependent and independent variables. In this regard, Zheng et al. [] in a recent study used a Neural Network (NN) system to assess train–vehicle crash risk at HRGCs to receive meaningful rankings of crash–contributory–variable significance based on different criteria, as well as to produce dependent nonlinear contributor–crash curves with all other contributors considered for a specific contributor variable. Likewise, Zhang et al. [] used Deep Neural Network (DNN) models to model crash frequency and examined predictions and model interpretability in comparison to Generalized Linear Models.
In the past, various transportation agencies have utilized the US Department of Transportation’s Accident Prediction (AP) model, which was developed in 1986 (henceforth referred to as the 1986 AP model), to assess the probability of accidents at HRGCs []. While this model did include a severity prediction component, the primary focus of this research was on predicting crash frequency. In 2020, the Federal Railroad Administration (FRA) updated this model for several reasons, including low variance in the 1986 AP model’s generated crossing ratings, the utilization of three distinct models for crash prediction based on the type of crossing, and the absence of a statistical evaluation of crash risk at HRGCs []. The new model, henceforth referred to as the ‘FRA’s 2020 Accident Prediction (AP) model, addresses various weaknesses in the 1986 AP model [].
Below is the two-part FRA’s 2020 Accident Prediction (AP) model, with the first part as a count model and second part as a zero-inflated model. Before considering the possibility of excess zeroes, the count model is for predicted crashes []. The zero-inflation model distinguishes amongst two types of HRGCs with zero crashes reported in any period: those that are safe and will always have zero crashes and those that may have one of more crashes in the future. The total number of trains is the explanatory variable for the zero-inflated model; fewer trains at an HRGC gives greater probability of excess zeros.
where represents the predicted crashes of the count model; data for the left-hand side of regression are HRGCs crash counts in a 5-year period (2014–2018). is the probability that the grade crossing is an “excess zero”, are predicted crashes after accounting for excess zeroes, are the estimated parameters’ coefficients of the two-part Zero-inflated Negative Binomial (ZINB) model, indicates the logit model to explain the zero-inflated component, the is the natural log-transformed exposure, equal to average annual daily traffic times and daily trains, and and are the indicator variables for warning-device-type lights and gates. shows rural or urban classification of the crossing road, shows the type of surface used (timber, asphalt concrete, rubber or their combination), indicates natural log-transformed maximum timetable speed (integer value between 0 and 99), shows natural log-transformed average annual daily traffic, and shows natural log-transformed total number of daily trains.
The FRA public HRGCs database is the basis for most of the HRGCs crash safety research in the US [,]. However, this database contains dated data (e.g., AADT values from the 1970′s), errors, and missing values [,]. Several studies have examined the physical aspects of HRGCs to understand the causes of crashes. However, these studies did not emphasize the accuracy of the data utilized for crash prediction modeling [,,,,]; inaccuracies can impact crash model estimations and subsequent crash predictions, which are critical for public safety. This necessitates a study based on accurate and up-to-date inventory to identify factors associated with HRGCs crashes, thereby allowing for better understanding of crash occurrence and more informed decisions on HRGCs safety.
3. Data
The research presented herein utilized data from the FRA inventory and crash databases. Crash history and inventory records of 560 public HRGCs across nine counties in Nebraska were extracted for the analysis. Additionally, a validated dataset was used from an NDOT prior study where site visits were made to those 560 public HRGCs to verify physical aspects in the FRA data. Each data element (e.g., roadway speed limit, number of train tracks, pavement marking, storage distance) was carefully checked at the site using a paper form; any erroneous FRA data were corrected along with the completion of any missing FRA data []. Figure 2 presents the process of identifying HRGCs for field visits, using Cass County as an example. Besides Cass County, the verification included HRGCs located in Lancaster, Douglas, Gage, Jefferson, Otoe, Saline, Sarpy, and Saunders counties. The selection of these counties was based on railroad network considerations, urban/rural location, traffic volumes, history of past crashes, county populations, and proximity to the University of Nebraska–Lincoln campus.
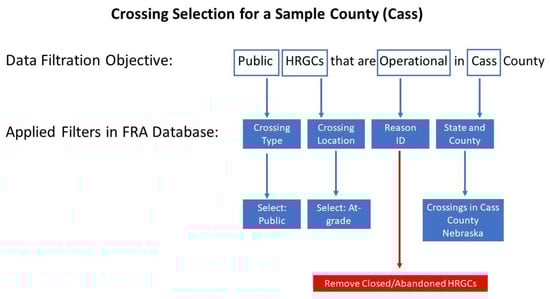
Figure 2.
FRA HRGCs data filtration process of a sample county (Cass) [].
The site verification of the FRA HRGCs inventory data resulted in the creation of a new, corrected, and more complete HRGCs database that was used for comparative model estimation and crash predictions. However, before model estimations and crash predictions, each of these two datasets were integrated with the FRA HRGCs Accident/Incident database using the unique FRA crossing ID. Crash data on the 560 HRGCs revealed 28 reported crashes during 2017–2021. These 28 crashes were 16.3% of all public HRGCs crashes reported in Nebraska during the same five-year period. For this study, HRGCs inventory data errors and missing information were the focus; such issues may also exist in the FRA HRGCs Accident/Incident database; however, those were not part of this research.
Data validation is the process of ensuring that the data entered into a system are accurate, complete, and consistent. It is an important step in the data management process as it helps us to ensure the integrity of the data and ensures that the data are fit for their intended purpose []. The inventory data of HRGCs in nine Nebraska counties were validated based on the checks illustrated in Figure 3.
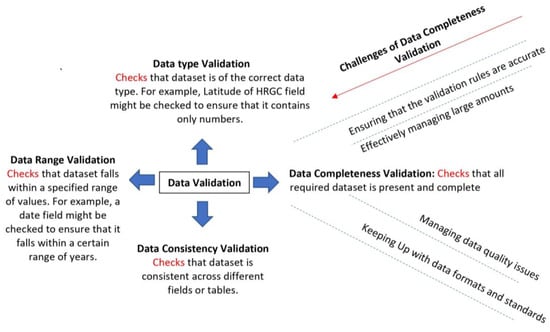
Figure 3.
Validation checks for HRGCs inventory data collection [].
For every HRGC visited, a comprehensive examination of 53 database variables was conducted and digital images were acquired. Any inaccuracies in the database were rectified in accordance with field conditions, and missing values were added if those attributes were found in the field. The disparity between the recorded information in the FRA HRGCs inventory database and the actual conditions at crossing 064112B is vividly exemplified in Figure 4, which showcases a discrepancy in the presence of yield signs, pavement type, approach surface type, and pavement markings in the FRA dataset compared to the on-ground conditions. The red square points indicate a zoomed illustration of yield signs and pavement marking.
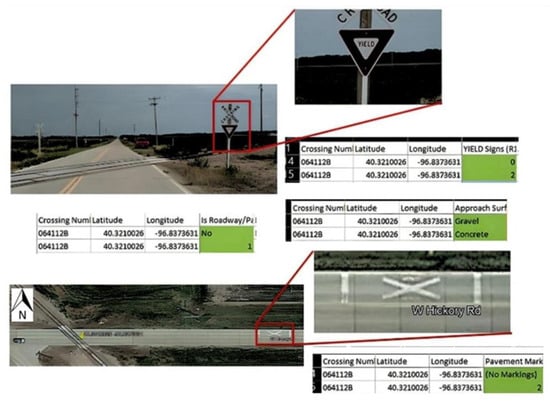
Figure 4.
Data correction example, crossing 064112B [].
Additionally, crossing storage distances were validated. For example, Figure 5 illustrates how the storage distance in the FRA data was measured as 64 feet, but field validation corrected it to 40 feet. The safety of HRGCs has been strongly correlated with storage distance [].
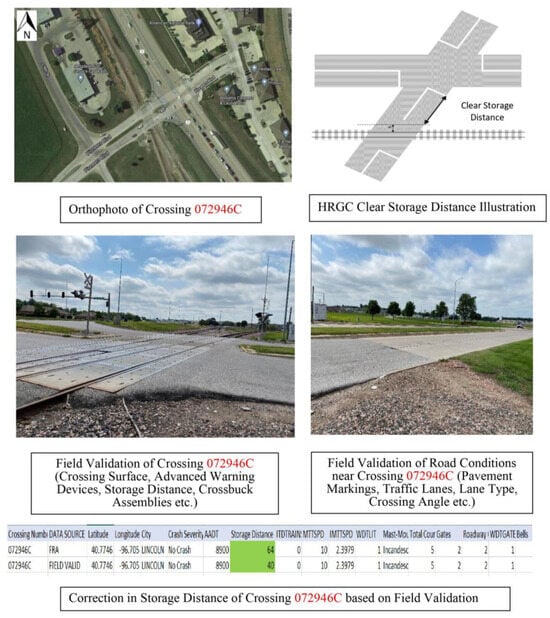
Figure 5.
Data correction example, crossing 072946C [].
The illustration in Figure 6 details data validation for a specific location (crossing 064130Y), where a discrepancy was found between the actual number of flashing light pairs and the number recorded in the Federal Railroad Administration’s (FRA) inventory dataset. The validation involved a field check and revealed the difference, indicating that the FRA inventory data entries on several physical aspects were incorrect.
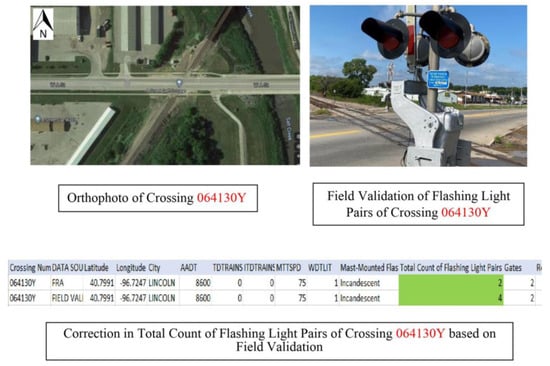
Figure 6.
Data correction example, crossing 064130Y [].
It should be noted that the satellite images presented in Figure 4, Figure 5 and Figure 6 are not scaled as satellite images inherently lack a uniform scale due to variations in altitude and sensor characteristics, making the addition of a scale potentially misleading [].
Table 2 provides a summary of the corrections and addition of missing values. In aggregate, data on 560 HRGCs were successfully verified. Additionally, six HRGCs sites were found to be abandoned, non-operational, or altogether non-existent. The effort resulted in 2241 corrected values and 1732 missing values added to the database, providing an average of 7.4% of the database values that were changed at every visited HRGCs. It is noteworthy that the research team was unable to verify dynamic characteristics such as daily train traffic and highway AADT. As such, those variable values in the FRA database and the corrected database were the same.
Table 2.
Field validation summary of corrections and added missing values (N = 560) [].
4. Methodology
In this research, the following two hypothesis were tested:
- (i)
- H0 = There is no difference in the expected crashes estimated by utilizing FRA and field-validated data (α = 5%).
To test the first hypothesis, we utilized the original FRA HRGCs inventory data and the field-validated inventory data (both merged with the FRA HRGCs accident/incident database) for the 560 HRGCs to estimate expected crashes by utilizing the FRA’s 2020 Accident Prediction (AP) model (Equations (1)–(4)). The two sets of expected crashes (crash predictions) were then statistically evaluated for differences at α = 5% (a 5% chance of incorrectly rejecting the null hypothesis). This step aimed to assess how erroneous or missing values in the HRGCs inventory data affect the estimation of expected crashes at HRGCs when the crash prediction models currently employed by the federal transportation agencies are utilized.
- (ii)
- H0 = There is no difference in the estimated parameters’ coefficients of new crash frequency prediction models from the two datasets (FRA Vs field-validated) (α = 5%).
For this hypothesis, we developed two new crash prediction models using both FRA and field-validated HRGCs inventory data. The objective was to determine whether the coefficient parameters in these models exhibited statistically significant differences. A base model was first estimated by utilizing the original FRA inventory data, and then another comparison model was estimated using the field-validated inventory data. For both models, the dependent variable was the past 5-year HRGCs crash counts (2017–2021). Data exploration showed that the variance of the crash counts was greater than its mean value, indicating overdispersion in the data. During the 5-year period, most HRGCs had zero crashes, with only a few crossings reporting 28 crashes. This condition warranted the estimation of a two-part Zero-inflated Negative Binomial Model (ZINB). The ZINB model provides a better goodness of fit when compared with the Poisson and the Negative Binomial (NB) Model [,,,,,,,,]. It also provides parametric expressions for counts of predicted crashes and expected crash count variance [].
A general ZINB model is written as []:
where E[a] is the predicted value of crash count, V[a] is the variance of the predicted estimate of crash count, μ is the mean of the Negative Binomial process, p is the likelihood of the entity being in the “always 0” case in the finite mixture model, and α is the over dispersion parameter of the Negative Binomial model (equal to 1/θ, theta is an estimated parameter for the model).
Table 3 presents the candidate independent variables chosen for model estimation. Before finalizing the model’s specification, a check of the multi-collinearity between candidate variables was performed, and those variables were chosen with a Variance Inflation Factor (VIF) < 10 and Tolerance (TOL) > 1 []. According to past research, the continuous variables (e.g., AADT) were natural Log-transformed to reduce the range of values within the variables []. PSCL package in R computing (R-project.org) was used for model estimation (accessed on 1 January 2020) []. Also, the model performance criteria were estimated, such as Akaike information criterion (AIC) and Bayesian information criterion (BIC) [,,].
Table 3.
Candidate variables for inclusion in base and comparison crash prediction models [].
5. Results and Discussion
Crash predictions (expected crashes) based on the FRA’s 2020 Accident Prediction (AP) model (by utilizing the two different datasets) yielded disparate results. To gain a deeper comprehension of the magnitude of these disparities, the percentage differences were computed and plotted. As depicted in Figure 7, a noticeable distinction is evident in the expected crash values obtained from the two inventory datasets. The figure illustrates the percentage variations between the FRA and field-validated (FV) data’s crash predictions. It is evident from the data that the percentage differences range from 0 to over 140%, suggesting that the anticipated crash counts could be nearly double or half of the actual crash count. Additionally, Figure 7 also shows that the majority of HRGCs demonstrated expected crash values within a 0–20% range of difference. However, a higher percentage difference in expected crashes was only observed in 7 HRGCs (1.25% of the total HRGCs).
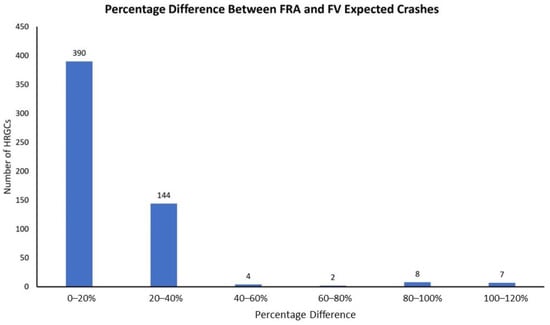
Figure 7.
Comparison of expected crashes: FRA vs. field-validated data [].
To conduct the first hypothesis test in this research, we examined whether the crash predictions estimated from the utilization of two datasets conform to a normal distribution. This initial step was crucial to guarantee the correct application of hypothesis tests. To assess the normality of predicted crashes using FRA and field-validated data, the Shapiro–Wilk test was employed, offering a formal determination of data normality (Ho = data distribution is normal, at α = 5%) [,]. A p-value below 0.05 during the Shapiro–Wilk test suggests non-normal distribution in at least one data column (expected crashes). In such instances, non-parametric tests are viable for dataset comparisons, such as the Wilcoxon rank-sum test (Mann–Whitney U test) or Kruskal–Wallis test [,]. These alternatives, unlike t-tests or ANOVA, are robust against non-normality assumptions, offering reliable options when normality criteria are not met.
The null hypothesis under examination through the Shapiro–Wilk normality test (Table 4) posited non-conformance of the data with a normal distribution. The test yielded a computed test statistic denoted as “W”, accompanied by its corresponding “p-value”. In the context of projected collision incidents drawn from two distinct datasets, the observed “p-value” exhibited a significance level below 0.05, indicative of compelling contradiction against the null hypothesis. Consequently, substantial support emerged to refute the assumption of normal distribution in the data. The values of “W”, representing the test statistic, for both data columns (pertaining to anticipated collision incidents) were confined within the interval of 0 to 1. The proximity of “W” to 1 corresponded to increased adherence to normality. However, both columns demonstrated “W” values below 1, implying notable departure from normality. To summarize, the outcomes derived from the Shapiro–Wilk normality test underscored the absence of normal distribution in the expected crashes obtained from the FRA and field-validated inventory datasets, when FRA’s 2020 Accident Prediction (AP) model was applied.
Table 4.
Statistical testing of normality and disparities in expected crashes [].
Given the absence of normality in expected crashes, a non-parametric statistical approach was chosen to compare dataset disparities. The Wilcoxon rank-sum test, a variant of the Mann–Whitney U test, was utilized to address Hypothesis 1 of this research []. This non-parametric counterpart to the two-sample t-test was applied, and the outcomes are presented in Table 4. The results of the test yielded a p-value below 0.05 and a test statistic (W) of 122,640, strongly indicating differing medians between the distributions. The alternate hypothesis, stipulating a nonzero true location shift, signifies that one population’s distribution is asymmetrically positioned relative to the other, implying distinct medians. Due to the non-parametric nature of the data, estimations such as mean values were not calculated. The test’s purpose was exclusively to ascertain evidence of distributional shifts between the two datasets.
The analysis of crash prediction using field-validated data demonstrated a discrepancy in the hazard rankings of HRGCs compared to rankings derived from FRA’s data. Table 5 highlights the impact of employing field-validated data instead of the original FRA inventory data on HRGCs hazard rankings. This reveals the potential for misallocating safety resources for HRGCs when an incomplete dataset is utilized for predictive modeling. For instance, a specific HRGC labeled as “074929T” is ranked third in terms of crash hazard when assessed with field-validated data but drops to fifth when using the original FRA data for crash prediction. Moreover, several crossings that ranked within the top-10 hazards in the FRA dataset do not maintain their top-10 rankings when evaluated using the field-validated dataset. This information underscores the significance of accurate inventory data; its absence could lead to oversight by agencies in allocating resources for crossings with actual high crash risks. Flawed ranking based on the current FRA datasets might result in the exclusion of crossings that warrant risk mitigation interventions.
Table 5.
Comparison of hazard ranking based on crash predictions: FRA vs. field-validated data [].
The second hypothesis of the research aimed to assess differences in estimated parameters and models’ performance based on the FRA and field-validated dataset. Also, it was studied to see if estimated coefficients are statistically significantly different in the two estimated Zero-inflated Negative Binomial (ZINB) models. Estimation of the base and comparison models using 5-year crashes (2017–2021) reported at the 560 HRGCs (finally reduced to N = 555) showed that the model based on the field-validated data gave a different expected magnitude of regressors when compared to the base model. However, it was yet to be determined if these differences were statistically significant. Table 6 presents the estimated base ZINB model that utilized the original FRA HRGCs inventory data (Table 3 provides variable coding).
Table 6.
Estimated base ZINB model utilizing original FRA inventory data [].
Table 7 presents the estimated comparison model based on field-validated inventory data (Table 3 provides variable coding). Table 6 and Table 7 also present the performance indicators for base and comparison ZINB models. Both models showed a different fitness performance based on the Akaike Information Criteria (AIC) and Byesian Information Criteria (BIC), indicating improved ZINB model fitness with the field-validated accurate inventory dataset [,].
Table 7.
Estimated ZINB comparison model utilizing field-validated inventory data [].
To conduct the second hypothesis test in this research, we followed the statistical methodology proposed by Clogg et al. []. This test aimed to evaluate the statistical significance of differences in parameter coefficients between the base and comparison Zero-inflated Negative Binomial (ZINB) models. The test outcomes indicated no significant statistical difference in the coefficients (Table 6 and Table 7). Notably, only variations in crash–risk rankings for HRGCs were observed between the two datasets based on crash prediction estimation (Table 5).
Comparative Analysis of Estimated Models
Key factors from the regression output of base and comparison models are as follows:
- The coefficients for Natural log-transformed Maximum Timetable Speed (IMAXTSPD) and Natural log-transformed Average Annual Daily Traffic (IAADT) exhibited positive signs in both models. However, the expected magnitude differed in both models, where the base model gave a higher coefficient expected magnitude for IAADT compared to the comparison model. Moreover, for IMAXTSPD, the comparison model gave a higher coefficient expected magnitude. The average marginal effect estimates presented in Table 8 show that a unit change in IAADT increases predicted crashes by 0.02681 in the base model and 0.02546 in the comparison model.
- The coefficients for warning-device-type flashing lights (WDTLIT) were negative for both models (i.e., compared to passive devices, warning flashing lights reduce predicted crashes). However, the coefficient expected magnitudes and average marginal effects (Table 8) of WDTLITs differ in both models, where the base model estimated a higher negative value compared to the comparison model.
- The coefficients of Ln-transformed total daily trains (ITDTRAINS) in the zero-inflated part in both the base and comparison models were negative, indicating that the probability of excess zeros decreases with the number of trains, as expected. However, the coefficient expected magnitudes of ITDTRAINS differed in both models.
- All the coefficients retained in both models indicated strong statistical significance. However, as shown in Table 9, the results of hypothesis tests revealed that the regression coefficients were not statistically significantly different when utilizing the two inventory datasets.
Table 8.
Average marginal effects for base and comparison models [].
Table 9.
Comparison of coefficients of the base and comparison ZINB models [].
Figure 8 illustrates a “Predicted crashes versus AADT (natural logarithm)” chart for a warning-device-type flashing light indicator. The chart indicates that for cases of HRGCS with no flashing lights in the original FRA dataset, the model gave higher crash predictions for maximum timetable speed ranging from 25 to 45 mph. However, the presence of flashing lights decreased predicted crashes, but only for low-speed trains. Additionally, in Figure 8 and Figure 9, the scales for the parameter IMAXTSPD (ranging from 0 to 4) represent the natural log-transformed values for the maximum timetable speed of trains. This transformation serves to normalize the data, handle outliers, and stabilize variance [,]. The gray areas in Figure 8 and Figure 9 represent standard errors, and the blue line shows the best-fit line.
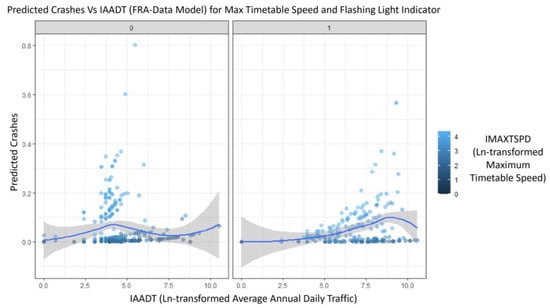
Figure 8.
Predicted crashes of base model for IMAXTSPD and WDTLITs [].
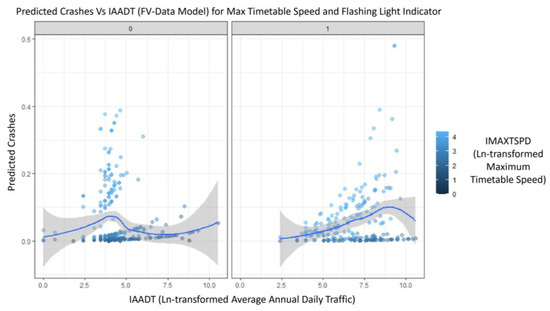
Figure 9.
Predicted crashes of comparison model for IMAXTSPD and WDTLITs [].
The trend of predicted crashes in the field-validation based model was different. Figure 9 illustrates the estimation of higher crash predictions for no flashing lights indicator with higher train speeds.
The estimated parameters from both base and comparison model gave intuitive results, as previously shown in the literature. For instance, variables such as average annual daily traffic, flashing light as a warning device, maximum timetable speed, and total daily trains were also indicated in previous studies to be factors associated with crash occurrence at HRGCs [,,,,,,,]. In addition to the United States, several similar studies have been conducted in various other countries worldwide to understand the factors of HRGC crashes [,,,]. It is believed that with the increase in average annual daily traffic and train traffic, exposure is increased as more vehicles and trains come into contact with the rail crossings, increasing the likelihood of crashes [,,]. Increased traffic can result in longer waiting times at crossings. Impatient drivers may take risks, such as trying to beat a train or going around lowered gates, which can lead to collisions [,,,].
Furthermore, flashing lights enhance the visibility of a railroad crossing, especially during low-light conditions or inclement weather []. This increased visibility alerts drivers and pedestrians to the presence of a railway, reducing the risk of crashes. Flashing lights act as a visual and attention-grabbing cue, directing the attention of motorists to the imminent danger of an approaching train. This heightened awareness reduces the likelihood of individuals attempting to cross the tracks when a train is approaching. Past studies have also observed that flashing lights on rail crossings can reduce crashes at HRGCs [,,].
The association between maximum train timetable speed and crashes at highway–rail grade crossings has been a subject of study in the field of railroad safety. There is a well-established link between higher train speeds and an increased risk of crashes at these crossings. Past studies have shown that higher train speeds result in a reduced reaction time for both motorists and pedestrians at crossings [,,]. As train speeds increase, the time available for drivers and pedestrians to detect an oncoming train, assess the situation, and safely clear the tracks decreases. This reduced reaction time can lead to a higher likelihood of crashes. Additionally, trains traveling at higher speeds require a longer distance to come to a complete stop [,,].
It is noteworthy that the primary focus of this research was not to explore hidden factors beyond what have already been highlighted in past research as factors of crash occurrences at HRGCs. Instead, its primary goal was to emphasize the crucial role of high-quality data in crash modeling and stress the importance of establishing a robust foundation before delving into an investigation of crash factors at HRGCs. Furthermore, the new models developed in our research largely incorporated volume-related and physical factors similar to those observed in the FRA’s 2020 Accident Prediction (AP) model. However, the parameters exhibited variations in magnitude when utilizing the two datasets. Also, systematic attempts were undertaken to generate random-parameters and develop robustly fitted ZINB models through several trials. Nevertheless, it is crucial to acknowledge that the constraint imposed by utilizing analogous variables in both model instances, intended for the purpose of conducting a comparative study, ultimately precluded the emergence of any randomly determined parameters.
6. Conclusions
In this study, accurate HRGCs data are used to highlight the importance of data quality on crash model estimation and crash predictions. The conclusions are as follows:
- Erroneous and missing data in the unaltered FRA HRGCs inventory database led to statistically different crash predictions (expected crashes) compared to corrected and complete (field-validated) HRGCs inventory data. These predictions also affected the crash hazard ranking of crossings based on the two datasets.
- Estimated crash prediction model parameters and their corresponding marginal values appeared to differ when comparing models based on the unaltered FRA HRGCs inventory database and the corrected and complete (field-validated) HRGCs inventory data. However, from a statistical standpoint, they did not exhibit significant differences. Nevertheless, the Zero-inflated Negative Binomial (ZINB) crash prediction model, utilizing the accurate inventory dataset, demonstrated superior performance according to fitness criteria such as the Akaike information criterion (AIC) and BIC (Bayesian information criterion).
This study accentuates the need for a correct and complete HRGCs inventory database because critical safety-related decisions are based on the modeling results of this database. The limitations of this study include the inability to verify the dynamic characteristics of HRGCs, such as daily train traffic and AADT. These traffic-related variables change more frequently compared to physical characteristics of HRGCs, and therefore, this may have more profound impacts on model estimation and predictions. There is a need for a more comprehensive future study on how to account for their effects on crash predictions as well as on developing methods for the routine update of these dynamic variables in the database. This study was based on visits to 560 HRGCs in the field for corrections to the original FRA HRGCs inventory. Such an effort is resource-intensive, so there is a need for a more efficient way of verifying HRGCs inventory data. Many important variables mentioned in the literature were unavailable in the HRGCs inventory data (e.g., clear sight distance availability, presence of humps, roadway grade information, presence of nearby buildings). Future research should address the nationwide collection of such data and its incorporation in the existing FRA HRGCs database.
Author Contributions
Conceptualization, M.U.F. and A.J.K.; methodology, M.U.F. and A.J.K.; software, M.U.F.; validation, M.U.F. and A.J.K.; formal analysis, M.U.F. and A.J.K.; investigation, M.U.F. and A.J.K.; resources, M.U.F. and A.J.K.; data curation, M.U.F. and A.J.K.; writing—original draft preparation, M.U.F. and A.J.K.; writing—review and editing, M.U.F. and A.J.K.; visualization, M.U.F.; supervision, A.J.K.; project administration, M.U.F. and A.J.K. All authors have read and agreed to the published version of the manuscript.
Funding
This research received no external funding.
Data Availability Statement
FRA’s highway–rail grade crossings data on inventory can be download from https://railroads.dot.gov/safety-data/crossing-and-inventory-data/crossing-inventory-dashboards-data-downloads (accessed on 3 July 2022) []. The field-validated data can be requested at mfarooq2@unl.edu.
Acknowledgments
The authors would like to express their gratitude to the Mid-America Transportation Center for providing the resources necessary to conduct this research. Additionally, the authors extend their appreciation to Yashu Kang and Huiyuan Liu for their valuable contributions to the data collection process of this study.
Conflicts of Interest
The authors declare no conflict of interest.
References
- Federal Railroad Administration (FRA). Safety Data and Reporting. Available online: https://railroads.dot.gov/safety-data (accessed on 3 July 2022).
- Farooq, M.U. The Effects of Inaccurate and Missing Highway-Rail Grade Crossing Inventory Data on Crash and Severity Model Estimation and Prediction. Ph.D. Thesis, The University of Nebraska-Lincoln, Lincoln, Nebraska, 1 May 2023. [Google Scholar]
- Brod, D.; Gillen, D.; Decisiontek, L.L.C. A New Model for Highway-Rail Grade Crossing Acczident Prediction and Severity (No. DOT/FRA/ORD-20/40). United States. Department of Transportation. Federal Railroad. Administration. Available online: https://railroads.dot.gov/elibrary/new-model-highway-rail-grade-crossing-accident-prediction-and-severity (accessed on 25 October 2020).
- Yan, X.; Richards, S.; Su, X. Using hierarchical tree-based regression model to predict train–vehicle crashes at passive highway-rail grade crossings. Accid. Anal. Prev. 2010, 42, 64–74. [Google Scholar] [CrossRef] [PubMed]
- Naderan, A.; Shahi, J. Aggregate crash prediction models: Introducing crash generation concept. Accid. Anal. Prev. 2010, 42, 339–346. [Google Scholar] [CrossRef] [PubMed]
- Lu, P.; Zheng, Z.; Ren, Y.; Zhou, X.; Keramati, A.; Tolliver, D.; Qang, Y. A gradient boosting crash prediction approach for highway-rail grade crossing crash analysis. J. Adv. Transp. 2020, 1, 6751728. [Google Scholar] [CrossRef]
- Oh, J.; Washington, S.P.; Nam, D. Accident prediction model for railway-highway interfaces. Accid. Anal. Prev. 2006, 38, 346–356. [Google Scholar] [CrossRef]
- Kasalica, S.; Obradović, M.; Blagojević, A.; Jeremić, D.; Vuković, M. Models for ranking railway crossings for safety improvement. Oper. Res. Eng. Sci. Theory Appl. 2020, 3, 84–100. [Google Scholar] [CrossRef]
- Hu, S.R.; Li, C.S.; Lee, C.K. Assessing casualty risk of railroad-grade crossing crashes using zero-inflated Poisson models. J. Transp. Eng. 2011, 137, 527–536. [Google Scholar] [CrossRef]
- Lord, D.; Mannering, F. The statistical analysis of crash-frequency data: A review and assessment of methodological alternatives. Transp. Res. Part A Policy Pract. 2010, 44, 291–305. [Google Scholar] [CrossRef]
- Lu, P.; Tolliver, D. Accident prediction model for public highway-rail grade crossings. Accid. Anal. Prev. 2016, 90, 73–81. [Google Scholar] [CrossRef]
- Hilbe, J.M. Modeling Count Data; Cambridge University Press: Cambridge, UK, 2014. [Google Scholar]
- Zheng, Z.; Lu, P.; Pan, D. Predicting highway–rail grade crossing collision risk by neural network systems. J. Transp. Eng. Part A Syst. 2019, 145, 410–433. [Google Scholar] [CrossRef]
- Zhang, X.; Waller, S.T.; Jiang, P. An ensemble machine learning-based modeling framework for analysis of traffic crash frequency. Comput.-Aided Civ. Infrastruct. Eng. 2020, 35, 258–276. [Google Scholar] [CrossRef]
- Saccomanno, F.F.; Ren, C.; Fu, L. Collision Prediction models for Highway-Rail Grade Crossings in Canada. In Proceedings of the 82nd Annual Meeting of the Transportation Research Board, Washington, DC, USA, 12–16 January 2003. [Google Scholar]
- Khan, I.U.; Lee, E.; Khan, M.A. Developing a highway rail grade crossing accident probability prediction model: A North Dakota case study. Safety 2018, 4, 22. [Google Scholar] [CrossRef]
- Nam, D.; Lee, J. Accident frequency model using zero probability process. Transp. Res. Rec. J. Transp. Res. Board 2006, 1973, 142–148. [Google Scholar] [CrossRef]
- Keramati, A.; Lu, P.; Tolliver, D.; Wang, X. Geometric effect analysis of highway-rail grade crossing safety performance. Accid. Anal. Prev. 2020, 138, 105–170. [Google Scholar] [CrossRef] [PubMed]
- Khattak, A.J.; Kang, Y.; Liu, H.; Nebraska Rail Crossing Safety Research. Final Report to Nebraska Department of Transportation, University of Nebraska-Lincoln Report SPR-P1M091. Available online: https://rosap.ntl.bts.gov/view/dot/55869 (accessed on 31 December 2020).
- Gao, J.; Xie, C.; Tao, C. Big Data Validation and Quality Assurance—Issuses, Challenges, and Needs. In Proceedings of the 2016 IEEE Symposium on Service-Oriented System Engineering (SOSE), Oxford, UK, 29 March–2 April 2016; pp. 433–441. [Google Scholar] [CrossRef]
- Yau, K.K.; Wang, K.; Lee, A.H. Zero-inflated negative binomial mixed regression modeling of over-dispersed count data with extra zeros. Biom. J. J. Math. Methods Biosci. 2003, 45, 437–452. [Google Scholar] [CrossRef]
- Liu, C.; Zhao, M.; Li, W.; Sharma, A. Multivariate random parameters zero-inflated negative binomial regression for analyzing urban midblock crashes. Anal. Methods Accid. Res. 2018, 17, 32–46. [Google Scholar] [CrossRef]
- Mathew, J.; Benekohal, R.F. Highway-rail grade crossings accident prediction using Zero Inflated Negative Binomial and Empirical Bayes method. J. Saf. Res. 2021, 79, 211–236. [Google Scholar] [CrossRef]
- Sharma, S.; Pulugurtha, S.S. Modeling crash risk at rail-highway grade crossings by track class. J. Transp. Technol. 2019, 9, 261–283. [Google Scholar] [CrossRef]
- R Programming. Available online: https://www.r-project.org/about.html (accessed on 1 January 2021).
- Chatterjee, S.; Hadi, A.S. Regression Analysis by Example; John Wiley & Sons. Inc.: New York, NY, USA, 2006. [Google Scholar]
- Yap, B.W.; Sim, C.H. Comparisons of various types of normality tests. J. Stat. Comput. Simul. 2011, 81, 2141–2155. [Google Scholar] [CrossRef]
- Lam, F.C.; Longnecker, M.T. A modified Wilcoxon rank sum test for paired data. Biometrika 1983, 70, 510–513. [Google Scholar] [CrossRef]
- Clogg, C.C.; Petkova, E.; Haritou, A. Statistical methods for comparing regression coefficients between models. Am. J. Sociol. 1995, 100, 1261–1293. [Google Scholar] [CrossRef]
- Chhotu, A.K.; Suman, S.K. Prediction of Fatalities at Northern Indian Railways’ Road–Rail Level Crossings Using Machine Learning Algorithms. Infrastructures 2023, 8, 101–121. [Google Scholar] [CrossRef]
- Lim, K.K. Analysis of Railroad Accident Prediction using Zero-truncated Negative Binomial Regression and Artificial Neural Network Model: A Case Study of National Railroad in South Korea. KSCE J. Civ. Eng. 2023, 27, 333–344. [Google Scholar] [CrossRef]
- Yang, X.; Li, J.Q.; Zhang, A.; Zhan, Y. Modeling the accident prediction for at-grade highway-rail crossings. Intell. Transp. Infrastruct. 2022, 1, 342–367. [Google Scholar] [CrossRef]
- Heydari, S.; Fu, L.; Lord, D.; Mallick, B.K. Multilevel Dirichlet process mixture analysis of railway grade crossing crash data. Anal. Methods Accid. Res. 2016, 1, 27–43. [Google Scholar] [CrossRef]
- Cao, Y.; An, Y.; Su, S.; Xie, G.; Sun, Y. A statistical study of railway safety in China and Japan 1990–2020. Accid. Anal. Prev. 2022, 1, 106–124. [Google Scholar] [CrossRef]
- Kyriakidis, M.; Pak, K.T.; Majumdar, A. Railway accidents caused by human error: Historic analysis of UK railways, 1945 to 2012. Transp. Res. Rec. 2015, 2476, 126–136. [Google Scholar] [CrossRef]
Disclaimer/Publisher’s Note: The statements, opinions and data contained in all publications are solely those of the individual author(s) and contributor(s) and not of MDPI and/or the editor(s). MDPI and/or the editor(s) disclaim responsibility for any injury to people or property resulting from any ideas, methods, instructions or products referred to in the content. |
© 2023 by the authors. Licensee MDPI, Basel, Switzerland. This article is an open access article distributed under the terms and conditions of the Creative Commons Attribution (CC BY) license (https://creativecommons.org/licenses/by/4.0/).