1. Introduction
With the increase in global trade volume in recent years, maritime transportation is also developing rapidly. Accordingly, it has become necessary to increase port capacities to allow the use and operation of higher-capacity ships. While these capacity increases were being made, the need emerged to integrate loading–unloading systems compatible with today’s technologies into port structures.
Although the current structural conditions of port structures vary according to the development levels of different countries, structural damage generally occurs in ports for various reasons. When we examine the types of damage that occur in structures, we encounter reasons such as ships hitting the port structure, seawater damaging the material of the port structure, and structural wear due to sea tides. Due to reasons such as structural damage and increasing port capacities, there are two alternatives: completely demolishing and renewing or repairing the port structures. Completely demolishing and rebuilding the port is not a preferred method as it will cause the port to be closed for a certain period of time. When the port does not work, it can cause huge economic losses. For this reason, it is preferable to strengthen the dock structures so that the operation is not hindered as much as possible.
Quay walls are one of the most important structures in ports; they are built between the sea and the land and are a type of retaining structure. When we look at the designs of older quay walls, it is seen that they were mostly built as gravity walls by combining stone fortifications with cement. Nowadays, with technological opportunities, different solutions such as sheet-pile and pile-anchored systems are being developed with different building materials. In the past, design solutions were made by taking simple analytical approaches into consideration. Although these approaches are sufficient for structural design to a certain extent, more advanced calculation methods need to be used to solve geotechnical problems. In particular, accurately reflecting the soil conditions in the design is important in terms of considering the structure–soil interaction in the design. Addressing quay walls from a structural and geotechnical perspective is possible by applying scientific approaches to the problem as well as engineering knowledge in terms of design. Creating solutions using advanced soil models allows the problem to be addressed more realistically in terms of design. There are many case studies in the literature regarding the strengthening of quay walls and some of these studies are summarized below.
Yang et al. [
1] investigated the behavior of caisson-type waterside quay wall structures experimentally and numerically. Experimental studies were carried out using the centrifuge technique, and the liquefaction and deformation properties and seismic behavior of the saturated cohesionless fill were investigated. Additionally, numerical modeling was performed using a two-dimensional nonlinear program. According to the obtained numerical results, the deformation pattern of the soil–wall system, and the magnitude of lateral spreading are similar to experimental results. In addition, the obtained results show that the dynamic properties and permeability of the filling material are effective factors that determine the seismic performance of the quay wall.
Alyami et al. [
2] investigated the deformation behavior of quay structures under earthquake loads with numerical analysis. In the study, the analyses were carried out in two dimensions using the effective-strain finite element procedure and elastoplastic material properties. Various monotonous and cyclic triaxial paths were simulated to see the model’s capabilities. Back analysis of a damaged port structure in the 1995 Hyogoken-Nanbu earthquake was performed for FEM validation. According to the obtained results, liquefaction occurs in the backfill, and with the improvement of the backfill, the vertical displacements in the quay structure decrease by 200% and the horizontal displacements by 350%.
Zekri et al. [
3] investigated the dynamic behavior of anchored sheet-pile quay walls embedded in liquefiable soils with shake table tests. According to the obtained results, it was seen that the damages occurring in the support structures were caused by liquefaction. It was also observed that the lateral displacements of the walls were caused by large displacements of the anchors towards the sea. When weak areas were improved, the deformations in the wall and anchors decreased significantly. In this case, the tensile forces in the anchors increased.
Habets et al. [
4] investigated the suitability of the performance-based design (PBD) method, which can evaluate specially designed permanent deformations and damage amounts under seismic loads, on anchored sheet piled quay walls. They developed a methodology using permanent displacement and finite element analysis, calibrating an experimental reference considering a typical anchored sheet-piled wall. A reduction factor that accounts for deformation behavior is determined for pseudo-static analysis. A model to apply traditional permanent displacement analysis on anchored sheet-pile walls is proposed. From the study, it was observed that PBD evaluation can be effectively used for seismic analysis and design of such structures.
Hamed et al. [
5] examined an existing quay wall with a three-dimensional interaction analysis. Both the hardening soil model (HSM) and the soft soil creep model (SSCM) were used in the analyses. According to the obtained results, it was seen that not only the undrained and drained properties but also the secondary consolidation effects on the deformation behavior of the quay wall should be taken into account.
Tan et al. [
6] investigated the performance of the quay walls with anchored sheet piles with separate pile-supported platforms through field testing and numerical analysis. The structural features, construction processes, and instrumentation of the quay system were also taken into account in the study. Considering the obtained results, it has been observed that the platform behind the sheet piles significantly reduces the deflection of the wall. When compared with the numerical results, Coulomb’s earth pressure theory significantly overestimates the earth pressure acting on the sheet-pile wall at higher elevations and underestimates the values at lower elevations.
Skopal et al. [
7] discussed in their study the solution of the proposed design for strengthening a quay wall consisting of a wooden pile foundation and a sheet-pile wall connected to the anchor plates with tie rods. Finite element analyses were carried out to evaluate the short- and long-term performance of the proposed solution for the structure resting on very weak soft clay soil. In this case, the design of the quay structure was determined by the allowable deformations, highlighting the importance of performance-based design in current engineering practices.
Adelfee et al. [
8] investigated the seismic performance of quay walls using the finite element method. A real gravity quay wall (Kobe Harbor Quay Wall) was simulated with single-frequency earthquake motion using the Plaxis 2D program. The acceleration and displacement behaviors of the quay wall were investigated numerically. The experimentally obtained results from the shaking table in dry and saturated conditions were compared with the numerical results. The results show that the Plaxis-2D finite element program is an effective tool to predict the seismic performance of the quay wall and there was clear agreement between both the results of the experimental results and the numerical modeling.
Elshafey et al. [
9] numerically investigated the use of earth-reinforced walls with geogrids as quay walls. In the numerical analysis, the model was validated using the finite element program in the first stage, using the results of a full-scale laboratory experiment. In the second stage, the model was expanded by considering the parameters that will affect the performance of the soil wall in the marine environment. When the obtained results were evaluated, it was seen that the geogrid stiffness significantly affected the horizontal movement of the earth-reinforced walls as the quay wall. In the study, it has been verified that the geogrid length should be at least equal to the wall height to ensure the overall external stability of the walls used for the purpose of the quay wall. In addition, numerical results show that geogrids with smaller spacing should be used in the upper layers to minimize the lateral and vertical deformation of the quay wall.
Kim et al. [
10] experimentally and numerically investigated the deepening of caisson-type quay walls by grouting or rubble-mound excavation. Experiments were carried out in a centrifuge device at a scale of 1/120. The Plaxis 2D program was used for numerical analysis. In the study, displacements of the caisson, reaction accelerations, deformation of the quay wall, and earth pressures were examined in detail based on the comparison of numerical and experimental results. The results showed that the movement of the caisson changed, and its displacement decreased significantly after the renovation, and the experimental results were consistent with the numerical results.
Miceli et al. [
11] discussed the rehabilitation of a historical masonry retaining wall by evaluating its seismic safety. In the study, both material and deterioration analyses in such structures, as well as some structural features and difficulties encountered in determining the geometry necessary to comment on the safety of the structure, are discussed. For this reason, an approach that addresses all uncertainties and evaluates them probabilistically has been developed in the risk assessment of such structures. For this purpose, a simple mechanical model taking into account different and alternative collapse modes was developed and Monte Carlo simulations were carried out after the uncertain parameters were characterized probabilistically. Within the scope of the study, the value of the current risk index was determined, and a sensitivity analysis was performed to determine the parameters that most affect building safety.
Nguyen et al. [
12] examined the performance of the quay structure in case of increasing the water depth in front of it. In case of an increase in water depth, the improvement of the rubble mound under the caisson toe by injection was optimized and suggestions were made. They also performed analyses to predict the behavior of the quay wall and grouted rubble mound using a finite element program. The results show that the contact stress between the caisson and the rubble mound increases sharply after improvement. In addition, when the hardening soil (HS) model was used, the deformations on the quay wall were found to be higher than the Mohr–Coulomb (MC) soil model.
Nguyen and Kim [
13] investigated a solution for the renewal of the caisson-type gravity quay wall with geo-centrifuge experiments. They carried out the experiments for both existing and renewed walls. As a solution for strengthening, the method of deepening the quay wall and strengthening through grouting was used. Acceleration and caisson displacements were measured in the experiments, and it was observed that the acceleration from the base to the surface increased for both cases. However, the increase in the renewed quay wall was lower than the current situation. It was observed that the displacements of the caisson decreased significantly after the renovation; thus, the damage resistance increased.
Sarhan and Elosta [
14] present a new technique for the repair of sheet piles with drum-type cells in the repair of damaged quay walls. In this new approach, it was determined how to separate the vertical and horizontal loads acting on the cell using a numerical solution approach. In this study, an accident that occurred in Damietta port in 1993 was used as a case study. A significant reduction in axial stresses and settlements was observed with the new approach. In addition, ring forces and displacements on the cofferdam sheet piles have decreased. Numerical analysis has proven that the proposed new technique in reinforcing quay walls ensures the durability and reliability of cofferdam sheet piles instead of building a new dock at higher costs.
When the literature studies are evaluated, generally, parametric studies affecting the quay walls were discussed after a model was numerically verified, or improvement methods of existing quay walls were discussed. In these studies, the effects of geotechnical parameters were mostly emphasized. However, it has been observed in the literature that studies on the application of the finite element program used in engineering designs for problems in terms of geotechnical and structural engineering are quite limited. Addressing the same problem in geotechnical and structural design is possible by applying important scientific infrastructure as well as an engineering problem. In this study, unlike the literature, a case study is taken and the situation of increasing the capacity of a quay wall structure without damaging it is discussed. Geotechnical and structural analyses were carried out by taking into account the soil investigation studies and the evaluation of the condition of the existing quay wall. From a scientific perspective, the most important difference that distinguishes this study from the literature is that the ground conditions are analyzed nonlinearly with Plaxis 2D 2021 software based on the finite element method and then the pile behavior is harmonized linearly with structural analysis using the Sap2000 program.
2. Site Conditions
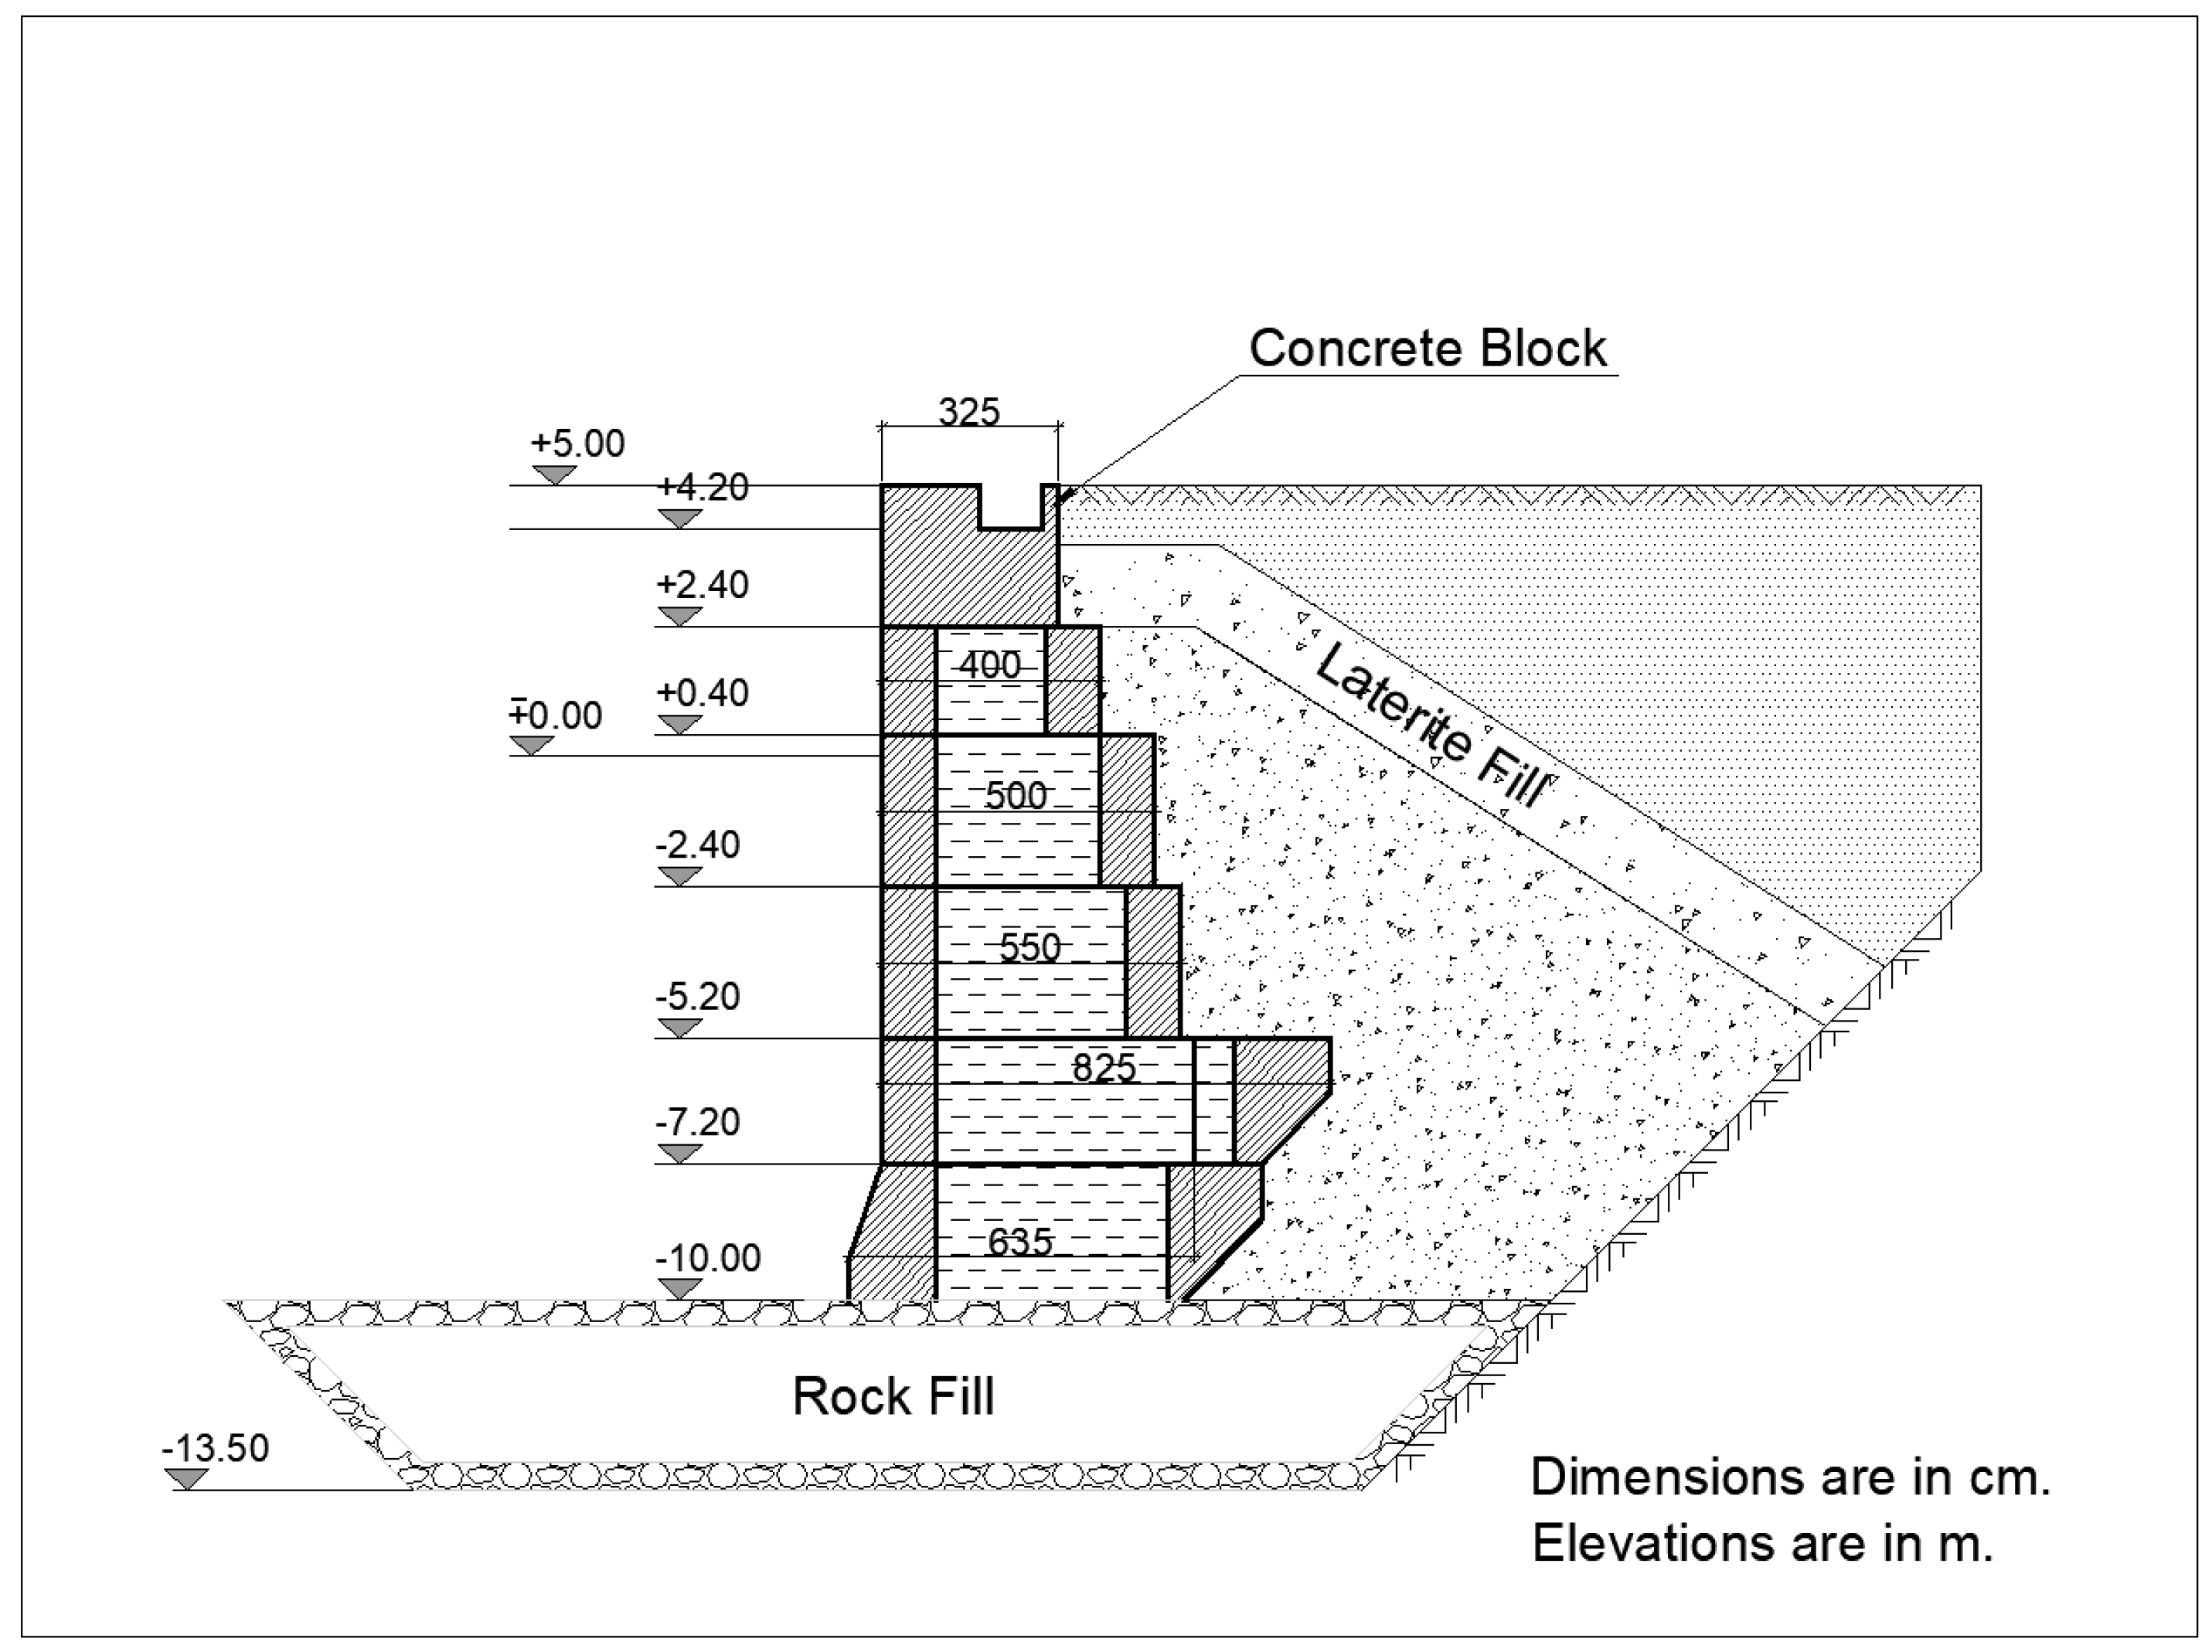
The port discussed in the study is located in Conakry, Guinea. The port is the main port where 90% of Guinea’s foreign trade is carried out and has strategic importance as it is on the city’s main sea border. When the capacity of the port is examined, more than 450 ships use the port annually. The average waiting time for ships to anchor is 0.7 days and the annual unloading capacity of the port is more than 3.4 million tons. It was planned to increase the capacity of the port, and the old quay wall was used for this purpose. The old quay wall was built as a stone fortification, and it was determined that there was damage due to abrasion due to the influence of the sea. In addition, since special cranes moving on the cranes will be used to increase the capacity, it is planned to connect the crane system to a reinforced concrete structure due to deformation limitations. For this purpose, first, the structural project of the existing quay wall was determined based on old data and field observations (
Figure 1).
Then, soil investigations were carried out in the field in order to determine the soil conditions, and the borehole locations are presented in
Figure 2. Borehole depths vary between 10 and 30 m, and when determining the borehole depths, the depth that will not damage the existing quay wall and the depth affected by the stress coming from the structure are taken into account. Since the soil in the field generally consists of cohesionless soils, soil conditions must be determined by in situ tests. For this reason, soil properties were tried to be determined by the SPT test, which is suitable for such cohesionless soils. A standard penetration test (SPT) was performed at regular intervals of 1.5 m for all the boreholes (
Figure 3). Trial pits (TP) were opened to verify the borehole work, and these are shown in
Figure 2a. The depth of the trial pits is 0.8 m. At this depth, the soil profile observed is 0.00–0.20, yellowish fine sandy soil; 0.20–0.50 m random fill; and 0.50–0.80 m reddish gravelly laterite. The soil profile obtained from BH-1 and BH-1A boreholes is shown in
Figure 4. The study area generally consists of sand gravel-laterite mixtures followed by yellowish-white, light brownish-red medium dense sand-green dark gray clay-brown clay soils. Laboratory experiments were carried out on the samples obtained from the boreholes carried out in the region where the problem was taken into account. According to the laboratory results, the cohesion value varies between c = 60 and 88 kPa and the internal friction angle value varies between ϕ = 2 and 7°. The groundwater level at the study area was observed between 2.50 and 2.90 m according to the borehole locations.
3. Superstructure and Geotechnical Design
The existing conditions of the quay wall area were insufficient to support the new crane loads in terms of bearing capacity and stability problems. For that reason, a new platform was planned for the new crane loads. Due to the new platform, it should not bring additional loads or deformations to the existing quay wall. For this purpose, three different alternatives shown in
Figure 5 were evaluated in terms of structural and geotechnical design. The first alternative, as seen in
Figure 5a, is planned to place the front part of the foundation, which is close to the shore and on the quay wall, and to construct a pile foundation at the back part of the foundation. The existing quay wall will support the structural stability of the system, and this will contribute to the structural design. However, when evaluated in terms of geotechnical design, in this case, there is a risk of deformation of the quay wall due to the loads on the quay structure near the shore, and this alternative was not considered appropriate. In other alternatives, as seen in
Figure 5b, reinforcement alternatives with jet grout or unreinforced piles are considered in the front part of the foundation near the shore, and pile foundation alternatives are evaluated in the back part of the foundation. Although it is structurally appropriate in both cases, jet grouting may damage the quay wall due to high pressure during application in terms of geotechnical design.
As a result of the structural and geotechnical evaluations, it was decided to use plastic piles in the front part of the foundation, which is the third alternative, and to apply the pile foundation system in the back part. However, in this chosen alternative, the plastic piles should not transfer load to the existing quay wall.
4. Numerical Modeling
The existing conditions of the quay wall were insufficient to support the new crane loads due to insufficient bearing capacity and inadequate stability. For that reason, a piled foundation platform was planned for the new crane loads within the scope of the project. The reinforced piles have been planned in the project site as bored piles 65 cm in diameter, and 18 m in length with varying spacing and designed in three rows. Along with the foundation piles, it is planned to apply plastic piles for soil improvement in the front part of the foundation near the shore. By evaluating the pile foundation system previously designed for the project site, it has been understood that the part of the system designed as cantilever flooring is unsafe. In this case, in addition to the support provided by three rows of the piled foundation system, four rows (3.00, 5.50, 8.50, and 8.50 m in length) of 65 cm in diameter unreinforced bored piles are planned under the cantilever slab part. Selected engineering fill material (USCS classification [
15]; well-graded gravel, GW) was placed in 30 cm thickness above the unreinforced piles. The thickness of the foundation has been designed as 80 cm. The layout plan showing the piled foundation system and typical section of the selected alternative in the study is given in
Figure 6b. The unreinforced piles are planned parallel to the quay wall as shown in
Figure 6b.
Field and laboratory experiments were used to determine the soil parameters used in numerical modeling. Laboratory experiments were used to determine the unit volume weight and the strength parameters of the clay soil. In determining the strength parameters in cohesionless soils, transformations were made with the method suggested by Kulhawy and Mayne [
16] using SPT data. In determining the elasticity modules, SPT data were used using the AASHTO regulation. Parameter entries were made by directly using the interfaces in the program to enter the obtained data into the numerical program.
4.1. Calculation Methodology
The pile foundation system was evaluated using PLAXIS 2D 2021 finite element software [
17]. PLAXIS is a finite element program, developed for the analysis of deformation, stability, and groundwater flow in geotechnical engineering. It is a program for geotechnical applications in which soil models are used to simulate soil behavior. PLAXIS (plane strain model) was used to predict the total and horizontal displacements of the pile as well as stress distribution in and around the soil-pile foundation system. The staged construction method is applied in calculations with the Plaxis program. This method provides a more realistic solution to the problem in stages. While calculating the bearing capacity of the piles, the plastic solution method was chosen from the calculation types available in the program. Plastic calculation should be selected to carry out an elastic-plastic deformation analysis. The calculation is performed according to the small deformation theory. This type of calculation is appropriate in most practical geotechnical applications. Then, stability analyses of the pile foundation were conducted using the SLOPE/W program [
18]. Finally, the system was modeled in 3D using CSI SAP2000 V21 software [
19] and reinforced concrete calculations were conducted for piles and the slab/foundation.
4.2. Soil Parameters
The soil parameters were selected from the soil investigation report (
Table 1). Some of the parameters for the analysis were not directly available in the report; correlations available in the literature based on the SPT tests have been used. The soil stress-strain relationship has been modeled by applying the Hardening soil model [
17]. The rock material has been modeled with the Mohr–Coulomb model. For the concrete piles and raft, a linear elastic material set has been applied using the concrete weight and its stiffness. For the stability analysis conducted in SLOPE/W 2021 software, all the soil, rock, and concrete properties have been modeled with the available Mohr–Coulomb model.
The rockfill material was modeled with the Mohr–Coulomb model with unit weight as 22 kN/m3, elasticity modulus as 80 MPa, Poisson ratio as 0.25, angle of internal friction as 40°, and cohesion value as 5 kPa.
4.3. Pile Capacities and Horizontal Subgrade Modulus of Piles
The bearing capacity of the piles in soils has been calculated based on in-situ SPT test results. The piles have been designed as frictional piles; this means that only the side resistance has been taken into account while the base resistance has been ignored. By doing this, bearing capacity values have been conservatively obtained. The natural and saturated unit weights of the soil have been taken as 19 kN/m3 and 20 kN/m3, respectively. The saturated unit weight of the rockfill was taken as 22 kN/m3. The unit weight of the pile material was taken as 25 kN/m3. The groundwater level was taken as 3 m from the surface. Since the piles are bored piles, the difference of the pile weight and the excavated soil was finally subtracted from the allowable pile bearing capacity. The submerged unit weight of the pile was used since most of it is below groundwater, i.e., the unit weight of the pile material was subtracted from the unit weight of water.
Piles are frequently applied in cohesionless soils. In cohesionless layers, the individual nominal resistance of each shaft in a group should be reduced by applying an adjustment factor η taken as shown in
Table 2. For intermediate spacing, the value of η may be determined by linear interpolation.
For adjustment factor η to be taken as 1, the center-to-center spacing of the piles must be 4D or more, i.e., 4 × 0.65 = 2.6 m. The center-to-center spacing of all the piles is greater than 2.6 m except for A-axis where the spacing is 1.75 m; due to this the factor, η is taken as 0.72. The layout of the piles on the A-, B-, and C-axes is shown in
Figure 6. Pile bearing capacities were calculated as indicated in
Table 3.
The geotechnical axial capacities of the piles calculated using the soil properties do not exceed the allowable structural capacity of the piles that are calculated by considering the pile material (usually in pile standards, this value is in the order of 0.4–0.5 times the characteristic concrete compressive strength. Concrete class is C30/37). Considering the soil profile and recommended parameters given in
Section 4.2, the horizontal subgrade modulus of the piles was calculated using Bowles [
20] and CGS [
21] recommendations. The values have been conservatively selected as given in
Table 4. These values have been used in the 3D analysis.
For the foundation soils under the cantilever slab, the depth where the bearing capacity will be considered is a depth range from the bottom of the footing to 1.5 B below the bottom of the footing (AASHTO [
22]). To calculate the bearing capacity appropriately, the depth of influence due to the applied foundation loads was calculated. The minimum depth below the foundation where the applied stress due to foundation load decreases to 20 percent of the effective overburden pressure for coarse-grained materials (NAVFAC, [
23]) is calculated as the depth of influence. The Boussinesq [
24] stress distribution solution has been selected to compute the stress distribution under the loaded areas. The depth of influence is obtained as 7.5 m. The average SPT N
1,60 value within this depth has been calculated conservatively as 10. The bearing capacity after the application of the soil improvement by considering the area replacement ratios is calculated as follows: the average pile bearing capacity of the 4 rows (3.00, 5.50, 8.50, and 8.50 m in length) of 65 cm in diameter unreinforced bored piles is calculated as 304 kN. The calculated average unreinforced pile bearing capacity is given in
Table 5.
The unreinforced bored piles are planned with different center-to-center spacing. The average center-to-center spacing is taken as 1.1 m (in X) to 2.625 m (in Y). The bearing capacity of the cantilever slab is sufficient under the foundation loads. Additionally, the vertical subgrade modulus to be used in the 3D analysis will be considered as 20,000 kN/m3. After improving the soil with unreinforced bored piles, a higher vertical subgrade modulus is calculated but the value was limited to 20,000 kN/m3 to be on the safe side.
4.4. PLAXIS Analysis
The Plaxis 2D finite element program was used in geotechnical analysis. The program has advanced soil constitutive models that can capture real soil behavior. The program is also used for complex soil structure interactions and to assess stability and deformations of a structure. In the analysis, 15 noded elements with plane strain conditions have been used. According to Brinkgreve [
25] a 15 node triangle produces high quality stress results. The mesh type preferred in the model is medium type. A total of 3477 elements and 28,627 nodes were generated. The soil parameters used in the model are determined in
Section 4.2. The model for the analysis is given in
Figure 7. The analysis has been conducted considering the initial groundwater level (+3.00 m) and then with reference to EAU [
26], the water level difference of 0.5 m (+2.50 m) has been taken into consideration. The crane loads were computed from the crane properties given in the crane appendix. The calculated uniform loads as 270 kPa and 135 kPa were considered in the analysis together with a bollard pull load of 23 kN/m. Total horizontal displacement contours, total vertical displacement contours, and total horizontal displacements on piles obtained from analyses are presented in
Figure 8 for GWL = 3.00 m. The obtained results for GWL = 2.5 m and 3.00 m are summarized in
Table 6. Since there is no active earthquake movement in the project area, analyses under dynamic loads were not required.
4.5. Stability Analysis with SLOPE/W
In order to determine the overall stability of the system after plastic loading, analyses were made for two different groundwater levels. The overall stability analysis results for the two groundwater levels are presented in
Figure 9. For the analysis with the initial groundwater level of +3.00 m, the factor of safety is obtained as 1.976, and for the analysis with the groundwater level of +2.50 m, the factor of safety is obtained as 1.922. After the revision of the project, the critical factor of safety did not change, and the obtained factor of safety values are above 1.50 in all cases. So, there is no stability problem in the system.
4.6. Structural Analysis with SAP 2000
Analyses were carried out using the SAP 2000 program to determine the effects on the piles and the foundation after the geotechnical design. In the analysis, piles were defined to the model, and soil conditions were introduced to the program with springs. In addition, vertical soil springs are used in the console part of the foundation. The analysis model is shown in
Figure 10. Different load combinations were used in the analyses, and the crane load moving on the crane was defined to the system as a separate combination repeatedly.
4.7. Evaluation of the Bearing Capacity
The bearing capacity of the piles after conducting 3D SAP2000 analysis is evaluated in this section. The axial forces in the piles obtained from the analyses and the calculated allowable bearing capacities of the piles are given in
Table 7. As seen in
Table 7, the axial forces are less than the pile-bearing capacities, so the piles can safely carry the loads imposed on them.
4.8. Evaluation of Pile Performances by Pile Loading Tests
A pile loading test was carried out in the field to determine the vertical load capacities of the designed piles. In the experiment, reaction was taken from four piles and the pile loading plan is presented in
Figure 11. A reaction beam of 8.5 m was used in the experiments, and 110 tons of dead load was placed on the assembly to achieve the desired load capacity. The loading arrangement is shown in
Figure 12. The fast-loading procedure was used and 250% of the pile design load (283.75 tons) was reached at loading. The pile with a diameter of 65 cm is loaded up to 283.5 tons which is 250% of the service load and thereafter pile was unloaded in four steps. Settlement at maximum load is measured as 7.56 mm. The average displacement after unloading is measured as 4.81 mm.


