
Potential Benefits of Horizontal Wells for CO2 Injection to Enhance Storage Security and Reduce Leakage Risks


Abstract
:Featured Application
Abstract
1. Introduction
- Providing technical arguments in favor of using horizontal wells in low- and mid-permeability targets (average less than 100–200 mD), considering the greater mass of CO2 trapped as a residual fluid and the better equilibrium between gravity and viscous forces to control the CO2 buoyancy, evaluating long-term storage (thousands of years of redistribution);
- Proposing a practical way to design the horizontal well length to maximize the CO2 entrapment and make the flow less gravity-driven;
- Evaluating the impact of both strategies (vertical and horizontal injectors) on the risk of CO2 penetration into the caprock, considering adsorption, diffusion, and the Darcy reactive flow.
- Preventing an unexpected and undesired interaction with the caprock, mainly related to the risk of CO2 leakage due to fault/fracture activation or the creation of new fractures when the injection exceeds the minimum rock strength [19,20]. In addition, related to the geochemical reactions among the CO2−brine−mineral system, which can affect the integrity of caprock and its sealing capacity with alteration in its petrophysical properties induced by mineral changes [21];
- Better control and monitoring of the CO2 plume propagation to the CCS project evaluation with data from the injection or observation/monitoring wells, besides geophysical data, such as time-lapse seismic, vertical-seismic profiles (VSPs), and micro-seismic [5];
- Providing insights into the CO2 storage in depleted oil/gas reservoirs where it is possible to use existing horizontal and multilateral wells.
- Consideration of impurities and free water content in CO2 stream injected;
- Modeling the dry-out effect due to water vaporization with CO2 injection or another injectivity issue, which can be found in Machado et al. [22];
- CO2 leakage through wells with poor cement jobs, as pointed out by Gholami et al. [23], can be the most important reason behind the migration and leakage;
- Drilling design planning and stability concerns for horizontal well construction;
- Economic evaluation of vertical and horizontal wells. This specific evaluation would depend on factors such as the environment (onshore or offshore), well depth and length, and location of the operation.
2. Petrophysical Modeling for Sandstone and Shale
3. Modeling CO2 Entrapment for Sandstone and Shale Formations
- CO2 solubility in brine according to the method by Li and Nghiem [33] based on Henry’s law. This model is based on Henry’s constant calculation according to Equation (1) as a function of pressure and temperature. The effect of salt on the gas solubility in the aqueous phase is modeled by the salting-out coefficient [34].where:
- is Henry’s constant at current pressure (p) and temperature (T);
- is Henry’s constant at reference pressure (p*) and temperature (T);
- is the partial molar volume at infinite dilution;
- R is universal gas constant;
- I is species dissolved in water (CO2(aq) in this work).
- Solubility trapping in brine can be enhanced by diffusion. To model this effect, the diffusion coefficient (D) for super-critical CO2 in brine is applied to compute the effective CO2 diffusion (Deff) considering tortuosity τ [35]:In shales, where diffusion is a relevant mechanism due to lower permeability, the tortuosity value ranges approximately from 40 to 70 [36]. An effective diffusion equal to 2.8 × 10⁻⁷ cm2/s [37] was used in the simulations.
- Chemical trapping by adsorption of CO2 in the gas phase was modeled using a Langmuir model [38], which is a widely accepted isotherm adsorption equation [39,40]. With data for shales [41,42] and sandstone [43], two isotherms were matched to model the adsorption. Table 3 summarizes Langmuir parameters (BCO2 and ωCO2,max) obtained according to Equation (3), that is, the extended Langmuir isotherm for multicomponent adsorption [44,45]:where
- BCO2 is the parameter for Langmuir isotherm relation;
- BCO2 is the moles of adsorbed CO2 per unit mass of rock;
- ωCO2,max is the maximum moles of adsorbed CO2 per unit mass of rock;
- YCO2,g is the molar fraction of adsorbed CO2 in the gas phase.
- The residual CO2 trapping due to the relative permeability and capillarity hysteresis with the saturation changes was modeled with the maximum gas trapped (Sgt) converted to the Land’s constant (C) [46] in the two-phase Carlson’s model [47], as recommended by Jarrell et al. [48], according to Equation (4):where Sg max is the maximum gas saturation.

- Ionic trapping due to acidic water reactions for bicarbonate and carbonate ions generation was modeled using kinetic parameters from the PHREEQC database [50,51].OH− + H+ = H2OCO2 + H2O = H+ + HCO3−The synthetic water composition is given in Table 5 for the homogeneous case [52] and the heterogeneous case (Personal communication with PETROBRAS. 2023. Rio de Janeiro-RJ, Brazil).CO32− + H+ = HCO3−
- The following mineralization reactions with primary minerals were modeled using kinetic parameters from PHREEQC for Transition State Theory (TST)-derived rate laws:Quartz [SiO2] = SiO2 (aq)Kaolinite [Al2Si2O5(OH)4] + 6.0 H+ = 5.0 H2O + 2 Al3+ + 2 SiO2 (aq)Calcite [CaCO3] + H+ = Ca2+ + HCO3−Illite [K0.6Mg0.25Al2.3Si3.5O10(OH)2 + 11.2 H2O = 3.5 H4SiO4 + 2.3 Al(OH)4− + 0.6 K+ + 0.25 Mg2+ + 1.2 H+Albite [NaAlSi3O8] + 4 H+ = 3 SiO2 (aq) + Al3+ + Na+ + 2 H2OAnorthite [CaAl2Si2O8] + 8 H2O = 2 H4SiO4 + 2 Al(OH)4− + Ca2+Chlorite [Mg5Al2Si3O10(OH)8] + 16.0 H+ = 5.0 Mg2+ + 2.0 Al3+ + 3.0 H4SiO4 + 6.0 H2ODolomite [CaMg(CO3)2] = 2 CO32− + Mg2+ + Ca2+The initial mineral compositions for the shale caprock [52] and for the sandstone [53] are summarized in Table 6. Illite is the most abundant clay mineral in the shale matrix, occurring in the sandstone matrix. The long-term exposure of clay minerals to Sc-CO2 (super-critical CO2) can generate strong CO2 adsorption [54], justifying the modeling of this phenomenon to increase CO2 storage capacity.Pyrite [FeS2] + 2 H+ = 2 HS− + Fe2+Table 6. Mineral composition for the sandstone aquifer and the shale caprock.
Sandstone Siliceous Shale Mineral Normalized Volume
FractionNormalized Volume
Fractionquartz 0.614 0.277 kaolinite 0.021 0.015 calcite 0.020 0.073 illite 0.011 0.374 albite 0.210 0.063 anorthite 0.076 0.115 chlorite 0.048 0.038 dolomite 0.000 0.021 pyrite 0.000 0.023
4. Potential Changes in the Caprock Integrity with a Vertical Injector
- % free Sc-CO2: free CO2 as a super-critical fluid;
- % CO2 adsorbed: CO2 adsorbed on the rock by chemical trapping;
- % CO2 in water: dissolved CO2 in aqueous phase, CO2 (aq);
- % residual CO2: CO2 trapped as a residual gas due to relative permeability and capillarity hysteresis.
5. Sensitivity Analysis with a Horizontal Injector
- the wider lateral extension of the CO2 plume in comparison to the vertical rise;
- more CO2 trapped as a residual fluid as it spreads in the porous media;
- less gravity-dominant flow.
5.1. Sensitivity to the Horizontal Well Length (Lw)
5.2. Sensitivity to the Injection Rate
5.3. Sensitivity to the Horizontal Permeability
5.4. Sensitivity to the kv/kh Ratio
5.5. Sensitivity to the Natural Water Flow
5.6. Sensitivity to the Time of Redistribution
6. Horizontal Well Design
- Horizontal injection wells effectively prevent or minimize CO2 penetration into the caprock across various sensitivity scenarios. This finding is closely linked with the buoyancy effect, which can be modeled by the gravity number introduced in Equation (20). Consequently, the gravity number is one of the variables used to determine the optimal length of horizontal wells;
- Horizontal wells offer a safer approach to trapping CO2 by increasing its entrapment as a residual phase compared to the use of vertical wells as injectors. In this context, the additional CO2 trapped as a residual phase becomes a crucial variable.
- On the left: the difference between the CO2 saturation trapped as a residual phase (∆CO2 residual) obtained with the vertical well minus the one with the horizontal well after 1500 years, corresponding to the time of plateau in Figure 17;
- On the right: the gravity numbers according to Equation (20) for different well lengths.

7. Conclusions
- The CO2 intrusion into the caprock was mainly dominated by diffusion of the dissolved CO2 in the brine. This can become more critical, if this solution accesses active faults and fractures of the shale caprock;
- The impact of mineral precipitation in the caprock and its integrity was negligible, with only an insignificant precipitation of about 0.0005% of the total injected CO2 after 3000 years. Therefore, considering reservoir parameters such as mineralogy, pH, injection rate, pressure, and temperature, there was a small risk for caprock integrity due to mineralization/dissolution;
- Horizontal wells were more effective in controlling the CO2 buoyancy due to two mechanisms:
- ○
- enhancement of the CO2 entrapment as a residual phase by up to 19% due to relative permeability/capillary pressure hysteresis where the more spread plume contacted new portions of the aquifer pore volume;
- ○
- the better balance between gravity and viscous forces provided by horizontal wells compared to by vertical wells, with up to an 18% reduction in this balance compared to the vertical well case. The conclusion was based on simulations of homogeneous and heterogeneous sandstone saline aquifers over thousands of years.
- A sensitivity test showed the following results:
- ○
- hypothesis was mainly valid for low- and mid-permeability aquifers (<200 mD);
- ○
- for long-term evaluation, there was no significant impact on the injection rate for the same CO2 mass injected;
- ○
- the natural flux in aquifers can affect the plume propagation, triggering its contact with the caprock even with horizontal wells; and
- ○
- these conclusions regarding horizontal wells persisted over tens of thousands of years.
- A practical method was proposed to design the optimum length for horizontal wells, combining the maximum CO2 saturation trapped as the residual phase and the gravity number.
Author Contributions
Funding
Data Availability Statement
Acknowledgments
Conflicts of Interest
Nomenclature
| parameter for Langmuir isotherm relation, kPa−1; | |
| C | Land’s constant, dimensionless; |
| cf | rock compressibility, kPa−1; |
| D | diffusion coefficient, cm2/s; |
| Deff | effective diffusion coefficient, cm2/s; |
| g | acceleration due to gravity, m/s2; |
| H | aquifer thickness, m; |
| Henry’s constant at the current pressure (p) and temperature (T), dimensionless; | |
| Henry’s constant at the reference pressure (p*) and temperature (T), dimensionless; | |
| J | Leverett J-function, dimensionless; |
| k or kh | average horizontal permeability, mD [9.869 × 10⁻¹⁶ m2]; |
| average vertical permeability, mD [9.869 × 10⁻¹⁶ m2]; | |
| krl | relative permeability, dimensionless; |
| L | length of the aquifer, m; |
| Lw | horizontal well length, m; |
| M | mobility ratio, dimensionless; |
| Nj | the total moles of mineral j, gmol/m3; |
| characteristic time ratio for fluid to flow in the transverse direction due to gravity, dimensionless; | |
| p | pressure, kPa; |
| Pc | CO2−brine capillary pressure, kPa; |
| R | universal gas constant, 8.314 kPa·L/mol·K; |
| rf | resistance factor, dimensionless; |
| Sgt | trapped gas saturation, dimensionless; |
| Sg max | maximum gas saturation, dimensionless; |
| T | temperature, °C; |
| u | the Darcy velocity (real velocity × φ), m/s; |
| molar fraction of adsorbed CO2 in the gas phase, dimensionless; | |
| Z | global mole fraction, dimensionless. |
| Greek symbols | |
| φ | rock porosity, fraction; |
| brine viscosity, cP [10−3 Pa.s]; | |
| ρm | mineral molar density, gmol/m3; |
| ρ | density, kg/m3; |
| τ | tortuosity, dimensionless; |
| partial molar volume at infinite dilution, L/mol; | |
| moles of adsorbed CO2 per unit mass of rock, gmole/kg of rock; | |
| maximum moles of adsorbed CO2 per unit mass of rock, gmole/kg of rock. | |
References
- Birol, D.F. World Energy Outlook 2022; IEA Publications: Paris, France, 2022. [Google Scholar]
- Nghiem, L.; Shrivastava, V.; Kohse, B.; Hassam, M.; Yang, C. Simulation of Trapping Processes for CO2 Storage in Saline Aquifers. In Proceedings of the Canadian International Petroleum Conference, Calgary, AB, Canada, 16–18 June 2009; Petroleum Society of Canada: Calgary, AB, Canada, 2009. [Google Scholar]
- Han, W.S.; McPherson, B.J.; Lichtner, P.C.; Wang, F.P. Evaluation of Trapping Mechanisms in Geologic CO2 Sequestration: Case Study of SACROC Northern Platform, a 35-Year CO2 Injection Site. Am. J. Sci. 2010, 310, 282–324. [Google Scholar] [CrossRef]
- Delshad, M.; Kong, X.; Tavakoli, R.; Hosseini, S.A.; Wheeler, M.F. Modeling and Simulation of Carbon Sequestration at Cranfield Incorporating New Physical Models. Int. J. Greenh. Gas Control 2013, 18, 463–473. [Google Scholar] [CrossRef]
- Rackley, S.A. Carbon Capture and Storage, 2nd ed.; Butterworth-Heinemann: Cambridge, MA, USA, 2017; ISBN 978-0-12-812041-5. [Google Scholar]
- Hovorka, S. Optimization of Geological Environments for Carbon Dioxide Disposal in Saline Aquifers in the United States (Part One); University of Texas: Austin, TX, USA, 2008; p. 990445. [Google Scholar]
- Bump, A.P.; Bakhshian, S.; Ni, H.; Hovorka, S.D.; Olariu, M.I.; Dunlap, D.; Hosseini, S.A.; Meckel, T.A. Composite Confining Systems: Rethinking Geologic Seals for Permanent CO2 Sequestration. Int. J. Greenh. Gas Control 2023, 126, 103908. [Google Scholar] [CrossRef]
- Duan, Z.; Sun, R. An Improved Model Calculating CO2 Solubility in Pure Water and Aqueous NaCl Solutions from 273 to 533 K and from 0 to 2000 Bar. Chem. Geol. 2003, 193, 257–271. [Google Scholar] [CrossRef]
- Portier, S.; Rochelle, C. Modelling CO2 Solubility in Pure Water and NaCl-Type Waters from 0 to 300 °C and from 1 to 300 Bar. Chem. Geol. 2005, 217, 187–199. [Google Scholar] [CrossRef]
- Spiteri, E.J.; Juanes, R.; Blunt, M.J.; Orr, F.M. Relative Permeability Hysteresis: Trapping Models and Application to Geological CO2 Sequestration. In Proceedings of the SPE Annual Technical Conference and Exhibition, Dallas, TX, USA, 9 October 2005; p. SPE-96448-MS. [Google Scholar]
- Nghiem, L.; Yang, C.; Shrivastava, V.; Kohse, B.; Hassam, M.; Card, C. Risk Mitigation through the Optimization of Residual Gas and Solubility Trapping for CO2 Storage in Saline Aquifers. Energy Procedia 2009, 1, 3015–3022. [Google Scholar] [CrossRef]
- Qi, R.; Laforce, T.; Blunt, M. Design of Carbon Dioxide Storage in Aquifers. Int. J. Greenh. Gas Control 2009, 3, 195–205. [Google Scholar] [CrossRef]
- Xu, T.; Yue, G.; Wang, F.; Liu, N. Using Natural CO2 Reservoir to Constrain Geochemical Models for CO2 Geological Sequestration. Appl. Geochem. 2014, 43, 22–34. [Google Scholar] [CrossRef]
- Gunter, W.D.; Bachu, S.; Benson, S. The Role of Hydrogeological and Geochemical Trapping in Sedimentary Basins for Secure Geological Storage of Carbon Dioxide. Geol. Soc. Lond. Spéc. Publ. 2004, 233, 129–145. [Google Scholar] [CrossRef]
- Han, W.S.; Kim, K.-Y.; Esser, R.P.; Park, E.; McPherson, B.J. Sensitivity Study of Simulation Parameters Controlling CO2 Trapping Mechanisms in Saline Formations. Transp. Porous. Med. 2011, 90, 807–829. [Google Scholar] [CrossRef]
- Han, W.S.; Lee, S.-Y.; Lu, C.; McPherson, B.J. Effects of Permeability on CO2 Trapping Mechanisms and Buoyancy-Driven CO2 Migration in Saline Formations. Water Resour. Res. 2010, 46, W07510. [Google Scholar] [CrossRef]
- Okwen, R.; Stewart, M.; Cunningham, J. Effect of Well Orientation (Vertical vs. Horizontal) and Well Length on the Injection of CO2 in Deep Saline Aquifers. Transp. Porous. Med. 2011, 90, 219–232. [Google Scholar] [CrossRef]
- Eiken, O.; Ringrose, P.; Hermanrud, C.; Nazarian, B.; Torp, T.A.; Høier, L. Lessons Learned from 14 Years of CCS Operations: Sleipner, In Salah and Snøhvit. Energy Procedia 2011, 4, 5541–5548. [Google Scholar] [CrossRef]
- Esposito, A.; Benson, S.M. Evaluation and Development of Options for Remediation of CO2 Leakage into Groundwater Aquifers from Geologic Carbon Storage. Int. J. Greenh. Gas Control 2012, 7, 62–73. [Google Scholar] [CrossRef]
- Vialle, S.; Druhan, J.L.; Maher, K. Multi-Phase Flow Simulation of CO2 Leakage through a Fractured Caprock in Response to Mitigation Strategies. Int. J. Greenh. Gas Control 2016, 44, 11–25. [Google Scholar] [CrossRef]
- Sharma, S.; Agrawal, V.; McGrath, S.; Hakala, J.A.; Lopano, C.; Goodman, A. Geochemical Controls on CO2 Interactions with Deep Subsurface Shales: Implications for Geologic Carbon Sequestration. Environ. Sci. Processes Impacts 2021, 23, 1278–1300. [Google Scholar] [CrossRef] [PubMed]
- Machado, M.V.B.; Delshad, M.; Sepehrnoori, K. Injectivity Assessment for CCS Field-Scale Projects with Considerations of Salt Deposition, Mineral Dissolution, Fines Migration, Hydrate Formation, and Non-Darcy Flow. Fuel 2023, 353, 129148. [Google Scholar] [CrossRef]
- Gholami, R.; Raza, A.; Iglauer, S. Leakage Risk Assessment of a CO2 Storage Site: A Review. Earth-Sci. Rev. 2021, 223, 103849. [Google Scholar] [CrossRef]
- Buscheck, T.A.; Sun, Y.; Chen, M.; Hao, Y.; Wolery, T.J.; Bourcier, W.L.; Court, B.; Celia, M.A.; Julio Friedmann, S.; Aines, R.D. Active CO2 Reservoir Management for Carbon Storage: Analysis of Operational Strategies to Relieve Pressure Buildup and Improve Injectivity. Int. J. Greenh. Gas Control 2012, 6, 230–245. [Google Scholar] [CrossRef]
- Kim, M.; Kwon, S.; Ji, M.; Shin, H.; Min, B. Multi-Lateral Horizontal Well with Dual-Tubing System to Improve CO2 Storage Security and Reduce CCS Cost. Appl. Energy 2023, 330, 120368. [Google Scholar] [CrossRef]
- Machado, M.V.B.; Delshad, M.; Sepehrnoori, K. A Practical and Innovative Workflow to Support the Numerical Simulation of CO2 Storage in Large Field-Scale Models. SPE Reserv. Eval. Eng. 2023, 26, 1541–1552. [Google Scholar] [CrossRef]
- Bennion, D.B.; Bachu, S. Drainage and Imbibition Relative Permeability Relationships for Supercritical CO2/Brine and H2S/Brine Systems in Intergranular Sandstone, Carbonate, Shale, and Anhydrite Rocks. SPE Reserv. Eval. Eng. 2008, 11, 487–496. [Google Scholar] [CrossRef]
- Abdoulghafour, H.; Sarmadivaleh, M.; Hauge, L.P.; Fernø, M.; Iglauer, S. Capillary Pressure Characteristics of CO2-Brine-Sandstone Systems. Int. J. Greenh. Gas Control 2020, 94, 102876. [Google Scholar] [CrossRef]
- Bennion, D.B.; Bachu, S. Permeability and Relative Permeability Measurements at Reservoir Conditions for CO2-Water Systems in Ultralow-Permeability Confining Caprocks. In Proceedings of the EUROPEC/EAGE Conference and Exhibition, London, UK, 11 June 2007; p. SPE-106995-MS. [Google Scholar]
- CMG. GEM Compositional & Unconventional Simulator, (version 2022.10); Windows, CMG: Calgary, AB, Canada, 2022. [Google Scholar]
- Balhoff, M. An Introduction to Multiphase, Multicomponent Reservoir Simulation; Developments in Petroleum Science; Elsevier: Amsterdam, The Netherlands, 2022; ISBN 978-0-323-99235-0. [Google Scholar]
- Machado, M.V.B. Numerical Petroleum Reservoir Modeling: Integrated Simulation Practice, 1st ed.; PETROBRAS: Rio de Janeiro, Brazil, 2023; ISBN 9786588763070. (In Portuguese) [Google Scholar]
- Li, Y.-K.; Nghiem, L.X. Phase Equilibria of Oil, Gas and Water/Brine Mixtures from a Cubic Equation of State and Henry’s Law. Can. J. Chem. Eng. 1986, 64, 486–496. [Google Scholar] [CrossRef]
- Bakker, R.J. Package FLUIDS 1. Computer Programs for Analysis of Fluid Inclusion Data and for Modelling Bulk Fluid Properties. Chem. Geol. 2003, 194, 3–23. [Google Scholar] [CrossRef]
- Rezk, M.G.; Foroozesh, J.; Abdulrahman, A.; Gholinezhad, J. CO2 Diffusion and Dispersion in Porous Media: Review of Advances in Experimental Measurements and Mathematical Models. Energy Fuels 2022, 36, 133–155. [Google Scholar] [CrossRef]
- Busch, A.; Alles, S.; Gensterblum, Y.; Prinz, D.; Dewhurst, D.N.; Raven, M.D.; Stanjek, H.; Krooss, B.M. Carbon Dioxide Storage Potential of Shales. Int. J. Greenh. Gas Control 2008, 2, 297–308. [Google Scholar] [CrossRef]
- Montegrossi, G.; Cantucci, B.; Piochi, M.; Fusi, L.; Misnan, M.S.; Rashidi, M.R.A.; Abu Bakar, Z.A.; Tuan Harith, Z.Z.; Bahri, N.H.S.; Hashim, N. CO2 Reaction-Diffusion Experiments in Shales and Carbonates. Minerals 2022, 13, 56. [Google Scholar] [CrossRef]
- Langmuir, I. The Constitution and Fundamental Properties of Solids and Liquids. J. Frankl. Inst. 1917, 183, 102–105. [Google Scholar] [CrossRef]
- Xie, W.; Wang, M.; Wang, H. Adsorption Characteristics of CH4 and CO2 in Shale at High Pressure and Temperature. ACS Omega 2021, 6, 18527–18536. [Google Scholar] [CrossRef]
- Wang, J.; Samara, H.; Jaeger, P.; Ko, V.; Rodgers, D.; Ryan, D. Investigation for CO2 Adsorption and Wettability of Reservoir Rocks. Energy Fuels 2022, 36, 1626–1634. [Google Scholar] [CrossRef]
- Ambrose, R.J.; Hartman, R.C.; Akkutlu, I.Y. Multi-Component Sorbed-Phase Considerations for Shale Gas-in-Place Calculations. In Proceedings of the SPE Production and Operations Symposium, Oklahoma City, OK, USA, 27 March 2011; p. SPE-141416-MS. [Google Scholar]
- Hartman, R.C.; Ambrose, R.J.; Akkutlu, I.Y.; Clarkson, C.R. Shale Gas-in-Place Calculations Part II—Multi-Component Gas Adsorption Effects. In Proceedings of the North American Unconventional Gas Conference and Exhibition, The Woodlands, TX, USA, 14 June 2011; p. SPE-144097-MS. [Google Scholar]
- Ding, J.; Yan, C.; Wang, G.; He, Y.; Zhao, R. Competitive Adsorption Between CO2 and CH4 in Tight Sandstone and Its Influence on CO2-Injection Enhanced Gas Recovery (EGR). Int. J. Greenh. Gas Control 2022, 113, 103530. [Google Scholar] [CrossRef]
- Arri, L.E.; Yee, D.; Morgan, W.D.; Jeansonne, M.W. Modeling Coalbed Methane Production with Binary Gas Sorption. In Proceedings of the SPE Rocky Mountain Regional Meeting, Casper, WY, USA, 18 May 1992; p. SPE-24363-MS. [Google Scholar]
- Hall, F.E.; Zhou, C.; Gasem, K.A.M.; Robinson, R.L.; Yee, D. Adsorption of Pure Methane, Nitrogen, and Carbon Dioxide and Their Binary Mixtures on Wet Fruitland Coal. In Proceedings of the SPE Eastern Regional Meeting, Charleston, WV, USA, 8 November 1994; p. SPE-29194-MS. [Google Scholar]
- Land, C.S. Calculation of Imbibition Relative Permeability for Two- and Three-Phase Flow from Rock Properties. Soc. Pet. Eng. J. 1968, 8, 149–156. [Google Scholar] [CrossRef]
- Carlson, F.M. Simulation of Relative Permeability Hysteresis to the Nonwetting Phase. In Proceedings of the SPE Annual Technical Conference and Exhibition, San Antonio, TX, USA, 4 October 1981; p. SPE-10157-MS. [Google Scholar]
- Jarrell, P.M.; Fox, C.; Stein, M.; Webb, S. Practical Aspects of CO2 Flooding; SPE Monograph Series; Henry L. Doherty Memorial Fund of AIME; Society of Petroleum Engineers: Richardson, TX, USA, 2002; ISBN 978-1-55563-096-6. [Google Scholar]
- Burnside, N.M.; Naylor, M. Review and Implications of Relative Permeability of CO2/Brine Systems and Residual Trapping of CO2. Int. J. Greenh. Gas Control 2014, 23, 1–11. [Google Scholar] [CrossRef]
- Parkhurst, D.L.; Thorstenson, D.C.; Plummer, L.N. PHREEQE: A Computer Program for Geochemical Calculations; U.S. Geological Survey: Denver, CO, USA, 1980.
- Parkhurst, D.L.; Appelo, C.A.J. Description of Input and Examples for PHREEQC Version 3: A Computer Program for Speciation, Batch-Reaction, One-Dimensional Transport, and Inverse Geochemical Calculations. In U.S. Geological Survey Techniques and Methods, Book 6; U.S. Geological Survey: Denver, CO, USA, 2013; p. 497. [Google Scholar]
- Zeng, L.; Vialle, S.; Ennis-King, J.; Esteban, L.; Sarmadivaleh, M.; Sarout, J.; Dautriat, J.; Giwelli, A.; Xie, Q. Role of Geochemical Reactions on Caprock Integrity during Underground Hydrogen Storage. J. Energy Storage 2023, 65, 107414. [Google Scholar] [CrossRef]
- Xiao, Y.; Xu, T.; Pruess, K. The Effects of Gas-Fluid-Rock Interactions on CO2 Injection and Storage: Insights from Reactive Transport Modeling. Energy Procedia 2009, 1, 1783–1790. [Google Scholar] [CrossRef]
- Wan, J.; Tokunaga, T.K.; Ashby, P.D.; Kim, Y.; Voltolini, M.; Gilbert, B.; DePaolo, D.J. Supercritical CO2 Uptake by Nonswelling Phyllosilicates. Proc. Natl. Acad. Sci. USA 2018, 115, 873–878. [Google Scholar] [CrossRef]
- Zeidouni, M.; Pooladi-Darvish, M.; Keith, D. Analytical Solution to Evaluate Salt Precipitation during CO2 Injection in Saline Aquifers. Int. J. Greenh. Gas Control 2009, 3, 600–611. [Google Scholar] [CrossRef]
- Zhou, D.; Fayers, F.J.; Orr, F.M. Scaling of Multiphase Flow in Simple Heterogeneous Porous Media. In Proceedings of the SPE/DOE Improved Oil Recovery Symposium, Tulsa, OK, USA, 17 April 1994; p. SPE-27833-MS. [Google Scholar]
- Currenti, G.; Cantucci, B.; Montegrossi, G.; Napoli, R.; Misnan, M.S.; Rashidi, M.R.A.; Abu Bakar, Z.A.; Harith, Z.Z.T.; Bahri, N.H.S.; Hashim, N. CO2 Leakage Scenarios in Shale Overburden. Minerals 2023, 13, 1016. [Google Scholar] [CrossRef]
- Kampman, N.; Busch, A.; Bertier, P.; Snippe, J.; Hangx, S.; Pipich, V.; Di, Z.; Rother, G.; Harrington, J.F.; Evans, J.P.; et al. Observational Evidence Confirms Modelling of the Long-Term Integrity of CO2-Reservoir Caprocks. Nat. Commun. 2016, 7, 12268. [Google Scholar] [CrossRef] [PubMed]
- Li, L.; Lee, S.H. Efficient Field-Scale Simulation of Black Oil in a Naturally Fractured Reservoir through Discrete Fracture Networks and Homogenized Media. SPE Reserv. Eval. Eng. 2008, 11, 750–758. [Google Scholar] [CrossRef]
- Moinfar, A.; Varavei, A.; Sepehrnoori, K.; Johns, R.T. Development of an Efficient Embedded Discrete Fracture Model for 3D Compositional Reservoir Simulation in Fractured Reservoirs. SPE J. 2014, 19, 289–303. [Google Scholar] [CrossRef]
- Cavalcante Filho, J.S.d.A.; Shakiba, M.; Moinfar, A.; Sepehrnoori, K. Implementation of a Preprocessor for Embedded Discrete Fracture Modeling in an IMPEC Compositional Reservoir Simulator. In Proceedings of the SPE Reservoir Simulation Symposium, Houston, TX, USA, 23 February 2015; p. D012S021R013. [Google Scholar]
- Sepehrnoori, K.; Xu, Y.; Yu, W. Embedded Discrete Fracture Modeling and Application in Reservoir Simulation; Developments in Petroleum Science; Elsevier: Amsterdam, The Netherlands, 2020; ISBN 978-0-12-821872-3. [Google Scholar]
- Machado, M.V.B.; Delshad, M.; Sepehrnoori, K. A Computationally Efficient Approach to Model Reactive Transport during CO2 Storage in Naturally Fractured Saline Aquifers. SSRN 2023, 4520437. [Google Scholar] [CrossRef]
- Correia, L.C.; Alves, M.D.G.; Silva Júnior, G.C.D. Estimativa Da Recarga de Água Subterrânea Utilizando o Método WTF Na Porção Continental Da Bacia Sedimentar de Campos, Rio de Janeiro, Brasil. R. Águas Subter. 2021, 35, 1–15. [Google Scholar] [CrossRef]
- Carter, R.D.; Tracy, G.W. An Improved Method for Calculating Water Influx. Trans. AIME 1960, 219, 415–417. [Google Scholar] [CrossRef]


| Homogeneous Model | Heterogeneous Model | |||
|---|---|---|---|---|
| Sandstone | Shale | Sandstone | Shale | |
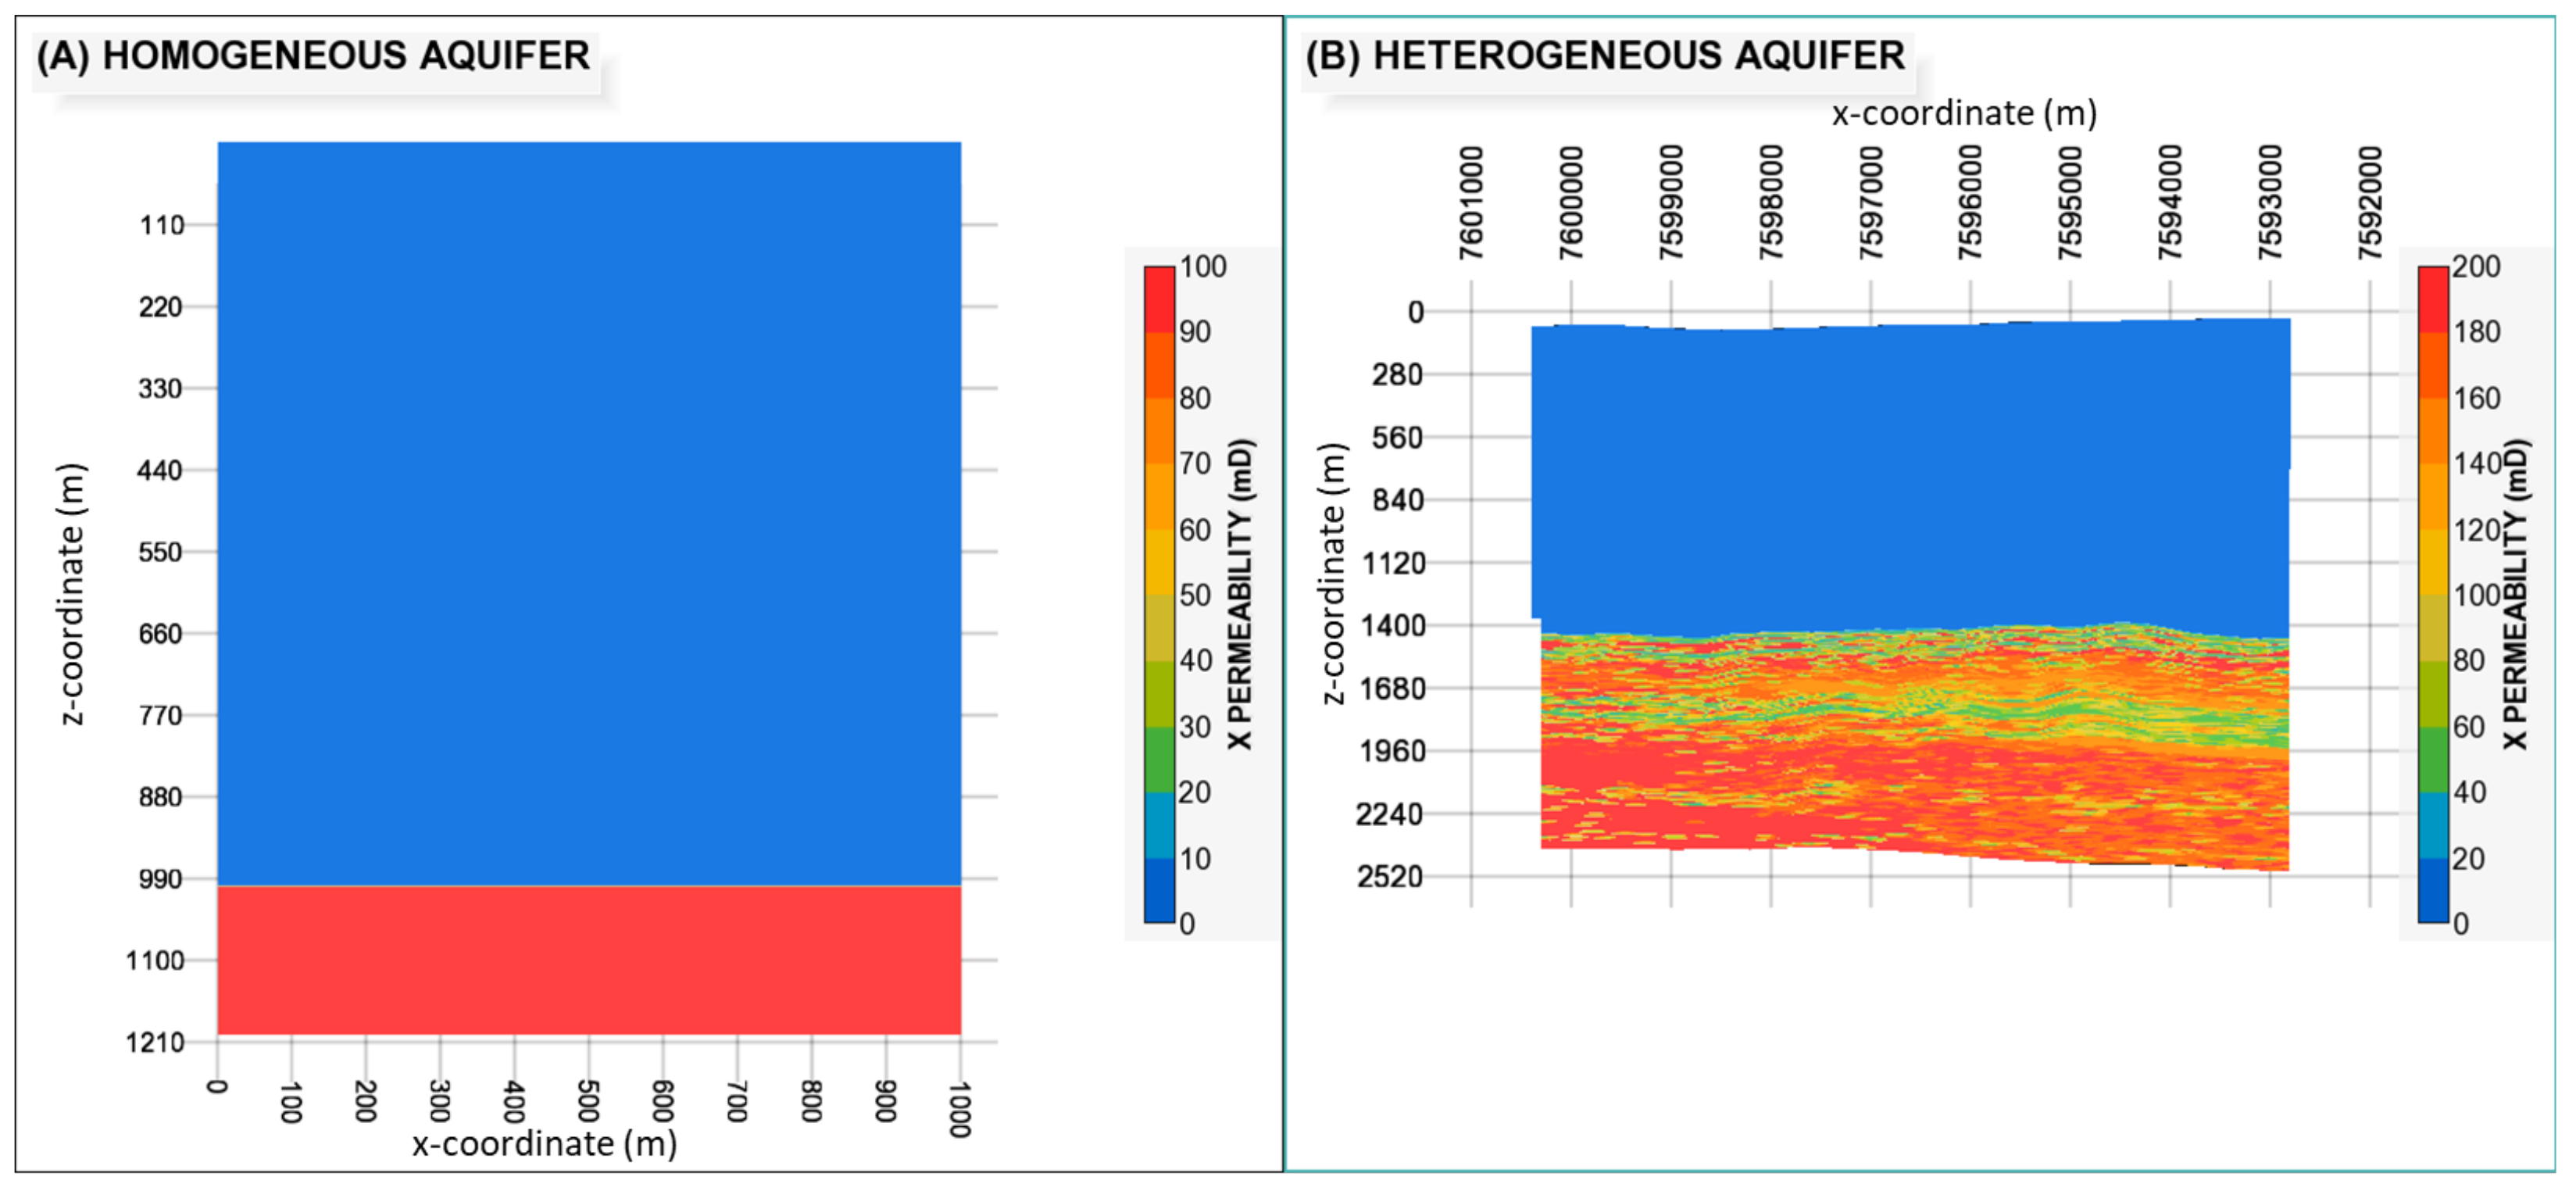
| porosity (φ) | 0.15 | 0.10 | 0.21 (mean) | 0.10 |
| permeability (k) | 100 mD | 0.001 mD | 140 mD (mean) | 0.001 mD |
| kv/kh ratio | 0.1 | 0.1 | 0.1 | 0.1 |
| pore compressibility | 5.8 × 10⁻⁷ kPa−1 | 5 × 10⁻⁸ kPa−1 | 5.8 × 10⁻⁷ kPa−1 | 5 × 10⁻⁸ kPa−1 |
| relative permeability | Figure 2 | Figure 3 | Figure 2 | Figure 3 |
| capillary pressure | Figure 2 | Figure 3 | Figure 2 | Figure 3 |
| Homogeneous Saline Aquifer | Heterogeneous Saline Aquifer | |
|---|---|---|
| Initial pressure | 11,800 kPa at 1000 m | 7159 kPa at 730 m |
| Temperature | 80 °C | 70 °C |
| Salinity | 50,000 ppm | 70,000 ppm |
| 5.66 × 10⁵ | 6.44 × 10⁵ |
| Sandstone | Shale | |
|---|---|---|
| Sgt | 0.25 | 0.35 |
| Aquifer CO2 Plume Spread (m) | Caprock CO2 Plume Thickness (m) | Brine in the Caprock (% in Mass) | |
|---|---|---|---|
| vertical injector | 2980–5510 | 36−6 | 2.0−1.1 |
| horizontal injector with a 2000 m length | 0–1440 | 0–6 | 0.0–0.26 |
Disclaimer/Publisher’s Note: The statements, opinions and data contained in all publications are solely those of the individual author(s) and contributor(s) and not of MDPI and/or the editor(s). MDPI and/or the editor(s) disclaim responsibility for any injury to people or property resulting from any ideas, methods, instructions or products referred to in the content. |
© 2023 by the authors. Licensee MDPI, Basel, Switzerland. This article is an open access article distributed under the terms and conditions of the Creative Commons Attribution (CC BY) license (https://creativecommons.org/licenses/by/4.0/).
Share and Cite
Machado, M.V.B.; Delshad, M.; Sepehrnoori, K. Potential Benefits of Horizontal Wells for CO2 Injection to Enhance Storage Security and Reduce Leakage Risks. Appl. Sci. 2023, 13, 12830. https://doi.org/10.3390/app132312830
Machado MVB, Delshad M, Sepehrnoori K. Potential Benefits of Horizontal Wells for CO2 Injection to Enhance Storage Security and Reduce Leakage Risks. Applied Sciences. 2023; 13(23):12830. https://doi.org/10.3390/app132312830
Chicago/Turabian StyleMachado, Marcos Vitor Barbosa, Mojdeh Delshad, and Kamy Sepehrnoori. 2023. "Potential Benefits of Horizontal Wells for CO2 Injection to Enhance Storage Security and Reduce Leakage Risks" Applied Sciences 13, no. 23: 12830. https://doi.org/10.3390/app132312830
APA StyleMachado, M. V. B., Delshad, M., & Sepehrnoori, K. (2023). Potential Benefits of Horizontal Wells for CO2 Injection to Enhance Storage Security and Reduce Leakage Risks. Applied Sciences, 13(23), 12830. https://doi.org/10.3390/app132312830