Article

Experimental Study of the Multiple Fractalisation of Coal and Rock Failure Subjected to the Coupled Effects of Water, Temperature and Dynamic Loads

1
College of Safety and Emergency Management Engineering, Taiyuan University of Science and Technology, Taiyuan 030024, China
2
Intelligent Monitoring and Control of Coal Mine Dust Key Laboratory of Shanxi Province, Taiyuan University of Science and Technology, Taiyuan 030024, China
3
School of Emergency Management and Safety Engineering, China University of Mining and Technology (Beijing), Beijing 100083, China
*
Author to whom correspondence should be addressed.
Appl. Sci. 2023, 13(24), 13004; https://doi.org/10.3390/app132413004
Submission received: 21 November 2023 / Revised: 1 December 2023 / Accepted: 1 December 2023 / Published: 5 December 2023
(This article belongs to the Special Issue Advanced Methodology and Analysis in Coal Mine Gas Control)

Abstract

:
The mechanical properties of water-rich coal and rock in a subzero environment are very different from those at room temperature, which causes many unexpected hazards for projects. In this study, coal and rock samples subjected to the coupled effects of water, temperature, and dynamic loads were taken as the research object, and the discussion was shaped around their mechanical properties. The crack evolution trend and different gradient impact velocities were determined using a split-Hopkinson pressure bar (SHPB). Multiple fractals were based on high-speed digital image correlation (HS-DIC) technology and the quality-screening method; the evolution trend of the surface cracks in the crushing process and the distribution characteristics of the specimen fragments after crushing were examined from the perspective of fractals. This provided a powerful supplement to the existing research system on the problem of mining via the freezing method, and it accounted for the shortcomings of the existing research to a certain extent. In this research, the results mainly showed four points: (1) The coal samples were determined to have a wave velocity between 1.68 and 2.01 km/s, while the rock samples were between 2.24 and 2.61 km/s. Under the same conditions, the rock’s resistance to deformation and damage was greater than that of coal. (2) In the saturated state, the plastic strength of the coal and rock samples was greater than that in the dry state, due to the strengthening of their internal stresses caused by the presence of fissure water. (3) With decreasing temperature, the degree of the dynamic compression factor of coal and rock showed a trend of initially increasing, then decreasing, and then increasing. With the increase in the loading rate, the destruction of the coal and rock was more intense, and the destruction process was accelerated. (4) After the saturated coal and rock samples were frozen, their interiors were affected by the dual factors of contraction under the influence of temperature and expansion under the influence of the freezing expansion force. The internal fissures closed or shrank, and the water in the pores turned into ice, leading to an increase in pore volume.

1. Introduction

In China, the focus of resource extraction is gradually shifting to the west. Underground mining in Xinjiang, Qinghai, and other cold regions has been increasing. The artificial freezing method in mining and digging has received widespread attention from scholars due to its adaptability to various complex engineering conditions and improvement of safety in construction [1], such as the construction of railways on the Tibetan Plateau and the application and development of coal mine freezing methods for well drilling technology [2]. The freezing method of drilling is the application of artificial refrigeration technology to vertical- or inclined-shaft engineering through the temporary freezing of groundwater to consolidate the stability of the underground coal and rock to reduce the occurrence of collapse accidents during the mining process [3]. However, the kinds of mechanical properties that occur on impact have not been clearly explored. In addition, rock structures in cold regions are often affected by dynamic loads. For example, in open-pit coal mines in high-altitude and water-rich areas, the mechanical properties of coal and rock are deteriorated by low temperatures and water, combined with blasting and mining disturbances, which will have an impact on the macroscopic and microscopic structure of coal and rock, leading to slope geological disasters [4,5]. Therefore, a comprehensive understanding of coal and rock subjected to the coupled effects of water, temperature, and dynamic loads has great theoretical and engineering significance for the safe mining of rock structures in cold regions and for the study of the impacts of dynamic loads on coal and rock during freezing [6].
The freezing method has been studied and analysed from many perspectives. For static loading, Fan et al. [7] used computed tomography (CT) to analyse frozen sand and concluded that as the temperature decreased, the specimen changed from tensile–shear to shear damage mode, and the volumetric porosity and crack area of the damaged specimen decreased with decreasing temperature. Kodama et al. [8] investigated the effects of water content, temperature, and loading rate on the strength and damage process of frozen rock and concluded that the rock’s strength increased with increasing water content and loading rate, with the effects being more pronounced at lower temperatures. Sun et al. [9] explored the damage characteristics of frozen coal by conducting acoustic emission tests on frozen coal, and they proposed early warning parameters for the characterisation of the evolution of the variance curve, where the compressive strength of frozen coal samples significantly decreased and the saturated frozen coal samples had the lowest compressive strength. Wang et al. [10], by observing the microscopic pore structure of sandstone, also found that low temperatures had this promoting effect on coal and rock samples.
Under dynamic loading, Wang et al. [11] investigated the effects of the dynamic mechanical properties of dry sandstone and saturated siltstone at different temperatures and rates. The results showed that the saturated specimens exhibited shorter compaction stages on the dynamic stress–strain curve due to the presence of pore water or ice. The dry specimens were more sensitive to the strain-rate effects than the uniaxial compressive strength. Wang et al. [2], through the SHPB test, found that the peak stress of the saturated specimen first increased and then decreased as the temperature decreased. Yang et al. [12] studied the deformation and damage characteristics of red sandstone at low temperatures by combining the effects of the rock strength properties, fractal dimension, and dissipated energy with microfracture morphology; they concluded that low temperatures led to a rapid loss of bearing capacity and a sharp decrease in the strength of the red sandstone under high-strain-rate loading, the dissipation energy of the frozen rock specimens was positively correlated with the fractal dimension, and the low-temperature effect produced significant cracks at the material interface of the red sandstone. Xu et al. [13] used a method that employed a combination of low-field nuclear magnetic resonance (LF-NMR) and scanning electron microscopy (SEM) to investigate the dynamic evolution of the microstructure of frozen sandstones as a function of saturation and determine the increase in saturation; the elastic modulus showed a trend of increasing and then decreasing, and the ultimate deformation capacity showed the opposite trend. Yang et al. [14] compared the uniaxial compression of sandstone, marble, and granite at different temperatures for different materials; the peak inflection point of the stress–strain curve was at −5 °C, while the second inflection point temperature increased with the material hardness. Shan et al. [15] conducted SHPB impact tests on frozen red sandstone specimens at −15 °C, compared them with the static uniaxial compression tests, and found that the failure form was closely correlated to the average strain rate.
The presence of water in the interior of coal and rock has also received widespread attention. Zhao et al. [16,17] analysed the fracture of rocks under water-force coupling by means of experiments and simulations, on the basis of which a two-medium model was proposed. Regarding the effects of saturation and temperature on the wave speed of the corresponding ultrasonic wave, previous studies reached different conclusions. Generally, with increasing saturation, the internal gap of the sample is filled with a large number of water molecules, and the propagation of the ultrasonic waves in the water molecules is greater than that in air; thus, the wave speed of the sample significantly increases [18]. Moreover, as water saturation increases, the squeezing of internal moisture leads to a reduction in the internal strength and modulus of elasticity, ultimately leading to a reduction in the rate of wave propagation [19]. Zhao et al. [20] found that the stress in sandstone had a trend of increasing and then decreasing with decreasing temperature. With the decrease in temperature, the stress initially increased, then decreased and finally increased, similar to an “N” shape. Wang et al. [21] concluded that the peak strength of water-saturated granite with decreasing temperature initially remained unchanged, then rapidly decreased and eventually converged to a stable value, similar to a “乁” shape.
Based on the above literature, studies of temperature and saturation as variables usually use rocks and rarely involve coal. However, some differences between rock and coal exist; rock is strong and hard with weak water absorption, while coal is a softer material with greater porosity. The mineral composition of coal is also very different from that of rock. Frozen coal and frozen rock in the static-load state have been extensively studied. However, research on dynamic-load impact is limited, and research on the destruction process is even more limited. In underground frozen mining, the difference in mining temperature and water saturation rate often leads to certain deformations. In view of this, in this study, coal and rock specimens from the same location were selected for SHPB uniaxial impact damage tests at five different temperature gradients (20 °C, 10 °C, 0 °C, −10 °C, and −20 °C) and in dry and saturated states; the damage evolution process of the specimens was comprehensively shown in terms of both surface cracking characteristics and fragmentation characteristics. The change trend of the dynamic mechanical parameters of the coal samples from room temperature to colder temperatures was analysed, and the mechanical properties of the coal samples under saturated and dry conditions were compared. Then, based on the HS-DIC technique and mass-screening method, the evolution trend of the surface cracks during crushing and the distribution characteristics of the broken blocks of the crushed specimens were investigated from the perspective of multiple fractalisation, and their correlation was explored to comprehensively determine the impact damage process on coal and rock. This study is expected to further reveal the failure mechanism of coal and rock materials under the coupling of temperature, water, and dynamic loads, providing a certain theoretical basis for low-temperature mining technology and the surrounding rock support of water-rich mines and other geotechnical engineering.

2. Materials and Methods

2.1. Specimen Preparation

As illustrated in Figure 1a, coal and rock samples were collected from the 14030 large-height working face in the first disc area of the Zhaogu No. 2 Mine of Henan Energy and Chemical Group Jiaozuo Coal Industry Group Co., Ltd., Xinxiang City, Henan Province, China. The stratigraphic logging records of the borehole near the sampling point are shown in Figure 1b. The depth of the face was more than 800 m, the main coal was anthracite, the average thickness of the coal seam was 6.5 m, the direct top was interbedded mudstone and sandy mudstone, the thickness was 10.5 m, the basic top was Dazhan sandstone, and the thickness was 8.0 m. There were several aquifers above the face, the alluvial dive flowed to the face along the mining fissures during the advancement of the face, and localised water and sand breakage risks existed [22]. In addition, the dynamic pressure on the top plate of the 14030 working face was evident, and the impact dynamic load effect triggered by the breakage of the top plate occasionally occurred [23]. Coupled with the strongly disturbed work processes present at the working face, the coupled effect of water content and dynamic loads had a significant impact on the mechanical properties of the coal and rock [24].
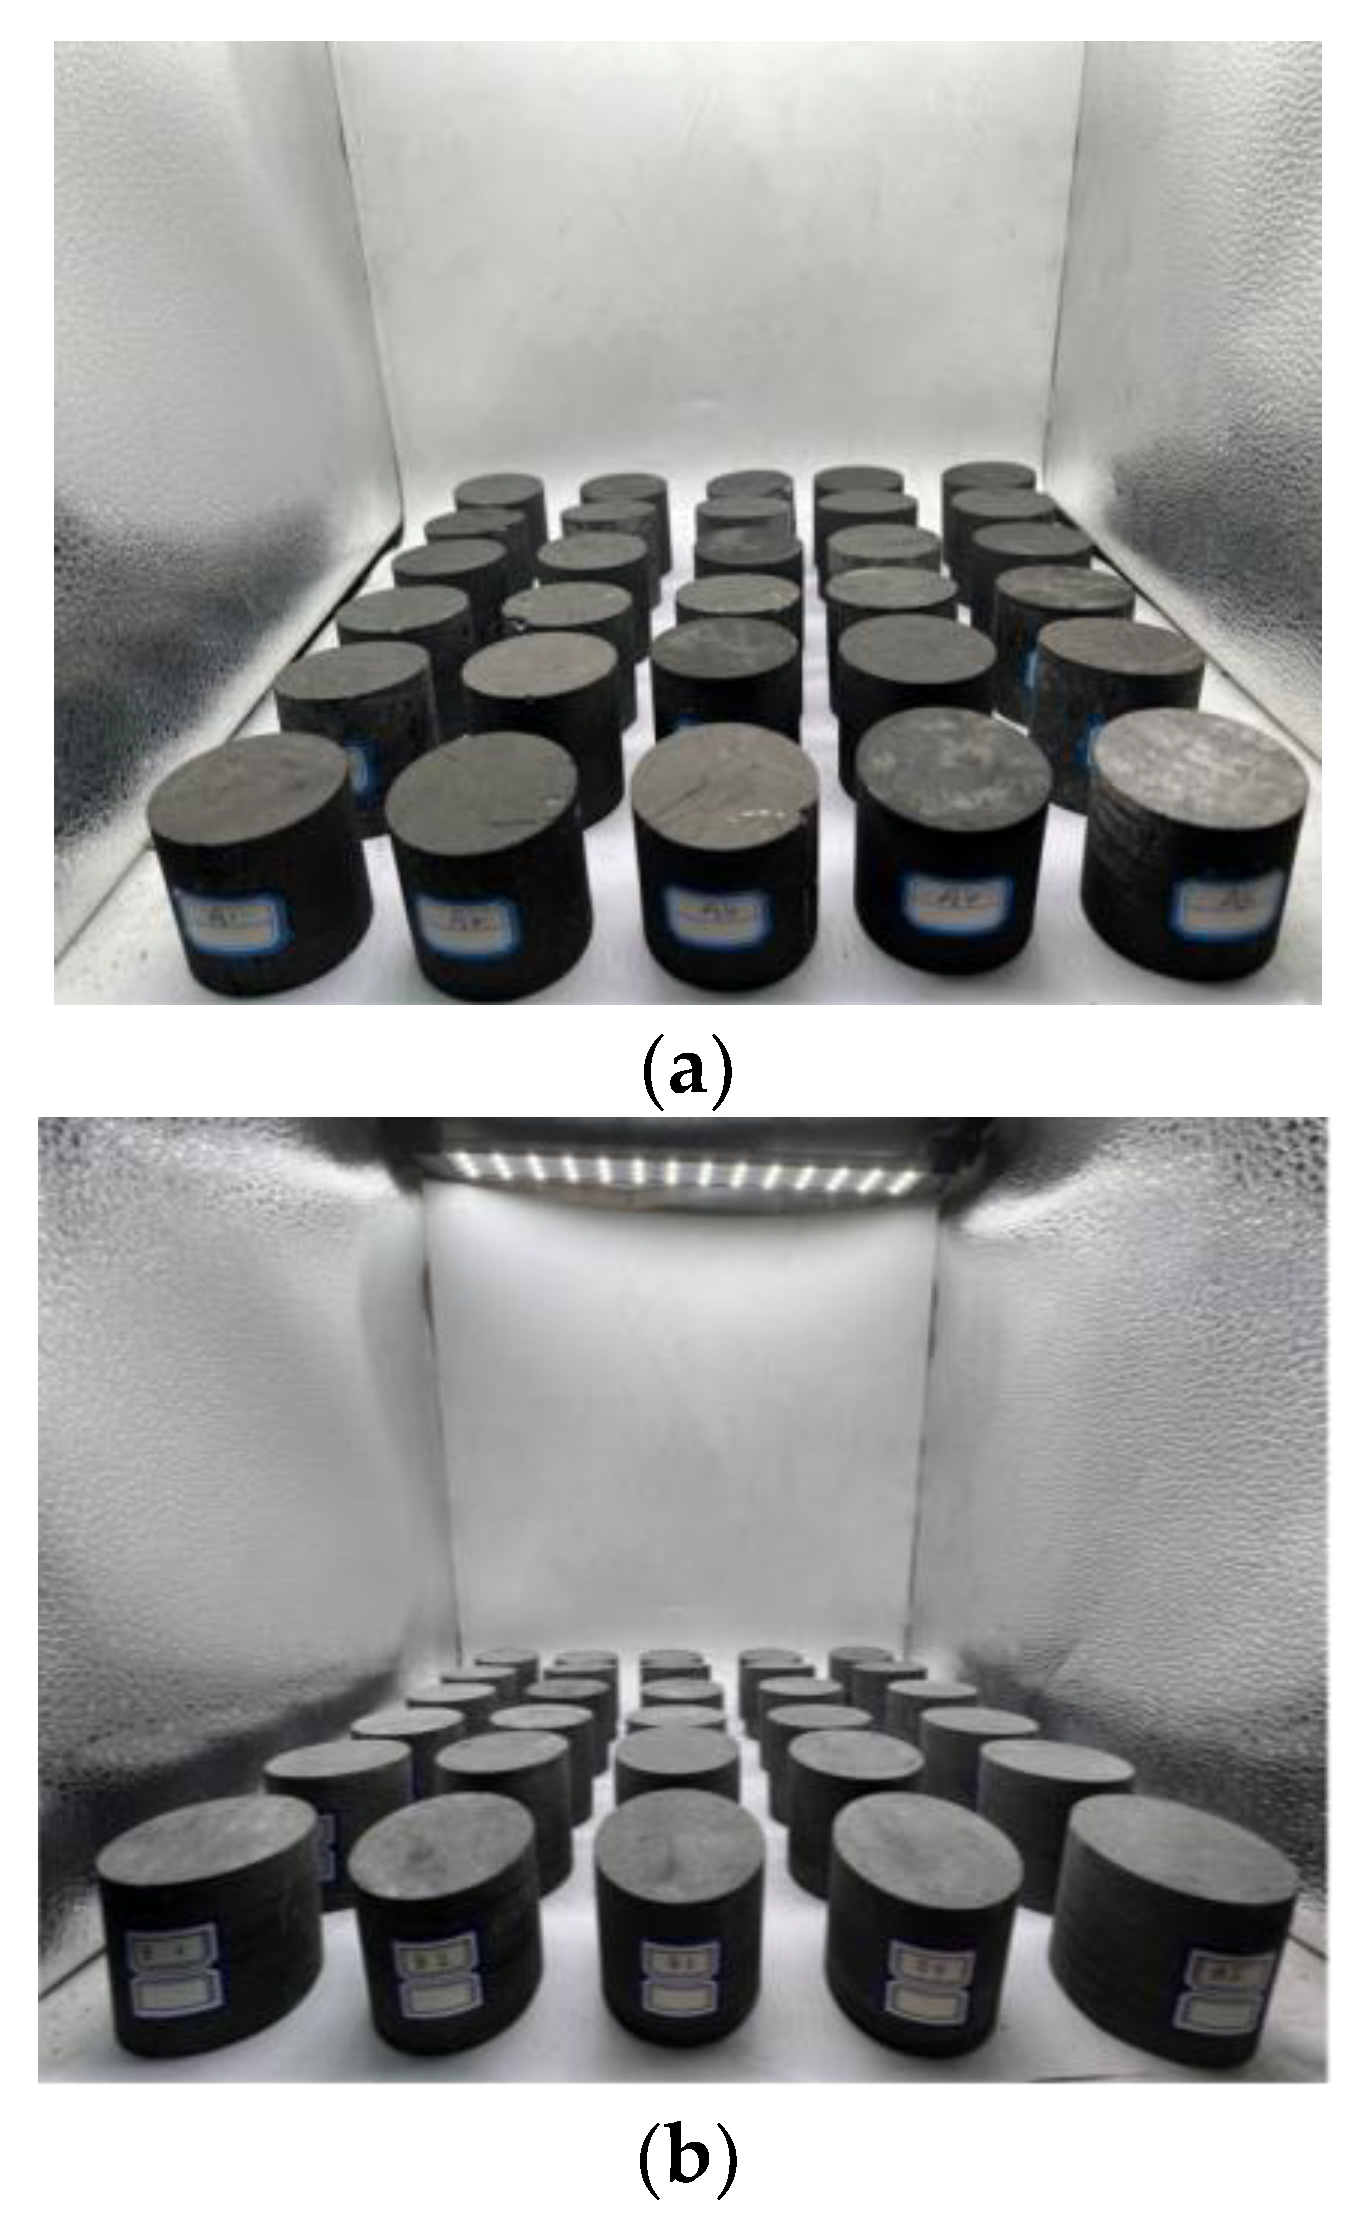
The test methods follow the regulations of the Rock Dynamics ISRM Committee [25]. Large samples were selected from the II_1 coal seam and the roof (sandy mudstone) of the 14030 working face and were processed into 40 and 30 original coal and rock cylindrical specimens with dimensions of φ50 mm × 50 mm, respectively. The upper and lower surfaces of the test specimens were precisely polished and sanded to ensure that the non-parallelism of the two ends was less than 0.02 mm and the non-perpendicularity of the circumference and the end face was less than 0.25°. The final prepared coal and rock specimens are shown in Figure 2.

2.2. Testing Equipment

Figure 3a shows the φ50 mm SHPB experiment system independently developed by the coal or rock dynamic load damage parameter testing laboratory, which lies in the school of emergency management and safety engineering, China University of Mining and Technology (Beijing, China). The system consisted of a power supply subsystem, a rod subsystem, an information acquisition subsystem, and a data processing subsystem. As shown in Figure 3a, the power supply subsystem, i.e., the stress-wave generator, used a combination of an air compressor, high-pressure air storage chamber, air cavity, and SHPB electronic control system; this controlled the impact velocity of the bullet by setting the magnitude of the air pressure. The rod subsystem consisted of a cylindrical impact rod (bullet), incidence rod, transmission rod, and energy-absorbing rod. Each rod was cylindrical with a diameter of 50 mm and lengths of 400 mm, 3000 mm, 2500 mm, and 1000 mm, respectively. The rod was made of mild steel with a density of 7740 kg/m3 and a modulus of elasticity of 206 GPa. The data acquisition subsystem consisted of an infrared velocimetry device and a strain signal acquisition system. To ensure the accuracy of the test, double strain gauges were affixed to the incident and transmission rods, dual channels were set up for data acquisition, and the incident, reflected, and transmission wave signals were recorded with an ultra-dynamic strain gauge and researched in a targeted way using the data processing subsystem.
Notably, to be able to accurately reflect the destruction process of the coal and rock specimens during impact dynamic loading, the data acquisition subsystem also included a high-speed photography device for recording the rupture process of the sample. As shown in Figure 3b, the device consisted of a FASTCAM SA5 high-speed camera developed by PHOTRON, China Shenzhen Shenniu Photographic Equipment Co., Ltd. (Shenzhen, China), a produced VL300 fill light and synchronous trigger device, and other components. The camera frame speed was set to 100,000 frames per second with a pixel resolution of 320 × 192, and a shield made of high-transmittance acrylic panels was installed around the coal and rock samples to prevent the camera and the filler lamp from being damaged by the splashing of the samples during the destruction of the coal and rock, as well as to facilitate the collection and sieving of crushed coal and rock fragments [26].
Figure 4 shows the instruments used in the pre-treatment of coal and rock. Figure 4a shows the electric blast dryer, which adopts a hot air circulation system to ensure uniform heating of coal and rock samples. The temperature control range is room temperature (RT) +50–250 °C, and the constant temperature fluctuation is ±1 °C. Figure 4b is a natural saturated container. Figure 4c is the constant-temperature test chamber, which adopts an intelligent and high-precision proportional integral derivative temperature control system with strong temperature stability and a temperature control range from −40 °C to 100 °C. Figure 4d shows the ZBL-U5100 nonmetallic ultrasonic detector produced by Beijing Zhibo Lian Technology Co. (Beijing, China). The acoustic time measurement range is ±1,677,700 μs, the gain accuracy is 0.5 db, and the acceptance sensitivity is less than 10 μv.

2.3. Test Condition and Procedure

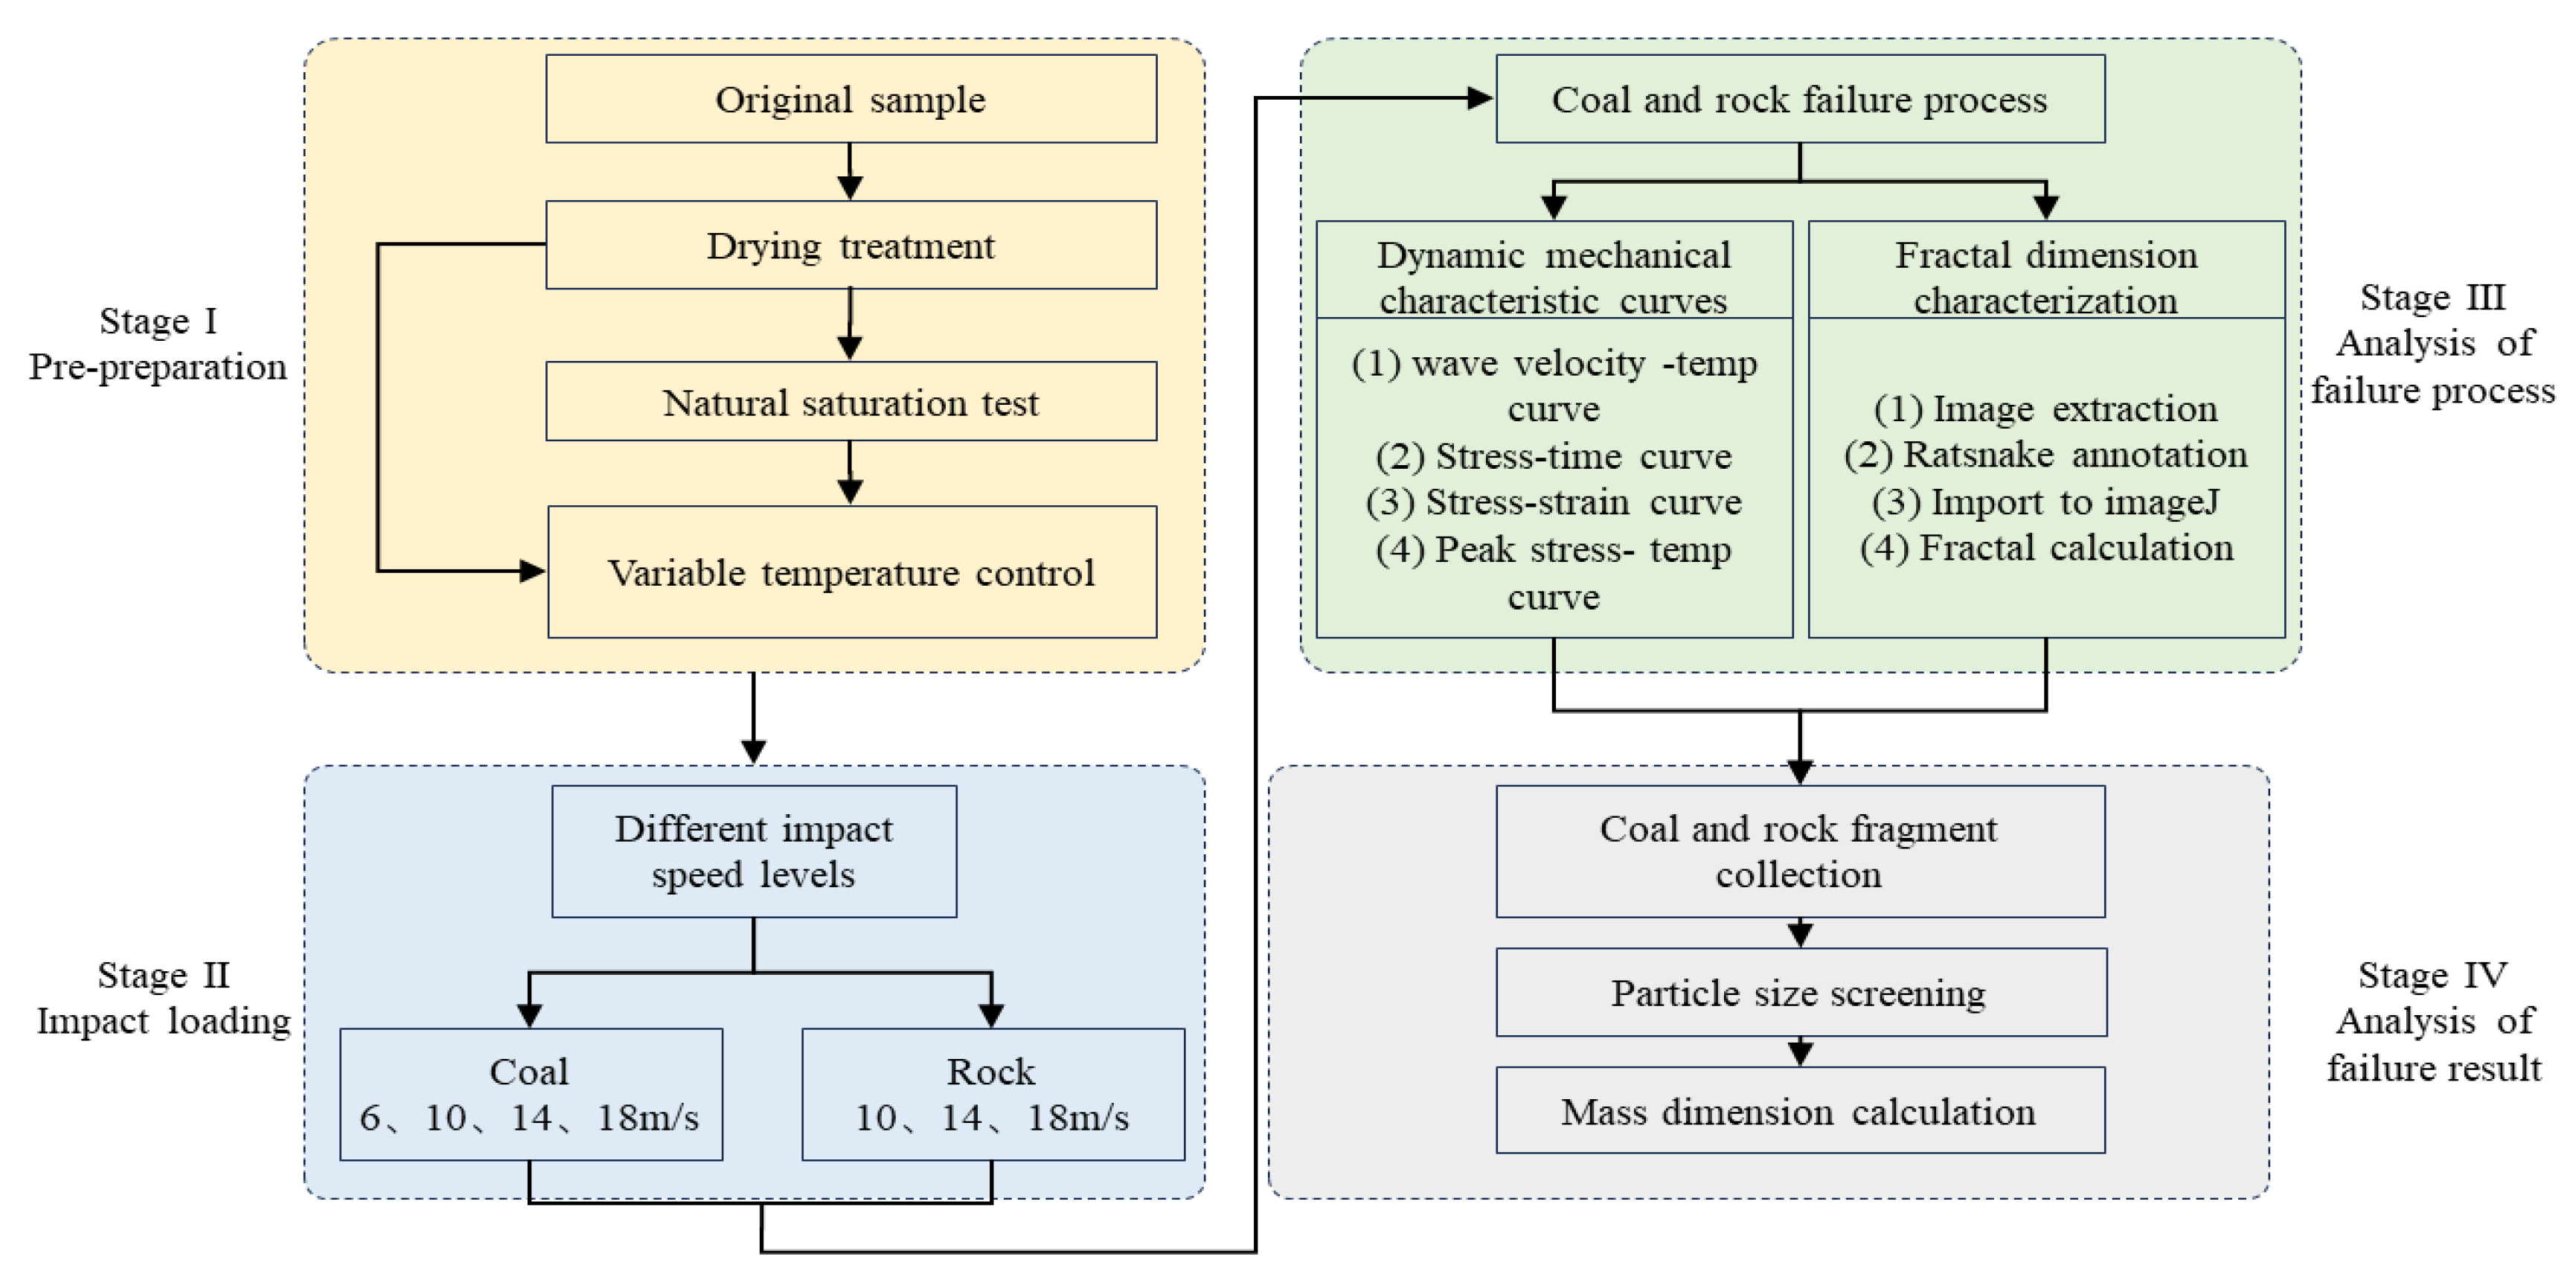
As shown in Figure 5, this experiment was conducted in four stages. In the first stage, all the raw coal and rock samples prepared in the natural water content state were categorised and numbered, and drying was defined as D, saturated as S, and frozen as F. Coal was defined as C, and rock was defined as R. Next, the samples were placed in an electric blast drying oven for drying, the temperature of the drying oven was set at 105 °C, and the drying time was greater than 24 h. The mass of the sample was measured at 1 h intervals after the 24 h interval, and the specimens were considered to have reached a completely dry state when the results of the two weighings before and after were ≤0.01 g. Afterwards, the relevant provisions in the “Methods for the Determination of Physical and Mechanical Properties of Coal and Rock” were followed [27]. Half of the coal and rock samples were naturally saturated with water; specifically, the coal and rock specimens were immersed in a container containing distilled water, keeping the water level 1–2 cm above the top surface of the specimens. The immersion time was greater than 24 h, the samples were weighed at 24 h intervals, and the samples were considered to be fully saturated when the difference in mass between the two times was ≤0.01 g. The saturated and unsaturated coal and rock samples were placed in a high-precision thermostatic chamber with the temperatures set at −20 °C, −10 °C, 0 °C, 10 °C, or 20 °C, and the thermostatic time was 24 h. The longitudinal wave velocity (CP) of the samples was measured with a nonmetallic ultrasonic detector after each operation to determine the effect of the above steps on the physicomechanical properties of the coal and rock specimens [28]. Finally, they were rearranged in order of wave speed, from highest to lowest.
In Stage II, the coal and rock specimens were placed in the SHPB device, and the pressure of the air compressor was adjusted such that the impact rod (bullet) struck the incidence rod at different velocities and the energy was finally transferred to the specimen. For the coal specimen, the velocity of the bullet was set to four different levels: 6 m/s, 10 m/s, 14 m/s, and 18 m/s. Due to the high density of the sandstone specimens, the samples did not show significant changes at an impact velocity of 6 m/s; thus, only the impact velocities of the three different grades of 10 m/s, 14 m/s, and 18 m/s were examined. During the experiment, a small-diameter rubber sheet was pasted between the bullet and the incident rod to shape the incident wave [29,30]. Molybdenum disulfide lubrication was also applied to the ends of the specimen in contact with the incidence and transmission rods [31] to reduce friction effects.
During the impact process, the strain signal acquisition system and high-speed photography device shown in Stage III were used to record the stress–strain signals and surface crack evolution of the coal and rock specimens during the impact process to quantitatively characterise the dynamic mechanics and fracture process of the different media using SHPB and then to assess the stability of the coal and rock system and the damage process [32]. After the impact experiments were completed, the coal and rock fragments were collected and sieved using a split-sample sieve, and the mass sieve dimension was used to portray the coal and rock impact damage results, as shown in Stage IV.

2.4. Introduction to the Theory

2.4.1. Principles of the SHPB Test

The incident, transmitted, and transmissive wave signals were recorded with the strain gauges in the SHPB rods, based on the one-dimensional stress-wave theory and the assumption of stress homogeneity. The stress, strain, and strain rate of the coal and rock samples can be obtained as a function of time [33]:
σ ( t ) = E 0 ε t ( t )
ε ( t ) = 2 C 0 L 0 t ε r ( t ) d t
ε ˙ ( t ) = 2 C 0 L ε r ( t )
In the above equation, ε ˙ ( t ) , ε ( t ) , σ ( t ) are the average strain rate, average strain, and stress, respectively; ε r ( t ) and ε t ( t ) are the reflected wave strain and transmitted wave strain, respectively; E 0 , C 0 are the modulus of elasticity and wave velocity of the rod, respectively; L is the length of the sample.

2.4.2. Box Dimension Calculation Model

The fractal dimension is a statistic that describes the complexity of a geometric shape. There are many definitions of fractal dimension, among which the counting box dimension is the most widely used and relatively easy to calculate. The box dimension is the number of boxes consisting of N squares (with side length δ × δ ) to cover the coal and rock cracks and count the number of non-empty boxes containing pixels of the associated cracks N δ . It is calculated by the formula:
N δ = a δ D
The prefactor a comes from the scaling rule for fractal dimensions D. For a fixed crack image, a is a constant. If Equation (4) is expressed in logarithmic form, the expression reads:
ln N δ = ln a D ln δ
From Equation (5), the slope with respect to ln δ is obtained using linear regression ln N δ . The result is the fractal dimension D of the crack image of the coal and rock.
The box dimension was analysed using the tool for box dimension analysis in the FracLac plugin in ImageJ (5.0 version) software. In order to reduce the error, the original image was first extracted with cracks using the Ratsnake (1.4 version) annotation software to improve the accuracy and resolution. Finally, it was imported into the FracLac plug-in for box dimension analysis. The specific process is shown in Figure 6. In combination with the Ratsnake software and the FracLac plug-in, a quantitative description of the surface cracks in the coal and rock samples was achieved. In particular, the ImageJ software evaluated whether the crack sketch was a binary image. If it was a binary image, the FracLac plug-in was opened manually for analysis. Otherwise, the image was binarised by setting a threshold. In Fraclac, the control panel parameters for analysing the cracks were set in the region of interest (ROI). Finally, the box dimension was obtained from the image scanning and the statistics of Equation (5).

2.4.3. Mass–Frequency Relationship Model

In fact, the fractal theory can be used not only to describe the crack extension law during the destruction of coal and rock, but also to analyse the characteristics of the block size distribution after destruction. A quantitative expression for the degree of coal and rock fragmentation can be established with the help of the mass–frequency relationship metric model for samples after impact damage [34]:
M ( x ) / M T = ( x / x m ) 3 D
where x is the particle size; D is the fractal dimension of the block size distribution; M ( x ) is the mass of the coal and rock crusher with a diameter smaller than x ; x m is the average scale; M T is the total mass of the coal and rock crusher. The total mass of coal and rock fragments is the total mass of coal and rock fragments:
l n [ M ( x ) / M T ] = ( 3 D ) l n ( x / x m )
According to Equation (7), through the double logarithmic scatterplot composed of l n [ M ( x ) / M T ] and l n ( x / x m ) , we used the least-squares method to fit the data, found the fitted slope and the fitted intercept, and then subtracted the slope of the straight line from 3, which was calculated as the mass fractal dimension D.

3. Analysis of Test Results

As mentioned in the previous section, this experiment analysed the dynamic mechanical properties and crack evolution process of coal and rock materials under SHPB impact conditions at the following four levels: (1) longitudinal wave velocity curve analysis, (2) stress–strain curve relationship, (3) crack evolution trend, and (4) sieving of coal and rock fragments.

3.1. Basic Physical Parameters and Wave Velocity Determination of Coal Stone Samples

3.1.1. Basic Physical Parameters

To better analyse the dynamic mechanical properties of the coal and rock specimens, firstly, the basic physical parameters such as mass, height, and diameter of each specimen were measured. Secondly, the arithmetic mean of the longitudinal wave velocity was calculated after several trials using the ultrasonic method test with reference to ASTM D 2845 [35]. The arithmetic mean of the longitudinal wave speed was calculated after several tests [36,37]. The uniaxial compression damage experiments were measured to determine the compressive coefficient, modulus of elasticity, and Poisson’s ratio using the microcomputer-controlled electrohydraulic servo press YAW6106. The final results are summarised in Table 1 and Table 2.

3.1.2. Characteristics of the Wave Velocity Measurements at Different Temperatures and Saturation Levels

In this study, after several measurements of the sample, the average wave speed was used and plotted as a graph of the variation in the wave speed of the longitudinal wave.
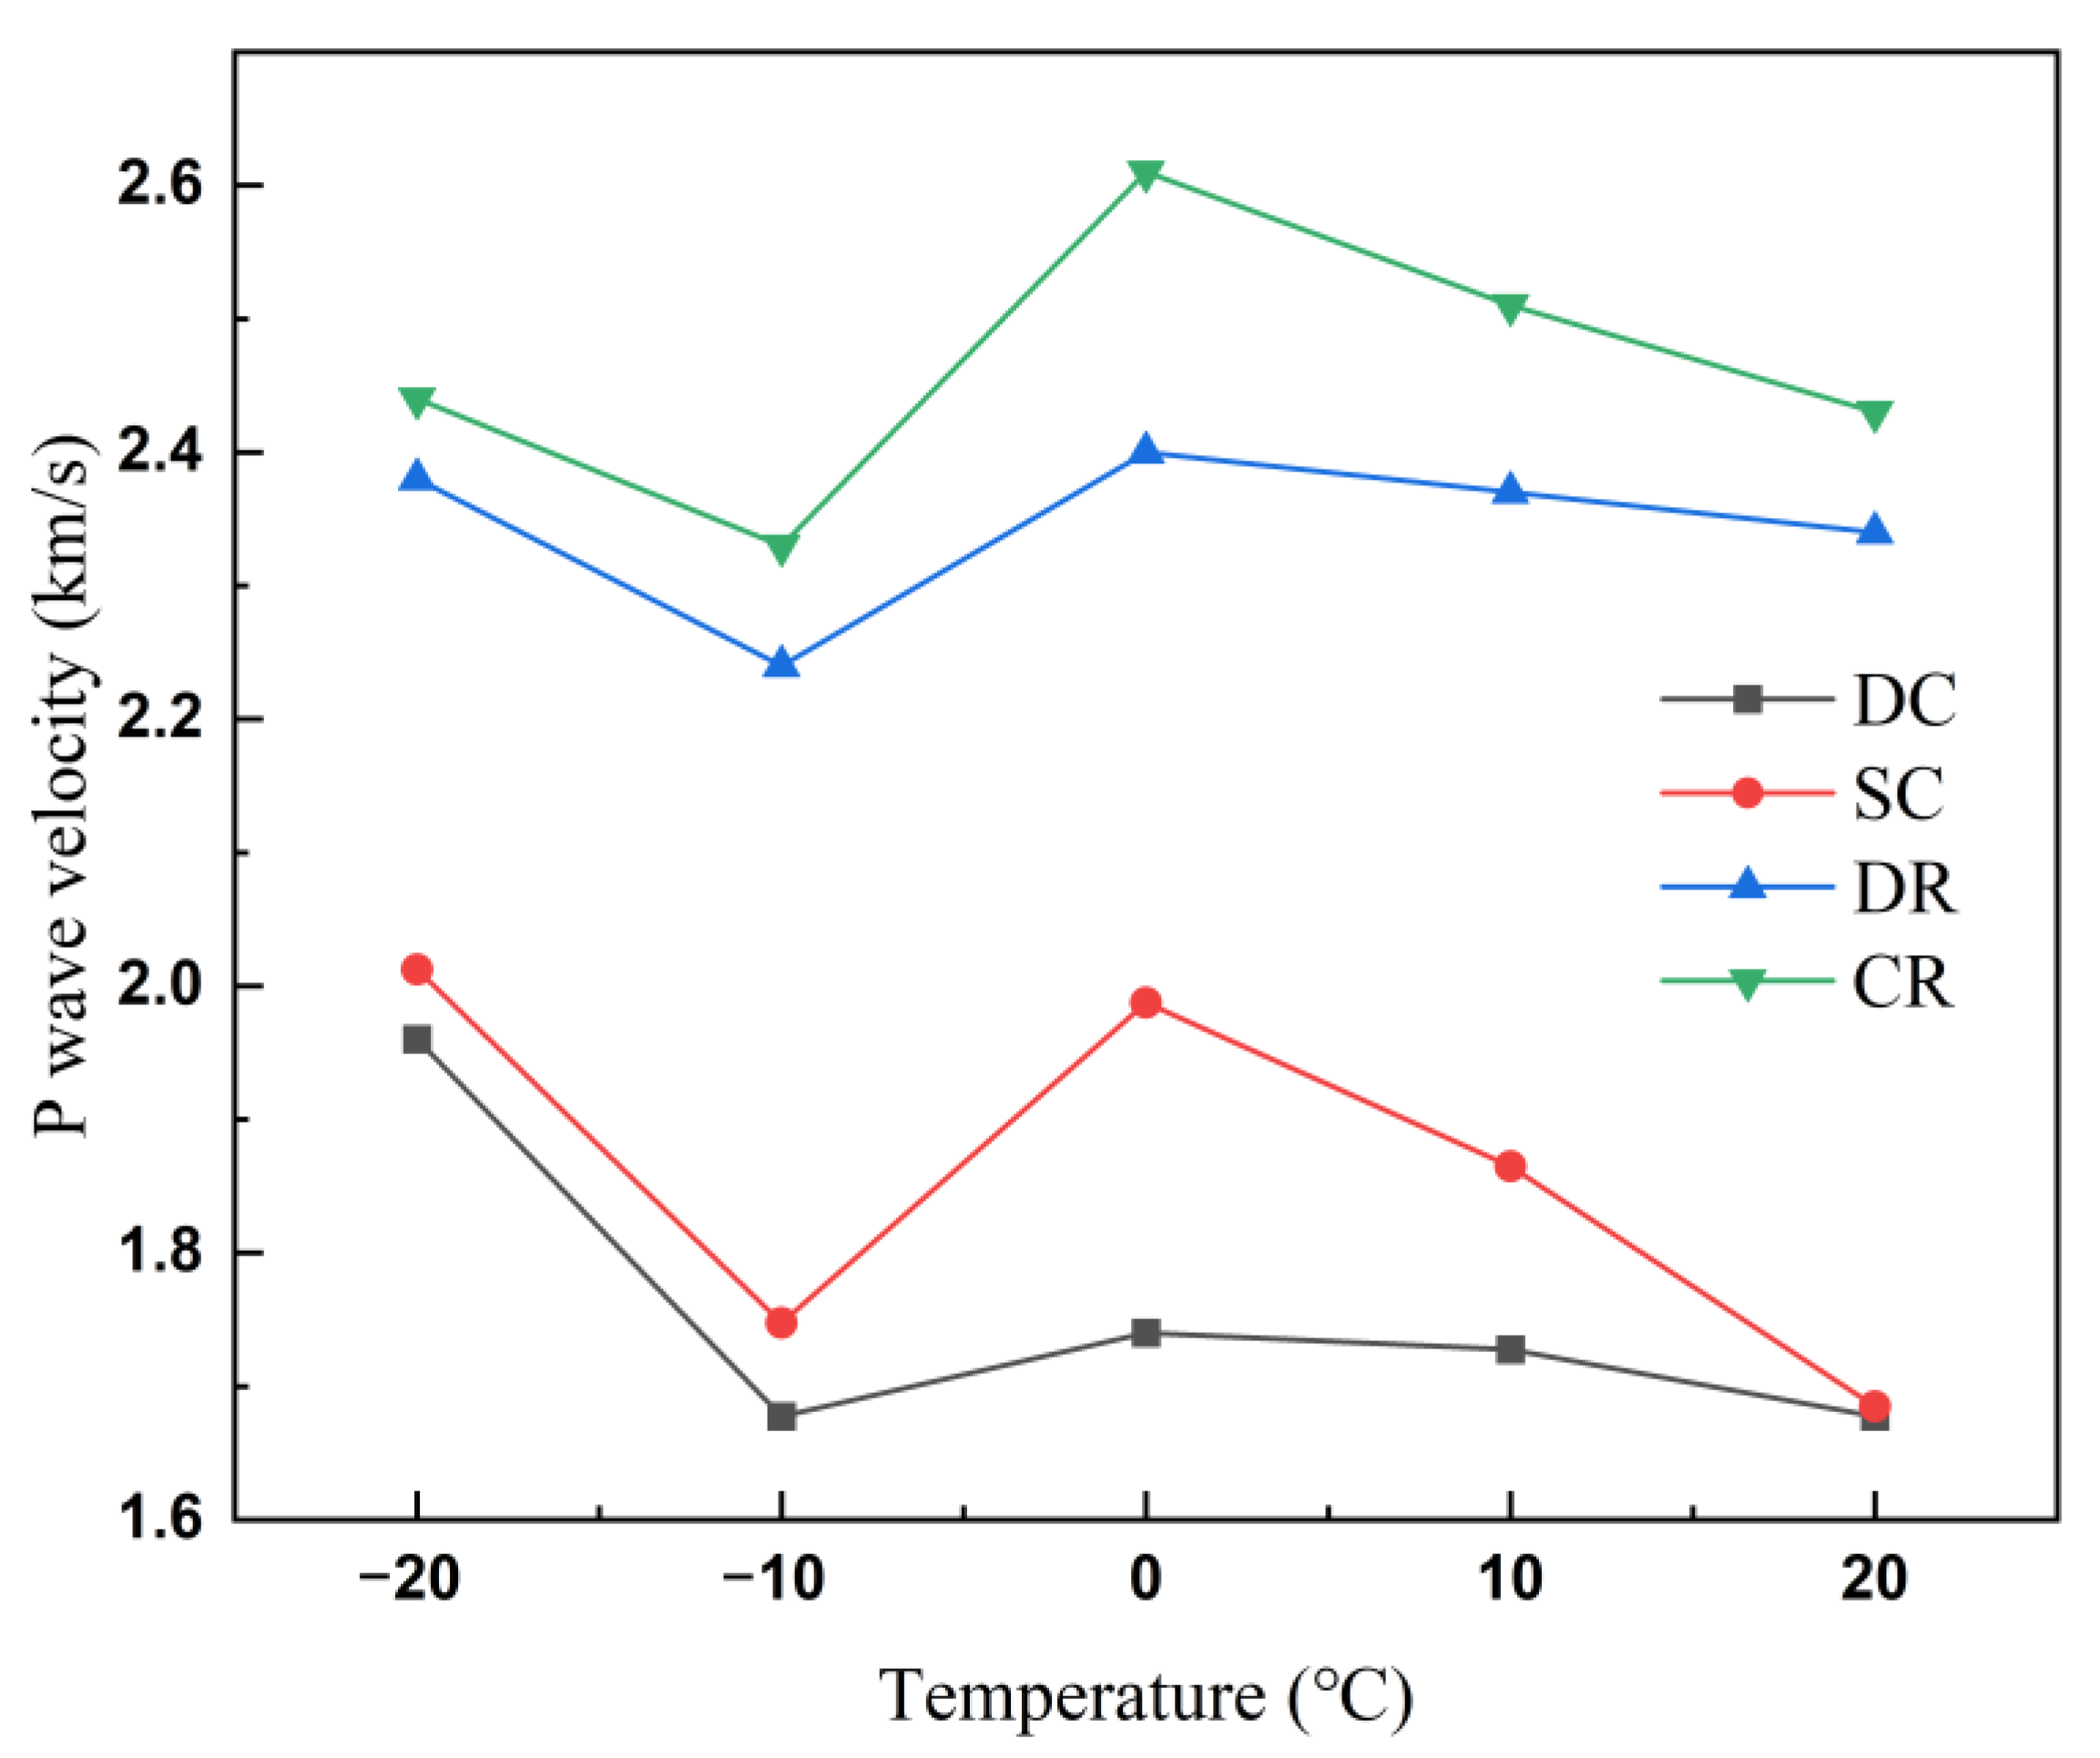
Figure 7 shows the ultrasonic wave velocity diagram of the dry and saturated coal and rock samples at different temperatures. As shown in the figure, the degree of wave speed can directly reflect the degree of material densification. The ratio of coal samples (1.68–2.01 km/s) to rock samples (2.24–2.61 km/s) shows that the degree of densification of coal is lower than that of rock.
The wave speeds of all coal and rock samples showed a trend of initially increasing, then decreasing, and then increasing as the temperature decreases. The inflection points were at 0 °C and −10 °C, and an “N”-shaped pattern was observed. Among them, the highest slope of the increase or decrease in wave velocity was observed when the temperature was reduced from 0 °C to −10 °C and then to −20 °C.
Comparing the samples in the dry and saturated states, the wave speeds of the coal and rock samples in the saturated state were all greater than those of the coal and rock samples in the dry state. The degree of rapidity of growth or decrease in the saturated state of the coal and rock was higher than that in the dry state. The wave speed of coal increases more than that of rock from 20 °C to 0 °C and from −10 °C to −20 °C. At 0 °C to −10 °C, rocks decrease more than coal.
The increase in wave speed potentially occurred because the contraction of mineral particles or the phase change of water ice changed the longitudinal wave speed of coal and rock samples. As the pore ice filled the voids inside the coal and rock, the medium was solid–liquid–solid before, and it became solid–solid–solid. The wave impedance of ice was closer to that of the solid medium of coal and rock compared to that of water in the crevices; this caused the propagation of ultrasonic waves inside the coal and rock, and the ice in the pores reduced the wave diffraction and reflection between the original coal and original rock interfaces and the surface of the pores, thus causing a great increase in the longitudinal wave speed. The ice in the pore space reduced the diffraction and reflection of longitudinal waves at the interface between the coal or rock and the pore surface, which led to a significant increase in the longitudinal wave speed. This observation is in high agreement with Li’s findings [38].

3.2. Dynamic Mechanical Characteristics

3.2.1. Time History Curve of Stress Wave

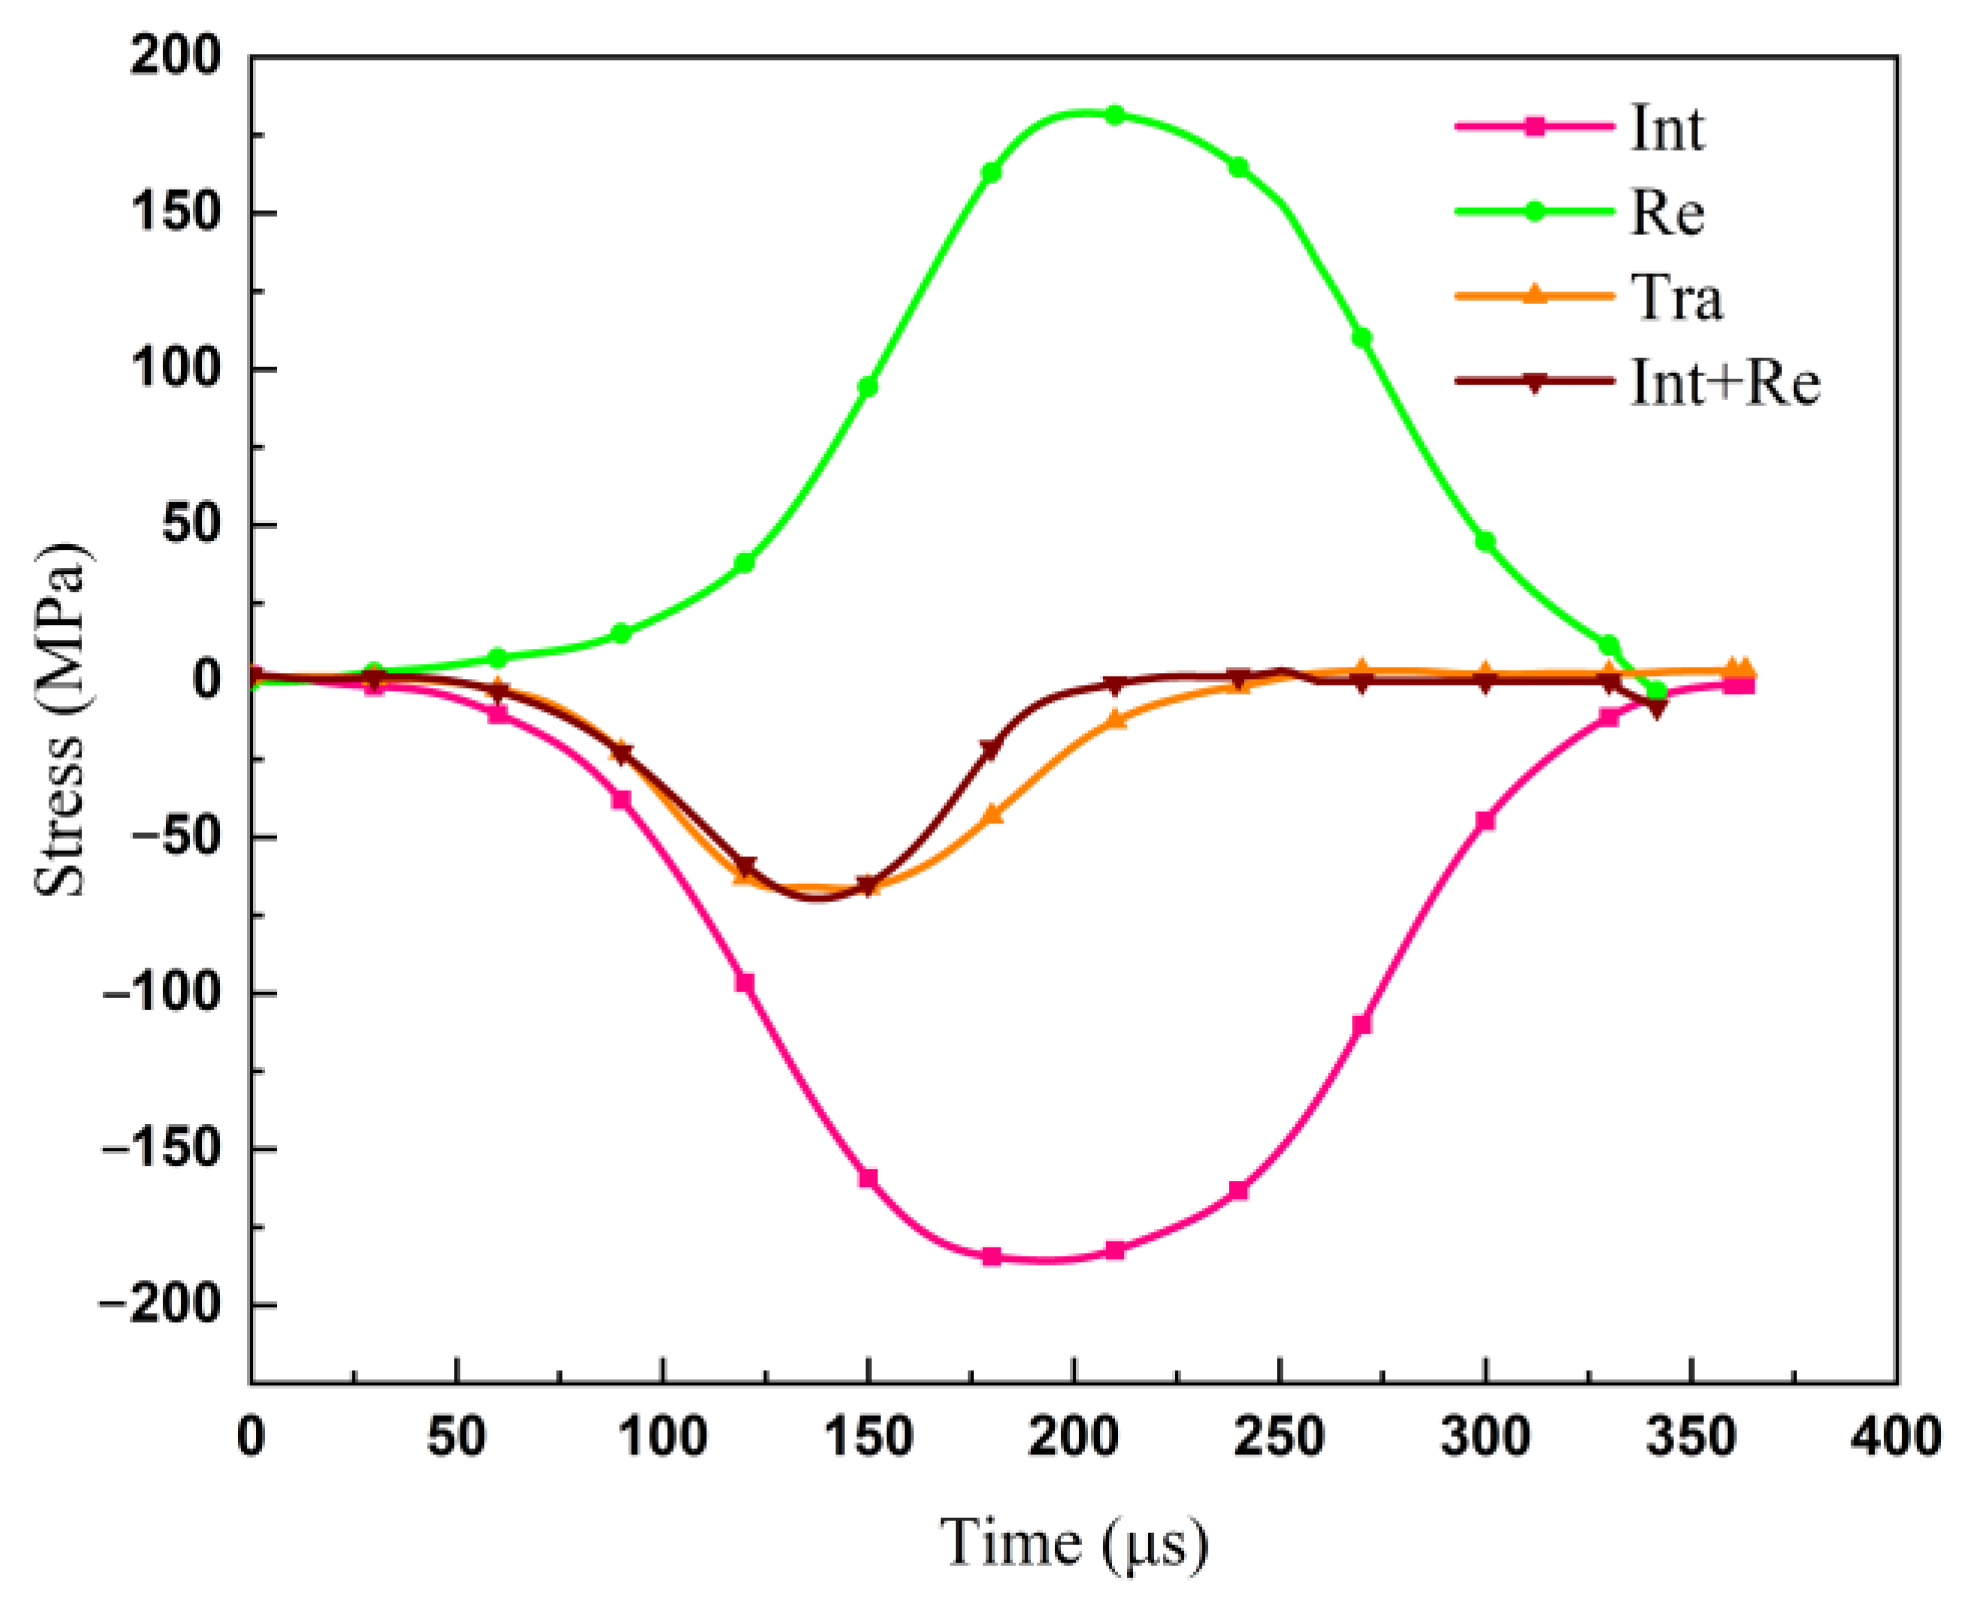
At the beginning of the experiment, to ensure the accuracy of the SHPB experimental results, stress balance verification was performed before processing the data [32]. Specifically, the two end faces of the specimen needed to reach stress equilibrium under the impact load, and the stress equilibrium curve of the specimens are shown in Figure 8. As shown in the figure, the superposition of the incident wave, reflected wave, and transmitted wave basically coincided with each other, indicating that the coal and rock basically reached the stress equilibrium state.
Due to the large noise in the original signal, the data in this study were denoised and analysed using the Hilbert–Huang transformation (HHT) method [39]. Due to space limitations, only some data with different variables were analysed as an example.
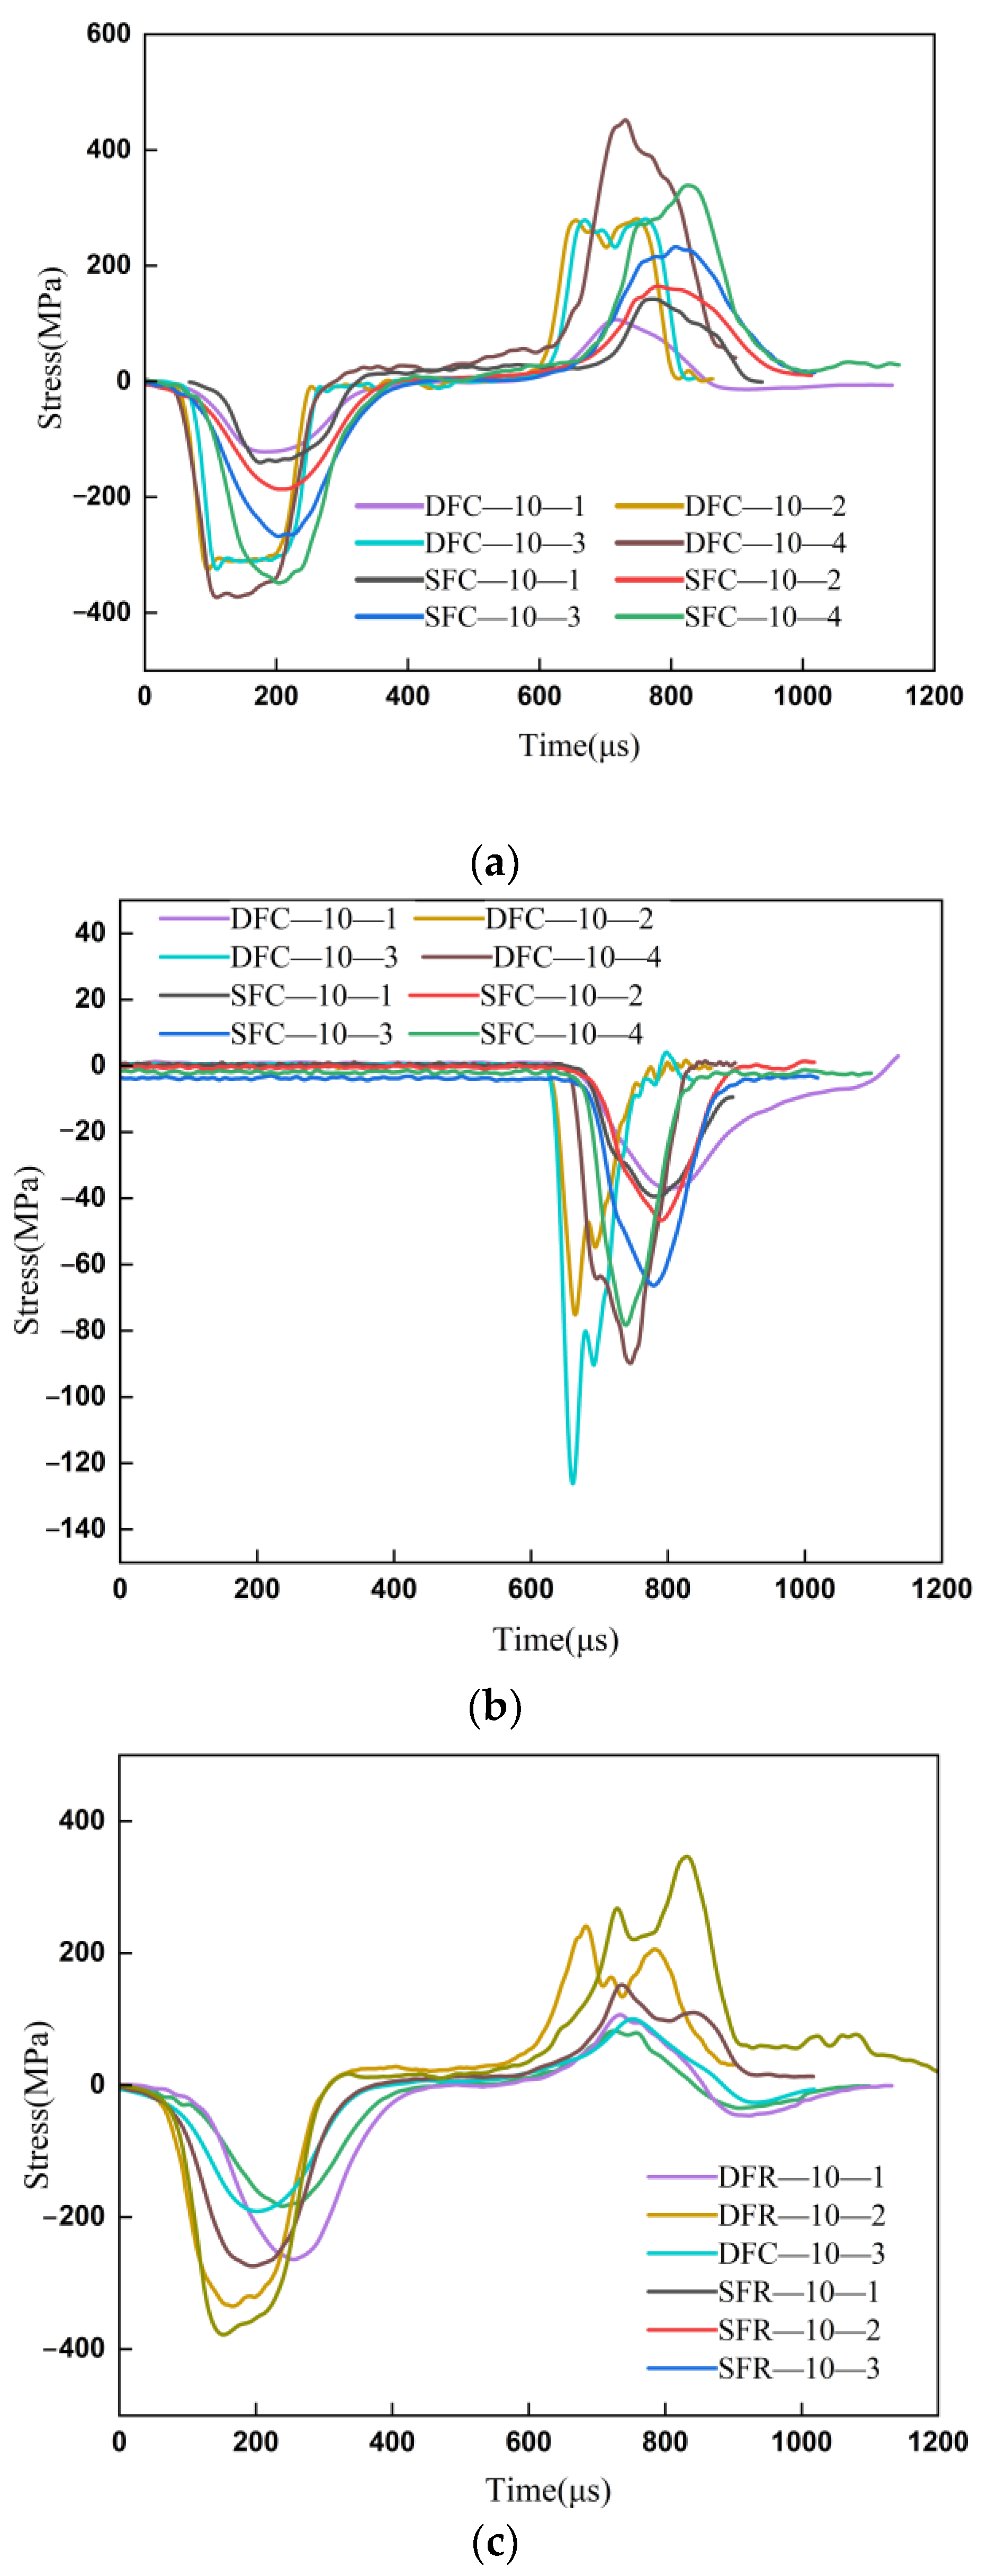
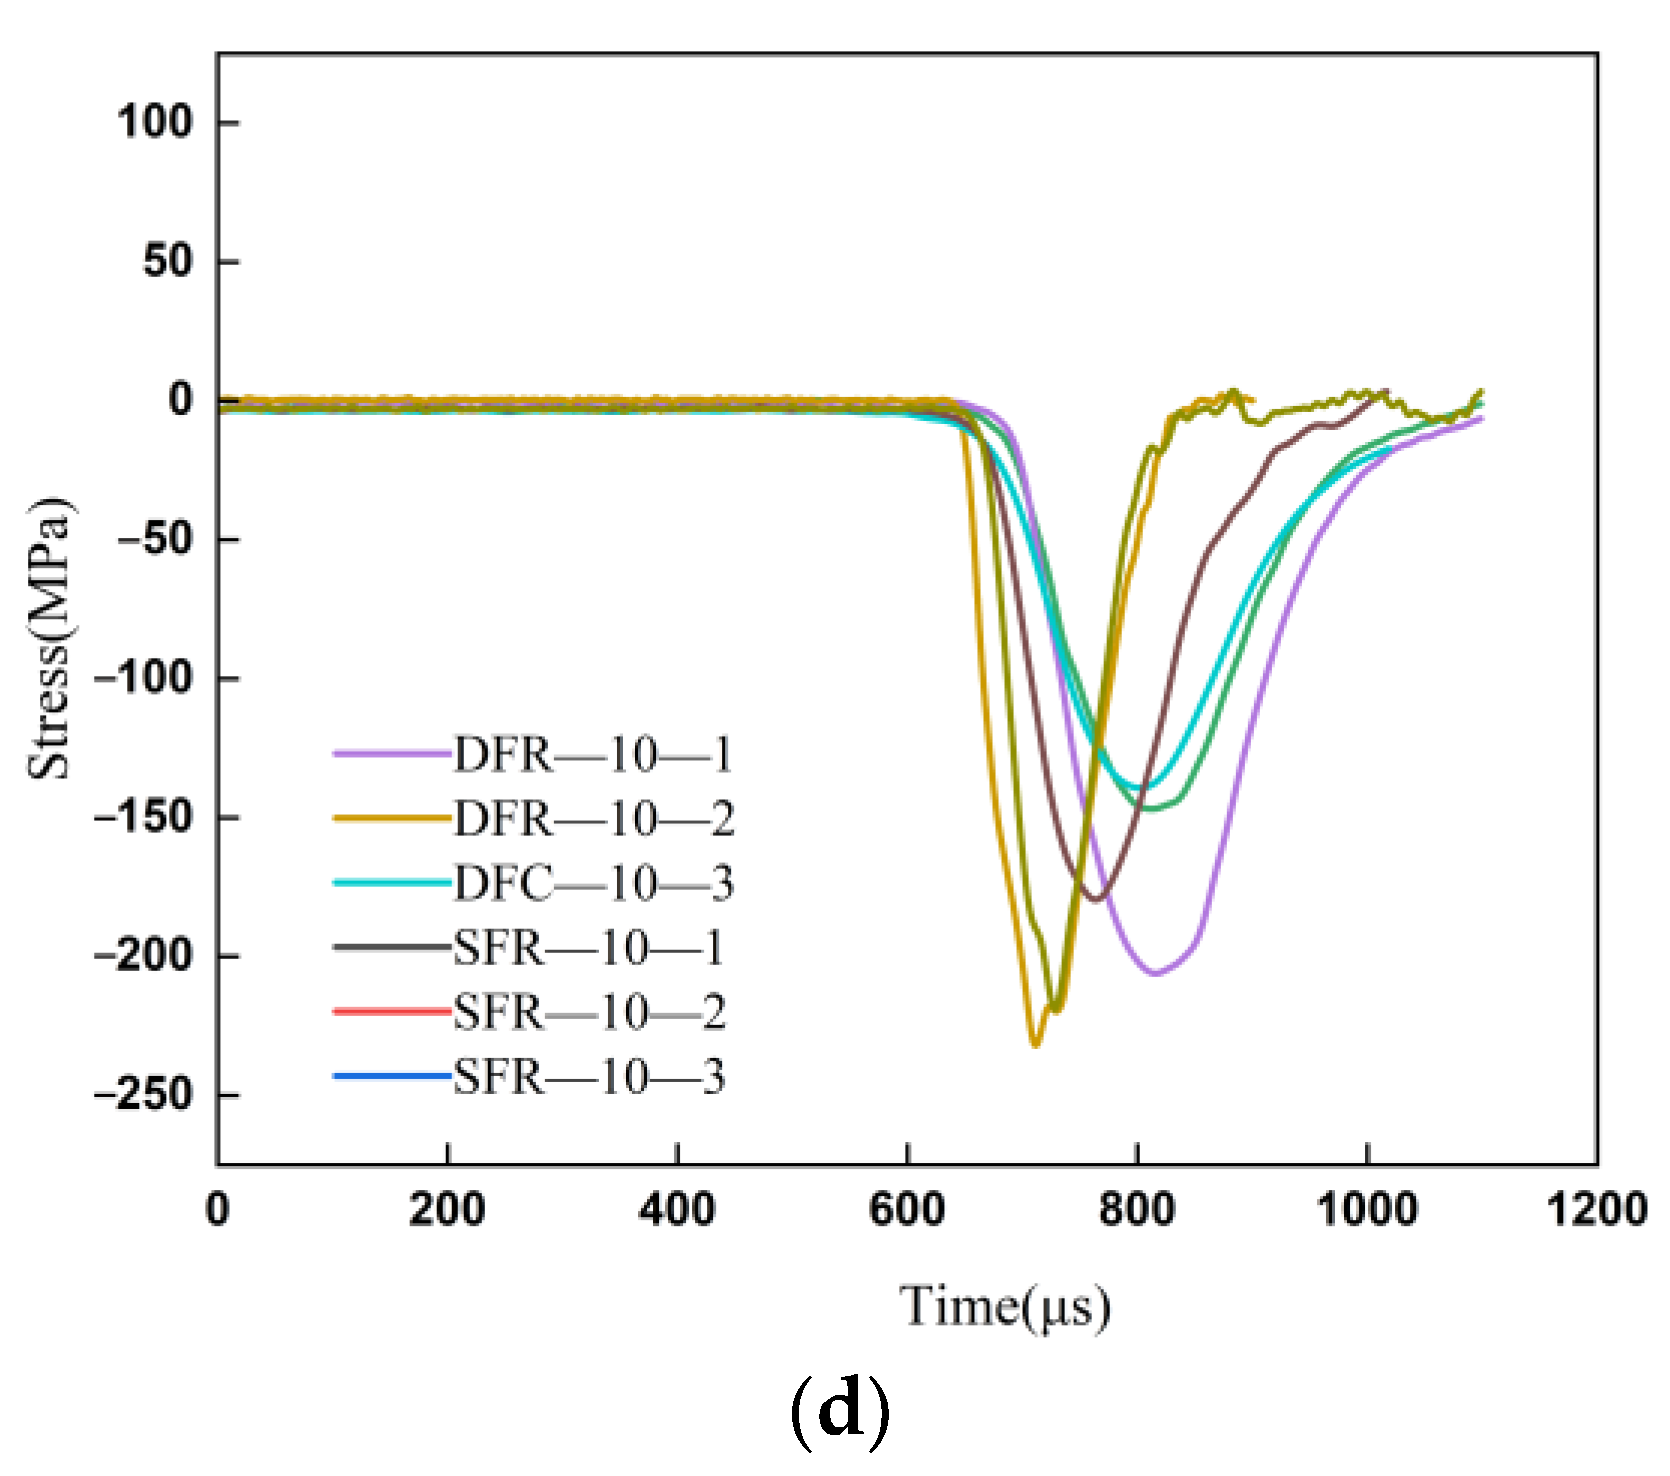
Figure 9a,b show the stress time course curves of raw coal at the same freezing temperature of −10 °C with different saturations and speeds. As shown in the figure, (1) all curves of the incident waves have sinusoidal or half-sinusoidal curves. With the increase in the impact velocity, the peak points of the incident, reflection, and transmission curves gradually increase, the peak arrival time is advanced, and the overall duration of the impact is also shortened. At lower velocities, the reflected stress tail reaches a negative value. The reason for this phenomenon is that the specimen is not destroyed completely under incident wave loading conditions, and a large amount of strain energy is stored in the medium instead. These strain energies are released in the unloading phase of the incident wave and rebound to the bar as compression waves. (2) In the dry state and natural water-saturated state, the peak value of the transmission wave of the raw coal in the water-saturated state is higher than that in the dry state. Compared with Table 1, a denser sample in the water-saturated state occurs because a large amount of liquid water or solid water fills the internal cracks. The large amount of liquid or solid water in the internal clefts leads to a reduction in energy dissipation within the sample due to the presence of the Stefan effect.
Using the same means, the same noise reduction was applied to the experimental data of the raw rock. As shown in Figure 9c,d, the graphs show the stress time-course curves of the raw rock at the same freezing temperature of −10 °C for different saturations and velocities. The overall regularity of the coal and rock bodies has a high degree of overlap. The trend shows that with increasing speed, the peak value of the curve increases; the sample reaches the peak time earlier. Raw rock in the dry and saturated contrasting cases also had a similar pattern to raw coal, both of which had higher curves in the dry case than in the saturated state.
Notably, the peak of the transmittance wave of the coal samples was significantly lower than that of the rock samples. Similarly, the process of reaching the peak of the stress wave in coal samples tended to be relatively slow. This was caused by the different densities of the coal and rock samples, which were determined through the wave speeds in Table 1 and Table 2. A denser sample causes a faster propagation of the ultrasonic wave. This curve and wave speed could be used to validate each other.

3.2.2. Dynamic Mechanical Characteristics of Coal and Rock during Impact

To better analyse the effect of temperature on the coal and rock samples, the stress–strain diagrams and peak stress diagrams were plotted for analysis. Using the three-wave method, the stress–strain curve was obtained after the calculation of the stress time-course curve. As shown in Figure 10a,b, the stress–strain curves in the water-saturated state had velocities of 18 m/s for coal and rock. As shown in the figures, the trend process of the coal and rock stress–strain curves at different temperatures is very similar; however, some differences in the characteristics of each stage are present. First, the coal samples at 10 °C, 20 °C, and −20 °C show a kind of “saddle shape”, which was evidently a manifestation of the strain intensification, and the brittleness of the samples was also more significant in this stage; rocks did not have this shape. Second, at a freezing temperature of −10 °C, the slope of the curve rises slowly in the initial phase, and the strain duration was shorter. The slow decrease in the unloading stage also showed that at −10 °C, the sample had the worst load-carrying capacity and the most severe deformation. In the last part of the curve, a certain “rebound” phenomenon occurred at the end stage because after the peak value, the coal and rock samples still had the ability to resist external loads.
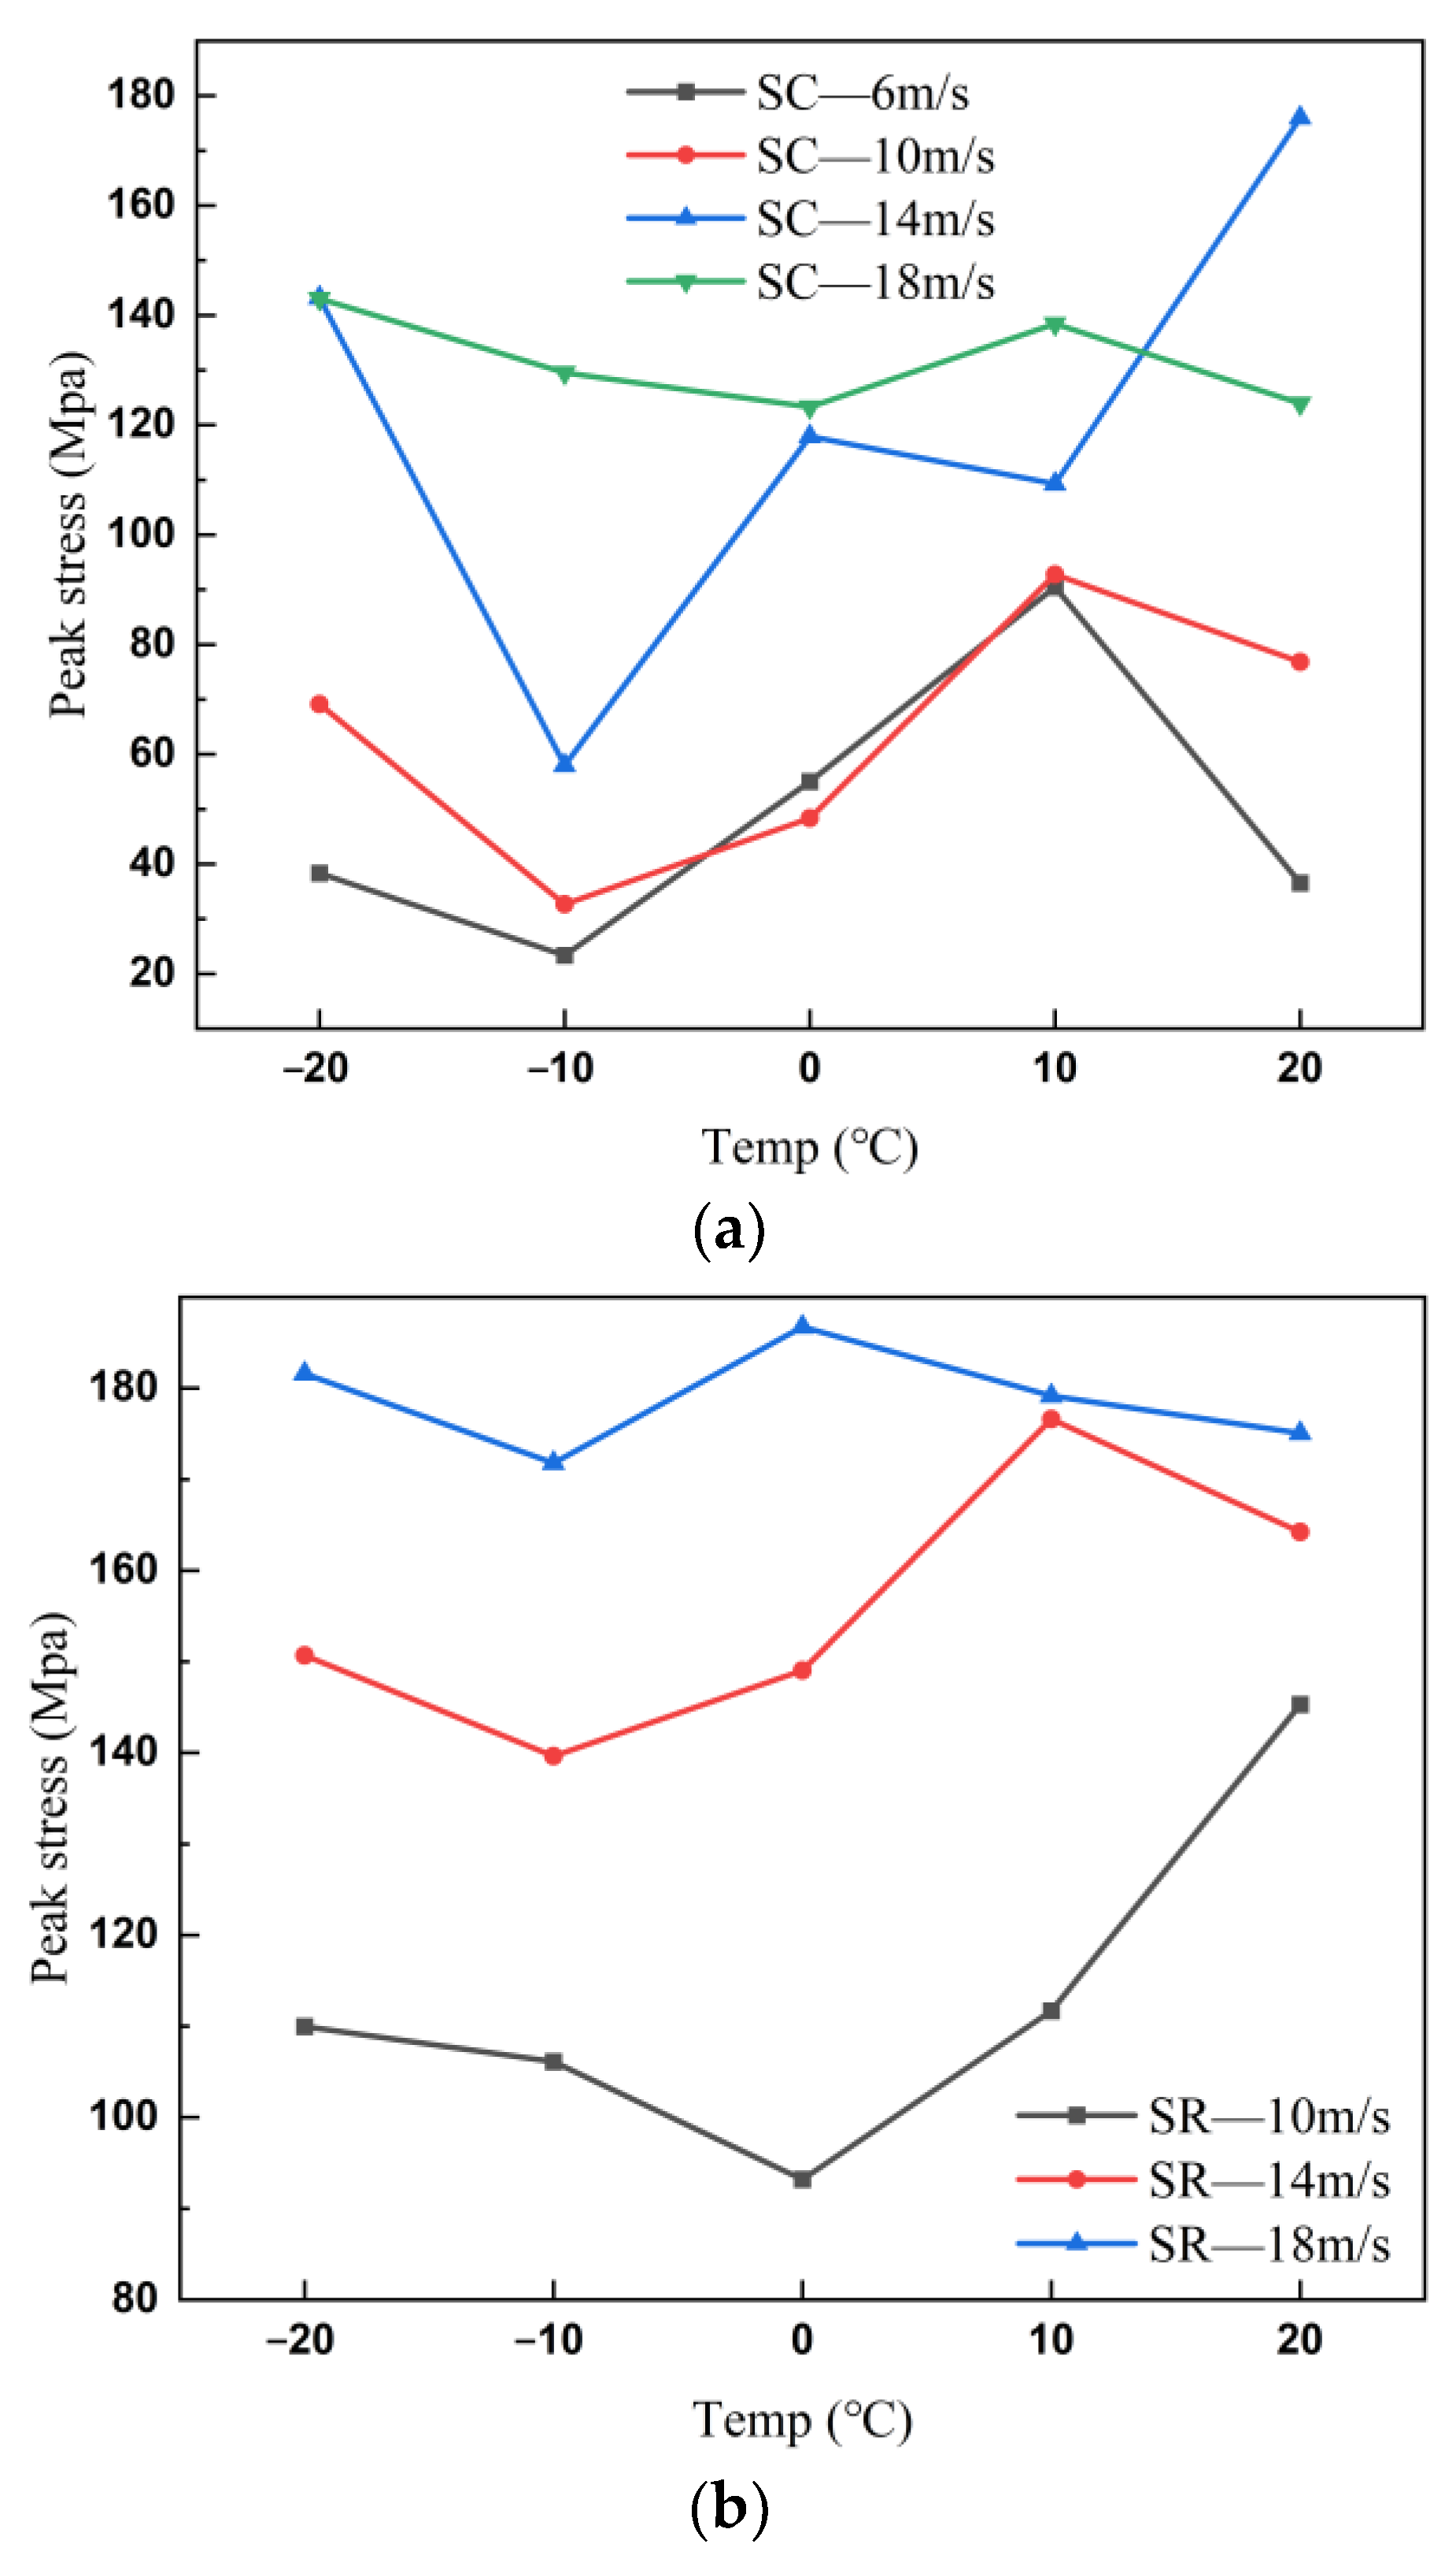
In the analysis of the dynamic load mechanics, a fixed trend for the change in stress at different temperatures among studies by different scholars has not been shown. In this study, the variation curve of the peak stress with the temperature gradient in water-saturated coal and rock was plotted based on the stress–strain curve in Figure 10a,b, as shown in Figure 11a,b. In Figure 11a, for the coal samples at temperatures from −20 °C to −10 °C, the peak strength rapidly decreased. From −10 °C to 10 °C, the peak intensity slowly increased. A temperature of −10 °C was an inflection point of change.
In Figure 11b, the rock samples also maintained a similar pattern. The overall stress peaks all increased with increasing impact velocity. The inflection point decreased from −10 °C to 0 °C. The same pattern was maintained with the peak stress curve of coal at 18 m/s. Overall, the peak strength of water-saturated rock maintained the trend of rising, falling, and then rising with the decrease in temperature, which is similar to an “N” shape. However, the coal and rock samples are also slightly different. The 10 m/s impact velocity for the rock shows a U-shaped pattern.
Based on the above results, two aspects of the joint role are as follows: (1) With a decrease in the temperature, the cold coal or rock body lead to a gradual reduction in its own strength and volume shrinkage, resulting in the closure of the internal fissure. (2) In the freezing process, liquid water transforms into solid ice; it expands in volume and generates freezing expansion force. Under the action of frost heave force, micro-cracks sprout or expand the existing cracks at the cracks. The two factors are mutually restraining and mutually exist. At different temperatures, the change in its own strength dominates the strength of the material. At 0 °C, the freezing expansion forces within the material dominate, increasing the degree of internal damage to the rock and leading to an instantaneous decrease in its strength. For coal, the value of this “critical” temperature is −10 °C.

3.3. Process of Crack Propagation and Specimen Failure

3.3.1. Recognition and Feature Extraction of Surface Cracks

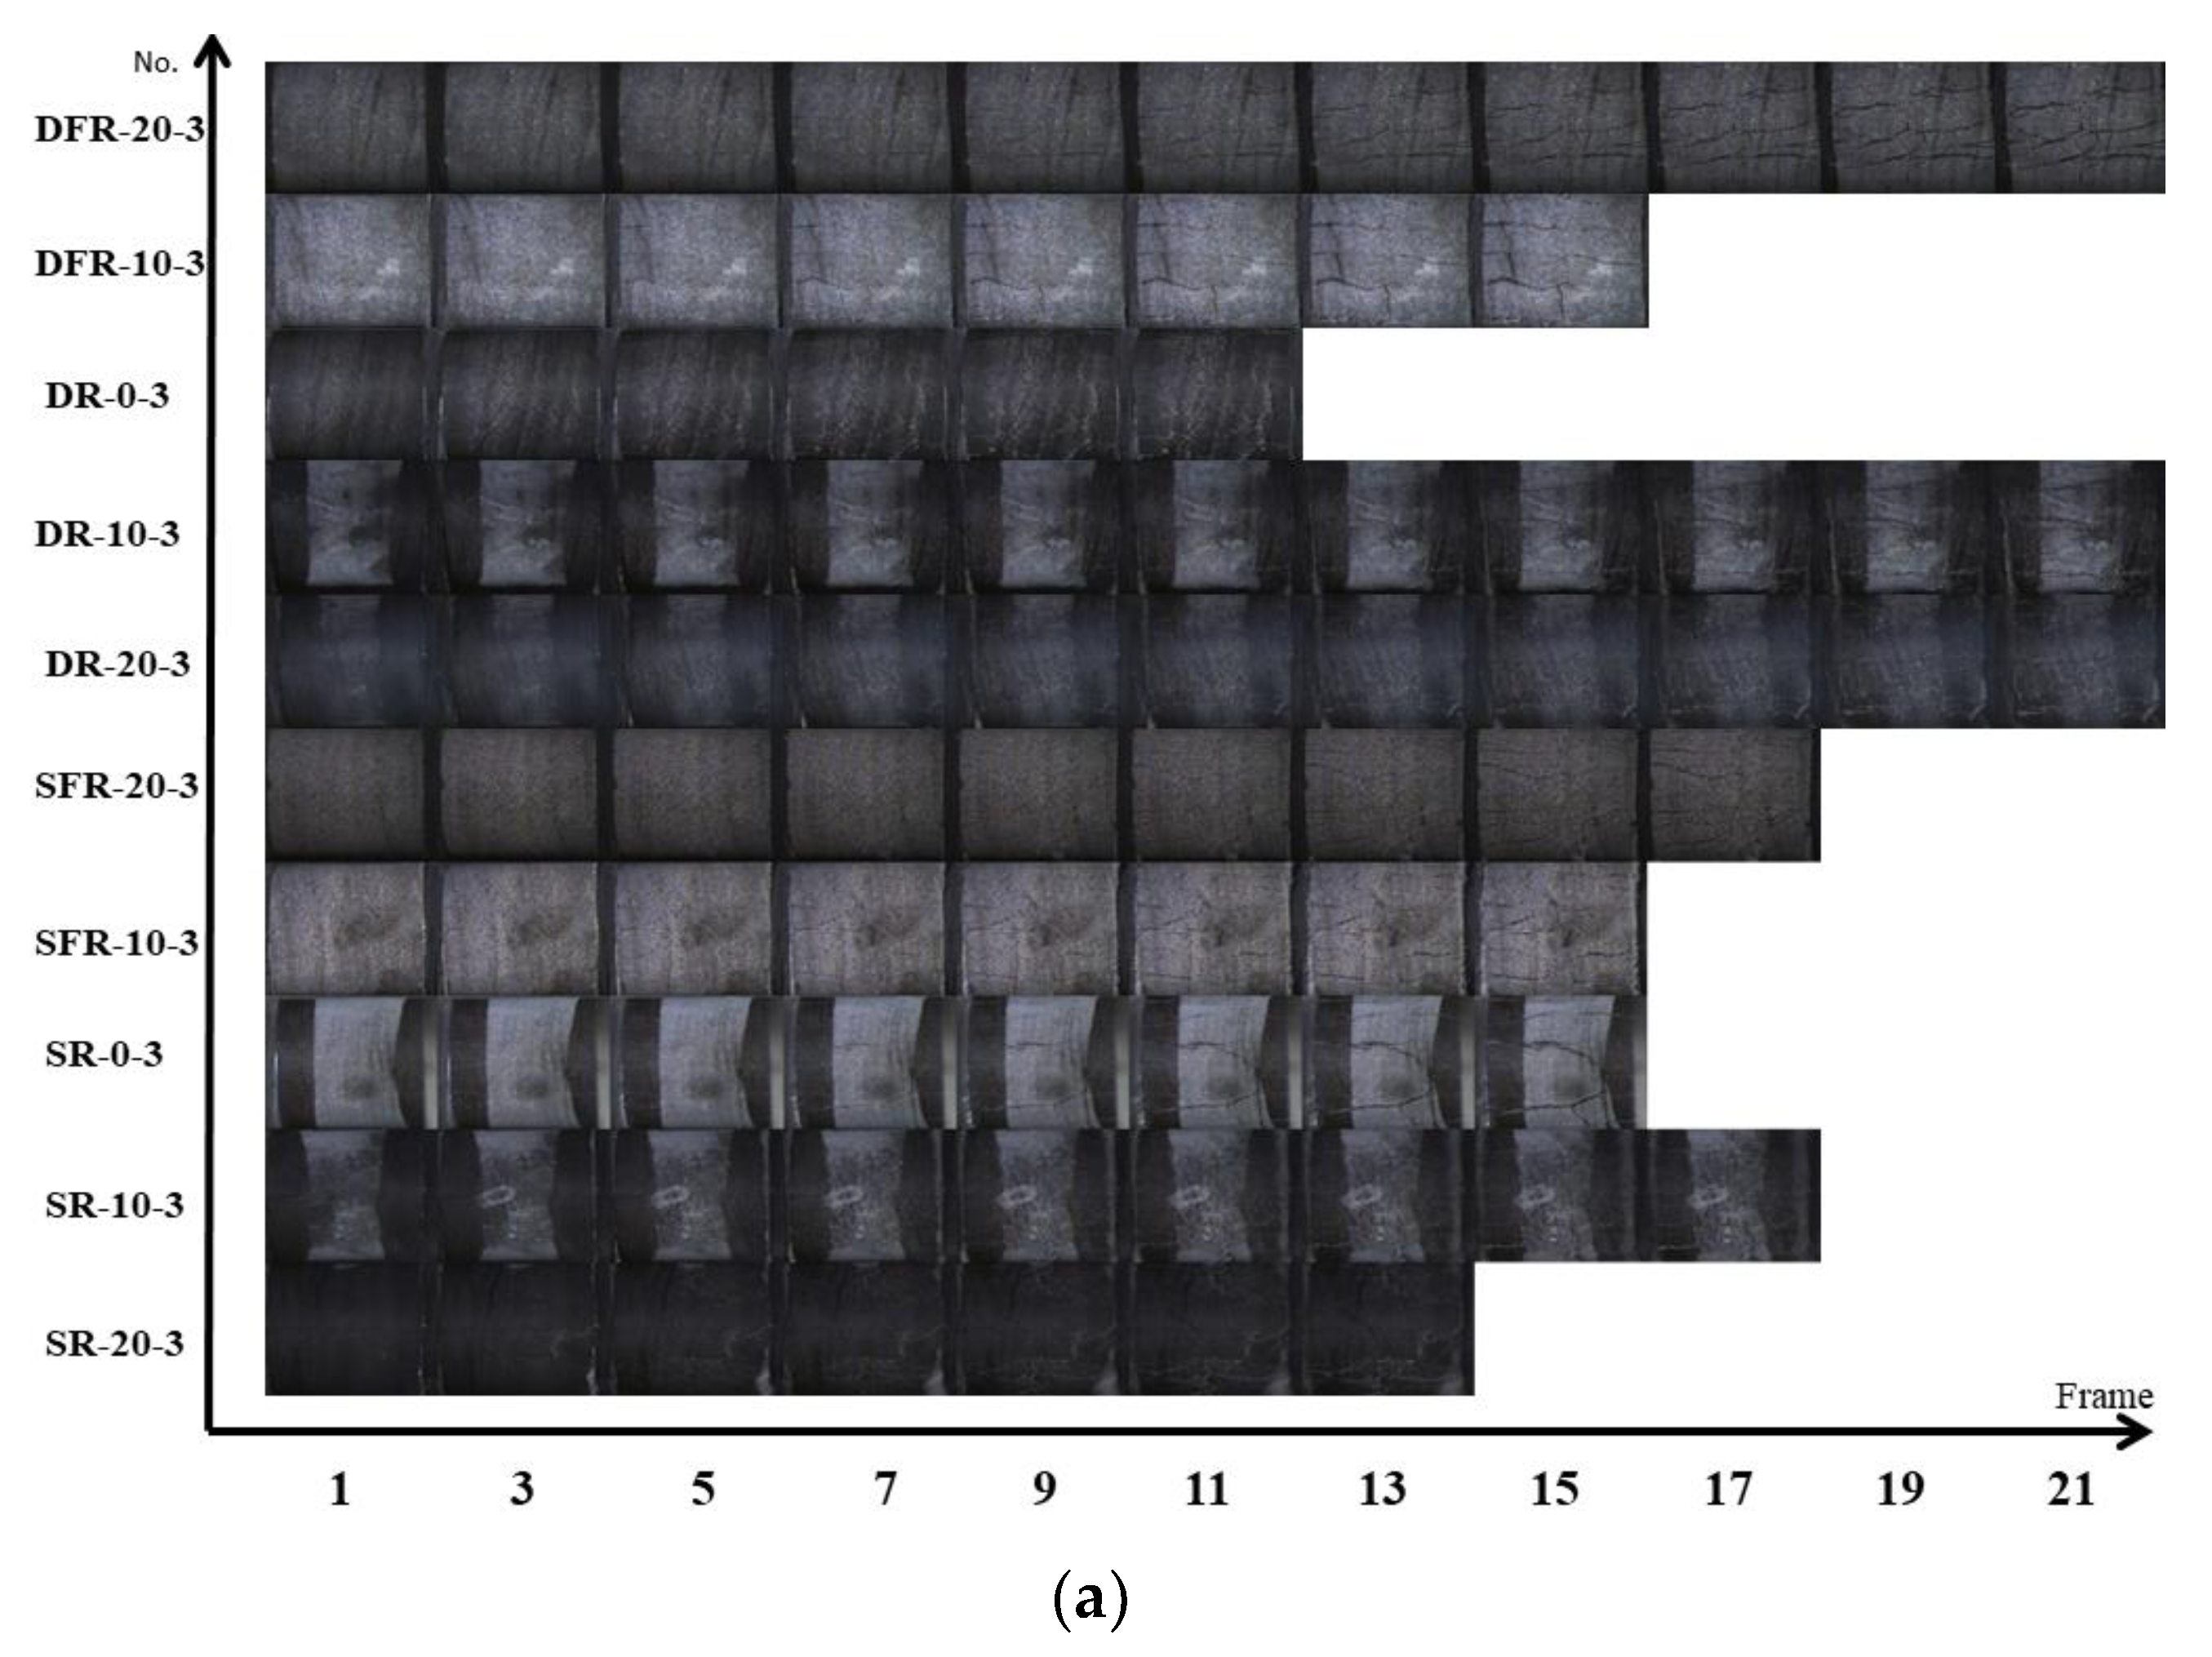
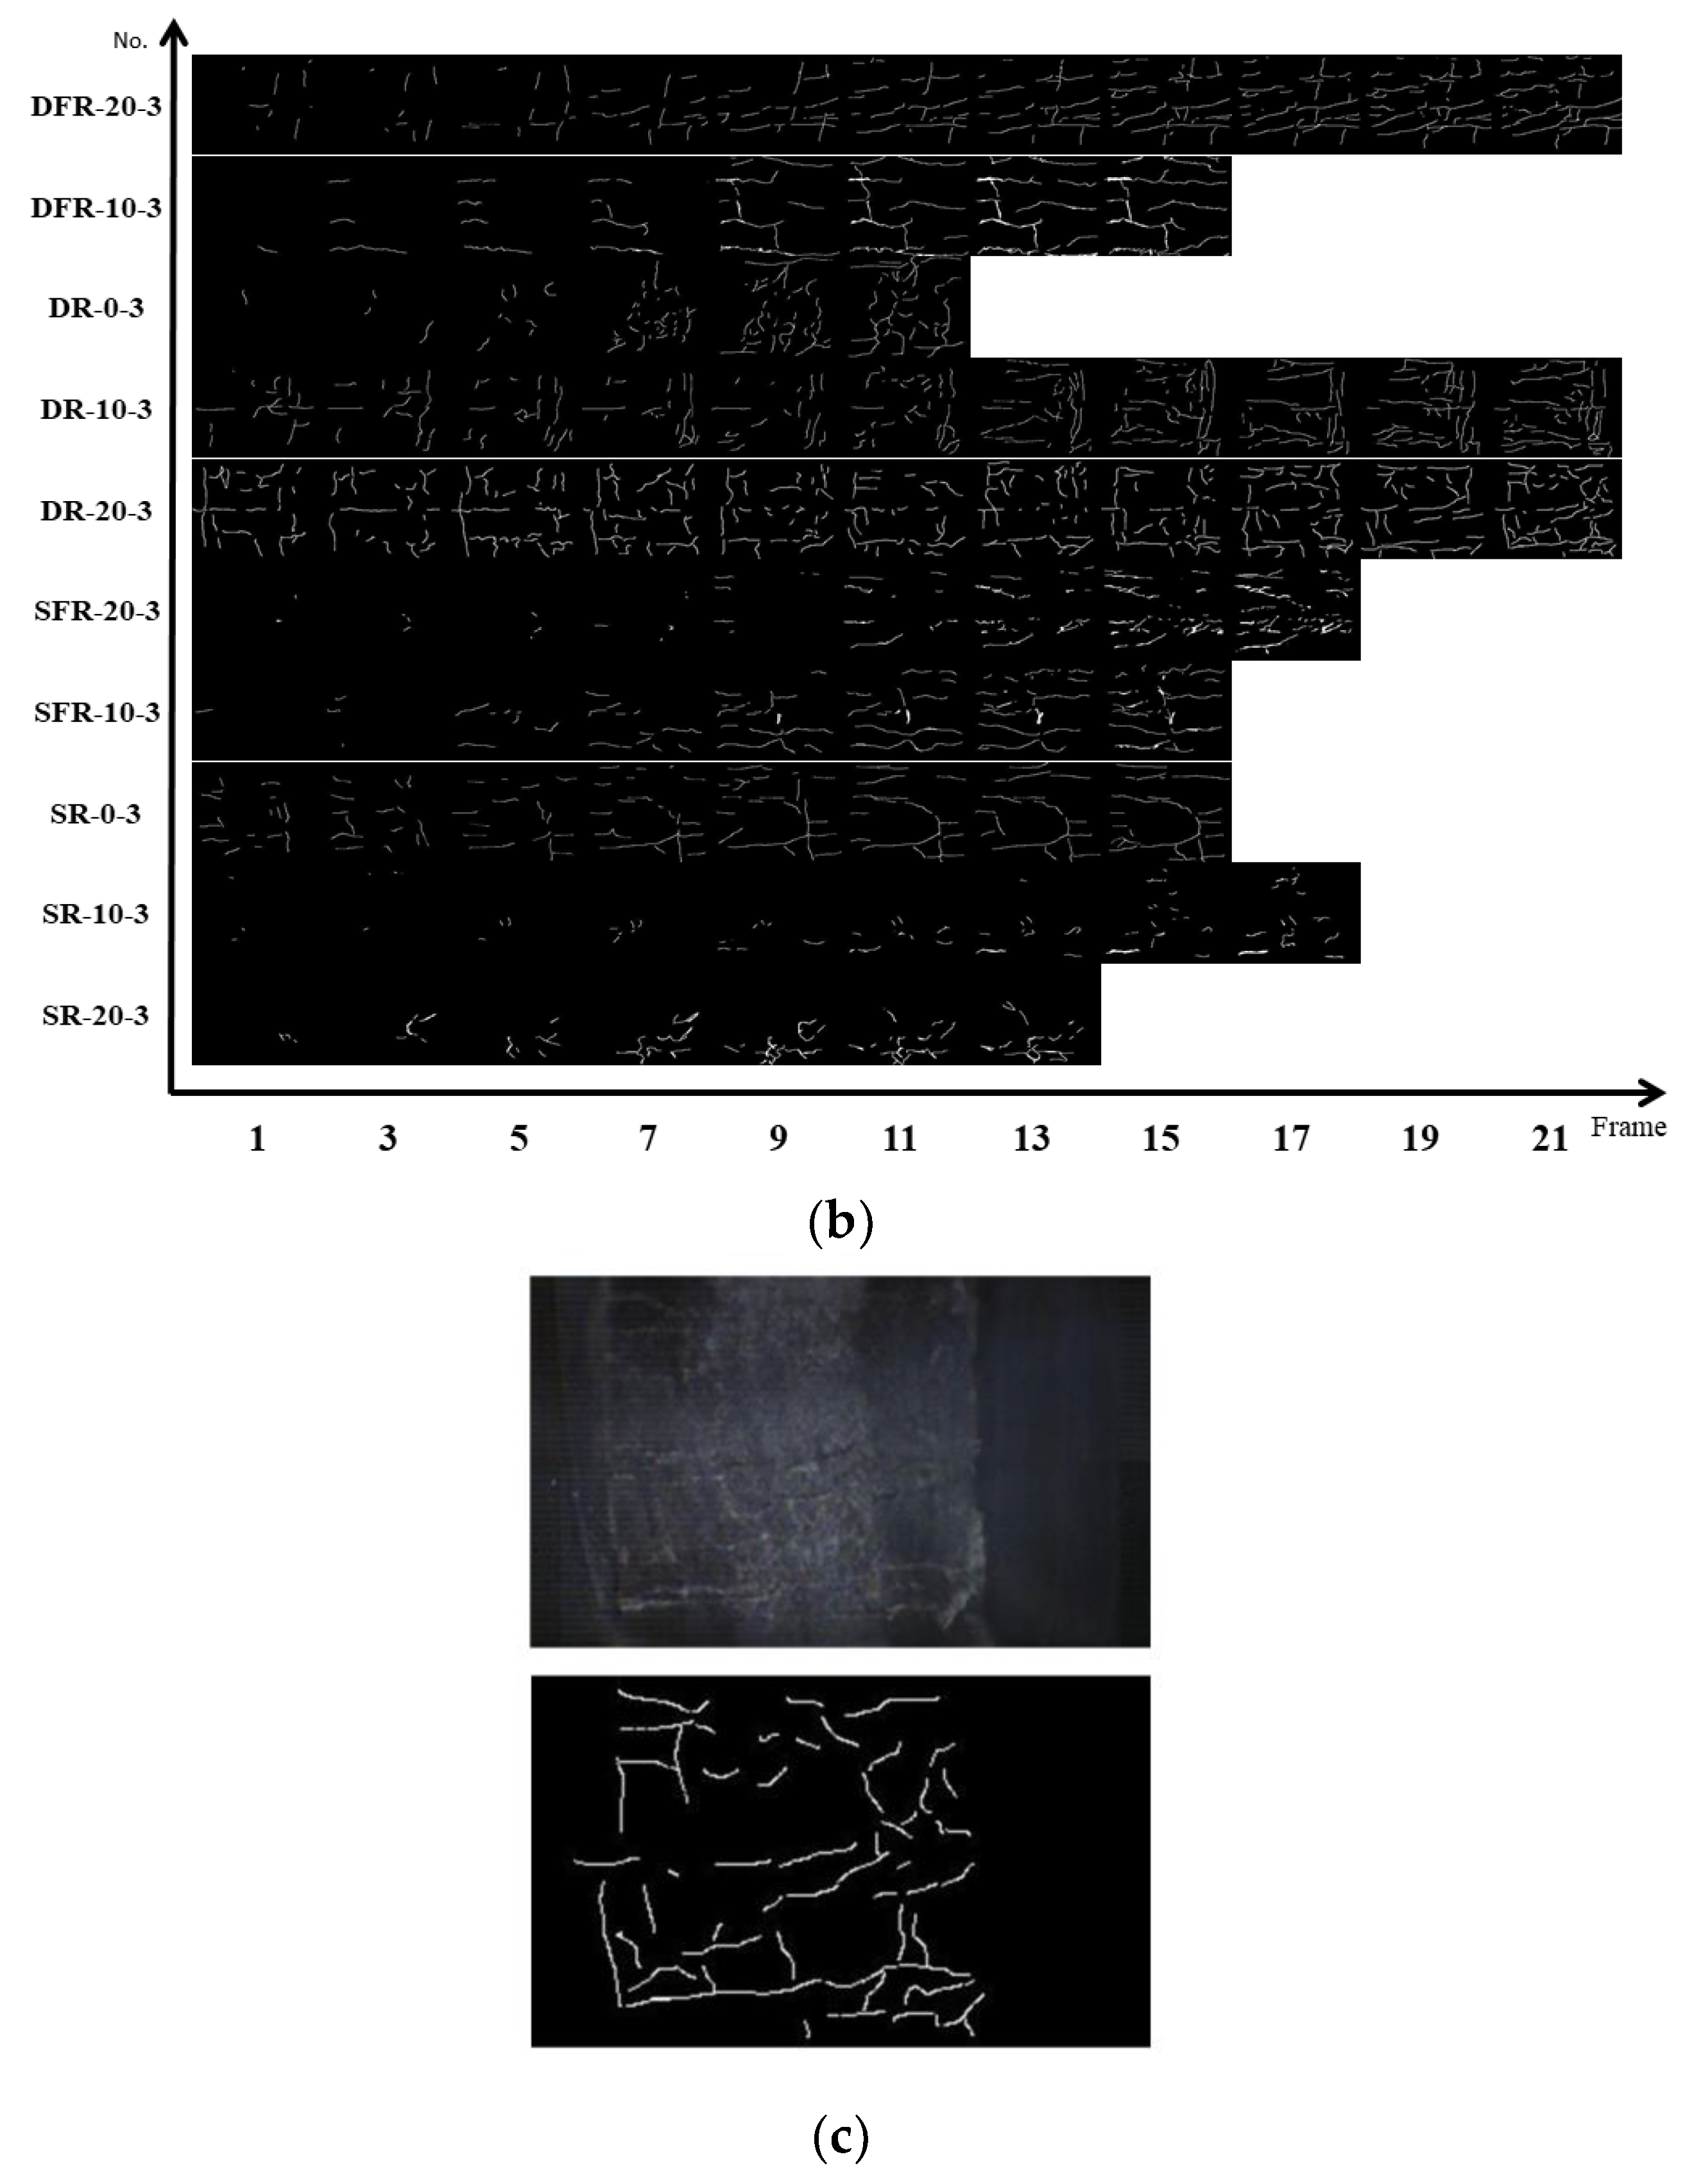
Currently, several methods can be used to study the damage process in impact dynamics, and the most popular method is high-speed (HS) photography to record the entire damage process, including fractal analysis [40,41] and deep learning [42,43]. However, in the analysis of the images, more scholars tend to analyse them qualitatively but fail to quantify them. Because the generation of the cracks in the image is very complex, the extraction of all cracks is difficult. Therefore, in this study, we used the Ratsnake annotation software [44] to extract the cracks from each original image during the fracture process. Rastnake can quickly segment the image with annotations and customise the annotation. RGB images captured using the HS camera were converted to black-and-white binarised images; this improved the resolution and accuracy [45]. Due to space limitations, in this paper, raw rock samples at different temperatures and saturations were selected as examples, and deformation was generated during the destruction process until fragments were ejected during the camera recording. The shooting frequency of the high-speed camera was 100,000 frames/s, and each set of data was intercepted every 1 μs. The final damage image and the crack extension process are shown in Figure 12a,b. Figure 12c is last frame of the results extracted from the original crack images and Ratsnake software. The dry rock at 20 °C (DR-20) is taken as an example; its impact velocity is 17.96 m/s. It can be seen that the sample has developed large cracks with debris ejection.

3.3.2. Crack Quantification and Box Dimension Calculation

Referring to the process shown in Figure 6, based on the binarised images identified from the cracks in the Ratsnake surface, the processed images were quantified using FracLac embedded in ImageJ to analyse the evolutionary pattern of each specimen from crack generation to rupture injection. The average values were found using linear regression and multiple calculations. Due to the low degree of failure of some rocks at a speed of 10 m/s, the screening results are not representative; a total of 40 groups of coal samples and 24 groups of rock samples were obtained after rounding off part of the data to obtain the dimensionality-change values. Due to space limitations, the partial curves of the dimensionality change of the coal and rock boxes were plotted, as shown in Figure 13.
Figure 13a shows the distribution of box dimensions for different saturation and impact velocities, all at a temperature of −10 °C. The following can be observed from this figure: (1) For the individual curves, an overall trend from a rapid increase in the initial phase to a slow increase and then to localised oscillations in the later phase is shown. The increase is due to the entire process being characterised by an increase in stresses on the coal or rock body over time and a continuous increase in damage. The oscillations can be caused by the transient closure of the internal fissures due to the compression of the internal fissures after the impact on the coal or rock body. (2) For the coal simples at an impact velocity speed of 6 m/s, the dimension of the dried sample is higher than that in the saturated state, with a faster end time. This indicates that the number of cracks and the damage degree of the sample in the dry state are greater than those in the saturated state. (3) Under the same saturation conditions, comparing the crack evolution characteristics under different impact velocities, with an increase in the impact velocity, the value of the box dimension increases, but the duration is shortened. This shows that the change in velocity can cause a large change in surface cracks and presents a positive correlation. A faster impact velocity correlates to a faster damage process, a faster evolution of the cracks, and an earlier ejection of the number of coal and rock breakers.
Figure 13b shows the evolution pattern of the box dimension of the surface cracks of the rock samples under different saturation and velocity conditions at 0 °C. Figure 13b exhibits a similar pattern to Figure 13a: it is shown that, under different speed and saturation conditions, the box dimension shows the typical characteristics of fast in the early stage, slow in the late stage, and an oscillating increase. In addition, the box dimension as a whole increases with the decrease in saturation and increases with the increase in speed.
Notably, on the one hand, the overall holding time of the rock is shorter than that of the coal sample; on the other hand, the final value of the box dimension is smaller than that of the original coal. This reflects several factors: (1) By the nature of the material, the rock is somewhat more brittle, more resistant to deformation, and less destructive at the time of destruction. (2) Rocky materials have a high rebound energy. For raw coal, the vast majority of the energy from the incident rod is absorbed by the sample and used to increase its surface energy. In the case of rock, the energy passes through and reaches the transmissive rod quickly, and a large portion of the energy is converted into the ejection energy of the fragments.
Correspondingly, Figure 13c reflects the change trend of the surface crack box dimension of coal samples under the same velocity gradient (6 m/s) and different temperature conditions; here, the curves still show the change characteristics of overall increase and local oscillation. In addition, Figure 13c also reflects the effect of temperature on the crack evolution. Specifically, the amplitude follows this trend: 20 °C > −10 °C > 10 °C > 0 °C > −20 °C, and the slope shows the opposite trend. A comparison with the longitudinal wave speed in Figure 7 in the previous section shows that the magnitude of the box dimension number shows a significant negative correlation with the average wave speed value. This occurs because a higher wave speed correlates to a higher degree of densification of the sample, indicating that the sample is more resistant to damage.
Figure 13d shows the effect of temperature on the box dimension number of cracks on the surface of the rock samples under the condition of the same impact velocity (18 m/s) and the same saturation (100%). As shown in the figure, the amplitude and the growth rate follow these trends: −10 °C > 20 °C > −20 °C > 10 °C > 0 °C, and 20 °C > −20 °C > −10 °C > 10 °C > 0 °C, respectively. Compared with Figure 13c, the amplitude of the box dimension still shows the characteristic of a negative correlation with the value of the mean wave velocity. The difference is that the rock holding time is short because the shock velocity in Figure 13d is much larger than that in Figure 13c. However, the overall box dimension of the rock samples is still lower than that of the coal samples, indicating that for the box dimension, the effect of velocity (external loading) is much greater than that of temperature (physical influence of the medium).
Notably, the box dimension characterisation method used in this study has a somewhat defective nature. (1) The original cracks are manually marked using Ratsnake. The filling of cracks and the ejection criteria of fragments of samples have certain subjective factors. (2) The sample is a three-dimensional body, and the photo taken is a plane plan. The cracks in the curved part of the sample may have an angle with the analysis plane, resulting in errors. (3) In the shooting process, HS technology can only detect the evolution process of surface cracks and cannot fully reflect the change in internal cracks. Based on this, we selected sample sieves with different apertures to fully screen the impacted coal and rock crushed blocks and discusses the impact damage from another perspective.

3.4. Fractal Characteristics of Crushing Products

To better analyse the result after sample destruction, and referring to the relevant standards [32], the sample sieves with 9.50 mm, 4.75 mm, 2.36 mm, 1.18 mm, 0.60 mm, 0.30 mm, 0.15 mm, 0.075 mm, and eight grades were combined in the order of largest to smallest. The coal and rock after SHPB impact damage were sieved on site. A high-precision balance was used to weigh the broken pieces of coal and rock for each rank. The statistical results are summarised in Table 3 and Table 4.
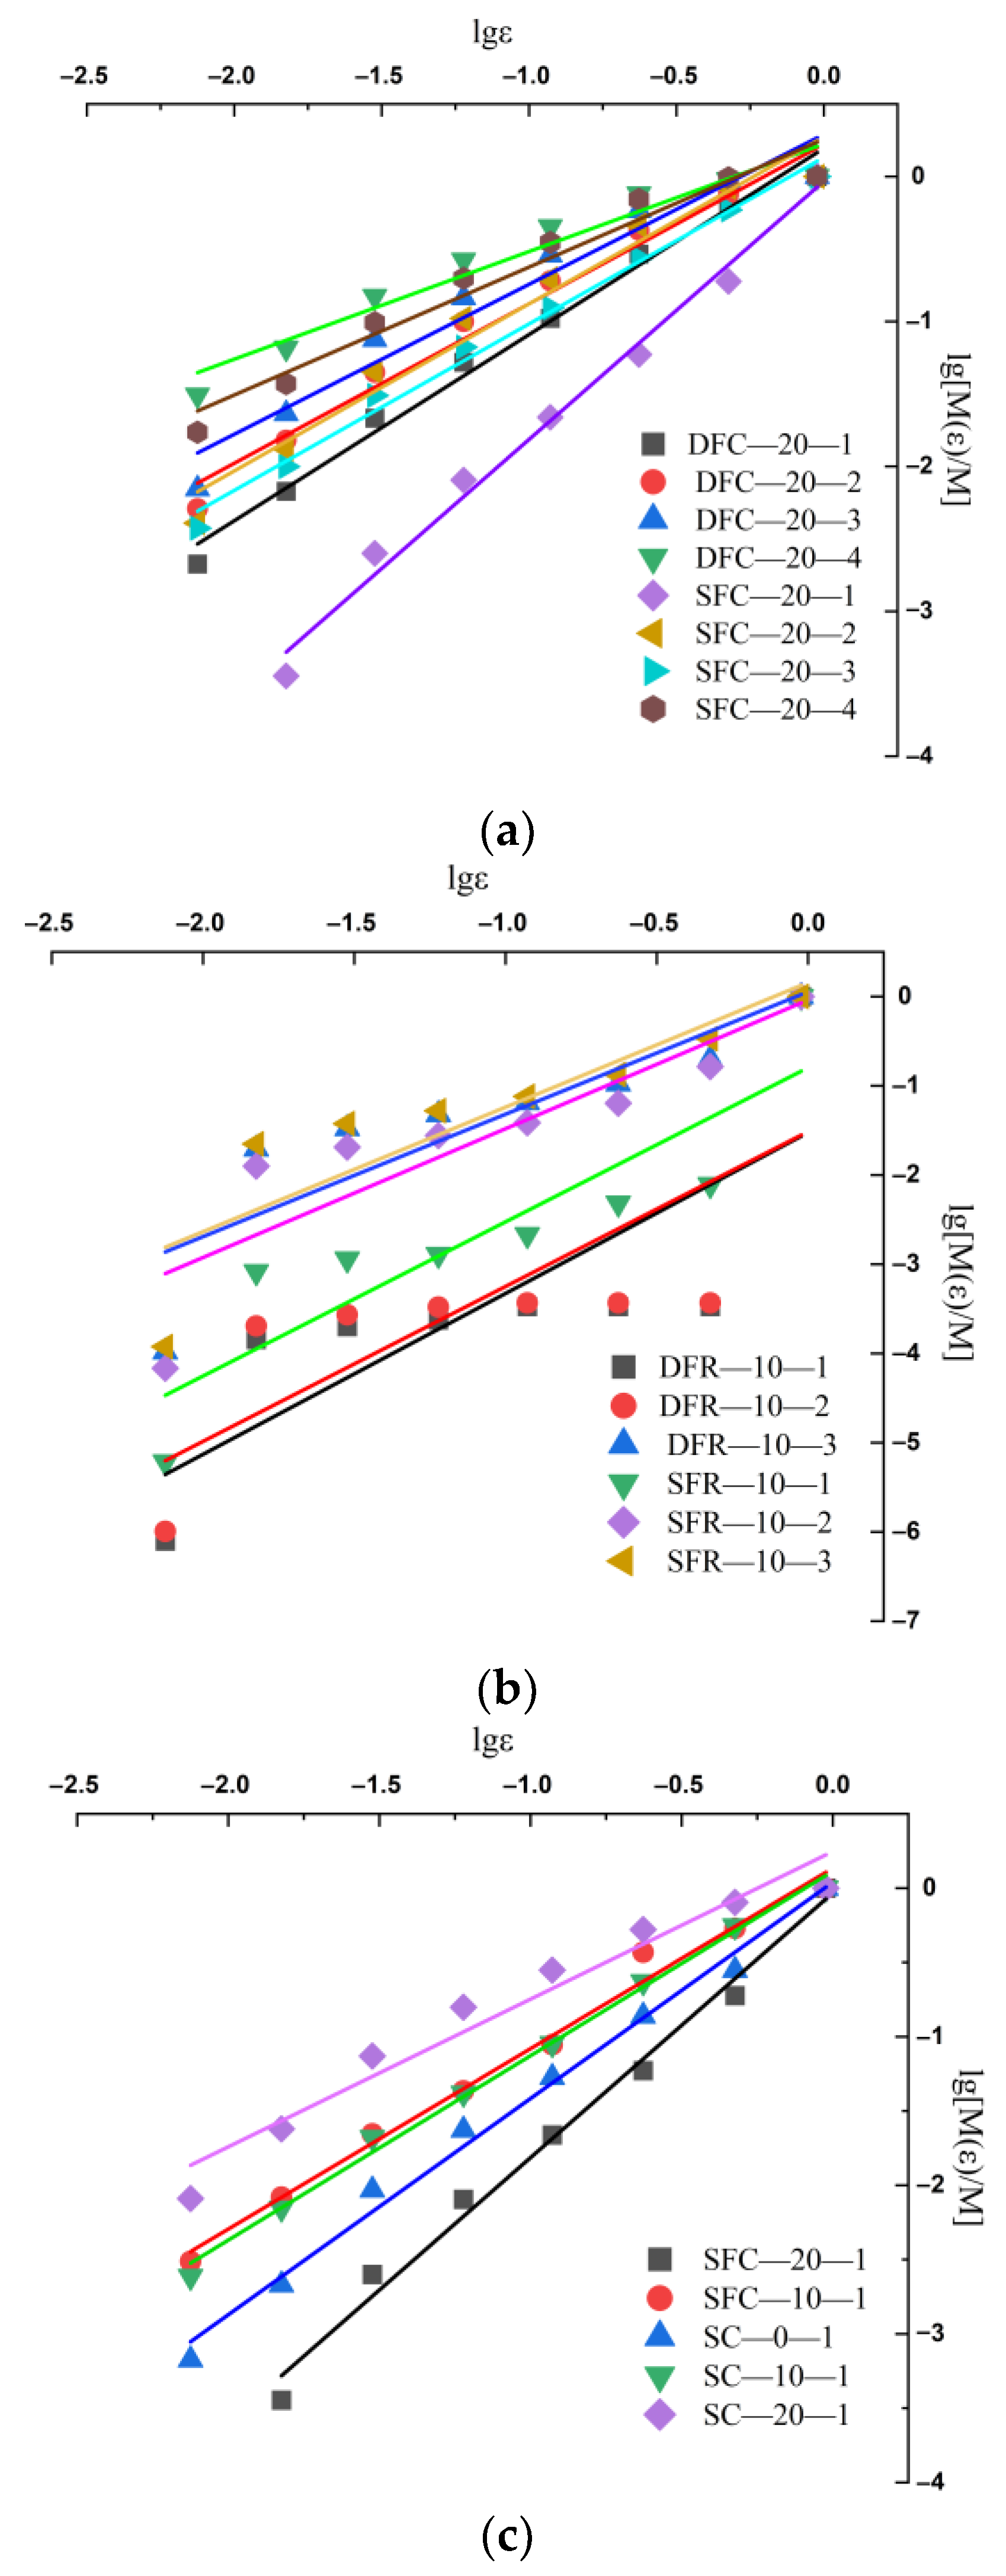
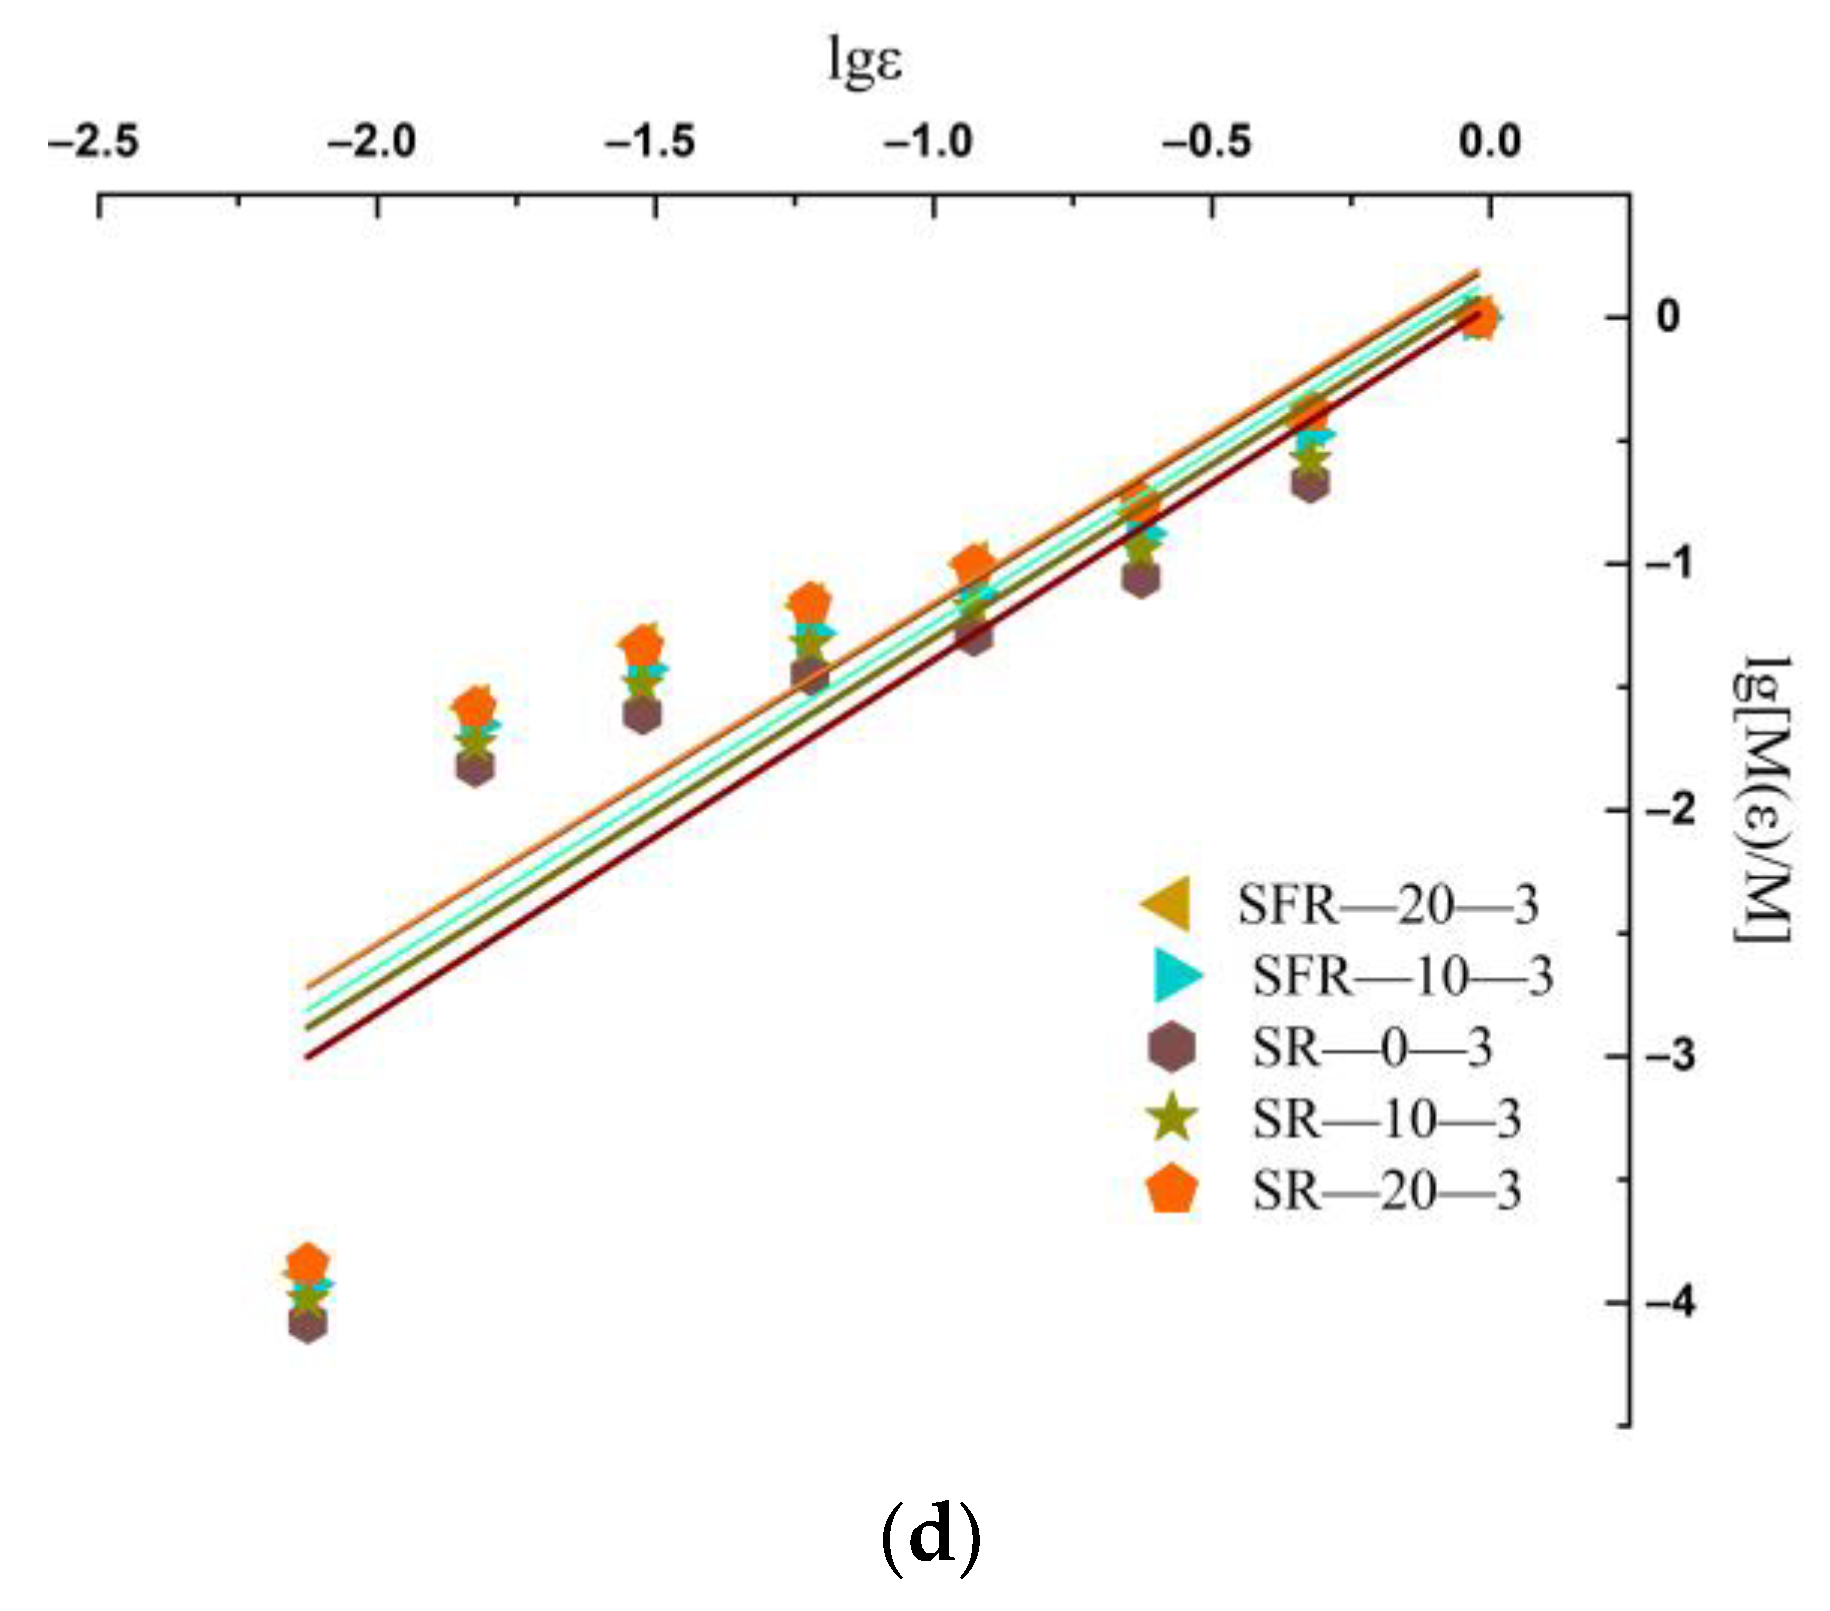
Notably, some of these values were discarded because most of the rock samples did not undergo significant damage at an impact of 10 m/s and were not of screening significance. Referring to Equation (7), a double logarithmic expression for the impacted samples was established and regression analyses were performed. The results are shown in Figure 14. Combining Table 3 and Table 4 shows that there is a good logarithmic correlation between the cumulative mass percentage of the sub-screen particle size and the sample sieve diameter. The correlation coefficient was very high, which indicated that the post-crushing lump size distribution of this coal and rock samples were self-similar to a fractal distribution. The fractal dimension fluctuates between 1.29 and 2.26.
Figure 14a shows the mass fractal dimension of coal at the same temperature (−20 °C) and different saturation and velocity conditions. From the figure, the following can be observed: (1) Under the same saturation conditions, with increasing impact velocity, the slope of the fitted curve of the raw coal sample gradually decreases and the value of the mass dimension gradually increases. This result indicates that with increasing velocity, the degree of sample devastation increases and the degree of fragmentation rises. (2) At an impact velocity of 6 m/s, the fitted slope of the dry state is lower than that of the saturated state, which indicates that the mass dimension number in the saturated state is lower than that in the dry state. The crushing volume is larger in the saturated state.
Figure 14b shows the mass fractal dimension of the rocks at the same temperature (−10 °C) under different saturation and velocity conditions. Figure 14b exhibits a similar pattern to Figure 14a, where both velocity and saturation have a similar effect on the coal and rock samples. However, the slopes of the raw rock samples are higher than those of the raw coal samples, indicating that at the inflection point of −10 °C, the rock is still more brittle than the raw coal.
Figure 14c shows the mass fractal dimension of coal under the same saturation and velocity (6 m/s) and different temperature conditions; from this, the slopes follow the following trend: −20 °C > 0 °C > 10 °C > −10 °C > 20 °C. Comparison with the longitudinal wave speed shows that the magnitude of the wave speed is inversely proportional to the slope. The wave speed reflects the denseness of the material, and the slope is negatively correlated with the mass dimension number; thus, the lower the wave speed, the smaller the slope of the mass dimension regression curve and the larger the mass size number.
Figure 14d shows the mass fractal dimension of the rock for the same saturation and velocity (18 m/s) and different temperature conditions. The pattern is similar to that of the raw coal, and both show that the temperature can cause some changes in the samples. The slopes follow this trend: 0 °C < 10 °C < 20 °C < −20 °C < −10 °C. The difference is that (1) At the same saturation and temperature, the slope of the maximum velocity of the original rock is higher than the slope of the minimum velocity of the original coal. This result shows that the degree of dynamic compressive resistance of the rock is evidently much higher than that of the raw coal. The energy absorption of the rock is greater than that of raw coal. The rock sample has stronger resistance to deformation. (2) At different temperatures, the change in the original rock is not as sensitive as that of the original coal. The slope change is minimal. This result shows that the rock is less affected by temperature than the original coal. Under the influence of the temperature and velocity, the mass dimension of rock is dominated by the influence of velocity.
Overall, the slope of the fitted curves decreases with increasing impact velocity and decreasing saturation. Raw coal and raw rock were also affected to varying degrees at different temperatures. The two inflection points at −10 and 0 °C are the most pronounced. The decrease in the slope of the fit and, correspondingly, the increase in the fractal dimension indicate an increase in the degree of fragmentation of the coal or rock mass and a smaller volume. By observing the collected sample fragmentation and quantifying the fractal dimension D, it can be concluded and mutually corroborated by the waveform plots in Figure 14 that coal bodies are more brittle and rocks are somewhat more plastic.

4. Discussion

To better analyse the effects of temperature and saturation on the dynamic mechanics of coal and rock, the changes that occur within the coal and rock samples were analysed through micro-mechanisms.

4.1. Mechanism of Water Action on Cracking Microcosm

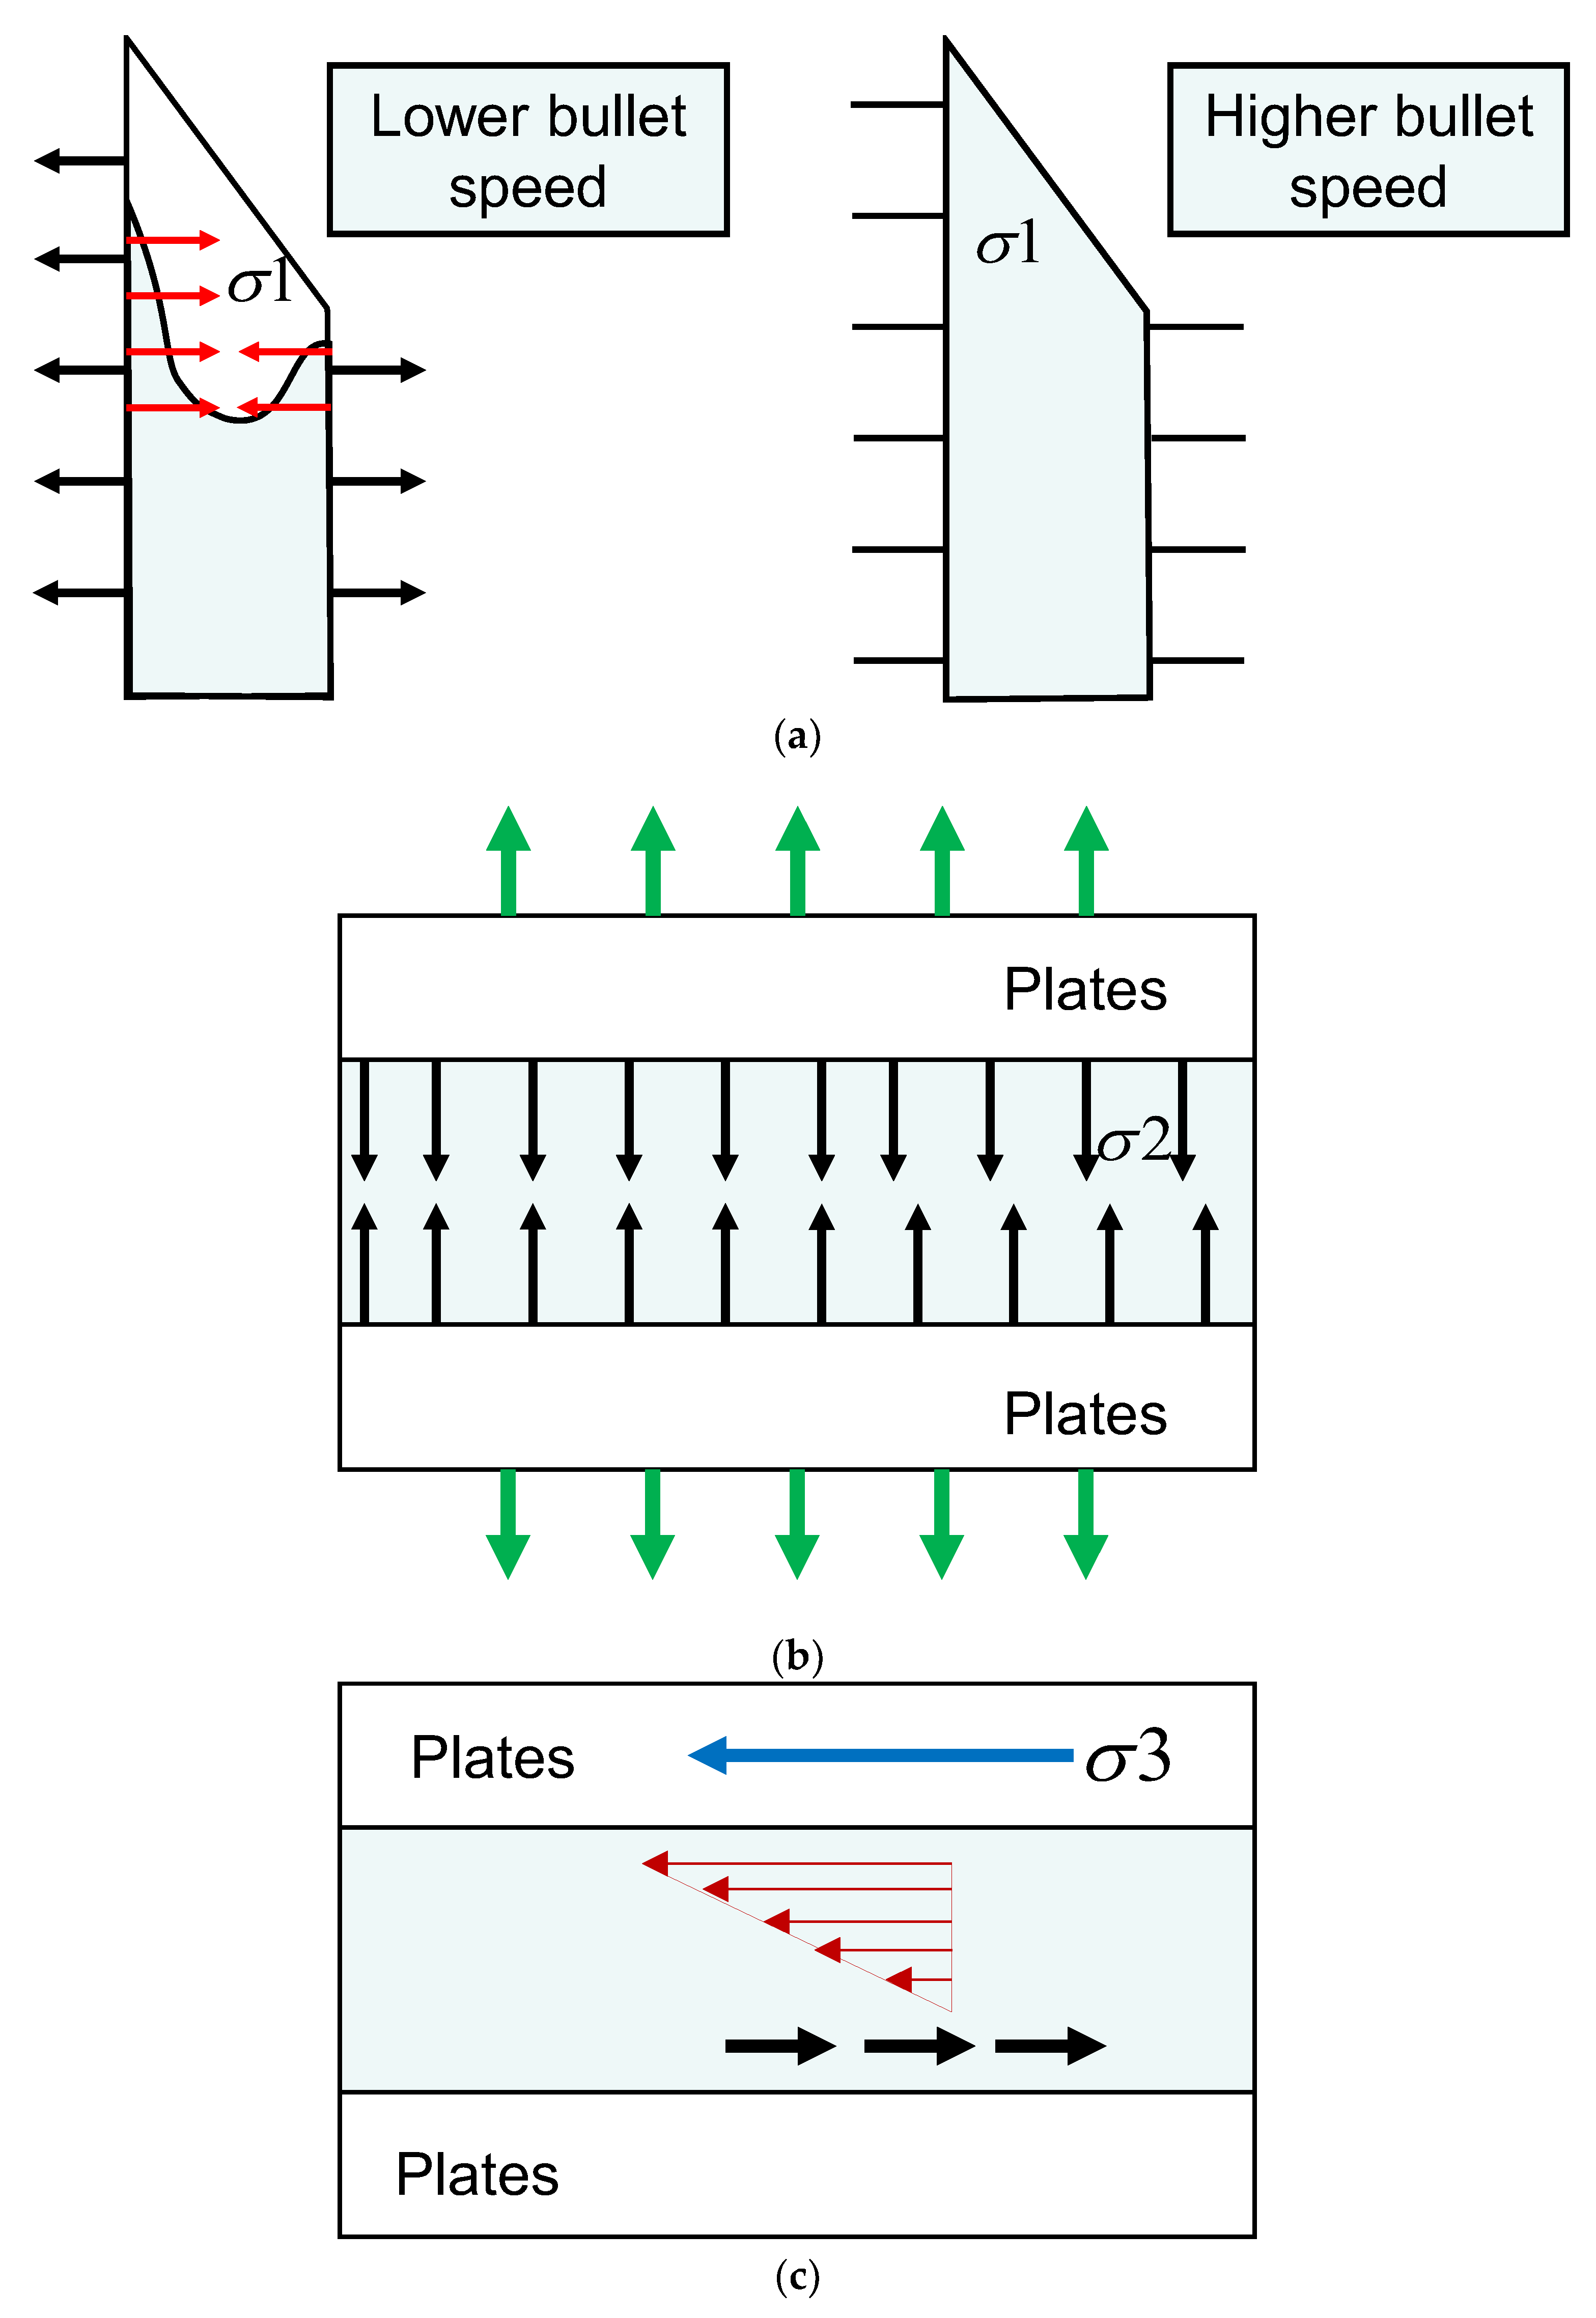
In the dry state, the cracks inside the coal or rock body are all in the form of air. When the coal and rock samples reach the water-saturated state, the cracks and crevices of the coal and rock samples are filled with free water. The cracks in the coal or rock body are mostly open (type I) cracks. The presence of free water in coal and rock has a decelerating effect on the high-speed crack expansion [25]. Figure 15 shows the different mechanical analyses of the internal cracks suffered by the coal and rock bodies under different velocities. There are three main factors for the presence of water in the dynamic impact.
(1) σ1 is the curved-moon-face effect, which can be shown as a curve created by the surface of a liquid close to the surface of the coal or rock and produced by surface tension.
During rapid loading, the free water in the crack does not easily reach the tip of the crack due to the faster crack extension; additionally, the presence of surface forces on the curved-moon face of the free water is equivalent to acting as a beneficial tensile force on the crack face, whose presence hinders the crack extension. This effect has been extensively studied in rock mechanics and plays an important role in the understanding of rock stress and deformation in practical engineering and geological settings.
(2) σ2 is the Stefan effect, which is the presence of free water in the fractures of the coal or rock body. A certain amount of viscous flow leads to hydrostatic pressure. When a change in the volume of free water occurs, it causes a change in the hydrostatic pressure of the water between the cracks, subsequently causing the flow of viscous fluid and the creation of resistance to the movement of the cracks. The manifestation of the Stenfan effect depends on the rate of change in the water content, the rate of change in temperature, and the physical properties of the material.
(3) σ3 is the Newtonian internal friction effect, the interaction caused by the parallel relative motion of the water molecules when the internal particles of coal or rock undergo displacement changes due to impact.

4.2. Mechanism of Temperature Effect on the Crack Microcosm

The influence of temperature on coal and rock bodies is mainly in two aspects: (1) As the temperature decreases, the volume of the coal or rock body gradually decreases, the internal cracks shrink or close, and the internal matrix of the coal or rock shrinks; this process leads to its densification. (2) At temperatures above 0 °C, the internal particles of the coal or rock and the water combine with each other, thus promoting the agglomeration of the coal or rock particles and increasing the overall bonding force of the coal or rock. Below 0 °C, the water molecules inside the saturated coal or rock are converted from liquid water to solid ice, the water–ice phase transition leads to micro-cracks in the coal and rock, and the primary cracks develop further; this is considered the freezing and expansion force. Solid ice occupies the liquid space, which in turn increases its strength.
The two are positively and negatively correlated but coexist to provide the strength of the coal or rock body. The influence degree of the two on the coal or rock is also inconsistent at different temperatures. They validate each other in the wave velocity curve in Figure 7. Therefore, the freezing contraction that enhances the strength of the coal or rock body should satisfy two conditions: a certain degree of saturation and high freezing temperature. As long as the coal or rock body reaches a certain degree of saturation, the coal or rock body below the freezing point will be frozen with the reduction in the freezing temperature, and the coal samples that have been frozen will be further frozen with a continuous reduction in the temperature; this is called the “freezing and expansion of the saturated coal samples critical temperature”. If the relationship between the two is balanced, the safety factor is greatly improved when excavating.

5. Conclusions

In this study, coal and rock are taken as research objects; water, temperature, and dynamic load are taken as variables; and multifractal technology is used to analyse the failure trends of coal and rock. The following conclusions are drawn:
(1) The dynamic mechanical properties of coal and rock samples under the SHPB impact process are affected by their own physical properties, temperature, saturation degree, and impact velocity under joint action. When measuring the longitudinal wave velocity, the rock samples (2.24–2.61 km/s) have lower wave velocities than the coal samples (1.68–2.01 km/s). With decreasing temperature, both the coal and rock samples show a trend of initially increasing and then decreasing, with an “N”-shaped pattern. Comparing the samples in the dry state and saturated state, the wave velocities of the coal and rock samples in the saturated state are higher than those of the coal and rock samples in the dry state.
(2) The peak stress–temperature curve and stress–strain curve are plotted after noise reduction of the stress curve. The higher density of the specimen at the same impact velocity correlates to a faster propagation of the stress wave. With the increase in impact velocity, the strain intensification gradually becomes evident. Under the influence of speed and temperature, the influence factor of speed is greater.
(3) In the dynamic impact damage process of the coal and rock, the box dimension has evident self-similarity. The quantitative description of the cracks in the box dimension of the coal and rock specimens shows an overall increase and local oscillation; additionally, the dimension number of the dry samples is higher than that of the saturated condition under the same impact velocity with a fast end time. In the same saturated condition, the value of the box dimension increases with increasing impact velocity without shortening the duration. Comparing coal and rock, the holding time of the whole rock is shorter than that of the coal sample, and the final value of the box dimension number is smaller than that of the original coal.
(4) After sieving the impacted coal and rock samples and calculating the mass dimension number, a linear positive logarithmic correlation is observed between the cumulative mass percentage of the sub-screen grain size and the sample sieve diameter. The correlation coefficient is large and indicates that the post-crushing mass distribution of the coal and rock samples is self-similar to a fractal distribution. The fractal dimension fluctuates between 1.29 and 2.26. The slope of the fitted curve decreases with increasing impact velocity and decreasing saturation. Raw coal and raw rock are also affected to different degrees by different temperatures.
(5) Through microscopic analyses, it can be concluded that when the inside of the coal or rock is filled with a large number of water molecules, the decrease in temperature will cause the internal coal or rock matrix to contract, thus increasing its densification, and when the water freezes into ice, due to its ice uplift force, it results in expansion and deformation of the inside of the coal or rock. The two influence each other and the dominant factors are different at different temperatures.
It should be noted that this paper has initially explored the damage characteristics of coal and rock bodies with temperature, water, and dynamic loading and its influencing factors using SHPB; however, further exploration, such as triaxial impact experiments under variable temperatures, freeze–thaw cyclic impact experiments, the main influencing factors subjected to the freezing method when drilling wells and tunnelling, etc., still need to be studied more deeply.

Author Contributions

Conceptualisation, X.S.; Methodology, K.L.; Software, S.L.; Validation, S.Y.; Writing—review and editing, J.X.; Writing—original draft, T.J. All authors have read and agreed to the published version of the manuscript.

Funding

This research is supported by the Fundamental Research Program of Shanxi Province (202103021224277), by the Scientific and Technological Innovation Programs of Higher Education Institutions in Shanxi (2021L334), and by the Taiyuan University of Science and Technology Scientific Research Initial Funding (20222028).

Institutional Review Board Statement

Not applicable.

Informed Consent Statement

Not applicable.

Data Availability Statement

The data used to support the findings of this study are available from the corresponding author upon request. The data are not publicly available due to privacy.

Conflicts of Interest

The authors declare that they have no conflict of interest regarding the publication of this study.

References

  1. Zhao, Y.; Liu, Q.; Lin, H.; Wang, Y.; Tang, W.; Liao, J.; Wang, X. A review of hydromechanical coupling tests, theoretical and numerical analyses in rock materials. Water 2023, 15, 2309. [Google Scholar] [CrossRef]
  2. Wang, Y.; Yang, Y.; Zhang, Y.; Wang, J. Dynamic mechanical properties of coals subject to the low temperature-impact load coupling effect. Sci. Rep. 2019, 9, 20218. [Google Scholar] [CrossRef] [PubMed]
  3. Zhang, C.; Yu, Y.; Li, W.; Lu, Q. Study on temperature field evolution and frozen wall closure judgment criteria of inclined shaft under inclined holes freezing condition. Geofluids 2022, 2022, 8002667. [Google Scholar] [CrossRef]
  4. Paul, J.; Sengupta, M. Computer aided blasting-round design in an arctic coal mine. Int. J. Min. Sci. Technol. 1987, 5, 299–308. [Google Scholar] [CrossRef]
  5. Chang, Z.; Zhang, W.; Zhao, G.; Dong, F.; Geng, X. Aging Stability Analysis of Slope Considering Cumulative Effect of Freeze–Thaw Damage—A Case Study. Minerals 2022, 12, 598. [Google Scholar] [CrossRef]
  6. Li, H. Study on construction technology for tunnelling in the Plateau permafrost region. In Cold Regions Engineering. Cold Regions Impacts on Research, Design, and Construction; American Society Civil Engineers: Reston, VA, USA, 2009; pp. 16–21. [Google Scholar]
  7. Fan, L.; Fan, Y.; Xi, Y.; Gao, J. Spatial failure mode analysis of frozen sandstone under uniaxial compression based on CT technology. Rock Mech. Rock Eng. 2022, 55, 4123–4138. [Google Scholar] [CrossRef]
  8. Kodama, J.; Goto, T.; Fujii, Y.; Hagan, P. The effects of water content, temperature and loading rate on strength and failure process of frozen rocks. Int. J. Rock Mech. Min. 2013, 62, 1–13. [Google Scholar] [CrossRef]
  9. Sun, X.; Liu, B.; Dong, Q.; Shi, F. Experimental investigation on damage characteristics and early warning of frozen coal under uniaxial compression. Adv. Mater. Sci. Eng. 2023, 2023, 1607529. [Google Scholar] [CrossRef]
  10. Wang, T.; Sun, Q.; Jia, H.; Ren, J.; Luo, T. Linking the mechanical properties of frozen sandstone to phase composition of pore water measured by LF-NMR at subzero temperatures. Bull. Eng. Geol. Environ. 2021, 80, 4501–4513. [Google Scholar] [CrossRef]
  11. Wang, L.; Wu, Z.; Liu, Q. Dynamic mechanical properties of dry and water-saturated siltstones under sub-zero temperatures. Rock Mech. Rock Eng. 2020, 53, 4381–4401. [Google Scholar] [CrossRef]
  12. Yang, Y.; Zhang, N.; Wang, J. Fracture morphology analysis of frozen red sandstone under impact. Shock Vib. 2021, 2021, 4388132. [Google Scholar] [CrossRef]
  13. Xu, J.; Pu, H.; Sha, Z. Dynamic mechanical behavior of the frozen red sandstone under coupling of saturation and impact loading. Appl. Sci. 2022, 12, 7767. [Google Scholar] [CrossRef]
  14. Yang, R.; Fang, S.; Li, W.; Yang, Y.; Yue, Z. Experimental study on the dynamic properties of three types of rock at negative temperature. Geotech. Geol. Eng. 2019, 37, 455–464. [Google Scholar] [CrossRef]
  15. Shan, R.; Song, Y.; Song, L.; Bai, Y. Dynamic property tests of frozen red sandstone using a split hopkinson pressure bar. Earthq. Eng. Eng. Vib. 2019, 18, 511–519. [Google Scholar]
  16. Zhao, Y.; Liu, Q.; Zhang, C.; Liao, J.; Lin, H.; Wang, Y. Coupled seepage-damage effect in fractured rock masses: Model development and a case study. Int. J. Rock Mech. Min. 2021, 144, 104822. [Google Scholar] [CrossRef]
  17. Zhao, Y.; Wang, Y.; Wang, W.; Tang, L.; Liu, Q.; Cheng, G. Modeling of rheological fracture behavior of rock cracks subjected to hydraulic pressure and far field stresses. Theor. Appl. Fract. Mech. 2019, 101, 59–66. [Google Scholar] [CrossRef]
  18. Yu, G.; Vozoff, K.; Durney, D. Effects of confining pressure and water saturation on ultrasonic compressional wave velocities in coals. Int. J. Rock Mech. Min. 1991, 28, 28–36. [Google Scholar] [CrossRef]
  19. Liu, J.; Liu, D.; Cai, Y.; Gan, Q.; Yao, Y. Effects of water saturation on P-wave propagation in fractured coals: An experimental perspective. J. Appl. Geophys. 2017, 144, 94–103. [Google Scholar] [CrossRef]
  20. Zhao, E. Dynamic Characteristics and Damage Mechanism of Coal and Rock under Dynamic-Static Load and Temperature Coupling Effects; China University of Mining and Technology: Beijing, China, 2023. [Google Scholar]
  21. Wang, J.; Yang, Y.; Guo, Y. Low temperature effect of saturated granite on dynamic characteristics at high strain rates. Rock Soil Mech. 2017, 38 (Suppl. S2), 163–169. [Google Scholar]
  22. Wang, Z.; Tang, Y.; Li, M. Development and application of overburden structure composed of caving arch and towering roof beam in deep lonawall panel with thin bedrock. Chin. Coal J. 2023, 48, 563–575. [Google Scholar]
  23. Yang, S.; Wu, S.; Wang, Z. Surface subsidence and its prediction method of mining deep-buried seam with thick alluvial layer and thin bedrock. Chin. Coal J. 2023, 48, 523–537. [Google Scholar]
  24. Chen, Y.; Kang, T.; Wu, C. Study on mechanical behavior and mechanism of sandstone under the coupling effect of water content and dynamic load. Processes 2023, 11, 2318. [Google Scholar] [CrossRef]
  25. Kuruppu, M.D.; Obara, Y.; Ayatollahi, M.R. ISRM-suggested method for determining the mode I static fracture toughness using semi-circular bend specimen. Rock Mech. Rock Eng. 2014, 47, 267–274. [Google Scholar] [CrossRef]
  26. Zhou, Y.; Xia, K.; Li, X.; Li, H.; Ma, G.; Zhao, J. Suggested methods for determining the dynamic strength parameters and mode-i fracture toughness of rock materials. Int. J. Rock Mech. Min. Sci. 2012, 49, 105–112. [Google Scholar] [CrossRef]
  27. GB/T 23561.5-2009; National Standard Compilation Groups of People′s Republic of China. Methods for Determining the Physical and Mechanical Properties of Coal and Rock. Standards Press of China: Beijing, China, 2009.
  28. Sun, X.; Chen, G.; Li, J.; Xu, X.; Fu, S.; Xie, J.; Liang, L. Propagation characteristics of ultrasonic P-wave velocity in artificial jointed coal briquettes. J. Geophys. Eng. 2020, 5, 827–837. [Google Scholar] [CrossRef]
  29. Xie, B.; Chen, M.; Chen, S.; Luan, Z.; Li, X.; Liang, T. Experimental study on dynamic impact failure mechanical properties of ice samples. Chin. J. Disaster Prev. Mitig. Eng. 2023, 1–8. [Google Scholar] [CrossRef]
  30. Deshpande, V.; Chakraborty, P.; Chakraborty, T.; Tiwari, V. Application of copper as a pulse shaper in SHPB tests on brittle materials-experimental study, constitutive parameters identification, and numerical simulations. Mech. Mater. 2022, 171, 104336. [Google Scholar] [CrossRef]
  31. Feng, D.; Peng, Y.; Liu, Y. Study on SHPB technique. Chin. Prog. Geophys. 2006, 273–278. [Google Scholar]
  32. Sun, X.; Jin, T.; Li, J.; Xie, J.; Li, C.; Li, X. Dynamic characteristics and crack evolution laws of coal and rock under split Hopkinson pressure bar impact loading. Meas. Sci. Technol. E. 2023, 34, 075601. [Google Scholar] [CrossRef]
  33. Chen, W.; Bo, S. Split Hopkinson (Kolsky) Bar: Design, Testing and Applications; Springer Science & Business Media: Berlin/Heidelberg, Germany, 2010. [Google Scholar]
  34. Mandelbrot, B.B. The Fractal Geometry of Nature; WH Freeman: New York, NY, USA, 1982; Volume 1. [Google Scholar]
  35. ASTM D 2845; ASTM Committee D-18 on Soil and Rock. Standard Test Method for Laboratory Determination of Pulse Velocities and Ultrasonic Elastic Constants of Rock. ASTM International: West Conshohocken, PA, USA, 2008.
  36. Zhao, Y.; Zhang, C.; Wang, Y.; Lin, H. Shear-related roughness classification and strength model of natural rock joint based on fuzzy comprehensive evaluation. Int. J. Rock Mech. Min. Sci. 2021, 137, 104550. [Google Scholar] [CrossRef]
  37. Zhao, Y.; Liu, J.; Zhang, C.; Zhang, H.; Liao, J.; Zhu, S.; Zhang, L. Mechanical behavior of sandstone during post-peak cyclic loading and unloading under hydromechanical coupling. Int. J. Rock Mech. Min. Sci. 2023, 33, 927–947. [Google Scholar] [CrossRef]
  38. Li, Y.; Chang, X.; Dou, K. Research of ice mechanical properties parameters based on ultrasonic wave. China Meas. Test 2019, 45, 36–40. [Google Scholar]
  39. Sun, X.; He, Y.; Jin, T.; Xie, J.; Li, C.; Pang, J. Microseismic signal characteristics of the coal failure process under weak-energy and low-frequency disturbance. Sustainability 2023, 15, 14387. [Google Scholar] [CrossRef]
  40. Iakovidis, D.K. Ratsnake: A versatile image annotation tool with application to computer-aided diagnosis. Sci. World J. 2014, 2014, 286856. [Google Scholar] [CrossRef]
  41. Li, Y.; Zhao, Y.; Jiang, Y.; Zhang, B.; Song, H.; Liu, B. Characteristics of pore and fracture of coal with bursting proneness based on DIC and fractal theory. Energies 2020, 13, 5404. [Google Scholar] [CrossRef]
  42. Yang, R.; Li, Y.; Zeng, D.; Guo, P. Deep DIC: Deep learning-based digital image correlation for end-to-end displacement and strain measurement. J. Mater. Process Tech. 2022, 302, 117474. [Google Scholar] [CrossRef]
  43. Gerdes, L.; Berger, S.; Saelzer, J.; Franck, P.; Helwing, R.; Zabel, A.; Walther, F. Application-Oriented Digital Image Correlation for the High-Speed Deformation and Fracture Analysis of AISI 1045 and Ti6Al4V Materials. Appl. Mech. 2022, 3, 1190–1205. [Google Scholar] [CrossRef]
  44. Ai, D.; Zhao, Y.; Wang, Q.; Li, C. Experimental and numerical investigation of crack propagation and dynamic properties of rock in shpb indirect tension test. Int. Impact Eng. 2019, 126, 135–146. [Google Scholar] [CrossRef]
  45. Wu, N.; Fu, J.; Xiong, C. Studying the characteristics of chaos and fractals of construction rocks under different loading velocities. Materials 2022, 15, 7890. [Google Scholar] [CrossRef]
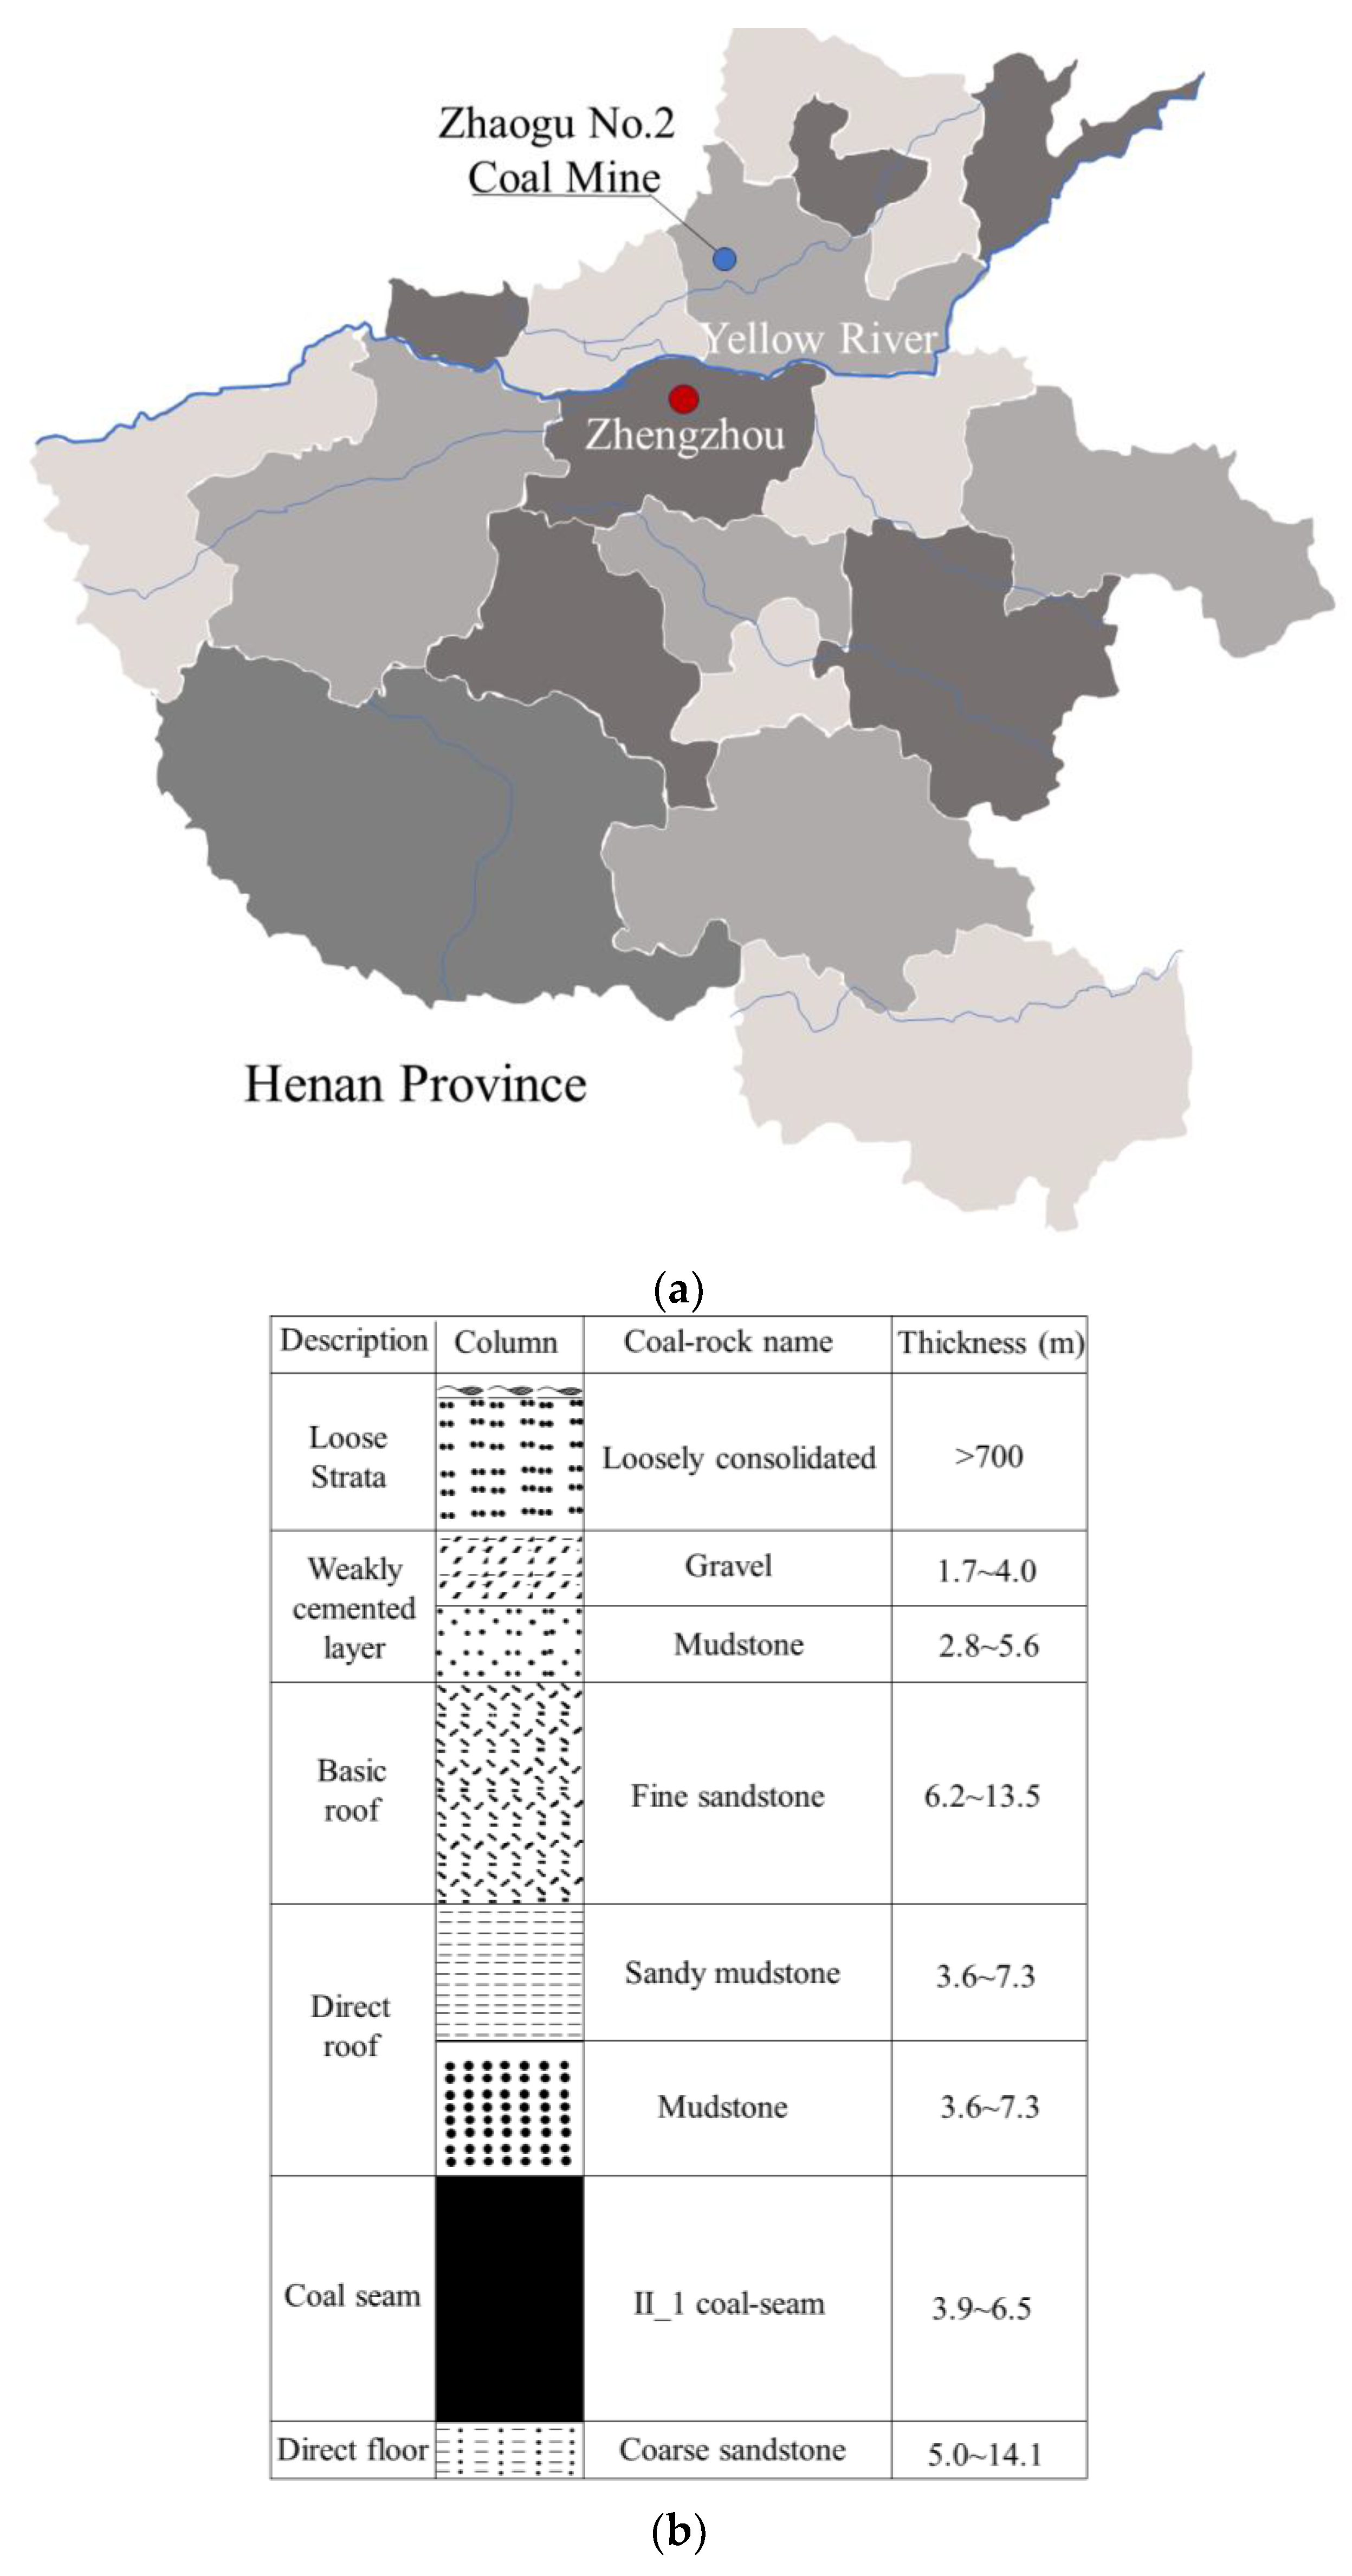
Figure 1. Schematic diagram of coal and rock sampling: (a) location of the Zhaogu No. 2 Coal Mine; (b) stratigraphic logging records.
Applsci 13 13004 g001
Figure 2. An illustration of coal and rock specimens used in the experiment. (a) Coal specimens; (b) rock specimens.
Applsci 13 13004 g002
Figure 3. Experimental system diagram. (a) Schematic diagram; (b) physical diagram.
Applsci 13 13004 g003
Figure 4. Testing equipment. (a) Electric blast drying oven; (b) natural saturated container; (c) constant-temperature test chamber; and (d) wave velocity measuring instrument.
Applsci 13 13004 g004
Figure 5. Experimental process flowchart.
Applsci 13 13004 g005
Figure 6. Calculation flow chart of box dimension [32].
Applsci 13 13004 g006
Figure 7. Wave velocity profiles of dry and saturated coal and rock samples at different temperatures.
Applsci 13 13004 g007
Figure 8. Typical dynamic stress equilibrium checks in dynamic compression tests. (Int: incident wave, Re: reflected wave, and Tra: transmitted wave).
Applsci 13 13004 g008
Figure 9. Denoised stress-wave signals at different impact velocities. (a) Incident-reflected waves of coal at −10 °C; (b) transmitted waves of coal at −10 °C; (c) incident-reflected waves of rock at −10 °C; and (d) transmitted waves of rock at −10 °C.
Applsci 13 13004 g009aApplsci 13 13004 g009b
Figure 10. Dynamic mechanical characteristic curve of coal and rock impact. (a) 18 m/s for coal; (b) 18 m/s or rock.
Applsci 13 13004 g010
Figure 11. Variation of peak intensity of water-saturated coal and rock with temperature. (a) Coal; (b) rock.
Applsci 13 13004 g011
Figure 12. The whole process of image destruction. (a) Original crack images; (b) Ratsnake software extraction results; and (c) last frame with comparison and Ratsnake results with image.
Applsci 13 13004 g012aApplsci 13 13004 g012b
Figure 13. Box dimension evolutions of cracks in coal and rock specimens. (a) Different saturation levels and impact speeds for coal samples; (b) different saturation levels and impact speeds for rock samples; (c) different temperatures for coal samples; and (d) different temperatures for rock samples.
Applsci 13 13004 g013
Figure 14. Statistical graphics of cumulative particle size distribution. (a) Different saturation levels and impact speeds for coal samples; (b) different saturation levels and impact speeds for rock samples; (c) different temperatures for coal samples; and (d) different temperatures for rock samples.
Applsci 13 13004 g014aApplsci 13 13004 g014b
Figure 15. Mechanistic study of strength effect in sandstone at different impact velocities. (a) Curved-moon-face effect; (b) Stefan effect; and (c) Newtonian internal friction effect.
Applsci 13 13004 g015
Table 1. Test results of coal samples.
Temperature /°CSample IDSize (Diameter ×
Height)/mm
Density
ρ(g/cm3)
Initial Wave SpeedDrying Wave VelocitySaturation Wave SpeedP Wave Velocity v(km/s)Average Wave Velocity
v(km/s)
Uniaxial Compressive Strength
(MPa)
Elastic Modulus Etan (GPa)Poisson’s Ratio
μ
Impact Speed
v(m/s)
Experimental Result
−20DFC-20-150 × 501.531.851.742.121.966.16 impact smash
DFC-20-250 × 501.541.791.642.129.31 impact smash
DFC-20-350 × 501.571.741.462.0415.29 impact smash
DFC-20-450 × 501.481.411.361.5618.00 impact smash
DFC-20-550 × 100 14.402.510.35
SFC-20-150 × 501.451.551.521.561.642.016.17 impact smash
SFC-20-250 × 501.451.521.601.882.339.54 impact smash
SFC-20-350 × 501.821.511.401.51.8114.68 impact smash
SFC-20-450 × 501.642.031.641.932.2718.07 impact smash
SFC-20-550 × 100 18.242.740.33
−10DFC-10-150 × 501.541.701.561.81.686.15 impact smash
DFC-10-250 × 501.581.671.331.729.43 impact smash
DFC-10-350 × 501.451.641.561.6714.48 impact smash
DFC-10-450 × 501.481.371.361.5217.96 impact smash
SFC-10-150 × 501.601.511.201.481.91.756.35 impact smash
SFC-10-250 × 501.451.491.451.641.6710.26 impact smash
SFC-10-350 × 501.621.461.421.511.7214.08 impact smash
SFC-10-450 × 501.591.481.321.461.718.07 impact smash
0DC-0-150 × 501.621.631.381.691.746.38 impact smash
DC-0-250 × 501.641.621.421.689.74 impact smash
DC-0-350 × 501.611.591.491.7914.55 impact smash
DC-0-450 × 501.451.771.681.8018.24 impact smash
DC-0-550 × 100 24.783.750.3
SC-0-150 × 501.461.441.281.441.901.996.03 impact smash
SC-0-250 × 501.611.901.621.862.199.30 impact smash
SC-0-350 × 501.451.381.541.861.9814.26 impact smash
SC-0-450 × 501.541.71.281.61.8817.92 impact smash
SC-0-550 × 100 28.203.980.29 impact smash
10DC-10-150 × 501.671.591.541.781.735.55 impact smash
DC-10-250 × 501.481.581.391.679.54 impact smash
DC-10-350 × 501.491.581.441.7715.51 impact smash
DC-10-450 × 501.431.811.601.6917.96 impact smash
SC-10-150 × 501.591.381.321.691.711.875.99 impact smash
SC-10-250 × 501.661.331.491.701.959.47 impact smash
SC-10-350 × 501.621.331.641.791.8815.18 impact smash
SC-10-450 × 501.421.021.141.511.9217.92 impact smash
20DC-20-150 × 501.551.561.481.591.686.07 impact smash
DC-20-250 × 501.601.561.541.719.80 impact smash
DC-20-350 × 501.461.551.441.6212.79 impact smash
DC-20-450 × 501.521.811.611.7917.86 impact smash
DC-20-550 × 100 16.373.210.33
SC-20-150 × 501.361.331.271.301.421.696.15 impact smash
SC-20-250 × 501.501.331.351.861.979.12 impact smash
SC-20-350 × 501.471.311.471.541.6814.40 impact smash
SC-20-450 × 50 1.871.551.891.6717.37 impact smash
SC-20-550 × 100 20.023.970.31
Table 2. Test results of rock sample.
Temperature /°CSample IDSize (Diameter ×
Height)/mm
Density
ρ(g/cm3)
Initial Wave SpeedDrying Wave VelocitySaturation Wave SpeedP Wave Velocity v(km/s)Average Wave Velocity
v(km/s)
Uniaxial Compressive Strength
(MPa)
Elastic Modulus Etan (GPa)Poisson’s Ratio
μ
Impact Speed
v(m/s)
Experimental Result
−20DFR-20-150 × 502.762.362.112.372.389.70 impact fracture
DFR-20-250 × 502.742.362.122.3514.74 impact smash
DFR-20-350 × 502.732.242.142.4118.95 impact smash
DFR-20-450 × 100 31.688.370.26 impact smash
SFR-20-150 × 502.752.162.122.262.482.4410.71 impact fracture
SFR-20-250 × 502.772.142.062.292.4614.80 impact smash
SFR-20-350 × 502.712.142.092.212.3818.13 impact smash
SFR-20-450 × 10020.558.590.24 impact smash
−10DFR-10-150 × 502.732.222.052.212.2410.21 impact fracture
DFR-10-250 × 502.752.222.112.2514.07 impact fracture
DFR-10-350 × 502.702.222.142.2717.21 impact smash
SFR-10-150 × 502.712.122.102.322.32.3310.20 impact smash
SFR-10-250 × 502.732.121.902.242.3514.20 impact smash
SFR-10-350 × 502.672.121.822.292.3417.80 impact smash
0DR-0-150 × 502.672.212.112.422.409.38 impact fracture
DR-0-250 × 502.712.212.032.4014.02 impact smash
DR-0-350 × 502.712.192.132.3817.30 impact smash
DR-0-450 × 100 39.368.640.23 impact smash
SR-0-150 × 502.702.101.982.302.602.619.12 impact smash
SR-0-250 × 502.672.102.082.242.6414.02 impact smash
SR-0-350 × 502.672.101.952.172.6017.81 impact smash
SR-0-450 × 100 20.838.820.21 impact smash
10DR-10-150 × 502.742.192.042.502.3710.61 impact fracture
DR-10-250 × 502.662.192.102.2813.80 impact smash
DR-10-350 × 502.732.191.902.3217.87 impact smash
SR-10-150 × 502.702.081.852.192.402.519.69 impact smash
SR-10-250 × 502.732.081.772.202.6013.91 impact smash
SR-10-350 × 502.752.081.912.312.5210.30 impact smash
20DR-20-150 × 502.702.191.962.292.3410.39 impact fracture
DR-20-250 × 502.752.182.022.3415.80 impact smash
DR-20-350 × 502.722.171.982.3817.96 impact smash
DR-20-450 × 10038.508.720.25 impact smash
SR-20-150 × 502.722.082.072.382.432.439.92 impact fracture
SR-20-250 × 502.712.072.022.412.4414.76 impact smash
SR-20-350 × 502.692.071.952.342.4118.32 impact smash
SR-20-450 × 10023.198.750.23 impact smash
Table 3. Calculation results of the mass dimension of coal.
Sample No.Impact Speed
(m/s)
Cumulative Mass Percent of Each Particle Size Under the Sieve/%Fitting ResultsFractal Dimension
0.0750.150.30.61.182.364.759.5Fitting SlopeIntercept DistanceDecision Factor
(R2 Value)
DFC-20-16.16 0.21 0.67 2.15 5.23 10.49 29.17 65.95 100.00 1.28 0.190.99 1.72
DFC-20-29.31 0.51 1.52 4.44 9.97 19.03 42.49 75.10 100.00 1.10 0.220.99 1.90
DFC-20-315.29 0.70 2.31 7.49 14.54 28.62 58.06 92.60 100.00 1.03 0.290.95 1.97
DFC-20-418.00 3.10 6.54 14.89 26.42 45.02 75.91 95.11 100.00 0.74 0.220.95 2.26
SFC-20-16.17 0.00 0.04 0.25 0.80 2.18 5.91 18.88 100.00 1.78 −0.010.99 1.22
SFC-20-29.54 0.41 1.32 4.50 10.48 19.60 46.08 84.13 100.00 1.15 0.080.97 1.85
SFC-20-314.68 0.37 1.00 3.08 6.65 12.41 27.17 58.75 100.00 1.15 0.070.99 1.85
SFC-20-418.07 1.72 3.71 9.83 19.84 35.06 69.46 97.71 100.00 0.88 0.210.96 2.12
DFC-10-16.15 0.05 0.23 0.82 1.94 3.96 9.63 28.76 100.00 1.47 0.180.99 1.53
DFC-10-29.43 0.28 0.73 2.05 4.47 8.48 20.71 52.05 100.00 1.21 0.201.00 1.79
DFC-10-314.48 0.84 1.81 4.49 8.97 15.93 29.82 50.91 100.00 0.97 0.110.99 2.03
DFC-10-417.96 3.04 6.46 14.82 25.14 43.04 71.13 91.55 100.00 0.74 0.260.95 2.26
SFC-10-16.35 0.42 0.94 2.33 4.43 8.93 37.02 53.82 100.00 1.17 −0.010.99 1.83
SFC-10-210.26 0.39 0.93 2.34 4.71 9.29 23.54 60.56 100.00 1.16 0.171.00 1.84
SFC-10-314.08 0.90 2.41 6.38 11.72 22.28 50.18 84.28 100.00 0.99 0.170.98 2.01
SFC-10-417.69 1.88 4.30 11.05 19.55 33.77 55.64 82.94 100.00 0.83 0.230.96 2.17
DC-0-16.38 0.48 1.08 3.02 6.55 13.33 36.50 74.99 100.00 1.15 −0.050.99 1.85
DC-0-29.74 0.55 1.35 4.11 9.22 17.81 38.89 73.21 100.00 1.10 0.120.98 1.90
DC-0-314.55 0.81 1.84 4.56 8.75 15.33 33.39 64.75 100.00 1.00 0.140.99 2.00
DC-0-418.24 2.28 4.93 12.65 25.34 42.90 75.82 96.59 100.00 0.81 0.170.94 2.19
SC-0-16.03 0.07 0.21 0.93 2.35 5.32 13.77 27.94 100.00 1.46 −0.030.99 1.54
SC-0-29.30 0.53 1.31 3.56 6.84 13.79 29.97 64.21 100.00 1.09 0.270.99 1.91
SC-0-314.26 1.98 4.16 10.28 20.03 33.90 64.08 95.43 100.00 0.85 0.130.96 2.15
SC-0-417.92 1.48 3.15 7.79 15.37 27.23 54.01 89.19 100.00 0.91 0.260.98 2.09
DC-10-15.55 0.18 0.47 1.38 2.77 5.69 15.02 38.49 100.00 1.28 0.111.00 1.72
DC-10-29.54 0.69 1.63 4.54 8.95 18.16 39.68 70.26 100.00 1.05 0.090.99 1.95
DC-10-315.51 1.12 2.72 6.50 11.61 22.10 45.45 80.37 100.00 0.94 0.210.98 2.06
DC-10-418.32 1.71 3.81 9.77 18.75 37.00 65.68 84.80 100.00 0.87 0.190.96 2.13
SC-10-15.99 0.32 0.78 2.17 4.23 9.05 23.44 55.65 100.00 1.20 0.041.00 1.80
SC-10-29.47 0.81 1.95 5.35 11.53 20.77 43.81 75.21 100.00 1.01 0.130.98 1.99
SC-10-315.18 1.22 2.77 6.83 11.64 20.86 40.67 76.00 100.00 0.92 0.230.99 2.08
SC-10-417.93 1.33 2.83 6.53 12.17 20.45 42.24 70.68 100.00 0.99 0.210.90 2.01
DC-20-16.15 0.99 2.57 7.59 15.95 28.22 52.72 80.24 100.00 1.25 0.090.98 1.75
DC-20-29.80 1.50 3.67 8.79 15.71 23.85 40.37 68.05 100.00 0.84 0.190.98 2.16
DC-20-312.79 0.88 2.08 5.26 9.96 17.87 37.37 70.80 100.00 0.99 0.140.99 2.01
DC-20-417.86 2.24 4.49 10.34 17.84 31.53 56.07 83.96 100.00 0.81 0.130.98 2.19
SC-20-16.15 0.99 2.57 7.59 15.95 28.22 52.72 80.24 100.00 0.96 0.230.96 2.04
SC-20-29.12 0.83 1.94 5.27 10.97 20.42 45.56 79.36 100.00 1.02 0.200.98 1.98
SC-20-314.40 0.75 2.15 5.25 9.29 17.33 37.46 70.73 100.00 1.00 0.150.99 2.00
SC-20-417.37 1.25 2.61 6.32 11.78 19.37 38.71 74.77 100.00 0.99 0.130.92 2.01
Table 4. Calculation results of the mass dimension of rock.
Sample No.Impact Speed (m/s)Cumulative Mass Percent of Each Particle Size Under the Sieve/%Fitting ResultsFractal Dimension
0.0750.150.30.61.182.364.759.5Fitting SlopeIntercept DistanceDecision Factor (R2 Value)
DFR-20-19.70 0.00 0.03 0.07 0.14 0.23 0.41 0.61 100.00 1.52 −0.980.75 1.48
DFR-20-214.74 0.01 1.35 2.33 3.36 5.02 8.31 22.73 100.00 1.47 0.060.79 1.53
DFR-20-318.95 0.01 2.38 4.22 6.28 8.78 14.68 37.59 100.00 1.39 0.190.76 1.61
SFR-20-110.71 ------------------ ----
SFR-20-214.80 0.01 1.59 2.71 3.72 5.23 9.68 24.77 100.00 1.44 −1.530.78 1.56
SFR-20-318.13 0.01 2.61 4.69 6.76 9.97 16.18 36.63 100.00 1.38 −1.510.75 1.62
DFR-10-110.21 0.00 0.01 0.02 0.02 0.03 0.03 0.03 100.00 1.80 0.050.64 1.20
DFR-10-214.07 0.00 0.02 0.03 0.03 0.04 0.04 0.04 100.00 1.74 −0.490.62 1.26
DFR-10-317.21 0.01 1.95 3.30 4.75 6.47 10.46 19.87 100.00 1.37 −0.170.75 1.63
SFR-10-110.20 0.00 0.08 0.11 0.13 0.22 0.48 0.78 100.00 1.73 0.150.79 1.27
SFR-10-214.20 0.01 1.25 2.05 2.76 3.85 6.37 16.33 100.00 1.64 −0.410.79 1.36
SFR-10-317.80 0.01 2.23 3.76 5.24 7.58 13.31 33.56 100.00 1.40 0.170.77 1.60
DR-0-19.38 ------------------ ----
DR-0-214.02 0.01 1.36 2.16 2.97 4.07 6.31 19.06 100.00 1.71 −0.030.83 1.29
DR-0-317.30 0.01 2.38 4.06 5.92 8.38 15.24 30.00 100.00 1.46 0.150.78 1.54
SR-0-19.12 0.00 0.04 0.08 0.14 0.22 0.32 0.88 100.00 1.95 0.080.80 1.05
SR-0-214.02 0.01 1.20 1.99 2.78 3.63 6.21 18.15 100.00 1.46 0.200.78 1.54
SR-0-317.81 0.01 1.52 2.47 3.57 5.14 8.83 21.52 100.00 1.43 −0.800.78 1.57
DR-10-110.61 ------------------ ----
DR-10-213.80 0.00 0.23 0.39 0.58 0.82 1.33 3.41 100.00 1.68 0.160.80 1.32
DR-10-317.87 0.01 2.55 4.36 6.26 8.49 14.20 35.17 100.00 1.37 −0.700.76 1.63
SR-10-19.69 0.00 0.04 0.09 0.13 0.20 0.28 0.43 100.00 1.88 −0.020.76 1.12
SR-10-213.91 0.00 0.57 0.99 1.45 2.01 3.43 8.99 100.00 1.56 0.050.80 1.44
SR-10-310.30 0.01 1.87 3.24 4.72 6.65 11.43 26.42 100.00 1.41 0.77 1.59
DR-20-110.39 ------------------−0.83----
DR-20-215.80 0.00 0.32 0.59 0.88 1.38 2.50 9.73 100.00 1.42 −0.180.78 1.58
DR-20-317.96 0.01 1.65 3.07 4.68 6.97 12.68 28.54 100.00 1.37 0.110.76 1.63
SR-20-19.92 0.00 0.04 0.07 0.11 0.15 0.35 1.18 100.00 2.00 −0.670.83 1.00
SR-20-214.76 0.01 1.60 2.73 3.96 5.77 9.91 25.98 100.00 1.45 0.100.78 1.55
SR-20-318.32 0.01 2.59 4.60 6.89 9.81 17.59 41.69 100.00 1.38 0.230.76 1.62
Disclaimer/Publisher’s Note: The statements, opinions and data contained in all publications are solely those of the individual author(s) and contributor(s) and not of MDPI and/or the editor(s). MDPI and/or the editor(s) disclaim responsibility for any injury to people or property resulting from any ideas, methods, instructions or products referred to in the content.