Abstract
Urban spatial morphology reflects the processes of external urban expansion and the internal spatial structure of the human economy, and exploring urban spatial morphology is important for regional management of PM2.5 pollutants in the air environment. Whether urban spatial morphology can influence air pollution is a question that has been explored and evaluated. Therefore, we constructed a spatial-temporal driving mechanism framework and explored the interactions among urban expansion and PM2.5 pollutants in the “2 + 26” cities of Beijing-Tianjin-Hebei (BTH). Based on 2010, 2015, and 2020 urban expansion factors and PM2.5 pollutants data from the “2 + 26” cities of BTH, the results of the Geo-Detector medal imply that: (1) The spatial distribution characteristics of areas with high PM2.5 pollutants in the “2 + 26” cities of BTH were affected by the PM2.5 concentration value, and the high-value phenomenon appeared to decrease with the improvement of PM2.5 pollutants. (2) The level of urbanization in the “2 + 26” cities of BTH had been increasing annually, with the most significant growth in construction land area located in the northeastern coastal cities. (3) The compactness index, was the most critical influencing urban expansion factor, explaining 0.63, 0.64, and 0.66 of PM2.5 pollutants in 2010, 2015, and 2020. (4) In factorial interactions, the compactness index and the centrality ratio explained spatial and temporal analysis characteristics of PM2.5 pollutants, and the interaction factor enhanced the explanation for the spatial-temporal characteristics. This study reveals the coupled spatial-temporal driving mechanism of air pollution in the “2 + 26” cities of BTH and also shows that reasonable urban planning has a positive impact on the regional ecological environment in the future.
1. Introduction
Since the beginning of the 21st century, urban problems such as the expansion of urban construction land, the loss of agricultural resources, and the concentration of industrial areas have become increasingly serious. Rapidly increasing concentrations of atmospheric pollutants from human activities are leading to serious urban ecological environmental issues []. Globally, the majority of the population lives in urban agglomerations of middle or low-latitude plains and cities in coastal areas []. It is expected that by the middle of this century, more than 70% of the world’s cities will have completed the process of urbanizing their populations []. By the next century, the global urban population will increase 1.8 times globally []. Rapidly increasing amounts of atmospheric pollutants from human activities are leading to negative environmental effects on citizens’ health [,,]. Worldwide, more than one million people will be threatened with premature death due to air pollutants each year []. In addition to increasing the incidence of respiratory and cardiovascular diseases [], severe air pollutants can impede the rate of photosynthetic reactions and affect the normal growth of plants [,]. There is a global consensus that we must control the intensity of air pollution emissions []. Asian cities, which are the fastest-growing urban areas in the world, will face serious air pollution challenges.
PM2.5 refers to atmospheric suspended particulate matter with an aerodynamic particle size of less or equal to 2.5 μm, which characterizes a long suspension time and transmission distance []. Rapid urban socioeconomic development and dramatic development have led to more extensive human modification of the ecological environment. PM2.5 pollutant concentration values in cities are affected by the doubly by the impact of urbanization and industrialization []. Nevertheless, under the influence of similar natural and weather conditions, reducing regional energy emissions and decreasing traffic commuting would improve urban air quality []. Furthermore, the level of economic development within industrial cities leads to the phenomenon of PM2.5 pollution in urban agglomerations, while terrain elevation and wind speed affect air mobility and dispersion, which results in the formation of spatial heterogeneity characteristics []. A global multi-scale urban study showed that within Asia, China, and India are the countries where urban population change contributes to PM2.5 concentration changes []. Although a consensus has been reached regarding the impact of urbanization on PM2.5 pollutants [,], there is no conclusive evidence to quantify the relationship between urban expansion and PM2.5 pollutants.
More and more scholars are quantifying the process of urban expansion by exploring the characteristics of urban spatial morphology in terms of the external shape of the city and its internal socioeconomic structure []. For example, Bugess [] defined a circular spatial morphology with a core, a transition zone, and a distribution of residential and commuter zones in a future high-level city; Dempsey and Jenks [] pointed out that an intensive and compact urban spatial morphology would help improve transport and promote sustainable urban development; and Harris and Ullman [] argued that as a city develops, it develops from a single nucleus to multicore cities. The influence mechanism of urban spatial morphology on air pollutants includes three aspects: emission, purification, and diffusion []. The point (factor) and non-point (locomotives) sources can easily lead to air pollution in the radiation range []; urban forests and green areas have a closer relationship with pollutant purification, and the larger the proportion of green areas, the better the relationship for the improvement of air quality []; finally, the air quality of the compact urban spatial morphology is often better than that of the traditional urban spatial morphology []. Therefore, the urban spatial morphology index can be used to quantify the process of urban expansion and analyze the relationship between urban spatial morphology and PM2.5 pollutants based on the “source-sink” theory.
The “source-sink” theory involves the components of landscape components and landscape configurations in the subsurface of urban space []. The urban landscape component emphasizes the impact of land use types such as urban construction land, urban green space, and water columns on air pollutants through physical properties []. Landscape configurations emphasize the impact of landscape interactions on the atmospheric environment []. Under the “source-sink” theory, certain urban spatial landscape types, such as roads, building land, and urban socio-economic assemblages within the urban space, are applied to calculate the urban spatial morphology index []. Based on remote sensing to extract the urban construction land and the main urban area quantitatively described the urban centrality, outer network contour, and building density []. In the existing analyses of urban spatial morphology indices and air quality influencing factors, the urban spatial morphology indices constructed with the landscape of urban construction land are often affected by covariance, which interferes with the results of the research [,]. The Geo-Detector model is a model that quantifies causal relationships between impact factors by constructing spatial stratification and calculating within-stratum variance []. The Geo-Detector model has became an important statistical method in the field of ecology [,], which preserves the original input variables and greatly reducing covariance.
This study was conducted to investigate the sustained influence of urban spatial morphology characteristics on the spatial-temporal of PM2.5 pollutants in the “2 + 26” cities of BTH. The recommended and concentration values of PM2.5 pollutants were analyzed by statistical analysis and visualized in ArcGIS 10.2. The land-use-change status was determined, and the urban expansion factor included urban spatial morphology and urban meteorological data. With the assistance of the Geo-Detector model, comprehensive descriptions of the contribution and influence of the important driving factors of spatial-temporal characteristics of urban expansion factors and PM2.5 pollutants are summarized. Our study would provide recommendations about urban development and governance that inform the building of green and sustainable cities.
2. Materials and Methods
2.1. Study Area
Asia is one of the fastest-growing regions for urban agglomerations worldwide, with more than 800 cities with populations greater than 100,000, and China is one of the most attractive Asian countries for urban development []. The “2 + 26” cities of BTH comprise one of the fastest-growing urban agglomerations in China []. The “2 + 26” cities of BTH border the Bohai Sea between Liaoning and Shandong, with a geographical range of 34°16′′ N to 41°36′ and 111°30′ to 119°50′ (Figure 1). The “2 + 26” cities of BTH have a strong economy, and their total GDP ranks among the top city clusters in the country. In 2019, the “2 + 26” cities of BTH’s total GDP exceeded CNY 14 trillion, accounting for about 14.3 percent of the country’s total. The “2 + 26” cities of BTH are not only economically powerful but also an important center of urbanization and regional development in China []. The “2 + 26” cities of BTH are located along the Taihang Mountains as an air pollution transmission corridor. Cities such as Shijiazhuang, Taiyuan, and Anyang are densely populated, comprising industrial interest areas. The enhancement of the emission factor of civil heating in the “2 + 26” cities of BTH will lead to the rapid accumulation of urban emissions in the winter. Therefore, the “2 + 26” cities of BTH are an area in urgent need of air pollution control.
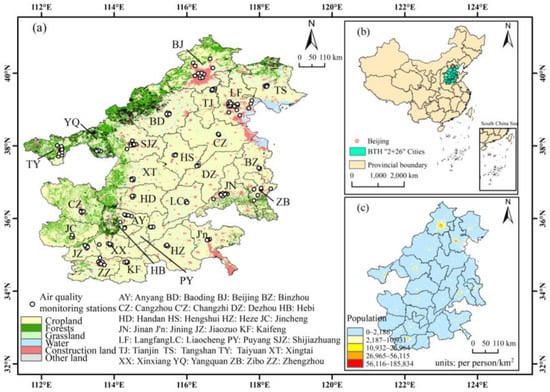
Figure 1.
Study area. (a) The land-use-cover data and spatial location of air quality monitoring stations in the “2 + 26” cities of BTH; (b) the spatial location of the “2 + 26” cities of BTH in China; (c) the population data for the “2 + 26” cities of BTH.
2.2. Study Data
2.2.1. PM2.5 Concentration Data
The 2010, 2015, and 2020 PM2.5 pollutant data in the “2 + 26” cities of BTH were obtained from the National Urban Air Quality Real-time Distribution Platform (https://air.cnemc.cn:18007/; accessed on 17 September 2023). These data comprised municipal PM2.5 pollutant concentration data values from the hourly monitoring data from each ground station. The PM2.5 annual average concentration values (μg/m3) in the “2 + 26” cities of BTH were calculated using the daily average concentration values of each prefecture-level city; the missing values were spatially interpolated with inverse distance weighting using ArcGIS 10.2 software.
2.2.2. Remote Sensing, Meteorological, and Socioeconomic Data
We selected the 2010, 2015, and 2020 Landsat land cover and population density data to map the spatial-temporal characteristics in the “2 + 26” cities of BTH. The urban construction land data were obtained from the 30 m resolution China Land Cover Dataset from the Resource and Environmental Data of the Chinese Academy of Sciences (www.resdc.cn; accessed on 17 September 2023). The population density data were obtained from the 1000 m × 1000 m resolution LandScan population density dataset (https://landscan.ornl.gov/; accessed on 17 September 2023).
Considering the socioeconomic causes of air pollutants [], the population density (P (person/km2)), gross domestic product (GDP), industry structure (Ind (%)), and bus ownership (Bus (units)) were selected as the socioeconomic data, which were obtained from the 2011, 2016, and 2021 China Urban Statistical Yearbook.
Unfavorable meteorological conditions are detrimental to the dispersion of atmospheric pollutants [,]. Therefore, the meteorological data of temperature (T (°C)), precipitation (PCP (mm)), relative humidity (RH (%)), and wind speed (WS (m/s)) were picked as the dependent variables. These data were obtained from the hour-by-hour National Meteorological Science Data Center database from 2010 to 2020 (http://data.cma.cn/; accessed on 17 September 2023). In this study, Table 1 shows that China’s land use remote sensing data, China’s socio-economic data, air pollutants, and meteorological datasets are used.

Table 1.
Data sources.
2.3. Models and Methods
This study analyzed the degree of urban expansion and the PM2.5 pollution problem in the “2 + 26” cities of BTH. We took the PM2.5 pollutants as the dependent variable and the urban spatial morphology index and socio-economic and meteorological data as the independent variables to construct a dataset. We calculated the urban construction land and analyzed the spatial-temporal aggregation characteristics; specifically, we combined our method to analyze the influence of PM2.5 pollutants by the factorial detector and recognized the effects of interactions through interaction detection in the Geo-Detector (Figure 2).
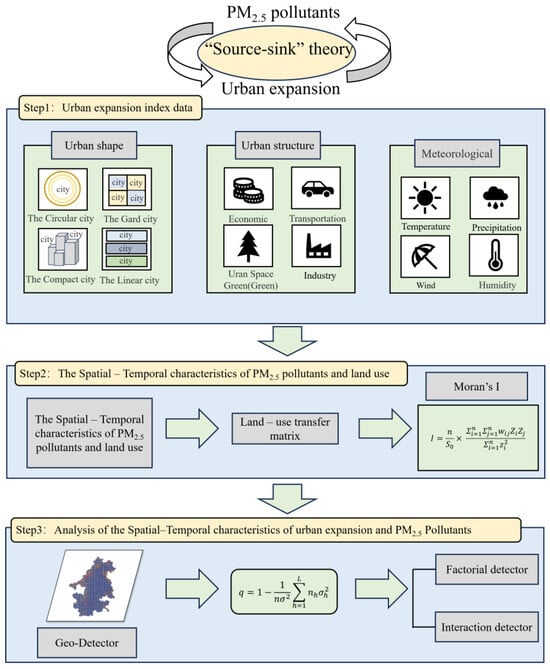
Figure 2.
Flowchart of the coupled spatial-temporal driving mechanism framework in this study.
2.3.1. Spatial Autocorrelation Analysis of Urban Construction Land
Spatial autocorrelation followed Tobler’s First Law [] to analyze the spatial autocorrelation of adjacent urban construction land in the “2 + 26” cities of BTH. It was used to measure the spatial agglomeration of urban construction land. The Lisa (Local indicators of spatial association) index is a typical local spatial autocorrelation statistical method that was used to test the spatial hot and cold spots among prefecture-level cities within the 2 + 26 cities. The calculation formula for the urban spatial autocorrelation is obtained using the following formula:
where and are the urban construction land of and in the regions; is the spatial matrix data; is the aggregation of spatial weights of the region; is the variance of aggregation; is the number of urban space units; and represents global and local Moran’s I index of the urban construction land in the “2 + 26” cities of BTH; When 0 < Moran’s I index ≤ 1, there was a positive spatial correlation with the 2 + 26 urban construction land. When Moran’s I index was < 1, there was a negative spatial correlation. When Moran’s I index = 0, the correlation was randomly distributed in space.
2.3.2. Meaning and Characterization of Urban Spatial Morphology Indices
Urban spatial morphology reflects the processes of external urban expansion and the internal spatial structure of the human economy in this study. In urban planning and urban ecology, urban spatial morphology includes three levels: micro, middle, and macro []. The microscale represents the functional space within the city [] and the middle- and the macroscales are structures of the city cluster system []. The urban structure indicators (population density, industrial structure, traffic access, and nighttime remote sensing index) and the urban shape indicators (compactness, fractal dimension, centrality ratio, and circularity ratio) are defined on the middle- and macroscales []. Globally, cities, as sites of human activities, export anthropogenic air pollutants annually []. Therefore, urban spatial morphology and air pollutants are correlated with emission, dispersion, and purification. The flow of urban spatial morphology and PM2.5 pollutant-driven impact mechanisms is established in Figure 3.
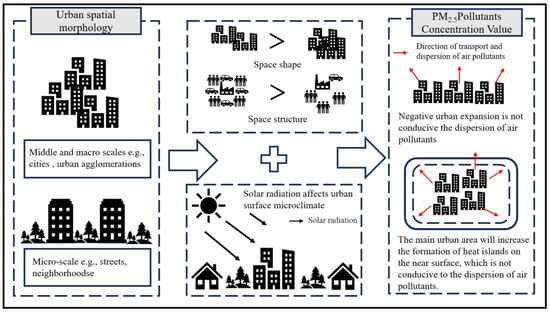
Figure 3.
The urban spatial morphology and PM2.5 pollutant-driven impact mechanisms.
In our study, indices such as fractal dimension (FRD), compactness index (CI), circularity ratio (CR), and centrality ratio (CEN) were applied to define urban spatial morphology. FRD reflected the external profile of prefecture-level cities in the “2 + 26” cities of BTH. The theoretical range of FRD is 1–2, and the higher the calculated FRD was, the closer the cities in the “2 + 26” cities of BTH were to the traditional urban spatial morphology []. CI was the degree of concentration of urban spatial patterns outside the cities of the “2 + 26” cities of BTH. The CI was conducive to controlling the rate of urban land expansion and improving public transportation []. The circularity ratio, CR, precisely reflected the degree of discrete regional and urban development and measured the circular cities []. The centrality ratio or CEN, was the degree of spatial concentration of elements such as population or economic activities in the central area within a city, which showed the grid of the city []. Urban transportation is an influential factor that cannot be ignored in the process of urban expansion []; this has an impact on the spatial form of cities. Transportation for commuting is an important part of sustainable urban development. The calculation formula for the urban spatial morphology index is obtained using the following formula:
where A is the total area of urban construction land; P is the perimeter of urban construction land; is the standard deviation of the population density; is the average value of the population density; and denotes the number of buses in the “2 + 26” cities of BTH.
2.3.3. Geo-Detector Modeling to Analyze the Effect of Urban Expansion Factors and PM2.5 Pollutants
Based on the core concept of geospatial heterogeneity [], we used Geo-Detector to construct spatial matrices of urban spatial morphology and PM2.5 pollutants. Then, we used Geo-Detector to calculate their spatial correlations, which could better reflect the causes and mechanisms behind geographic phenomena than traditional models []. Spatial heterogeneity included a significant change in the relationship between certain variables in space with spatial changes; secondly, the statistics (e.g., mean and variance) of certain variables in space changed smoothly or not smoothly with the spatial changes []. Our study focused more on the spatial variation of geospatial elements.
The Geo-Detector data preprocessing included extracting all kinds of urban spatial morphology and meteorological data and transforming them into raster data; constructing 1000 m × 1000 m resolution grid data and extracting all kinds of raster data into grid data through ArcGIS 10.2 software; and, thirdly, extracting points according to the spatial analysis and statistical tools and exporting them to the Geo-Detector modeling algorithms. The flowchart of the Geo-Detector method in the “2 + 26” cities of BTH is shown in Figure 4.
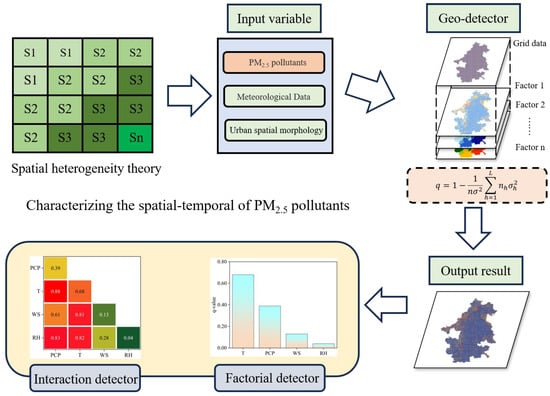
Figure 4.
Analytical framework of the Geo-Detector model.
The factorial detection of the geographic probe explores the urban spatial morphology and PM2.5 pollutant spatial heterogeneity of the 2 + 26 cities by calculating the q-value. The specific equation is as follows:
where is the detection intensity of the PM2.5 pollutants in the 2 + 26 cities; is the total number of samples from the 2 + 26 cities; L is the Stata of prefecture-level city variables in the 2 + 26 cities ( 1,2,3…); and is the variance of PM2.5 pollutants in the 2 + 26 cities. The size of can be used as an explanation for the PM2.5 pollutants in the 2 + 26 cities, and its value range is generally [0, 1]. The larger the value of , the higher the explanatory value of the driver for the PM2.5 pollutants.
The interaction detector is used to identify the interaction between the urban spatial morphological index and the effect of the main factors and together with the variation in the interpretation rate of PM2.5 pollutant characteristics in the 2 + 26 cities. The assessment method is shown in Table 2.
Table 2.
Geo-Detector interactive detection.
3. Results
3.1. The Changes in PM2.5 Pollutant Concentration and Recommended Values in the “2 + 26” Cities of BTH
The concentration of PM2.5 pollutants in the “2 + 26” cities of BTH increased by 12.86% from 2010 to 2015. After the development of the city in 2020, Figure 5a shows that PM2.5 pollutant concentrations significantly shifted, from 82.62 μg/m3 to 47.05 μg/m3. However, the average concentration of PM2.5 pollutants in the last ten years was 67.63 μg/m3. Considering the WHO-recommended level [], the PM2.5 pollutants in the “2 + 26” cities of BTH were classified into AQG (Air Quality Guidelines) and IT (Interim Targets). We classified the PM2.5 pollutants’ annual mean concentration values into five classes: AQG (0.00–15.00 μg/m3), IT-4 (25.00–37.50 μg/m3), IT-3 (37.50–50.00 μg/m3), IT-2 (50.00–75.00 μg/m3), and IT-1 (>75 μg/m3) (Figure 5b). In 2020, the AQG and IT-4 percentages increased by 17.13% and 20.09%, respectively, compared with the 2010 recommended PM2.5 pollutant levels.
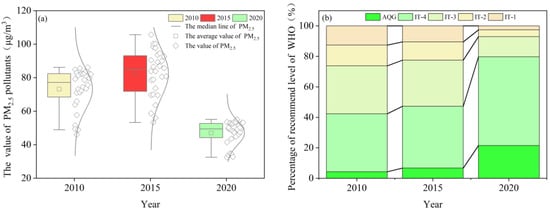
Figure 5.
The temporal characteristics of PM2.5 pollutants. (a) characteristics of changes in annual-scale PM2.5 pollutants; (b) the hazardous situation of PM2.5 pollutants.
The spatial change characteristics of PM2.5 pollutants in the “2 + 26” cities of BTH show evident spatial differentiation characteristics (Figure 6). In 2010, Kaifeng City (86.22 μg/m3), Dezhou City (85.59 μg/m3), Hengshui City (84.85 μg/m3), and other prefecture-level cities in the center and the south of the study area had high values of PM2.5 pollutants; in 2015, Baoding (105.69 μg/m3) had the highest value of PM2.5 pollutants of all the “2 + 26” cities of BTH; in 2020, the area with high values of PM2.5 pollutants showed a significant reduction, but Hengshui City (78.90 μg/m3), Dezhou (78.38 μg/m3), and Liaocheng City (78.38 μg/m3) were still above the IT-1-recommended guideline of 75 μg/m3.
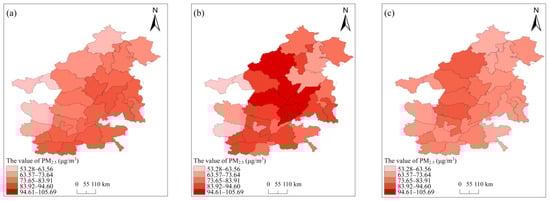
Figure 6.
The spatial characteristics of PM2.5 pollutants in the “2 + 26” cities of BTH. (a) the PM2.5 pollutants in the “2 + 26” cities of BTH in 2010; (b) the PM2.5 pollutants in the “2 + 26” cities of BTH in 2015; (c) thePM2.5 pollutants in the “2 + 26” cities of BTH in 2020.
3.2. The Land-Use Change in the “2 + 26” Cities of BTH
Figure 7 shows that cropland, as the most dominant land-use type in the “2 + 26” cities of BTH, accounts for more than 55 percent of the total land area (2.7 × 10⁴ km2). From the analysis of land-use-change trends from 2010 to 2020, forest land increased the most of all the land-use types, from 12.36% to 13.08%, followed by a 0.52% growth in urban construction land. Grassland saw an increase of 0.44%. Water and other land-use types accounted for less than 1%. In the past ten years, the total amount of cropland in the “2 + 26” cities of BTH decreased; the proportion of forest land, grassland, and urban construction land-use types increased significantly; and water bodies and other land-use types leveled off. At this stage, while the rapid urbanization of the “2 + 26” cities of BTH has led to the loss of cropland, the protection of ecological land, such as grassland and woodland, has been better overall.
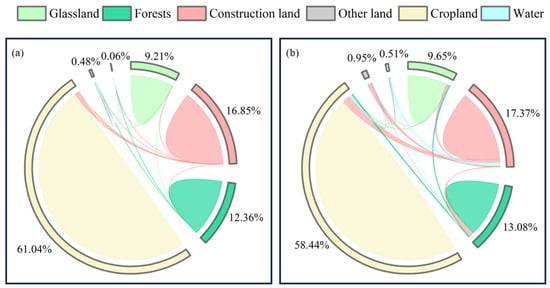
Figure 7.
The land-use transfer matrix in the “2 + 26” cities of BTH. (a) the change of the land-use transfer matrix from 2010 to 2015; (b) the change of the land-use transfer matrix from 2015 to 2020.
3.3. The Spatial Autocorrelation Analysis of Urban Construction Land in the “2 + 26” Cities of BTH
Table 3 indicates that there was obvious spatial autocorrelation in the expansion of the “2 + 26” cities of BTH. The Moran’s I index value of the construction land was 0.63 (2020) > 0.52 (2015) > 0.36 (2010), and the spatial agglomeration distribution strengthened annually.
Table 3.
The temporal characteristics of Moran’s I index for construction land in the “2 + 26” cities of BTH.
Figure 8 shows the local Lisa index of the changes in the area of construction land in the “2 + 26” cities of BTH from 2010, 2015, and 2020. Among them, the northern part, the eastern coast, and the southwestern region of the “2 + 26” cities of BTH were the high–high aggregation areas with high values of construction land in 2010; Puyang City, Anyang City, and Heze City had relatively low levels of urbanization from 2010 to 2015; and the development of cities in the central and western parts of the “2 + 26” cities of BTH were relatively stable, and their interannual spatial changes were not obvious in 2015. The trend in the development of cities in Shandong, such as Jinan City in the east, from 2015 to 2020. The spatial agglomeration characteristics of the northern cities, including Beijing City, Tianjin City, and Langfang City, gradually shifted towards the eastern coast.
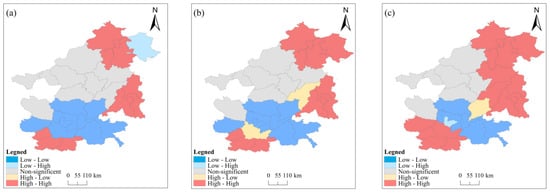
Figure 8.
The spatial characteristics of the LISA index for construction land in the “2 + 26” cities of BTH. (a) the LISA index of construction land in 2010; (b) the LISA index of construction land in 2015; (c) The LISA index of construction land in 2020.
3.4. The Spatial-Temporal Characteristics of Urban Expansion Factors in the “2 + 26” Cities of BTH
There is a clear time-divergence feature of the influence factor expansion from 2010 to 2020 (Figure 9) as the “2 + 26” cities of BTH continued to transform into green, sustainable, and high-quality cities. Except for FRD, which showed a decreasing trend, the spatial structure influence factors of the cities were enhanced annually. With the acceleration of the urbanization process in the “2 + 26” cities of BTH, the CI, CR, and CEN increased by 0.04, 0.55, and 0.03, respectively. The increasing intensity of human activities in the process of rapid urbanization led to a continuous upward trend in the spatial structure from 2010 to 2020. Compared with the factors affecting urban spatial patterns, meteorological factors were less affected by urban expansion and human activities. There were obvious nonlinear differences in the interannual trends in PCP among various meteorological factors.
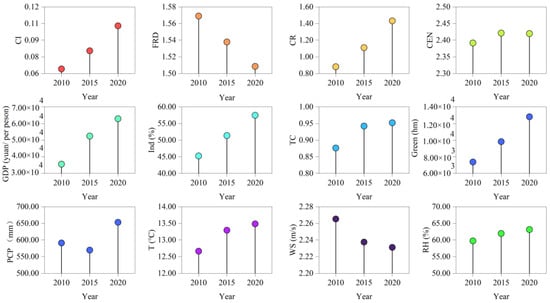
Figure 9.
The temporal changes in characteristics of expansion impact factors in the “2 + 26” cities of BTH.
There are obvious spatial differentiation characteristics of the influence factor of urban expansion in the “2 + 26” cities of BTH (Figure 10). In addition to FRD, the rest of the cities with high values of urban spatial shape and urban spatial structure influence factors were located in Beijing, Jinan, Zhengzhou, and other cities with high urbanization levels. Secondly, the spatial distribution characteristics of the FRD influence factors showed an opposite trend to other related factors. Cities with stable urbanization levels, such as Changzhi City, Cangzhou City, and Jincheng City, had average FRD values of 1.74, 1.73, and 1.70. Overall, the influence factors of various urban spatial morphologies showed spatial changes from the periphery to the middle of the city. In addition, the meteorological factors were high in the north and low in the south, decreasing from coastal to central cities.
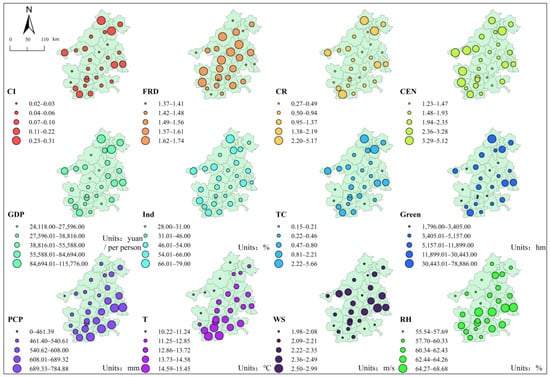
Figure 10.
The spatial changes in characteristics of expansion impact factors in the “2 + 26” cities of BTH.
3.5. Analysis of the Spatial-Temporal Characteristics between Urban Expansion and PM2.5 Pollutants in the “2 + 26” Cities of BTH
CI, Ind, and T were the most significant main factors among the urban expansion influencing factors on the spatial and temporal characteristics of PM2.5 pollutants in the “2 + 26” cities of BTH. With the development of the “2 + 26” cities of BTH, the construction of compact cities improved. Figure 11 shows that the explanation rate of the CI index differentiation characteristics of PM2.5 pollutants increased from 0.63 to 0.66. Due to the transformation and adjustment of the industrial structure, the explanation rate of the Ind for PM2.5 pollutants decreased annually. In this context, in 2020, the impact of pandemic prevention and control policies caused a substantial decline, to 0.26. In controlling the spread of the COVID-19 outbreak through regional vehicle restrictions, shutdowns, and production stoppages, the government reduced the intensity of pollutant emissions and mitigated air pollution in urban areas. Meteorological elements were less affected by human activities, and there was a nonlinear trend in interannual changes. Temperature was the most obvious interpreted meteorological data for PM2.5 pollutants, with an explanation rate of more than 0.40, while RH was the meteorological factor with the least influence on PM2.5 pollutants, with an explanation rate of less than 0.10.
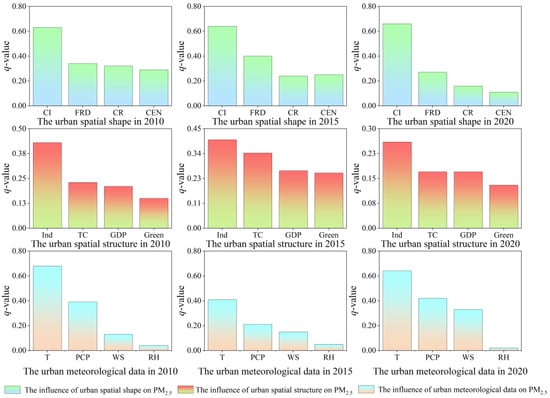
Figure 11.
Analysis of the impact of spatial-temporal characteristics of the urban expansion factors influencing PM2.5 pollutants in the “2 + 26” cities of BTH.
The interaction values of the geo-detectors explain the spatial heterogeneity characteristics of PM2.5 pollutants in the “2 + 26” cities of BTH. When the interaction value between factors is higher, it indicates a greater influence on the spatial variation characteristics of PM2.5 pollutants, and vice versa, it has less influence on PM2.5 pollutants, and the results are shown in Figure 12. The interaction effects of the factors appeared to change dynamically with time. In terms of urban expansion factors, CI ∩ CEN (0.92), Ind ∩ Green (0.78), and PCP ∩ T (0.88) were the strongest urban spatial shape, structure, and meteorological factors affecting the spatial-temporal characteristics of PM2.5 pollutants. Additionally, in terms of the types of urban expansion factors, the strongest interaction among the urban spatial shapes between the CI and CEN remained unchanged, while Ind ∩ TC and T ∩ WS were added for urban spatial structure and urban meteorological factors, respectively.
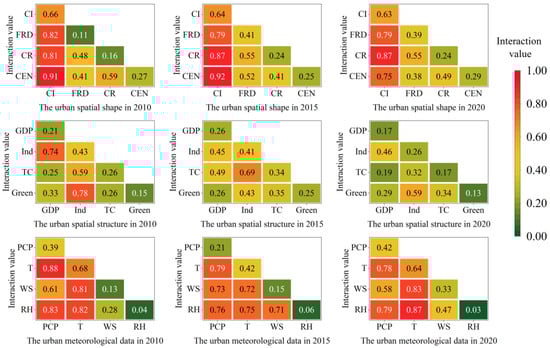
Figure 12.
Interaction analysis of influence factors of urban expansion factors influencing PM2.5 pollutants in the “2 + 26” cities of BTH.
Judging from the most important urban expansion influencing factors on PM2.5 pollution in the “2 + 26” cities of BTH, all showed an increasing trend (Figure 13). Among them, the proportion of nonlinear enhancement trend in the overall enhancement trend in PM2.5 pollutants was 66.67%. In terms of spatial differentiation characteristics, the explanation rates of urban spatial shape, urban spatial structure, and urban meteorological factors all exceeded 0.50. Specifically, the most important combinations of urban sprawl influencing factors affecting the 2 + 26 cities were CI ∩ CEN (0.91), Ind ∩ Green (0.78), and PCP ∩ T (0.88). In terms of the temporal divergence characteristics, the explanation rate of each type of interaction combination showed a significant decline. Among them, the urban spatial structure declined most significantly, with the decline in the interaction combination of the Ind∩Green exceeding 0.19.
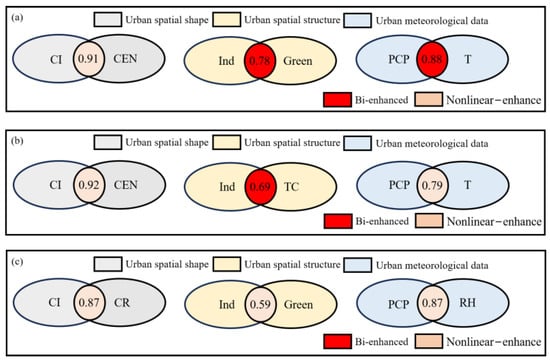
Figure 13.
Interaction mechanism of the most important urban expansion factors influencing PM2.5 pollutants in the “2 + 26” cities of BTH. (a) the major interaction mechanism factors between PM2.5 pollutants and urban expansion factors in 2010; (b) the major interaction mechanism factors between PM2.5 pollutants and urban expansion factors in 2015; (c) the major interaction mechanism factors between PM2.5 pollutants and urban expansion factors in 2020.
4. Discussion
4.1. Urban Expansion Exacerbates the Harmful Effects of PM2.5 Pollutants
The study of the urbanization process is one of the hot topics in human geography and urban ecology research. Urbanization includes the transformation of a rural population into an urban population, socioeconomic restructuring, and land-type changes in peri-urban construction land within cities []. Worldwide, large cities and urban agglomerations are generally located along economically developed regions in middle and low latitudes [,]. The “2 + 26” cities of BTH, as economically developed and densely populated cities in Asia, are representatives of typical high urbanization. In the process of population urbanization, uncontrolled urban expansion increases the probability of the emergence of urban ecological and environmental problems []. Increased energy consumption by urban industries and motor vehicles is a potential “source” of near-surface pollution []. Zhou et al. [] observed the dust aerosol layer between the surface and 4000 m, and combined with the trajectory analysis, found that the air pollution events in the key cities in China were affected by the long-distance transport of the north-westerly winds. The compactness of cities can improve the urban climate by encouraging green and low-consumption energy and by promoting public transport []. We found that changing the near-surface atmospheric circulation contributes to improved atmospheric quality and a reduced spatial concentration of pollutants in cities. Following the “smart growth model” will effectively manage urban planning and the environment []. Although the environmental hazards associated with increased construction land in megacity clusters cannot fully explain the environmental impacts of urban expansion, they reveal the hazardous effects of urban expansion in the “2 + 26” cities of BTH on the atmospheric environment.
This study analysis provided theoretical knowledge for exploring the mechanisms for the environmental impact of rapid urban development. However, the following shortcomings still exist: (1) The high-resolution, continuous-time-series remote sensing data of land use type used lacks a continuous and long-time series. (2) In this study, we extracted motor vehicle and bus data in the “2 + 26” cities of BTH based on the statistical yearbook and calculated the urban traffic commuting degree with ArcGIS 10.2 software. Due to the lack of lorry and motorbike data, there is still some deviation from the real results. Therefore, in future research, we would improve the impact of regional urbanization on the peri-urban atmospheric environment by combining atmospheric pollution components.
4.2. Definition of the Urban Spatial Morphology Index
The process of urbanization has increased the density and height of urban buildings. The transformation of the urban environment affects the transformation of the natural environment through urban physical space morphology []. Urban spatial shape was calculated based on the external contour, perimeter, and total area of the studied cities. Urban spatial structure, which combined social, humanistic, economic, and landscape indices, was often used in cross-disciplinary research []. The urban spatial morphology indices included the frontal area index calculated based on the longest axis of the region and the area of the region []; the ellipticity ratio obtained by Stoddart based on the long and short axes of the city []; and the radial shape index calculated by Boyce and Clark based on the distances from the center to the various districts of the city []. We took the circular area of the main city as the standard unit of the study, which not only integrated the multifaceted characteristics of the external shape but also optimized the problem of the cumbersome calculation of the traditional urban spatial morphology index. Urban spatial morphology is a result of the interaction between the urban natural landscape, urban social development dynamics, urban structure, and functional factors []. In recent studies, other socioeconomic and urban landscape indicators, such as the intensity of human activities, have been applied to the study of urban spatial morphology []. Compact cities reduce line-source traffic pollution by rationally regulating the road network [], increasing the area of urban green space to reduce the urban heat island effect to reduce air pollutants [,], and improving urban ventilation to weaken the spatial concentration of pollutants by changing the spacing arrangement of buildings. The “2 + 26” cities of BTH are one of the urban agglomerations with the highest levels of urbanization development within Asia. We found that PM2.5 pollutants were relatively high with high urbanization levels, such as those in the “2 + 26” cities of BTH. Therefore, urban expansion enhances human activities within cities, which in turn affects urban spatial patterns and influences PM2.5 pollutant concentration values.
Urban spatial morphology is affected by urban physical shape elements such as natural geographic location, urban ventilation, and slope []. Since the “2 + 26” cities of BTH have similar altitudes and natural climate conditions due to geographical spans, and due to the data sources and research equipment, we did not study the urban boundary layer, urban crown layer, or urban street canyon. Therefore, we would focus on the morphology of the texture and the structure of the urban building components in the urban spatial morphology in future research.
4.3. Effects of the Major Urban Expansion Index on Spatial and Temporal Characteristics of PM2.5 Pollutants
The main factors influencing urban expansion are characterized as urban construction land, population density, and economic development level in the process of urbanization. The industrial structure and urban compactness can support the explanation of the expansion of urbanization []. As the quantification of urban expansion exists in a variety of expressions, there were differences in the urban PM2.5 pollutants evaluated in the “2 + 26” cities of BTH. The Geo-Detector serves as a model for overlaying spatial variables within a regional unit by reclassifying them, establishing spatial relationships, and re-evaluating spatial differences between variables []. The Geo-Detector showed that the same dominant driver had different spatial-temporal explanatory powers for PM2.5 pollutants. As the industrial structure of the dominant driver increases, the emission of pollutants based on human activities also increases []. The change in the share of the industrial structure manifests in the PM2.5 pollutants due to the different rates of their impacts on air pollutants during the physical and chemical transport of exhaust matter emitted from factories []. As an important indicator of spatial shape connectivity, the compactness index is one of the important influencing factors for air pollutants []. In addition, urban construction land is a “source” landscape, where the meteorological conditions in “source” landscape centers with high temperatures and low wind speeds could influence air pollutant concentration values []. Therefore, encouraging the construction of reasonable urban spatial morphology, promoting the industrial structure, and rationally planning the process of urban expansion will contribute to regional air pollution control.
The main influencing factors of the spatial-temporal characteristics of PM2.5 pollutants in the “2 + 26” cities of BTH were analyzed using the Geo-Detector model. The improvement of PM2.5 pollutants in the context of urbanization was discussed. The Environmental Protection Agency reduces air pollution hazards by setting emission standards for new-energy vehicles and weakening pollutant emissions per kilometer traveled []. In addition, measures such as increasing the area of urban green space, improving the urban public transport road network, and adjusting the industrial layout also improve the local urban ecological environment. Therefore, in the future, the “2 + 26” cities of BTH should mitigate air pollution hazards through rational urban planning and the promotion of new-energy-vehicle standards.
5. Conclusions
We aimed to address the lack of knowledge on the relationship between the mechanisms of urban expansion and PM2.5 pollutants from a multi-scale and macro perspective. This paper, based on data on land use, population density, socioeconomic indicators, and environmental monitoring stations, revealed the influence of the coupled driving mechanism of spatial-temporal urban expansion indices on PM2.5 pollutants. The main conclusions are as follows:
- (1)
- From 2010, 2015, and 2020, the concentration of PM2.5 pollutants decreased by 26.15 μg/m3 in the “2 + 26” cities of BTH. Among them, the trend in the spatial characteristics of PM2.5 pollutants decreased from the central–northern part of the country to the surrounding areas.
- (2)
- The Moran I Index showed that 0.36, 0.52, and 0.63 of urban construction land were located in “hot-spot areas” with respect to the city area in 2010, 2015, and 2020, respectively.
- (3)
- There were significant spatial heterogeneity characteristics in the urban expansion index. In addition to the fractal dimension, the values of the other urban spatial morphology factors all increased with urban expansion. The influencing factors of meteorology were relatively less affected by urban expansion.
- (4)
- The compactness index, the industrial structure, and temperature were the main urban expansion factors affecting PM2.5 pollutants in the “2 + 26” cities of BTH. Among them, the compactness index and the centrality ratio, as the most important interaction combinations, explained 0.92 of PM2.5 pollutants.
Urban expansion, human activities, and meteorological conditions were important factors in the variation of PM2.5 pollutants. At the same time, remote sensing data images as well as Geo-Detector models had strong geospatial analysis capabilities. Our findings will help achieve the environmental eco-city goal of promoting the improvement of the urban atmospheric environment.
Author Contributions
Conceptualization, S.Y.; methodology, S.Y.; software, S.Y.; validation, P.W.; writing—original draft preparation, S.Y. and P.W.; review and editing, S.Y. and Y.H.; visualization, S.Y. and Y.S.; funding acquisition, Q.C. and P.W. All authors have read and agreed to the published version of the manuscript.
Funding
This research was supported by the Science and Technology Research Project of Jiangxi Provincial Education Department, China, Grant NO. GJJ2204003.
Institutional Review Board Statement
Not applicable.
Informed Consent Statement
Not applicable.
Data Availability Statement
The datasets presented in this study can be found here: https://landscan.ornl.gov/; accessed on 17 September 2023; www.resdc.cn; accessed on 17 September 2023; https://www.stats.gov.cn/sj/ndsj/; accessed on 17 September 2023; https://air.cnemc.cn:18007/; accessed on 17 September 2023.
Conflicts of Interest
The authors declare no conflict of interest.
References
- Li, K.; Wilson, J.P. Modeling the Health Benefits of Superblocks across the City of Los Angeles. Appl. Sci. 2023, 13, 2095. [Google Scholar] [CrossRef]
- Beall, J. Social policy and urban development. In Handbook of Social Policy and Development; Elgar: Cheltenham, UK, 2019; pp. 147–168. [Google Scholar]
- UNDESA United Nations. World Urbanization Prospects 2018: Highlights; United Nations, Department of Economic and Social Affairs, Population Division: New York, NY, USA, 2018. [Google Scholar]
- Li, G.; Fang, C.; Li, Y.; Wang, Z.; Sun, S.; He, S.; Qi, W.; Bao, C.; Ma, H.; Fan, Y. Global impacts of future urban expansion on terrestrial vertebrate diversity. Nat. Commun. 2022, 13, 1628. [Google Scholar] [CrossRef] [PubMed]
- Tanasa, I.; Cazacu, M.; Sluser, B. Air Quality Integrated Assessment: Environmental Impacts, Risks and Human Health Hazards. Appl. Sci. 2023, 13, 1222. [Google Scholar] [CrossRef]
- Deng, Y.; Wang, J.; Sun, L.; Wang, Y.; Chen, J.; Zhao, Z.; Wang, T.; Xiang, Y.; Wang, Y.; Chen, J.; et al. Effects of Ambient O3 on Respiratory Mortality, Especially the Combined Effects of PM2.5 and O3. Toxics 2023, 11, 892. [Google Scholar] [CrossRef] [PubMed]
- Pandey, A.; Brauer, M.; Cropper, M.L.; Balakrishnan, K.; Mathur, P.; Dey, S.; Turkgulu, B.; Kumar, G.A.; Khare, M.; Beig, G. Health and economic impact of air pollution in the states of India: The Global Burden of Disease Study 2019. Lancet Planet. Health 2021, 5, e25–e38. [Google Scholar] [CrossRef]
- Wang, F.; Qiu, X.; Cao, J.; Peng, L.; Zhang, N.; Yan, Y.; Li, R. Policy-driven changes in the health risk of PM2.5 and O3 exposure in China during 2013–2018. Sci. Total Environ. 2021, 757, 143775. [Google Scholar] [CrossRef]
- Zhang, F.; Xu, N.; Wang, L.; Tan, Q. The Effect of Air Pollution on the Healthy Growth of Cities: An Empirical Study of the Beijing-Tianjin-Hebei Region. Appl. Sci. 2020, 10, 3699. [Google Scholar] [CrossRef]
- Zhao, H.; Zhang, Y.; Qi, Q.; Zhang, H. Evaluating the Impacts of Ground-Level O3 on Crops in China. Curr. Pollut. Rep. 2021, 7, 565–578. [Google Scholar] [CrossRef]
- Feng, Z.; Xu, Y.; Kobayashi, K.; Dai, L.; Zhang, T.; Agathokleous, E.; Calatayud, V.; Paoletti, E.; Mukherjee, A.; Agrawal, M. Ozone pollution threatens the production of major staple crops in East Asia. Nat. Food. 2022, 3, 47–56. [Google Scholar] [CrossRef]
- Tang, R.; Zhao, J.; Liu, Y.; Huang, X.; Zhang, Y.; Zhou, D.; Ding, A.; Nielsen, C.P.; Wang, H. Air quality and health co-benefits of China’s carbon dioxide emissions peaking before 2030. Nat. Commun. 2022, 13, 1008. [Google Scholar] [CrossRef]
- He, K.; Yang, F.; Ma, Y.; Zhang, Q.; Yao, X.; Chan, C.K.; Cadle, S.; Chan, T.; Mulawa, P. The characteristics of PM2.5 in Beijing, China. Atmos. Environ. 2001, 35, 4959–4970. [Google Scholar] [CrossRef]
- Yang, D.; Ye, C.; Wang, X.; Lu, D.; Xu, J.; Yang, H. Global distribution and evolvement of urbanization and PM2.5 (1998–2015). Atmos. Environ. 2018, 182, 171–178. [Google Scholar] [CrossRef]
- Yuan, C.; Ng, E.; Norford, L.K. Improving air quality in high-density cities by understanding the relationship between air pollutant dispersion and urban morphologies. Build. Environ. 2014, 71, 245–258. [Google Scholar] [CrossRef] [PubMed]
- Hu, H.; Chen, Q.; Qian, Q.; Zhou, X.; Chen, Y.; Cai, Y. Field investigation for ambient wind speed and direction effects exposure of cyclists to PM2.5 and PM10 in urban street environments. Build. Environ. 2022, 223, 109483. [Google Scholar] [CrossRef]
- Han, L. Relationship between urbanization and urban air quality: An insight on fine particulate dynamics in China. Prog. Geogr. 2018, 37, 1011–1021. [Google Scholar]
- Qi, G.; Wei, W.; Wang, Z.; Wang, Z.; Wei, L. The spatial-temporal evolution mechanism of PM2.5 concentration based on China’s climate zoning. J. Environ. Manag. 2023, 325, 116671. [Google Scholar] [CrossRef] [PubMed]
- Heriza, D.; Wu, C.; Syariz, M.A.; Lin, C. Analysis of Spatial—Temporal Variability of PM2.5 Concentrations Using Optical Satellite Images and Geographic Information System. Remote Sens. 2023, 15, 2009. [Google Scholar] [CrossRef]
- Clark, L.P.; Millet, D.B.; Marshall, J.D. Air quality and urban form in US urban areas: Evidence from regulatory monitors. Environ. Sci. Technol. 2011, 45, 7028–7035. [Google Scholar] [CrossRef]
- Borrego, C.; Martins, H.; Tchepel, O.; Salmim, L.; Monteiro, A.; Miranda, A.I. How urban structure can affect city sustainability from an air quality perspective. Environ. Modell. Softw. 2006, 21, 461–467. [Google Scholar] [CrossRef]
- Dempsey, N.; Jenks, M. The future of the compact city. Built Environ. 2010, 36, 116–121. [Google Scholar] [CrossRef]
- Harris, C.D.; Ullman, E.L. The nature of cities. Ann. Am. Acad. Political Soc. Sci. 1945, 242, 7–17. [Google Scholar] [CrossRef]
- Tian, Y.; Zhou, T.; Wang, D.; Li, F. The effect and mechanism of multi-scale urban forms on air quality. Geogr. Res. 2022, 41, 1883–1897. [Google Scholar]
- Bereitschaft, B.; Debbage, K. Urban form, air pollution, and CO2 emissions in large US metropolitan areas. Prof. Geogr. 2013, 65, 612–635. [Google Scholar] [CrossRef]
- Irga, P.J.; Burchett, M.D.; Torpy, F.R. Does urban forestry have a quantitative effect on ambient air quality in an urban environment? Atmos. Environ. 2015, 120, 173–181. [Google Scholar] [CrossRef]
- Liu, Y.; Wu, J.; Yu, D.; Ma, Q. The relationship between urban form and air pollution depends on seasonality and city size. Environ. Sci. Pollut. Res. 2018, 25, 15554–15567. [Google Scholar] [CrossRef]
- Chen, L.; Fu, B.; Zhao, W. Source-sink landscape theory and its ecological significance. Front. Biol. China 2008, 3, 131–136. [Google Scholar] [CrossRef]
- Liu, Y.; Ding, H. Variation in air pollution tolerance index of plants near a steel factory: Implication for landscape-plant species selection for industrial areas. WSEAS Trans. Environ. Dev. 2008, 4, 24–32. [Google Scholar]
- Wu, J.; Xie, W.; Li, W.; Li, J. Effects of urban landscape pattern on PM2.5 pollution—A Beijing case study. PLoS ONE 2015, 10, e142449. [Google Scholar] [CrossRef]
- Huang, Q.; Xu, C.; Jiang, W.; Yue, W.; Rong, Q.; Gu, Z.; Su, M. Urban compactness and patch complexity influence PM2.5 concentrations in contrasting ways: Evidence from the Guangdong-Hong Kong-Macao Greater Bay Area of China. Ecol. Indic. 2021, 133, 108407. [Google Scholar] [CrossRef]
- Fang, C.; Wang, S.; Li, G. Changing urban forms and carbon dioxide emissions in China: A case study of 30 provincial capital cities. Appl. Energy 2015, 158, 519–531. [Google Scholar] [CrossRef]
- Cushman, S.A.; McGarigal, K.; Neel, M.C. Parsimony in landscape metrics: Strength, universality, and consistency. Ecol. Indic. 2008, 8, 691–703. [Google Scholar] [CrossRef]
- Xu, C.; Haase, D.; Su, M.; Wang, Y.; Pauleit, S. Assessment of landscape changes under different urban dynamics based on a multiple-scenario modeling approach. Environ. Plan. B Urban Anal. City Sci. 2020, 47, 1361–1379. [Google Scholar] [CrossRef]
- Wang, J.; Xu, C. Geodetector: Principle and prospective. Acta Geogr. Sin. 2017, 72, 116–134. [Google Scholar]
- Zhao, Y.; Liu, L.; Kang, S.; Ao, Y.; Han, L.; Ma, C. Quantitative analysis of factors influencing spatial distribution of soil erosion based on geo-detector model under diverse geomorphological types. Land 2021, 10, 604. [Google Scholar] [CrossRef]
- Zhang, M.; Kafy, A.; Ren, B.; Zhang, Y.; Tan, S.; Li, J. Application of the optimal parameter geographic detector model in the identification of influencing factors of ecological quality in Guangzhou, China. Land 2022, 11, 1303. [Google Scholar] [CrossRef]
- World, B. East Asia’s Changing Urban Landscape: Measuring a Decade of Spatial Growth; The World Bank: Washington, DC, USA, 2015. [Google Scholar]
- Ning, Y. Definition of Chinese metropolitan areas and large urban agglomerations: Role of large urban agglomerations in regional development. Sci. Geogr. Sin. 2011, 31, 257–263. [Google Scholar]
- Fang, C.L. Progress and the future direction of research into urban agglomeration in China. Acta Geogr. Sin. 2014, 69, 1130–1144. [Google Scholar]
- Guo, S.; Tao, X.; Liang, L. Exploring Natural and Anthropogenic Drivers of PM2.5 Concentrations Based on Random Forest Model: Beijing—Tianjin—Hebei Urban Agglomeration, China. Atmosphere 2023, 14, 381. [Google Scholar] [CrossRef]
- Liu, Y.; Zhao, N.; Vanos, J.K.; Cao, G. Effects of synoptic weather on ground-level PM2.5 concentrations in the United States. Atmos. Environ. 2017, 148, 297–305. [Google Scholar] [CrossRef]
- Muñoz, R.C.; Garreaud, R.; Rutllant, J.A.; Seguel, R.; Corral, M. New Observations of the Meteorological Conditions Associated with Particulate Matter Air Pollution Episodes in Santiago, Chile. Atmosphere 2023, 14, 1454. [Google Scholar] [CrossRef]
- Li, C.; Wang, Z.; Li, B.; Peng, Z.; Fu, Q. Investigating the relationship between air pollution variation and urban form. Build. Environ. 2019, 147, 559–568. [Google Scholar] [CrossRef]
- Tobler, W.R. A computer movie simulating urban growth in the Detroit region. Econ. Geogr. 1970, 46, 234–240. [Google Scholar] [CrossRef]
- Huang, Y.; Zeng, N.; Liu, Z.; Ye, S.; Xuan, X.U. Wind tunnel simulation of pollutant dispersion inside street canyons with galleries and multi-level flat roofs. J. Hydrodyn. Ser. B 2016, 28, 801–810. [Google Scholar] [CrossRef]
- She, Q.; Peng, X.; Xu, Q.; Long, L.; Wei, N.; Liu, M.; Jia, W.; Zhou, T.; Han, J.; Xiang, W. Air quality and its response to satellite-derived urban form in the Yangtze River Delta, China. Ecol. Indic. 2017, 75, 297–306. [Google Scholar] [CrossRef]
- Li, F.; Zhou, T. Effects of urban form on air quality in China: An analysis based on the spatial autoregressive model. Cities 2019, 89, 130–140. [Google Scholar] [CrossRef]
- Si, M. Study on the Influence of Urban Form on Air Quality in Shandong Province; Shandong University of Finance and Economics: Jinan, China, 2020. [Google Scholar]
- Wang, X.S.; Liu, J.Y.; Zhuang, D.F.; Wang, L.M. Spatial-temporal changes of urban spatial morphology in China. Acta Geogr. Sin. 2005, 60, 392–400. [Google Scholar]
- Superti, V.; Merino-Saum, A.; Baur, I.; Binder, C.R. Unraveling how the concept of circularity relates to sustainability: An indicator-based meta-analysis applied at the urban scale. J. Clean. Prod. 2021, 315, 128070. [Google Scholar] [CrossRef]
- Anselin, L.; Getis, A. Spatial statistical analysis and geographic information systems. Ann. Reg. Sci. 1992, 26, 19–33. [Google Scholar] [CrossRef]
- Wang, J.F.; Li, X.H.; Christakos, G.; Liao, Y.L.; Zhang, T.; Gu, X.; Zheng, X.Y. Geographical detectors-based health risk assessment and its application in the neural tube defects study of the Heshun Region, China. Geogr. Inf. Syst. 2010, 24, 107–127. [Google Scholar] [CrossRef]
- Wang, J.; Zhang, T.; Fu, B. A measure of spatial stratified heterogeneity. Ecol. Indic. 2016, 67, 250–256. [Google Scholar] [CrossRef]
- World Health Organization. WHO Global Air Quality Guidelines: Particulate Matter (PM2.5 and PM10), Ozone, Nitrogen Dioxide, Sulfur Dioxide and Carbon Monoxide; World Health Organization: Geneva, Switzerland, 2021. [Google Scholar]
- Kalnay, E.; Cai, M. Impact of urbanization and land-use change on climate. Nature 2003, 423, 528–531. [Google Scholar] [CrossRef] [PubMed]
- UNDESA United Nations. World Urbanization Prospects: The 2018 Revision; United Nations: New York, NY, USA, 2018; p. 26. [Google Scholar]
- Lu, C.; Liu, Y. Effects of China’s urban form on urban air quality. Urban Stud. 2016, 53, 2607–2623. [Google Scholar] [CrossRef]
- Huang, C.; Hu, T.; Duan, Y.; Li, Q.; Chen, N.; Wang, Q.; Zhou, M.; Rao, P. Effect of urban morphology on air pollution distribution in high-density urban blocks based on mobile monitoring and machine learning. Build. Environ. 2022, 219, 109173. [Google Scholar] [CrossRef]
- Zhou, S.; Peng, S.; Wang, M.; Shen, A.; Liu, Z. The Characteristics and Contributing Factors of Air Pollution in Nanjing: A Case Study Based on an Unmanned Aerial Vehicle Experiment and Multiple Datasets. Atmosphere 2018, 9, 343. [Google Scholar] [CrossRef]
- Cho, H.; Choi, M.J. Effects of compact urban development on air pollution: Empirical evidence from Korea. Sustainability 2014, 6, 5968–5982. [Google Scholar] [CrossRef]
- Song, Y. Smart growth and urban development pattern: A comparative study. Int. Reg. Sci. Rev. 2005, 28, 239–265. [Google Scholar] [CrossRef]
- Ding, W.; Tong, Z. An approach for simulating the street spatial patterns. Build. Simul. 2011, 4, 321–333. [Google Scholar] [CrossRef]
- Fang, C.; Liu, H.; Wang, S. The coupling curve between urbanization and the eco-environment: China’s urban agglomeration as a case study. Ecol. Indic. 2021, 130, 108107. [Google Scholar] [CrossRef]
- Liu, Y.; Xu, Y.; Zhang, F.; Shu, W. A preliminary study on the influence of Beijing urban spatial morphology on near-surface wind speed. Urban Clim. 2020, 34, 100703. [Google Scholar] [CrossRef]
- Stoddart, D.R. The shape of atolls. Mar. Geol. 1965, 3, 369–383. [Google Scholar] [CrossRef]
- Boyce, R.R.; Clark, W.A. The concept of shape in geography. Geogr. Rev. 1964, 54, 561–572. [Google Scholar] [CrossRef]
- Cai, B.; Zhang, Z.; Liu, B.; Zhou, Q. Spatial-temporal changes of Tianjin urban spatial morphology from 1978 to 2004. J. Geogr. Sci. 2007, 17, 500–510. [Google Scholar] [CrossRef]
- Jia, Y.; Tang, L.; Xu, M.; Yang, X. Landscape pattern indices for evaluating urban spatial morphology—A case study of Chinese cities. Ecol. Indic. 2019, 99, 27–37. [Google Scholar] [CrossRef]
- Al-mulali, U. Factors affecting CO2 emission in the Middle East: A panel data analysis. Energy 2012, 44, 564–569. [Google Scholar] [CrossRef]
- Bhandari, S.; Zhang, C. Urban Green Space Prioritization to Mitigate Air Pollution and the Urban Heat Island Effect in Kathmandu Metropolitan City, Nepal. Land 2022, 11, 2074. [Google Scholar] [CrossRef]
- Wang, B.; Li, Y.; Tang, Z.; Cai, N.; Niu, H. Effects of vehicle emissions on the PM2.5 dispersion and intake fraction in urban street canyons. J. Clean. Prod. 2021, 324, 129212. [Google Scholar] [CrossRef]
- Golany, G.S. Urban design morphology and thermal performance. Atmos. Environ. 1996, 30, 455–465. [Google Scholar] [CrossRef]
- Wang, J.; Li, Y.; Wang, Q.; Cheong, K.C. Urban—Rural construction land replacement for more sustainable land use and regional development in China: Policies and practices. Land 2019, 8, 171. [Google Scholar] [CrossRef]
- Song, Y.; Wang, J.; Ge, Y.; Xu, C. An optimal parameters-based geographical detector model enhances geographic characteristics of explanatory variables for spatial heterogeneity analysis: Cases with different types of spatial data. Gisci. Remote Sens. 2020, 57, 593–610. [Google Scholar] [CrossRef]
- Li, L.; Li, Q.; Huang, L.; Wang, Q.; Zhu, A.; Xu, J.; Liu, Z.; Li, H.; Shi, L.; Li, R. Air quality changes during the COVID-19 lockdown over the Yangtze River Delta Region: An insight into the impact of human activity pattern changes on air pollution variation. Sci. Total Environ. 2020, 732, 139282. [Google Scholar] [CrossRef]
- Luo, X.; Sun, K.; Li, L.; Wu, S.; Yan, D.; Fu, X.; Luo, H. Impacts of urbanization process on PM2.5 pollution in “2 + 26” cities. J. Clean. Prod. 2021, 284, 124761. [Google Scholar] [CrossRef]
- Wan, Y.; Yuan, L.; Xu, X. Adopting urban morphological indicators to land use regression modeling of seasonal mean PM2.5 concentrations for a high-density city. Air Qual. Atmos. Health 2022, 15, 559–573. [Google Scholar] [CrossRef]
- Ulpiani, G. On the linkage between urban heat island and urban pollution island: Three-decade literature review towards a conceptual framework. Sci. Total Environ. 2021, 751, 141727. [Google Scholar] [CrossRef]
- US EPA. Control of Air Pollution from New Motor Vehicles: Heavy-Duty Engine and Vehicle Standards; US EPA: Washington, DC, USA, 2022. [Google Scholar]
Disclaimer/Publisher’s Note: The statements, opinions and data contained in all publications are solely those of the individual author(s) and contributor(s) and not of MDPI and/or the editor(s). MDPI and/or the editor(s) disclaim responsibility for any injury to people or property resulting from any ideas, methods, instructions or products referred to in the content. |
© 2023 by the authors. Licensee MDPI, Basel, Switzerland. This article is an open access article distributed under the terms and conditions of the Creative Commons Attribution (CC BY) license (https://creativecommons.org/licenses/by/4.0/).