Article

4D Models Generated with UAV Photogrammetry for Landfill Monitoring Thermal Control of Municipal Solid Waste (MSW) Landfills

by
Javier Sedano-Cibrián
1,*,
Julio Manuel de Luis-Ruiz
1,
Rubén Pérez-Álvarez
1,
Raúl Pereda-García
1 and
Jonathan Daniel Tapia-Espinoza
2
1
Grupo de Investigación de Ingeniería Cartográfica y Explotación de Minas, Escuela Politécnica de Ingeniería de Minas y Energía, Universidad de Cantabria, Boulevard Ronda Rufino Peón, 254, Tanos, 39300 Torrelavega, Spain
2
Escuela de Ingeniería Química, Pontificia Universidad Católica de Valparaíso, Valparaíso 2340025, Chile
*
Author to whom correspondence should be addressed.
Appl. Sci. 2023, 13(24), 13164; https://doi.org/10.3390/app132413164
Submission received: 15 November 2023 / Revised: 8 December 2023 / Accepted: 9 December 2023 / Published: 11 December 2023
(This article belongs to the Special Issue Technical Advances in UAV Photogrammetry and Remote Sensing)

Abstract

:
The management of the increasing volume of municipal solid waste is an essential activity for the health of the environment and of the population. The organic matter of waste deposited in landfills is subject to aerobic decomposition processes, bacterial aerobic decomposition, and chemical reactions that release large amounts of heat, biogas, and leachates at high temperatures. The control of these by-products enables their recovery, utilization, and treatment for energy use, avoiding emissions to the environment. UAVs with low-cost thermal sensors are a tool that enables the representation of temperature distributions for the thermal control of landfills. This study focuses on the development of a methodology for the generation of 3D thermal models through the projection of TIR image information onto a 3D model generated from RGB images and the identification of thermal anomalies by means of photointerpretation and GIS analysis. The novel methodological approach was implemented at the Meruelo landfill for validation. At the facility, a 4D model (X,Y,Z-temperature) and a 13.8 cm/px GSD thermal orthoimage were generated with a thermal accuracy of 1.63 °C, which enabled the identification of at least five areas of high temperatures associated with possible biogas emissions, decomposing organic matter, or underground fires, which were verified by on-site measurements and photointerpretation of the RGB model, in order to take and assess specific corrective measures.

1. Introduction

Urbanization and industrial development lead to an increase in municipal solid waste (MSW) [1], and managing the growing volume of waste is a worldwide problem. Waste disposal is the last of the alternatives in the hierarchy of MSW management alternatives [2]. However, despite the promotion of recycling and incineration initiatives to reduce the volume of waste, the most commonly used alternative is landfilling [3]. Considering the growth in the volume of waste [4], as well as the potential risk to the environment and human health [5], the control and monitoring of landfills is an essential activity to avoid the materialization of such risks.
Landfills can be defined as bioreactors [6] where the stored organic matter reacts as a consequence of storage conditions, exposure to aerobic decomposition processes, aerobic bacterial decomposition, and chemical reactions [7]. Exothermic reactions release large amounts of heat, which is the main by-product of the spontaneous decomposition of organic matter in landfills, along with leachate and landfill gas [8]. The percentage and volume of each by-product generated depends on several factors: the characteristics of the waste, such as its age and composition, the chemical products present, and environmental factors related to temperature, humidity, and oxygen content [9]. The gas generated by the decomposition of organic matter is called biogas or landfill gas (LFG). It is composed of 45–60% methane (CH4), 40–60% carbon dioxide (CO2), 2–5% nitrogen (N2), 0.1–1% oxygen (O2), and other gas fractions in lower percentages, including ammonia (NH3), carbon monoxide (CO), hydrogen (H), sulfides, and non-methane organic compounds (NMOC) such as benzene, vinyl chloride, and trichloroethylene [10].
The set of decomposition processes and exothermic reactions reach temperatures of 30–45 °C under normal landfill operating conditions [11]. However, it is possible for the temperature to rise to values of 55–70 °C, and these temperature peaks can be maintained for several years [12]. It is estimated that 40% of the LFG leaks into the atmosphere [13], releasing large amounts of methane, a greenhouse gas with a global warming potential 28 times higher than carbon dioxide [14]. The hot biogas generated in the deep areas of the landfill migrates to the surface, passing through the waste and increasing the temperature in the landfill piles [15]. As a consequence of the thermal processes typical of landfills that occur at depths between 20 and 60 m [8], their upper zone reaches temperatures up to 4–10 °C higher than those of neighboring areas [16].
The accumulated heat from exothermic reactions and the volatility of the gases generated make landfills prone to surface fires and the slow-burning of MSW below [10]. High temperatures affect the proper functioning of landfills, influencing gas generation, leachate quality, slope stability, and landfill integrity, and may also affect human health and the environment due to gas emissions into the atmosphere and the release of incomplete combustion products as a result of fires [17,18]. This requires monitoring and control of the landfill for at least 20 years after landfill closure [19].
The set of reactions and processes that take place in landfills induce variations in their surface temperature. These thermal anomalies of the surface zone associated with temperature increases generate hot spots that can be directly related to methane emissions to the atmosphere or to superficial or underground fires [20]. The identification of anomalies is an essential activity during landfill monitoring to avoid the risk of fire and maximize gas recovery, avoiding environmental effects and guaranteeing the landfill’s energetic use [21]. Conventional techniques for the detection of thermal anomalies and landfill gas emissions are time consuming and have limited accuracy [22]. In light of this problem, unmanned aerial vehicles (UAV) have emerged as an alternative capable of overcoming the difficulties of current techniques [23]. The advantages of size, weight, flexibility, speed, and cost [24] offered by this type of equipment have enabled its implementation in the management of municipal solid waste landfills and dumpsites [25]. UAVs have been used for landfill growth monitoring [26], topographic and volumetric control of landfills [27], safety and integrity inspections of facilities [28], monitoring of LFG emissions [29], and identification of possible fires [10], and assessing the evolution of emitted environmental pollution [30]. This study proposes the control and identification of hot spots, an essential activity for MSW landfill managers, which enables the detection of LFG emissions and the channeling of them through collection wells for utilization or incineration. On the other hand, other techniques can be used to reduce LFG production, such as the aeration or gasification of organic matter prior to landfill disposal.
The miniaturization of sensors has enabled UAVs to carry thermographic sensors [31] to capture thermal images (TIR) that determine the temperature of the imaged surface. The combination of UAV images and photogrammetry enables the representation of temperature distributions in thermal heat maps, thermal orthomosaics [32], and thermal 3D models [33] from the reconstruction of the scene based on two-dimensional images [34]. The combination of UAV thermal images and photogrammetry has been used for the identification of hot spots associated with different risk factors such as LGF emissions [1,22] and landfill fires [10,35] based on 2D orthoimages. However, 3D thermal models and representations of the surface are a tool with great potential since, in addition to providing temperature information, they enable representation of the position in space and the real geometry of the object, benefiting from the three-dimensional component of space, which favors the complete interpretation of the area and the approach of the proposed solution, since the studies are carried out using 4D (X,Y,Z-temperature) representations, in which the X,Y,Z dimensions represent the position of the point in space and the fourth dimension (T) represents the surface temperature of the point.
Similar issues relating to the thermal monitoring of landfills have been previously addressed by other authors. Firstly, Lewis et al. [13] analyzed the different existing methodologies for leakage detection and control, paying special attention to infrared thermography techniques. The authors evaluated the capability of infrared thermography for LFG leak detection in an investigation based on the analysis of images taken with hand-held sensors, concluding that the technique at that time could only be used as an approximate alternative and not as an accurate tool for detecting LFG leaks. Subsequently, Yan et al. [3] proposed a methodology for MSW disposal site monitoring using satellite imagery. The proposed technique, which is based on multi-temporal Landsat imagery, enables the monitoring of the land surface temperature of MSW landfills, showing how the temperature of an analyzed landfill is more than 4 °C higher than the immediately surrounding areas. A similar alternative was later proposed by Nazari et al. [35], who developed a methodology for the identification of surface fires and their migration in landfills using satellite thermal images of moderate spatial resolution. Their proposed technique is based on the processing of Landsat images using an in-house MATLAB code to generate multitemporal thermal maps of the study area to identify and flag hot spots and thermal anomalies. Along the lines proposed in the aforementioned research, the use of UAVs in this field has also been evaluated by other researchers. Lega and Napoli [19] introduced an integrated system based on a sensor array for a UAV, combining an infrared camera and air quality sensors to detect thermal emissions and physical and chemical parameters with an orientation toward landfill monitoring. The proposed system enables the monitoring of concentrations, spills, and leachates for the management of waste dumps and illegal discharges. The use of UAVs equipped with methane detectors was proposed by Emran et al. [36] to discover and monitor methane leaks over large areas with remote access in a rapid and economical manner. The proposed technique was based on the use of a multirotor UAV with an off-the-shelf laser-based methane detector for the generation of landfill methane concentration maps quickly and efficiently. Fjelted et al. [37] investigated and analyzed the relationship between ground surface temperature and LFG emissions in landfills under different atmospheric conditions. Their analysis was based on contrasting measurement campaigns under different conditions for capturing UAV images; complementing measurements of methane and carbon dioxide emissions were taken at each measuring point with a static flux chamber to assess the evolution of the results with GIS. Monster et al. [38] compiled different methodologies for the measurement of CH4 emissions in a review, considering vertical soil gas concentration profiles, surface flux chambers, radial plume mapping, and mass balances using aerial measurements or differential absorption LiDAR, among other methods. The review collects alternatives to infrared sensors and CH4 concentration instruments for UAVs, considering the present alternatives to not be very accurate in creating 2D maps of concentrations or carrying out field infrared surveys by capturing TIR images with UAVs. Tanda et al. [1] proposed a novel approach for UAV TIR image processing to generate heat maps for the detection of thermal anomalies in surface temperatures and their relationship with local biogas escaping in landfills that leave a thermal footprint. Their research focuses on the determination of methane flows in hot spots identified through visual analysis and photointerpretation of two-dimensional heat maps. More recently, Sliusar et al. [25] developed a comprehensive review of drone technology in MSW landfill management and control. Their paper mentions how most of the publications related to this technology focus on monitoring the emissions of landfill gas or its individual components, mainly methane. In relation to the subject matter, it highlights the capacity of aerial thermal imaging to generate heat maps, orthoimages, and 3D thermal models of the surface, but it does not detail the processing methodology or workflow to obtain them. Complementarily, the review highlights the scarce experience of the current technique in analyzing UAV photogrammetry-derived products using GIS tools in landfill areas despite the multiple advantages of this type of imagery [39].
The present study focuses on the development of a methodological proposal for the generation of 4D models of a landfill surface using UAV thermal images for the identification of thermal anomalies through the processing of images with Geographic Information Systems (GIS). The methodology is developed through its application to a specific case, with the modeling of an active MSW landfill for its control and periodic monitoring, enabling a follow-up of the proper functioning of the LFG collection systems. In case hot spots are identified, it allows their geolocation for the application of corrective measures by the landfill regulator.
Conventionally, the activities at a landfill consist of a set of operations for the disposal, compaction, covering, and control of sediments. Within this set of tasks is thermal control, which includes biogas control. In order to reduce LFG emissions, different strategies can be employed for MSW management in landfills. There are composting and gasification strategies for the organic matter fraction of MSW prior to landfill, which enable both the extraction of biogas and reductions in the volume of waste in the landfill. However, despite the various filters and treatments applied, it is impossible to eliminate all of the organic matter, which, once deposited, decomposes and generates LFG. At this point, biogas control also requires minimizing subsurface migration and atmospheric emissions, protecting groundwater, reducing the risk of fire, protecting structures, and gas collection for energy use. To this end, during waste compaction, pathways are created to allow the flow of biogas and leachate to drainage areas or catchment pits, minimizing risks. This system can be passive or active, depending on whether the migration is done naturally through pressure differences or is forced [21].
This set of processes induces increases in landfill temperatures. There are three main strategies for temperature management: heat extraction, regulation, and supplementation. The different strategies enable both the use of heat and biogas to cover energy needs or to produce energy as well as the regulation of the landfill temperature around 35–45 °C to maximize biogas production and its subsequent use [40]. Under normal operating conditions, the landfill temperature is kept stable by the extraction and collection of LFG and the removal of excess heat. From all of the above, it can be deduced that thermal monitoring of MSW is fundamental for the correct operation of landfills, and this monitoring can be carried out by means of thermal orthoimages generated with images obtained with low-cost sensors installed in UAVs.

2. Methods

The development of UAV uses is limited by the gap between technology and the methodological approaches for application [25]. Achieving a simultaneous development requires parallel research in both areas. This study proposes a methodology for the generation of 3D thermal models of the MSW landfill surface using RGB and TIR images captured with low-cost dual sensors for their subsequent interpretation using GIS, oriented to the quasi-automatic identification of thermal anomalies with potential fire risks to estimate their possible behavior.

2.1. Data and Thermal Imaging Capture with Low-Cost UAVs

Images are the fundamental basis of photogrammetry for the generation of three-dimensional models or orthoimages [41]. In the field of UAVs, images are generally captured on the basis of preprogrammed automatic flights that are designed according to the needs of the project objective [42]. At present, despite the losses in sensitivity and accuracy associated with low-cost UAVs, they are the most widely used alternative in several investigations [43]. This study proposes the use of dual sensors integrating an infrared thermal sensor and a non-metric visual sensor, enabling the capture of RGB and TIR images simultaneously from the same point of view [44]. Working with this type of low-cost equipment requires careful work during the planning and execution of the activities in order to overcome their limitations and obtain accurate results [45].
To capture the images, the flight plan must be designed to adhere to the requirements of the model’s objective and the specifications of the platform and low-cost dual sensor to be used. The whole set of flight parameters to be defined must take into account the resolution, sensitivity, and contrast limitations of the most limiting equipment, generally the thermal sensor [46]. The flight design is usually performed by specific software automatically by inserting the initial flight parameters [47] described below. For the capture of the photogrammetric block of large areas such as landfills, it is advisable to use nadiral flights with flight heights high enough to achieve a ground sample distance (GSD) suitable for the application [48], in this case the identification of thermal anomalies, where the decimeter accuracies are sufficient to set the detection of a possible hot spot. On the other hand, the frontlap and sidelap used for TIR capture set high values with respect to UAV photogrammetry for visual images, proposing values higher than 70% [49] or even more in both cases [50]. The last parameter to consider is the flight speed, which determines the total flight time, a factor to be taken into account due to UAV autonomy limitations. It is set below 3 m/s to avoid resolution, sharpness, and contrast issues associated with TIR images [51].
In order to obtain an accurate thermal model, which also enables the correct quasi-automatic identification of thermal anomalies, the planning also has to take into account the surface emissivity, the sensor stabilization, and the atmospheric conditions of the day of flight. The emissivity of the surface materials will depend on the nature of the MSW, so a suitable value needs to be adapted for the characterization of the entire landfill. Due to the instability of low-cost infrared sensors, it is recommended to set a sensor stabilization time of about 30 min before taking flight [52,53]. Finally, atmospheric and climatological conditions determine relevant parameters such as the ambient temperature, wind, solar radiation, and cloudiness. When scheduling the flight, in order to minimize the effect of solar radiation and maximize the temperature difference between the hot spot and the rest of the landfill, the summer season should be avoided [1,4], and flying in the early hours of the day before sunrise or after sunset is preferable [13].
Finally, in order to correctly georeference the RGB and TIR images, ground control points (GCPs), which are one of the most influential parameters in the final accuracy of the model [54,55], are used in a standardized manner. For this purpose, metallic plates can be used, as they are visible in both types of images. These plates must be distributed homogeneously along the landfill to be represented [56,57]. In addition, the use of thermal control points (TCPs) is proposed, which enables the contrasting of the temperature measured with the UAV sensor and the surface temperature in order to thermally calibrate the final model, adjusting it more closely to reality [58]. For this purpose, at least three TCPs distributed along the surface should be used, from which the temperature is measured with a hand-held sensor or other more accurate device [52].

2.2. Photogrammetric Processing of RGB and TIR Images

The application of photogrammetry for the generation of 3D thermal and orthomosaic models with thermal images presents a large gap with respect to the quality of the representations obtained with RGB images, mainly due to the lack of resolution, contrast, and homogeneity in the TIR images [59]. The standardized methods for photogrammetry with RGB images do not obtain the same results when working with TIR images. The representations with the temperature variable can be obtained by implementing different strategies [60], from the single application of thermal images to generate the model [61], the texturing of 3D models with TIR images [62], or the implementation of four-band images through the fusion of RGB and TIR images [63].
This study proposes a methodology resulting from the combination of different strategies based on the simultaneous capture of RGB and TIR images with low-cost dual sensors. Based on previous works, the proposal is based on solving the problems in the alignment of the thermal images of the structure from motion (SfM) algorithms used in modern photogrammetry [64] by implementing the optimized external orientation parameters (X, Y, Z coordinates and pitch, yaw, and roll angles) of the RGB images to position the TIR images [46].
The proposed method (Figure 1) is based on the processing of RGB images following the conventional workflow standardized for SfM photogrammetry software. First, the images are aligned by identifying homologous points through scale invariant feature transform (SIFT) algorithms, enabling the generation of sparse point clouds. The optimization of the orientation of the images and georeferencing of the model is achieved through GCP registration, which subsequently obtains a dense point cloud using multi-view stereo (MVS) algorithms [65]. Finally, once the point cloud is obtained, the SfM photogrammetry software enables the generation of 3D models, meshes, orthomosaics, and textures. Then, using the thermal images, the model generated with the RGB images is taken as a basis. The TIR images are oriented on it using the optimized orientation parameters of the homologous RGB images to project the radiometric information on the model. Thus, the thermal 3D model is generated, which includes the temperature for each represented point and enables acquisition of a thermal orthoimage that shows the distribution of the surface temperatures of the landfill.

2.3. D Thermal Model Calibration

The 3D thermal model obtained from the proposed workflow enables representation of the temperature for each point of the generated cloud. However, the temperature determined by the UAV sensor may differ from the real temperature of the modeled surface due to the large distance between the sensor and the captured point, the atmospheric conditions, the viewing angle, or the stability of low-cost equipment. To correct the error and obtain an accurate representation of the surface temperature distribution of the MSW piles of the landfill, the implementation of TCPs is proposed, which provides a higher accuracy than that obtained with the UAV sensor [58].
The temperature correction of the model is performed by determining the temperature deviation of the UAV model points with respect to the complementary sensor measurements, establishing an error that is applied through a correction in the model transformation. It can also be applied with a raster transformation in the GIS tool for the calibration of the thermal orthomosaic during its analysis.

2.4. Photointerpretation Analysis of Thermal Orthomosaics with GIS

The thermal orthoimage obtained is a two-dimensional raster representation showing the surface temperature gradient of the landfill in false color using a predetermined palette. The analysis and evaluation of the orthoimage for the identification of thermal anomalies associated with potential LFG emissions, fire hazards, or decomposing organic matter is performed through photointerpretation via visual analysis of the image, using GIS tools for correct visualization and editing.
Starting from the thermal orthomosaic and the RGB, a first photointerpretation of the image is proposed to identify hot spots according to the temperature gradient represented, which are associated with possible thermal anomalies. The identification of hot spots is made on the basis of a quantitative analysis via photointerpretation of the color code of the orthomosaic in false color. Areas whose color is associated with high temperatures are identified following the palette of the representation. This interpretation may be conditioned by the experience of the person in charge of this analysis and, therefore, the results may vary.
The area identified in GIS can be georeferenced and marked by alternating layers in the tool for its interpretation and the detection of possible causes in the RGB orthomosaic. The evaluation of the thermal anomaly in both images will enable justifying the determination of the cause of the temperature difference recorded, either through the existence of uncovered geomembranes, plastics, metallic elements, or pipes in the LFG collection system, as these elements are able to reach higher temperatures than the rest of the environment as a result of mere solar exposure without gasification; decomposition; or fire processes. In this way, the aim is to discard the areas with controlled behavior among thermal anomalies including potential risks such as fires, LFG emissions, etc., so that the appropriate corrective measures can be taken.

3. Method Validation
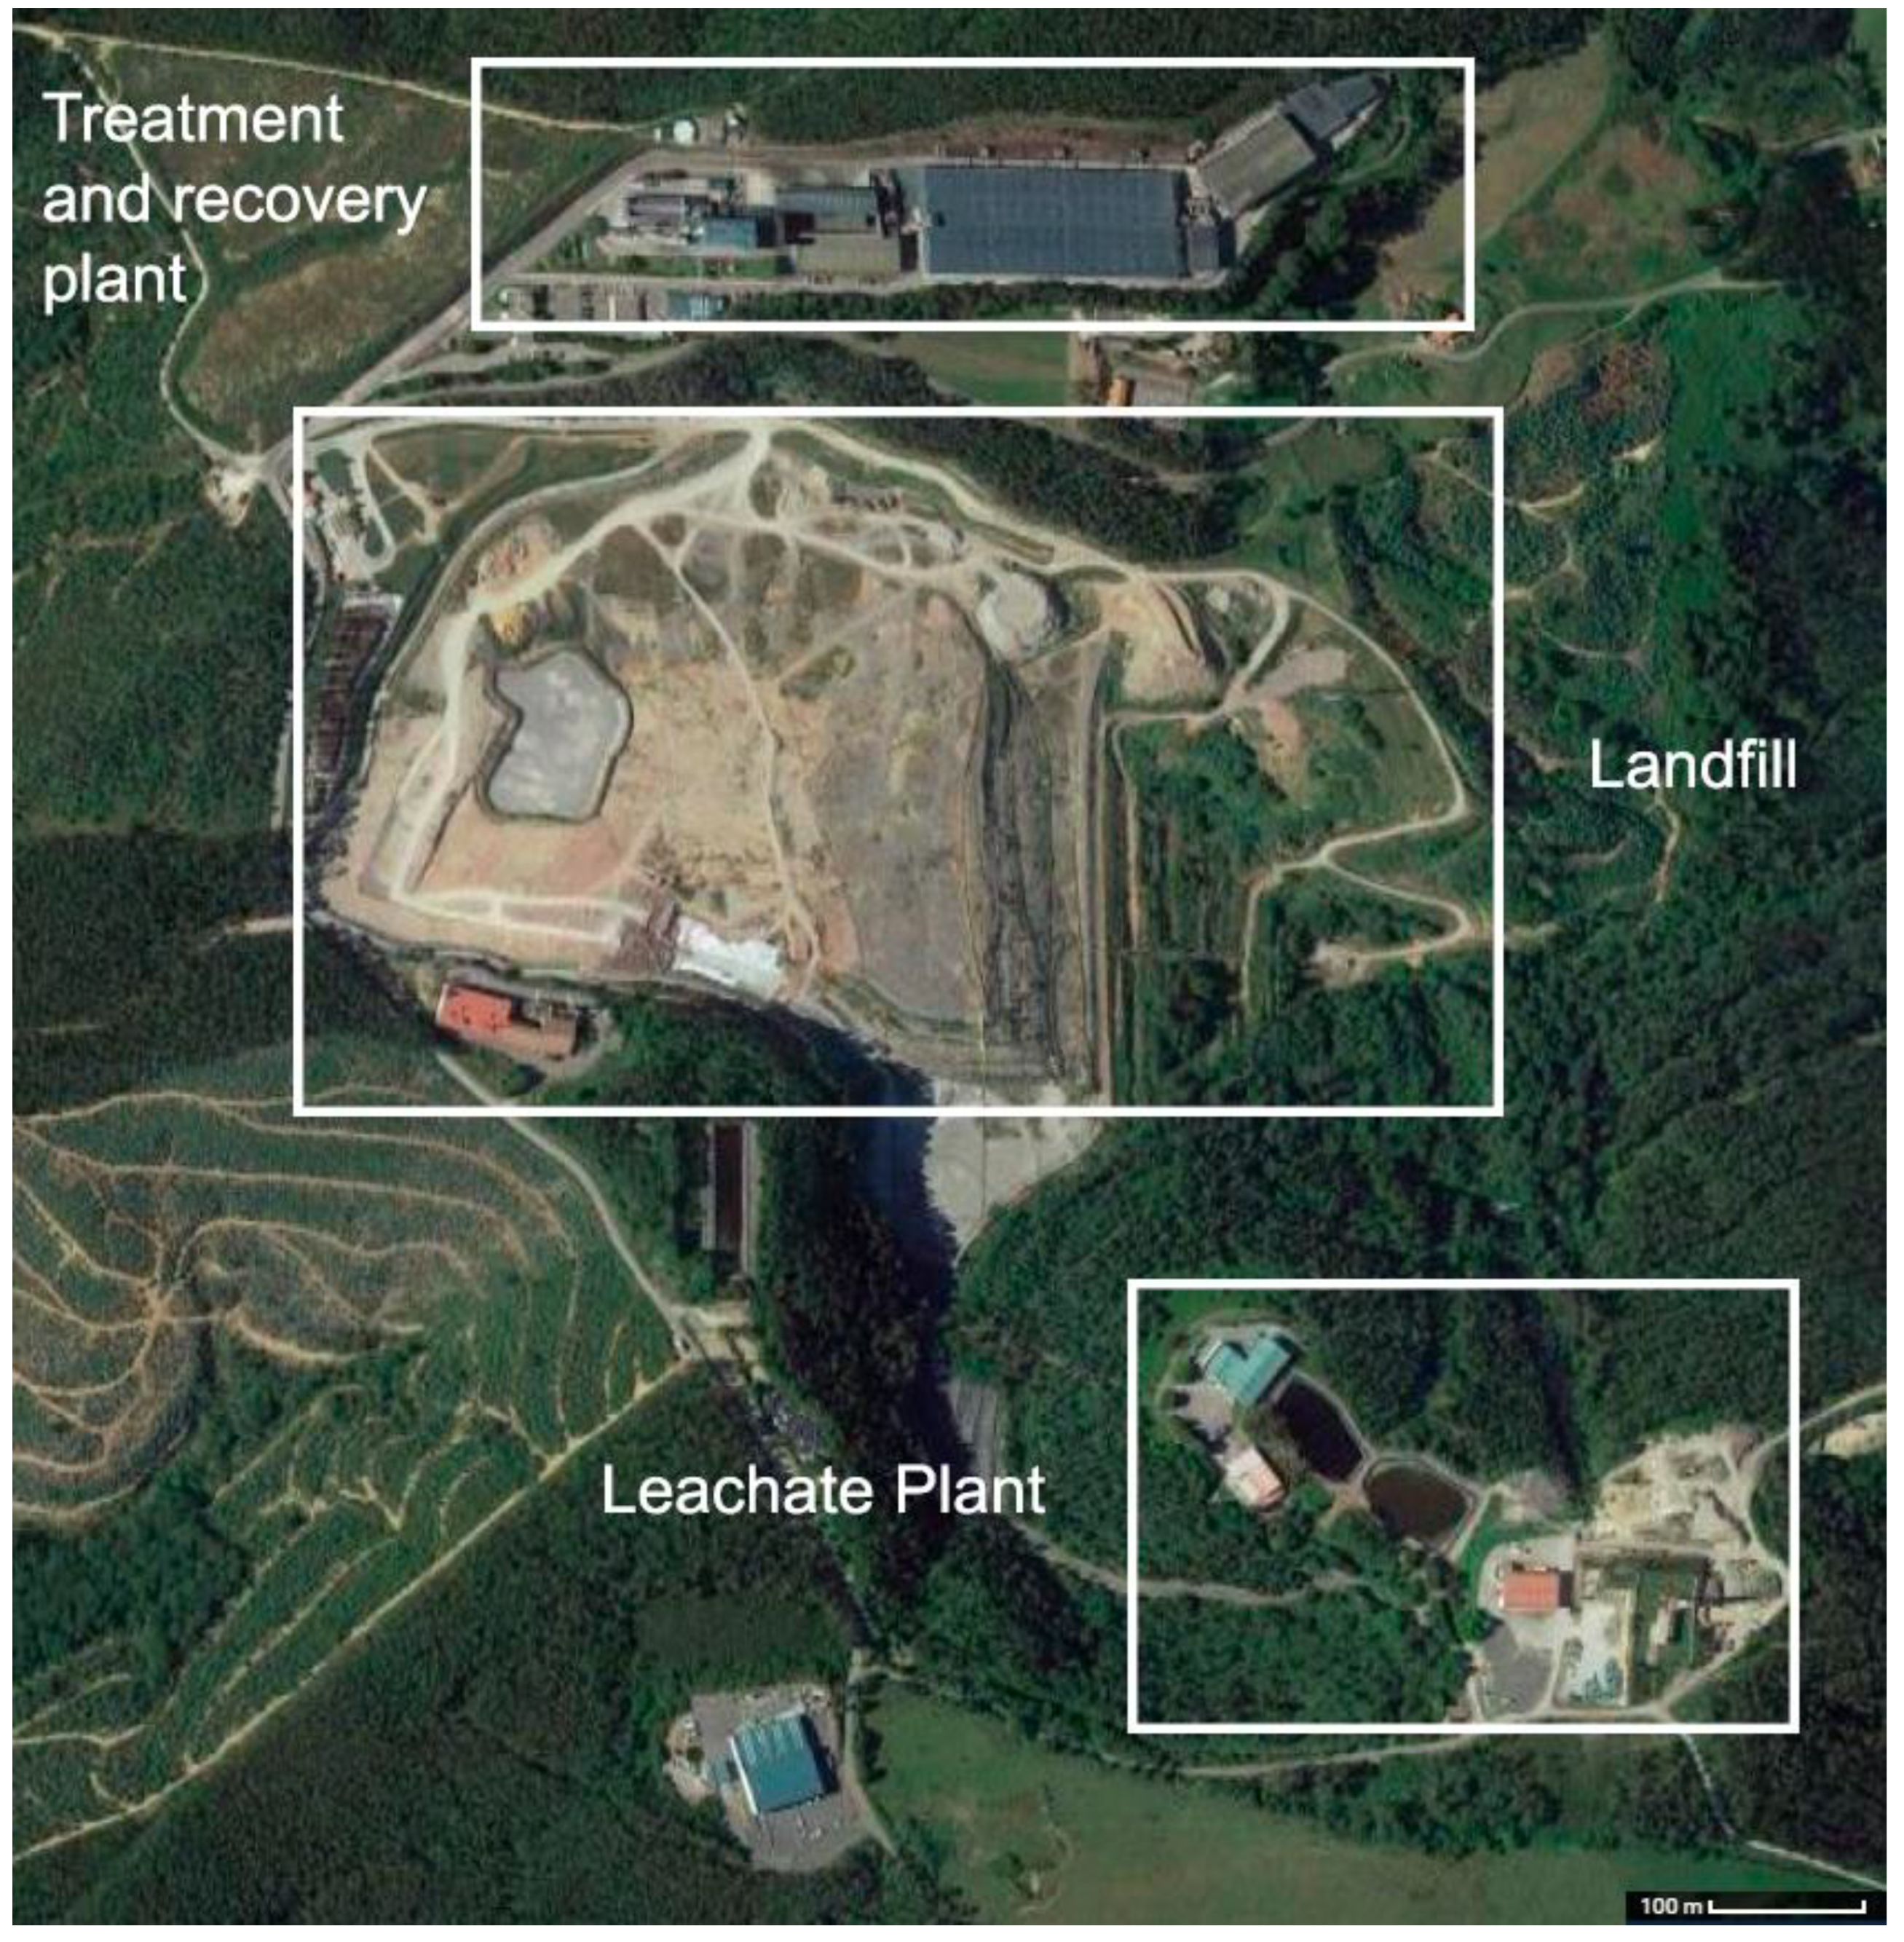
The methodology developed for the thermal control of landfills using 3D thermal models can be validated by implementing it in a real case study. Therefore, the application of the workflow to a MSW landfill for the identification of thermal anomalies was proposed. Once the thermal representation was generated and the hot spots with potential risk were identified, they were contrasted with the RGB representation to ensure the absence of a foreign element or surface that could be causing a false temperature measurements due to emissivity conditions different from the rest of the surface. Finally, a subsequent field visit verified the temperature measured by a complementary method and its subsequent in situ evolution analysis in order to corroborate the existence of the risk in order to take the necessary corrective measures, thus validating the proposed methodology.

3.1. Study Area

For the validation of the proposed methodology, the workflow was implemented in a landfill that met the appropriate conditions for its application. The Meruelo landfill is an integrated waste treatment center located in the autonomous community of Cantabria (Spain). It is a landfill whose waste is mainly organic (from MSW) or similar to urban waste, with a total capacity of 60,000,000 tons. The objective of the facility is to minimize the volume of MSW in landfill, for which it first implements waste pre-selection with a capacity of 65 t/h, separating recyclable materials such as cardboard, paper, and plastics, by means of magnetic and induction separators, from the organic matter. The organic matter from the recovery is subjected to waste energy recovery processes through degassing operations for the production of biogas and the generation of electrical and thermal energy with a cogeneration plant [66]. The facilities have an area of about 60 ha, and are divided into the MSW treatment and valorization plant, the leachate treatment plant, and the non-hazardous waste landfill (Figure 2). The latter is the area to be modeled from the UAV images.

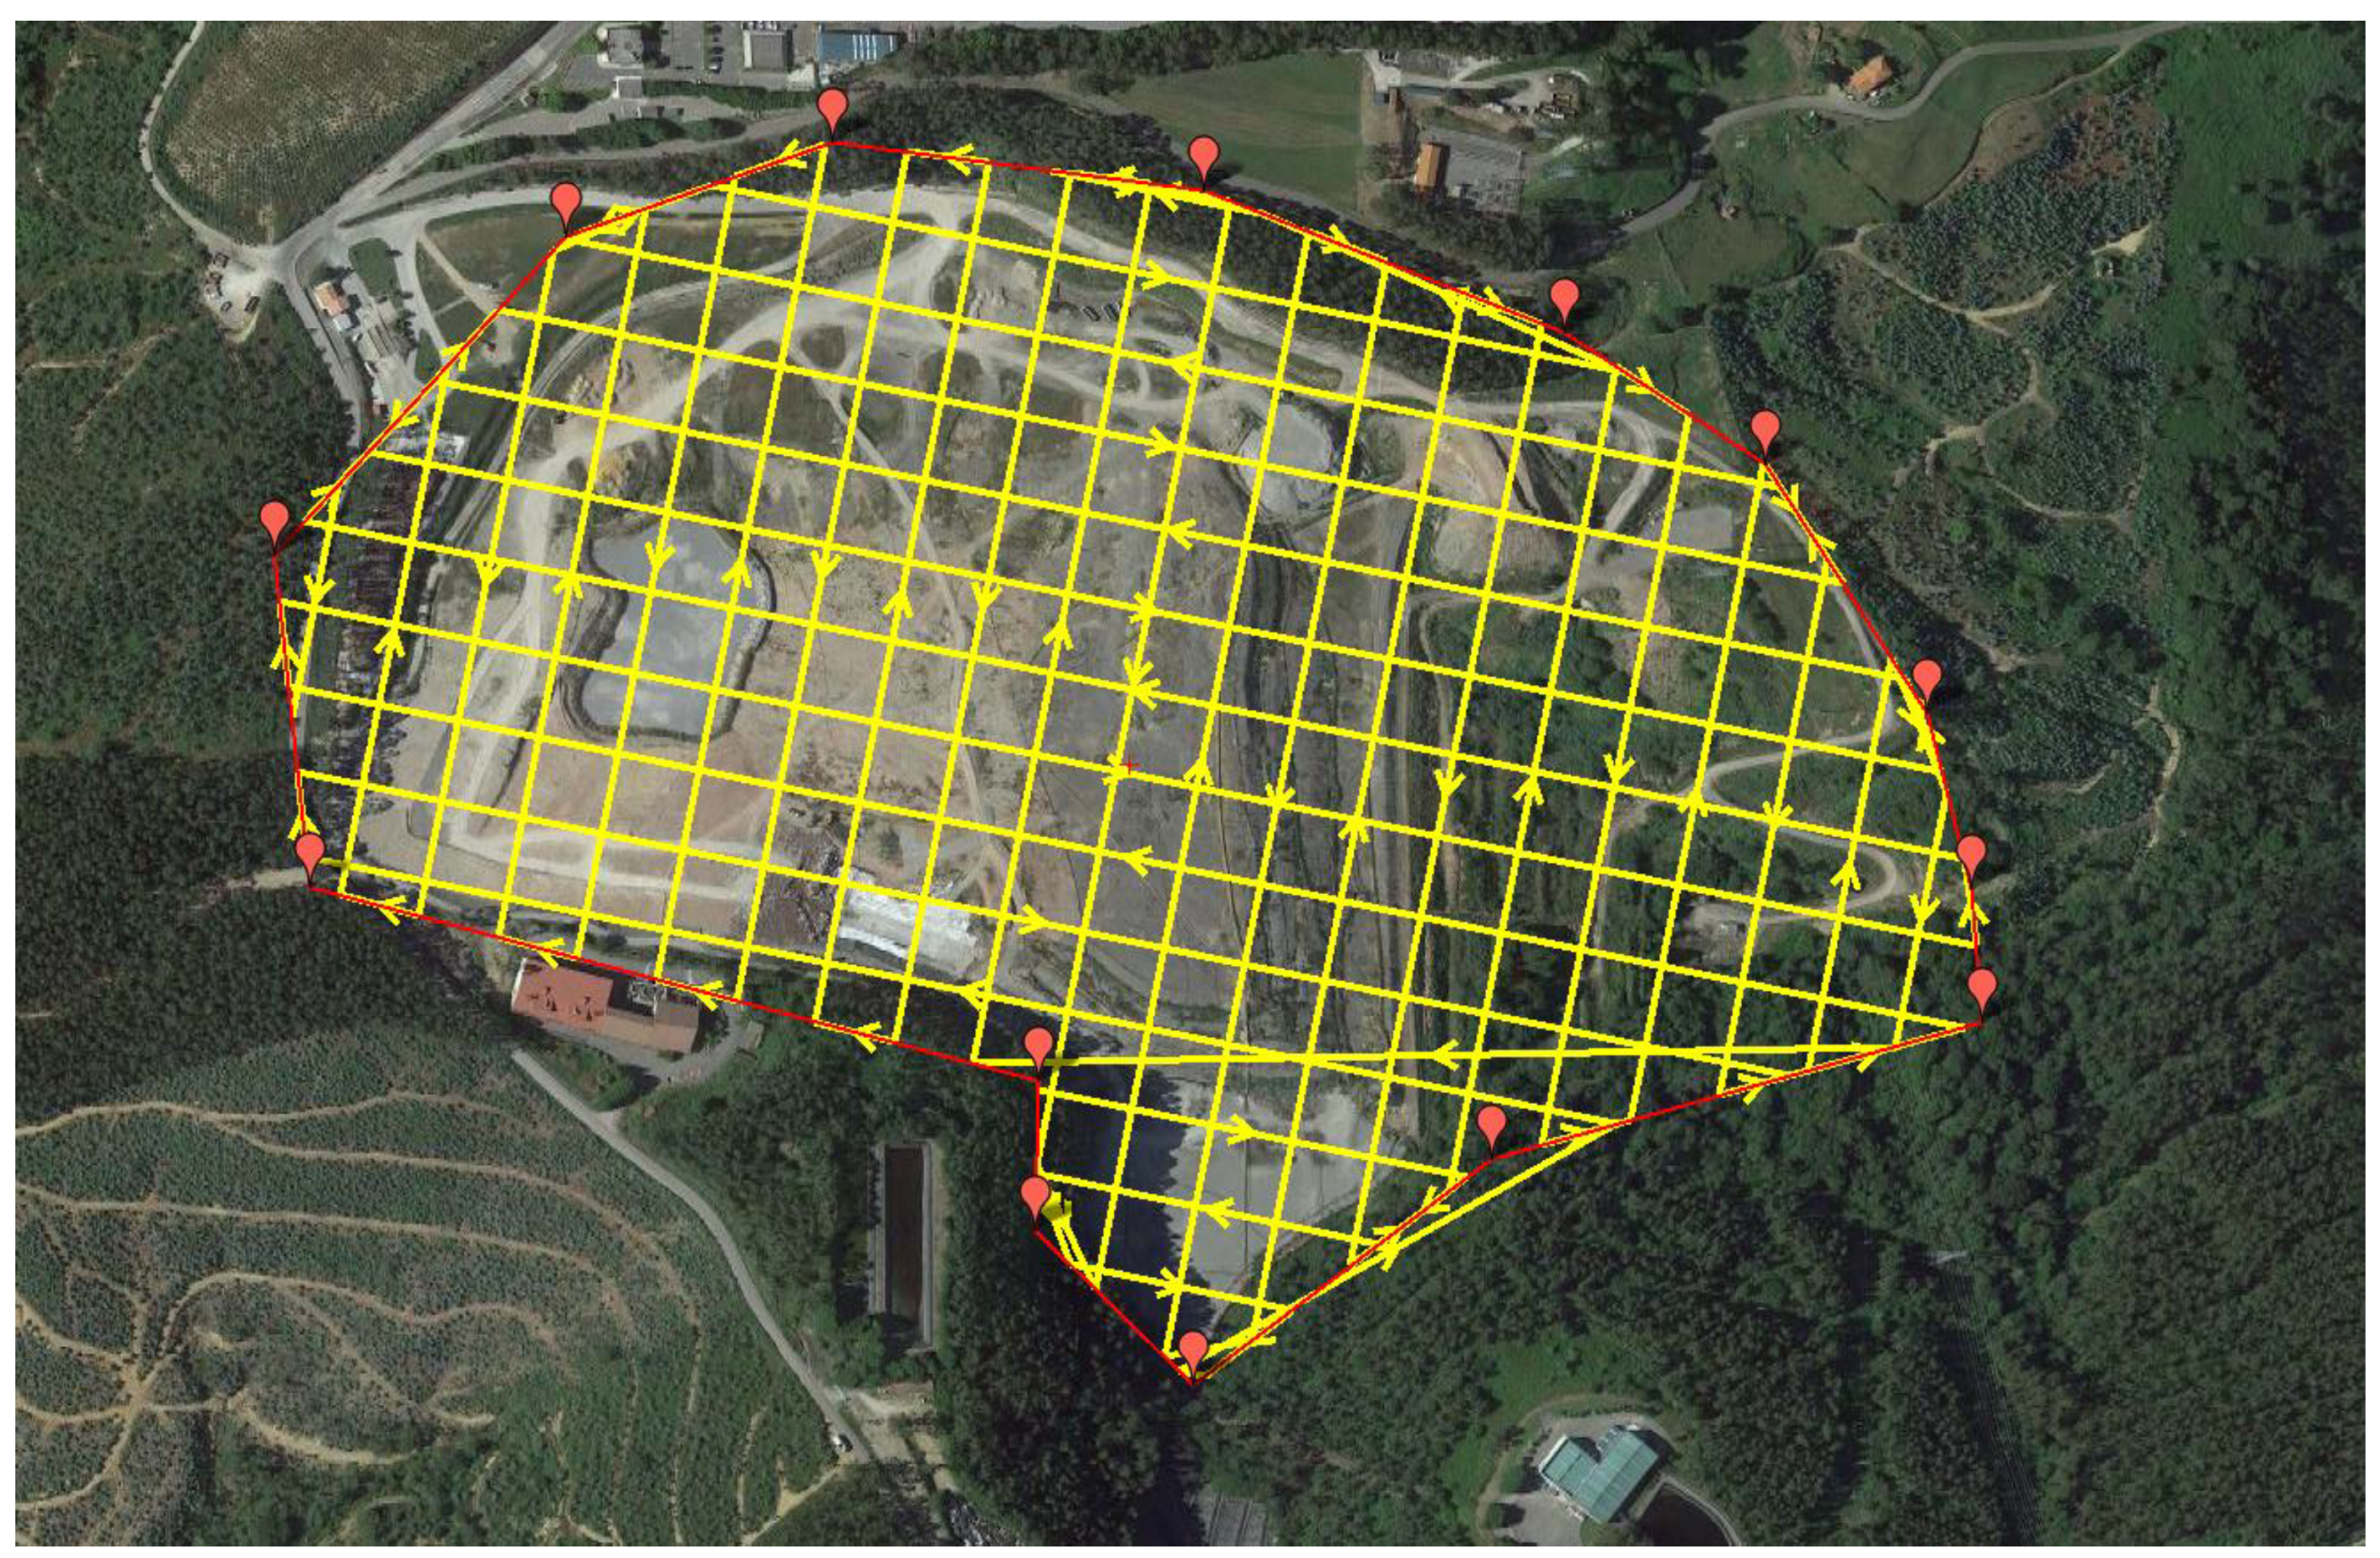
3.2. UAV Photogrammetric Flight

The photogrammetric flight for the capture of the RGB and TIR images was designed following the established recommendations for image capture with low-cost UAV equipment. The flight began at 9:00 a.m. with the image capture, after a previous wait of 30 min for the stabilization of the sensor. During the flight, the atmospheric conditions were favorable for data collection; the ambient temperature was 21 degrees and the skies were clear with no wind.
The platform used was a quadcopter multirotor, specifically a DJI Mavic 3T, which has an integrated dual M3T sensor (Figure 3). The main features and technical information of the UAV platform and the dual sensor cameras are shown in Table 1, Table 2 and Table 3.
The calibration of the RGB and thermal sensors was guaranteed by the company contracted for the photogrammetric flight. In addition, the self-calibration tool implemented by Agisoft Metashape was applied during the photogrammetric processing of the images for the generation of the 3D model. This step eliminates possible remaining lens distortions to ensure greater accuracy of the representation.
The automatic flight for image acquisition was designed using the proprietary software of the UAV to guarantee maximum compatibility. The sensor was configured with an inclination of 30° with respect to nadir to adequately capture the steep slopes of the landfill. The automatic flight designed and its main specifications are shown in Figure 4 and Table 4.
Complementarily, in order to guarantee the correct measurement of the surface temperature of the landfill, the thermal sensor was configured with an emissivity of 0.94 [67], which can be considered the average for the entire surface of the landfill due to the homogeneity of the MSW arrangement.
In addition to capturing the images, a total of 17 GCPs were distributed along the landfill to orient the images, scale, and georeference the model. The GCPs were evenly distributed throughout the study area at different heights. The coordinates of the GCPs were taken with GPS using a Leica GS-15 GPS device (Leica Geosystems, San Galo, Switzerland) in an official reference system (ETRS89-UTM Zone 30). Additionally, during the flight, the temperature was measured with a hand-held sensor at 10 geolocated points distributed throughout the study area as ground truth for the calibration and thermal adjustment of the 4D model.

4. Results

The results of the application of the proposed methodology for the generation of 4D models for the thermal control of landfills are described below.

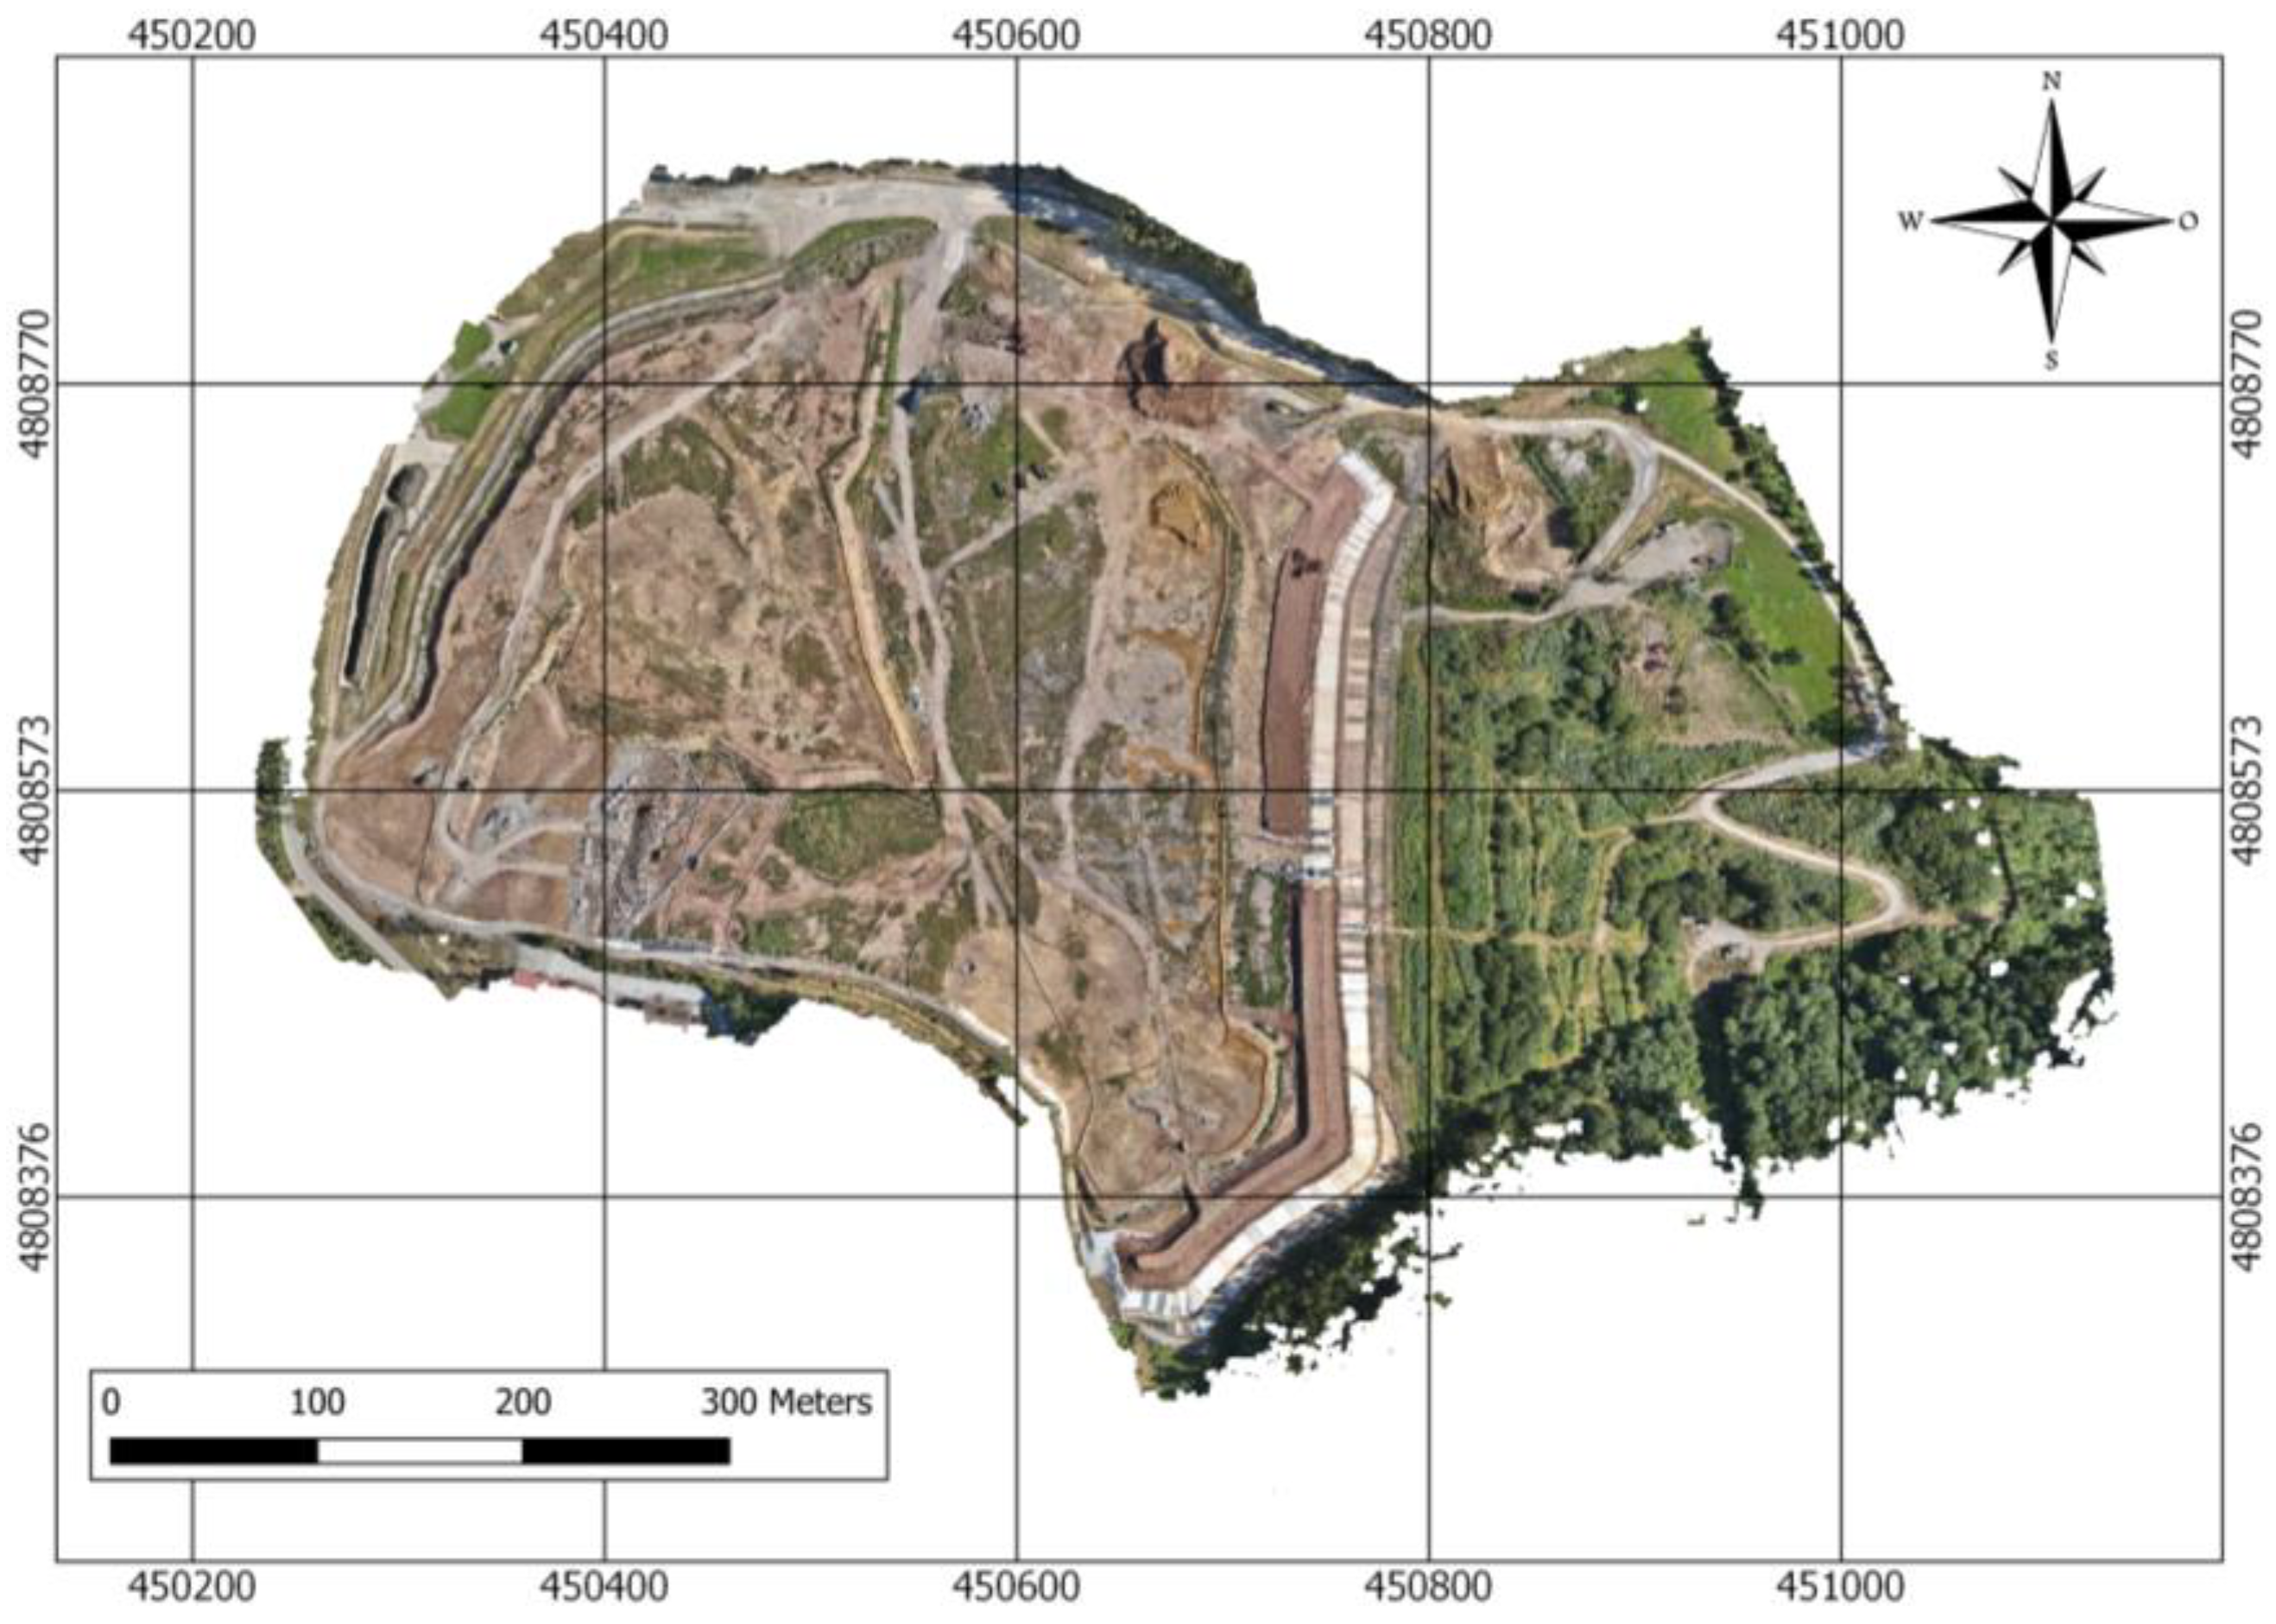
4.1. 4D Thermal Model Generation

As a result of the UAV flight, a total of 1289 RGB and TIR images were obtained. Both sets of images were managed through the SfM photometric process, following the workflow proposed in Figure 1 and using Agisoft Metashape software (version 1.2.7). First, the set of RGB images in JPEG format was used to generate the 3D RGB model and the 3.46 cm/px GSD ortoimage shown in Figure 5, which were georeferenced using the GCPs for better accuracy.
From the previous 3D RGB model, the 3D thermal model was generated following the workflow shown in Figure 1. The orientation parameters of the RGB images were exported to align the thermal images. Subsequently, the thermal information from the oriented TIR images was projected onto the 3D RGB model, giving false color to each of the points of the representation, enabling acquisition of the thermal model (Figure 6) and the 13.8 cm/px GSD thermal orthoimage shown in Figure 7. The set of thermal images in R-JPEG format enabled acquisition of qualitative and quantitative data that represents the temperature gradient in false color.
The 4D model, unlike single images or 2D orthoimages, enables the interpretation of the morphology of the landfill, providing the analysis with altimetric information that favors the understanding of its berms, slopes, and elevations, given its strong steepness. In addition, relevant thermal information is provided.

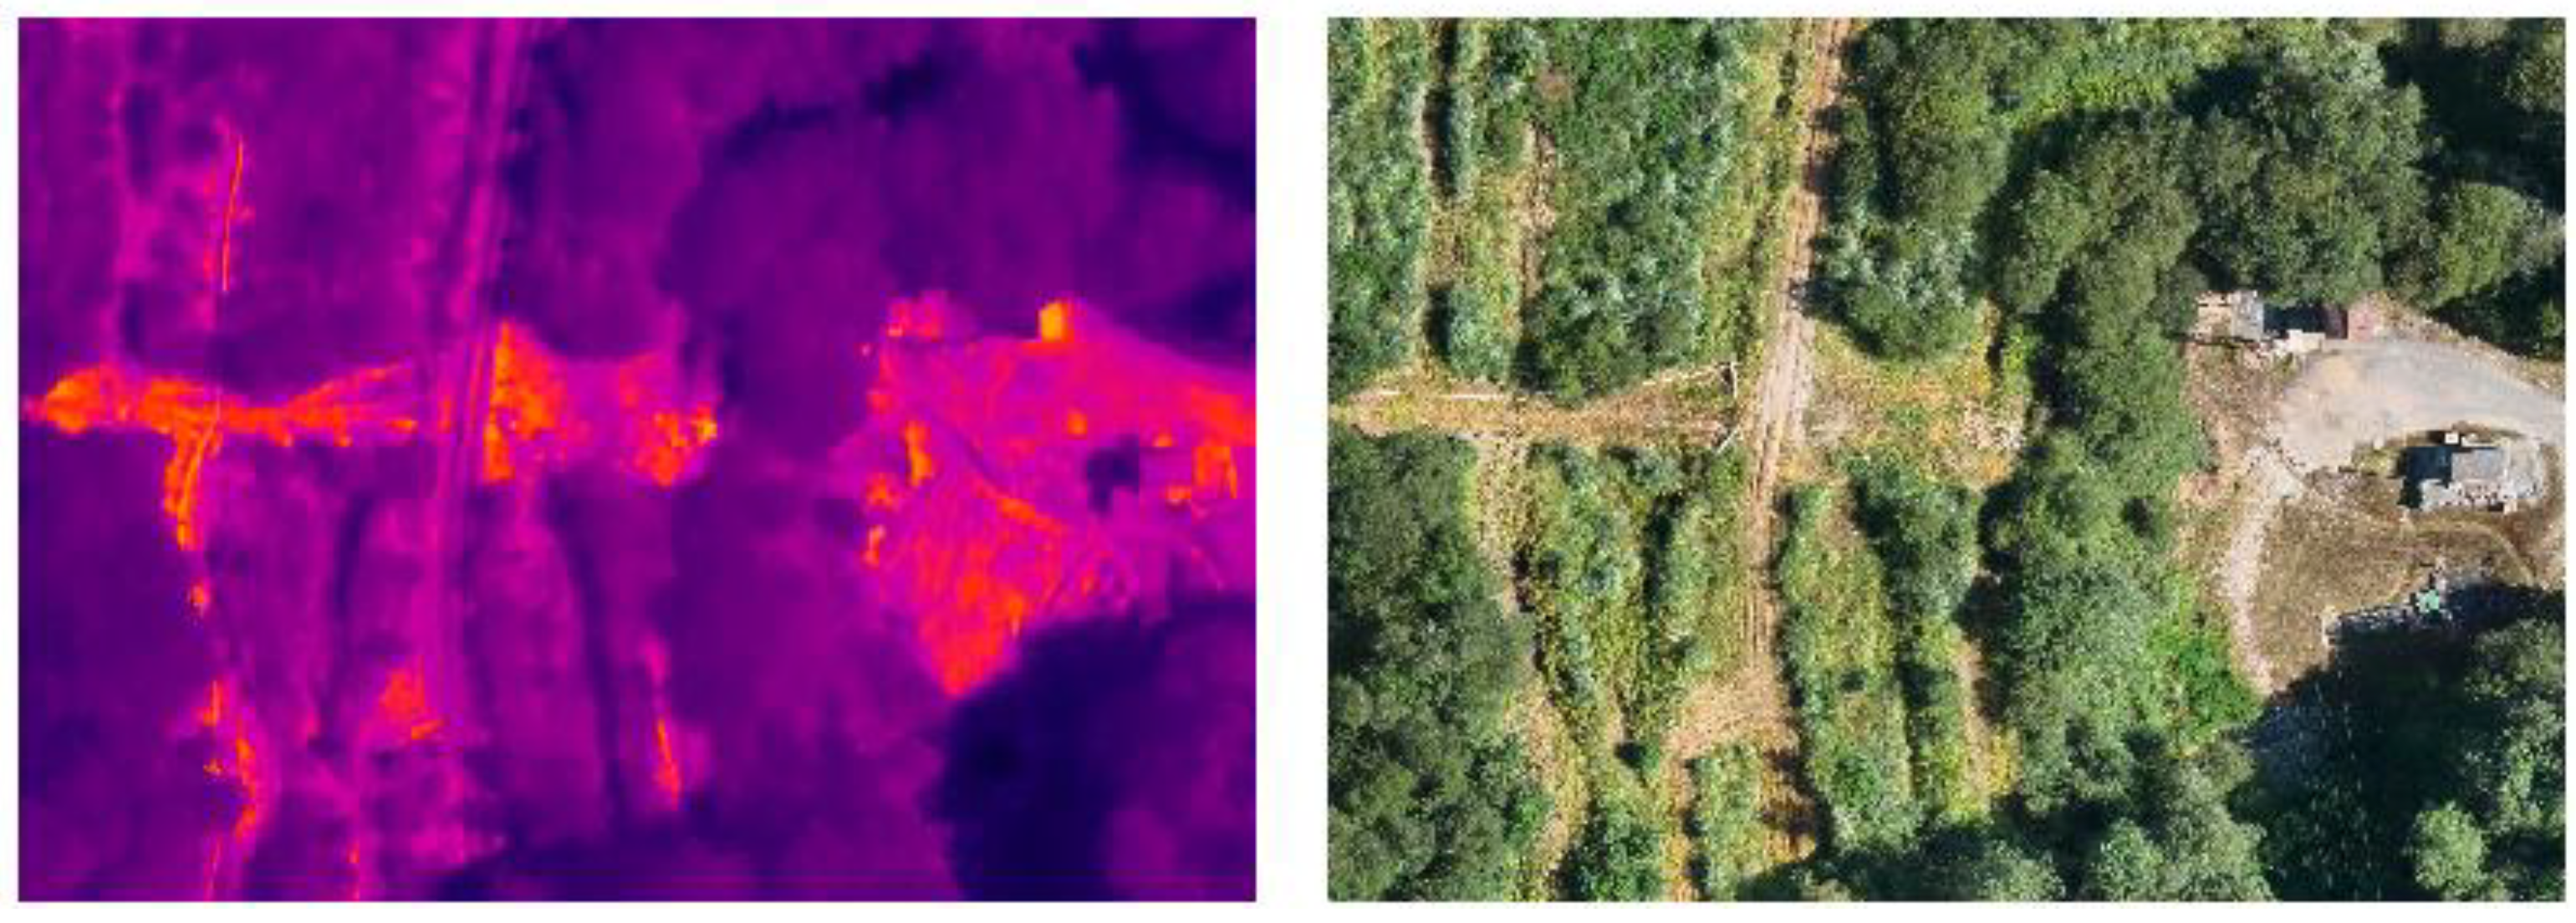
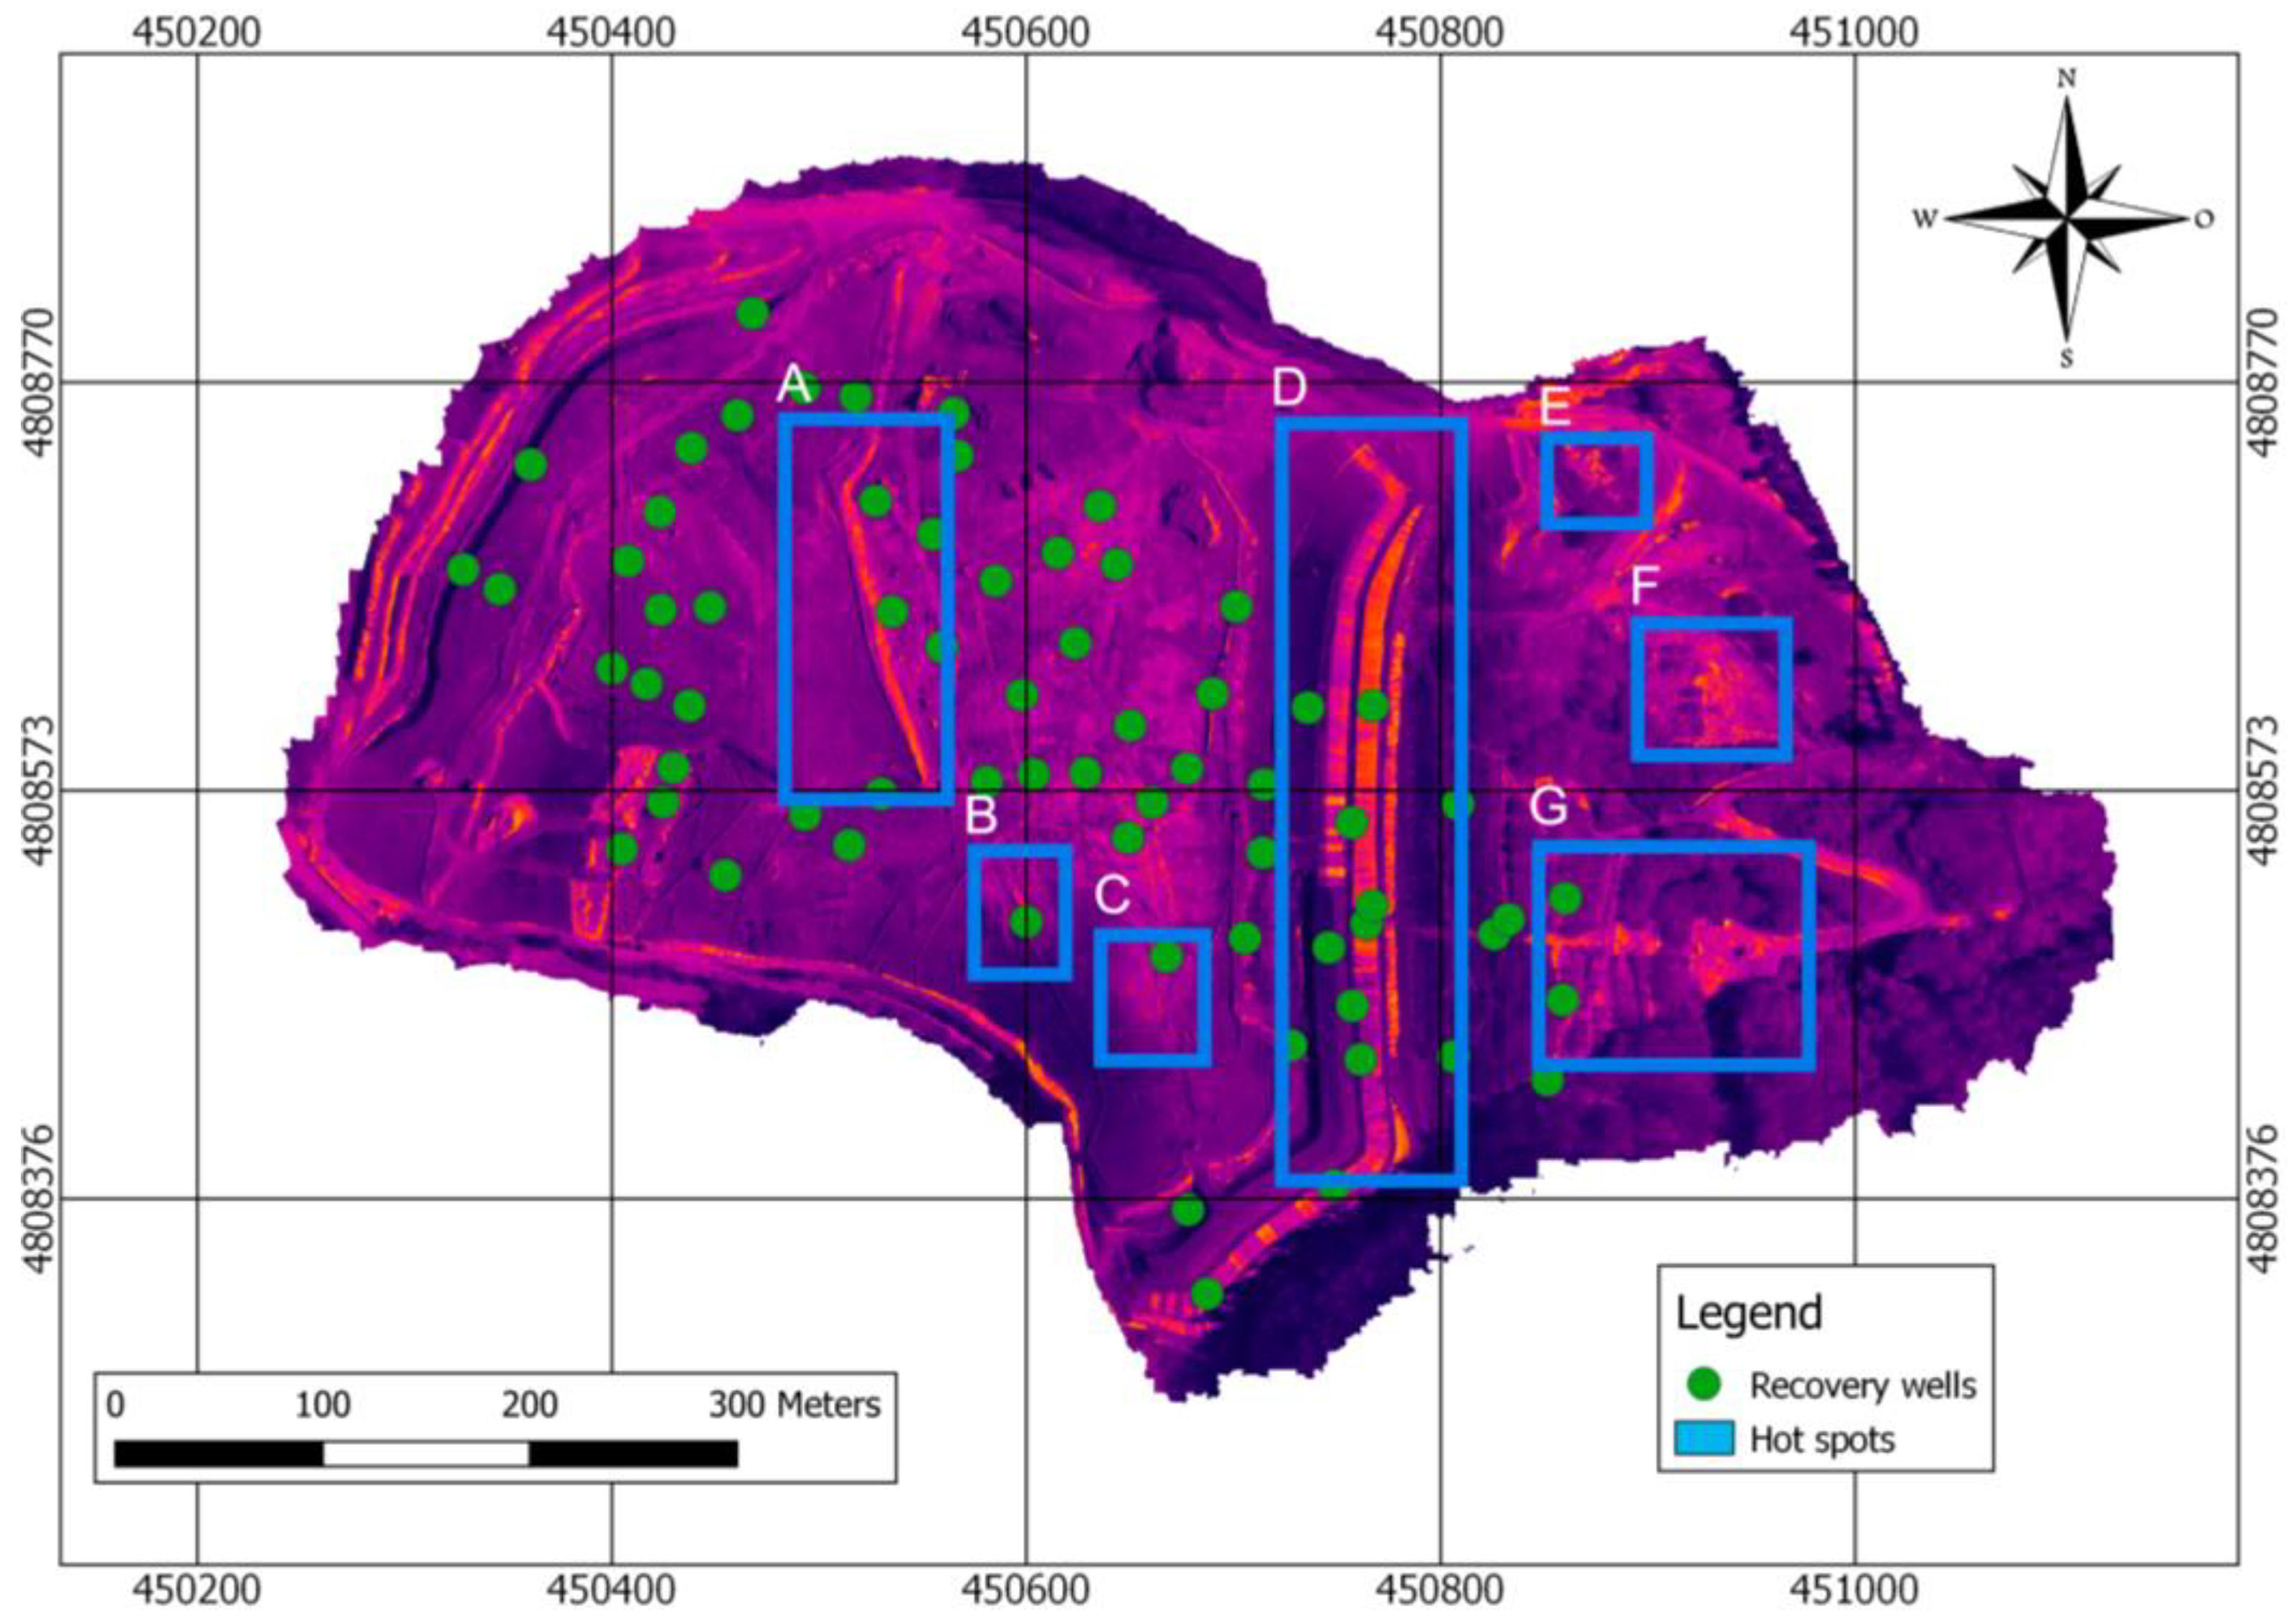
4.2. GIS Analysis for Hot Spot Identification

The orthoimages obtained from the 3D models are analyzed with GIS in order to identify possible thermal anomalies and their causes. Through a first photointerpretation, different hot spots to be evaluated were identified, as shown in Figure 8. The identified points were chosen because these hot spots were considered the most relevant and there was no known prior justification. For example, it is possible to find hot spots in the lower left corner due to ash deposition from the incineration plant during image capture; these were not analyzed.
Analysis using GIS functions such as reclassifications, segmentations, or the application of enhancement filters for digital identification of thermal anomalies is possible. The application of enhancing or softening filters allows certain conclusions to be reached. Since the temperature values of the data of interest may be modified, the application of this type of analysis may screen out or eliminate useful information.
Photointerpretation of the analog RGB orthoimage provides the most extensive thermal anomalies identified, such as zones A and D, with temperatures of 41.6 °C and 31.2 °C, respectively. Most of the hot spots identified correspond to areas of the landfill where plastic liners and geotextiles are exposed, awaiting the deposition of new MSW to cover them, as can be seen in Figure 9.
In the lower right corner of Figure 8 is the hot spot G, an area of high temperatures (33.8 °C) that is shown in detail in Figure 10. The anomaly in this case may be due to two causes. First of all, the interpretation of the RGB orthoimage enables the deduction that the lack of vegetation is the main cause. Secondly, by analyzing the leachate collection system, it is possible to note that there is a set of subway pipes located in this specific area. The fluids from the decomposition of organic matter in the landfill may have high temperatures, and the buried collection pipe may heat up the soil as a result, or there may be leaks in the piping.
The other hot spots that were identified lack an a priori justified cause derived from the photointerpretation or analysis of the installations. In this case (Figure 11), zones B (33.3 °C) and C (27.3 °C) show homogeneous parts of the surface terrain where there are temperature differences that may indicate a heat source underneath. These anomalies may be due to possible LFG emission zones, decomposition of buried organic matter, or underground fires.
In the oldest zone of the landfill (right side of Figure 8), two other areas of thermal anomalies in need of justification can be identified. Figure 12 shows a stockpile of material that is at a higher temperature (26.4 °C) than the surrounding area, and it is even higher than that of the concrete access next to it, indicating an unusual thermal behavior that needs to be evaluated in depth.
Finally, Figure 13 shows a homogeneous zone (F) of high temperature (23.8 °C), similar to hot spots B and C, where the thermal difference cannot be justified by differences in the emissivity or heat capacity of the surface represented.

4.3. Validation of Results

The non-justified hot spots were evaluated in the R-JPEG formatted thermal images with the DJI Thermal Analysis Tool 3 software (version 3.2.0), which enables image analysis and temperature measurements of the photographed surface. The temperature measurement of the two areas of the current landfill (B and C) shows that the hot spots are at 33.3 or 27.3 °C compared to the 23.7 or 19.5 °C temperatures of the surroundings, thus verifying the existence of a hot spot which has to be further evaluated in order to take preventive measures.
In addition, the areas of both hot spots are close to some of the 79 collection wells located along the entire length of the landfill, which are shown in green in Figure 14.
The collection wells capture the LFG for energy recovery, avoiding emissions and other associated safety issues, while eliminating the LFG generated and temperature increases. Despite being close to some of the wells, the temperature in these two areas is high, which may indicate possible problems in the recovery of nearby wells or the need for new wells.
On the other hand, in the two hot spots on the right of the image (E and F), which are around the oldest landfill, at a lower elevation, the absence of LFG collection wells can be observed. This condition may imply the emission of biogas to the atmosphere and a consequent increase in temperature as the gas migrates through the deposited MSW layers. In the identified area related to a possible material stockpile, the temperature is 26.4 °C, which is higher than the 24.9 °C of the nearby road and the 18.2 °C of the surrounding vegetation. This anomaly may therefore be due to the decomposition of organic matter, ashes from energy recovery deposited in that area of the landfill, etc. Finally, the hot spot of the homogeneous zone without vegetation (G) shows temperatures of 23.8 °C compared to 19.7 °C in the surrounding cold zones. In this case, in the absence of any other reason for or interpretation of the RGB image, a possible LFG emission can be intuited due to the absence of collection wells in this location.
In short, it can be assured that the 3D thermal model enables the monitoring of the landfill from a thermal point of view, providing managers with a tool that enables the detection of possible hot spots in MSW for evaluation and the application of the most appropriate corrective measures according to the incidence shown.

5. Discussion

Once the proposed methodology for thermal control by means of low-cost sensors installed in UAVs has been applied to the case considered, and in view of the results obtained from the analysis and evaluation of the 3D thermal model, the following interpretations of the research carried out can be taken into account.
The selection of the sensor conditions the results obtained. The storage format of the thermal images and the type of information that they contain determines the final properties of the model. JPEG or R-JPEG image formats provide false color images that enable qualitative 3D models to be obtained, from which only evaluations based on photointerpretations by the user can be developed, in addition to a quantitative analysis of the isolated images. However, TIFF image formats make it possible to generate quantitative thermal 3D models in which the temperature can be directly determined for each point of the model. The R-JPEG images obtained enable an individual quantitative analysis of each of them, but not the generation of a model with temperature data, resulting in a qualitative thermal 3D model. The selection of the platform conditions the capacity of the resulting model, enabling, in the case of quantitative models, a quasi-automatic analysis by means of GIS tools for the identification of thermal anomalies. The potential of this methodology has to be further evaluated in investigations with greater scope in order to analyze the results when using other more complex equipment; this is beyond the scope of this study, which is focused on a first iteration oriented to the generation and validation of 3D thermal models for the identification of anomalies.
Flight planning based on the atmospheric situation may condition the results. Prioritizing times or days of the year with low temperature and low solar radiation will guarantee a greater temperature difference between the anomalies and the environment, and therefore a greater gradient in the image, which facilitates anomaly identification. Similarly, cloudy days reduce the influence of the sun on the geomembranes, coatings, and pipes, keeping them at the temperature of the environment and avoiding their identification as possible pathologies. Despite the satisfactory results, the proposed method for MSW monitoring is also conditioned by the state of the facility during the UAV flight. In addition to the atmospheric and meteorological variables, the constant dumping of debris and its coverage with geotextile materials can modify the conditions, hiding and masking possible anomalies identified before they can be verified and corrected in the field. Therefore, the methodology has to be implemented periodically and frequently in order to act quickly and provide useful and effective solutions.
The generation of the thermal 3D models following the proposed workflow, which is based on the combination of blocks of images, is fast and simple, solving the conventional problems of TIR image processing. Despite obtaining a 3D thermal model with the highest quality, detail, precision, and density possible, it should be noted that the resulting thermal orthoimage on which to perform the photointerpretation has a lower resolution compared to the RGB orthoimage. This is due to the lower spatial resolution of the thermal image. However, the GSD of the thermal orthoimage is 13.8 cm/px, which is considered sufficient for this type of application, where very high accuracies are not required. In spite of this, the advantages of having the 3D thermal model enable a 3D global conception of the landfill to be obtained, which also enables evaluation of the altimetry, morphology, and metric magnitudes, such as the volumes of the facility. On the other hand, the 3D thermal model generated by following the proposed methodology offers an accuracy of 1.63 °C in comparison with ground-truth measurements carried out with a complementary hand-held sensor in the field.
The analysis of the orthoimage based on photointerpretation is a relatively complicated, time-consuming process that can be subject to experience. Visual analysis is the only alternative when dealing with a qualitative 3D thermal model, which is conditioned by the type of sensor used. In the case of quantitative models, semi-automatic analysis based on reclassifications with GIS tools can speed up the work, reducing time, favoring the identification of anomalies, and avoiding reliance on the interpretation of the naked human eye.
GIS tools are one of the main alternatives used for the management of UAV photogrammetry-derived products. In this case, the software has been used for the correct visualization of the orthoimages and the georeferencing of the anomalies identified, as well as of the LFG collection wells, favoring the model analysis. However, the potential of this tool can be enhanced when using quantitative models, where the potential of the functions that it offers can be exploited in order to automatically identify thermal anomalies based on temperature.
The validation of the results was carried out through a combination of photointerpretation of the thermal and RGB representations of the landfill, field visits, and information about the state of the facility. Although the characterization of the anomalies, their justification, and their correction are not the main objective of this study, more detailed and concise results can be obtained by using complementary sensors, such as methane concentration meters, boreholes for core recovery, and subsurface temperature probes. However, the use of these alternatives is much more expensive, contrasting with the low-cost profile of the proposed UAVs. The proposed method can be used as a decision-making tool in landfill management, providing complementary information when investing in tests involving more accurate and expensive profiling equipment.
The results obtained enable the implementation of 4D models in thermal control applications as a more complete tool than the heat maps proposed in previous publications. The proposed alternative enables the establishment of a methodology for the identification of thermal anomalies using only one type of sensor. In this way, the necessary resources and information capture can be optimized compared to alternatives that propose the use of different sensors [19]. The proposed UAV terminal imaging application facilitates progress in the field of drone technology, providing a more efficient solution for the thermal monitoring of landfills compared to techniques based on hand-held sensors [13] or satellite imagery [3,35], where spatial resolution is compromised. Unlike other investigations, the obtained representations also enable the determination of possible relations between the anomaly and LFG emissions based on more complete 3D models than those alternatives based on the interpretation of isolated UAV images [37] or 2D representations, such as heat maps [1] or ortho-thermal images [1], enabling the interpretation of altimetric information for better understanding and decision making. Finally, unlike the rest of the reviewed research [25], the methodology of photogrammetric processing used to generate a 4D model is detailed, facilitating its application in other case studies.
The methodology is based on the interpretation of a single model based on one flight. The implementation of several periodic flights over time would allow the generation of dynamic models, showing the evolution of the landfill temperature over time, as well as a control of the anomalies identified for a better monitoring of the temperature.
The results obtained from the analysis of the model and the current situation of the LFG collection system have made it possible to identify areas where the thermal anomaly lacks a simple a priori explanation. This requires specific measures to be taken for an in-depth evaluation of each anomaly that enable its justification and the corresponding corrective measures to be taken, such as the analysis of discharges, in situ gas measurements, etc.

6. Conclusions

Landfills are essential facilities for MSW management. They not only enable reductions in the risk of environmental and human health impacts, but also the acquisition of a certain energy benefit through the valorization of waste or LFG. The thermal control of these facilities is an activity that guarantees their correct operation, and must be carried out during the whole life cycle of the facility in order to reduce environmental impacts and maximize energy production. The implementation of the methodological proposal developed in this study enables the application of 3D thermal models generated with images obtained with low-cost UAV sensors to the identification of thermal anomalies, favoring decision making for the management of MSW landfills, the sizing of corrective measures, and the prediction of fire evolution.
This methodology enables the acquisition of 3D thermal models and orthomosaics which represent the position, geometry, and temperature of the landfill surface quickly, through photogrammetric processing of homologous RGB and thermal images captured simultaneously with dual sensors. The 3D thermal model is generated by projecting the radiometric information of the TIR images, based on the orientation of the homologous RGB images, onto a previously generated RGB model. The analysis of the orthoimage and thermal model enables identification through the photointerpretation of hot spots where the temperature, higher than that of the environment or surrounding areas, may imply fires, LFG emissions to the atmosphere, or uncontrolled decomposition of organic matter, all of them compromising the stability and safety of the landfill.
The analysis, based on photointerpretation, can be complemented by georeferencing the anomalies in GIS tools, which also enables the evaluation of the possible causes through parallel photointerpretation of RGB orthoimages and the superposition of other landfill management elements, such as the pipes or wells of the LFG collection system. In this way, risk areas or points where collection systems are not operating correctly can be identified. In turn, the 3D model can be used to provide geometric information (X, Y, Z), which enables the analysis of the evolution of anomalies through dynamic models, as well as the modeling of fire propagation and the planning of corrective measures. The analysis based on 4D models enables a global conception of MSW as opposed to traditional 2D alternatives, such as heat maps or isolated TIR images, thus providing more complete information in four dimensions.
In short, the proposed methodology is a novel alternative for the implementation of UAVs and low-cost thermal sensors, combined with GIS tools, for thermal monitoring of landfills. The combination of these technologies enables a fast, cost-effective, accessible, safe, and simple assessment compared to conventional 2D techniques for the identification of thermal anomalies in MSW landfills.

Author Contributions

Conceptualization, J.S.-C. and J.M.d.L.-R.; methodology, J.S.-C., J.M.d.L.-R. and R.P.-Á.; software, J.S.-C., R.P.-G. and J.D.T.-E.; validation, J.M.d.L.-R. and R.P.-Á.; formal analysis, J.S.-C., R.P.-G. and J.M.d.L.-R.; investigation, J.S.-C., J.M.d.L.-R. and R.P.-Á.; resources, J.M.d.L.-R. and R.P.-Á.; data curation, R.P.-G. and J.D.T.-E.; writing—original draft preparation, J.S.-C.; writing—review and editing, J.M.d.L.-R. and R.P.-Á.;. visualization, J.S.-C., R.P.-G. and J.D.T.-E.; supervision, J.M.d.L.-R. and R.P.-Á.; project administration, J.S.-C. and J.M.d.L.-R.; funding acquisition, J.M.d.L.-R. All authors have read and agreed to the published version of the manuscript.

Funding

The authors wish to express their gratitude to the “Concepción Arenal” Grant Programme of the University of Cantabria and to the Government of Cantabria for the financial support provided for the development of the research activities. Grant Number: UC-20-41.

Institutional Review Board Statement

Not applicable.

Informed Consent Statement

Not applicable.

Data Availability Statement

Research data are available at: https://figshare.com/articles/dataset/Meruelo_UAV/23968008 (accessed on 11 November 2023).

Acknowledgments

The authors wish to express their gratitude to MARE for providing access to the facilities.

Conflicts of Interest

The authors declare no conflict of interest.

References

  1. Tanda, G.; Balsi, M.; Fallavollita, P.; Chiarabini, V. A Uav-Based Thermal-Imaging Approach for the Monitoring of Urban Landfills. Inventions 2020, 5, 55. [Google Scholar] [CrossRef]
  2. Jovanov, D.; Vujić, B.; Vujić, G. Optimization of the Monitoring of Landfill Gas and Leachate in Closed Methanogenic Landfills. J. Environ. Manag. 2018, 216, 32–40. [Google Scholar] [CrossRef] [PubMed]
  3. Yan, W.Y.; Mahendrarajah, P.; Shaker, A.; Faisal, K.; Luong, R.; Al-Ahmad, M. Analysis of Multi-Temporal Landsat Satellite Images for Monitoring Land Surface Temperature of Municipal Solid Waste Disposal Sites. Environ. Monit. Assess. 2014, 186, 8161–8173. [Google Scholar] [CrossRef] [PubMed]
  4. Wyard, C.; Beaumont, B.; Grippa, T.; Hallot, E. UAV-Based Landfill Land Cover Mapping: Optimizing Data Acquisition and Open-Source Processing Protocols. Drones 2022, 6, 123. [Google Scholar] [CrossRef]
  5. Giusti, L. A Review of Waste Management Practices and Their Impact on Human Health. Waste Manag. 2009, 29, 2227–2239. [Google Scholar] [CrossRef] [PubMed]
  6. Battaglini, R.; Raco, B.; Scozzari, A. Effective Monitoring of Landfills: Flux Measurements and Thermography Enhance Efficiency and Reduce Environmental Impact. J. Geophys. Eng. 2013, 10, 064002. [Google Scholar] [CrossRef]
  7. Nair, A.T.; Senthilnathan, J.; Nagendra, S.M.S. Emerging Perspectives on VOC Emissions from Landfill Sites: Impact on Tropospheric Chemistry and Local Air Quality. Process Saf. Environ. Prot. 2019, 121, 143–154. [Google Scholar] [CrossRef]
  8. Hanson, J.L.; Yeşiller, N.; Oettle, N.K. Spatial and Temporal Temperature Distributions in Municipal Solid Waste Landfills. J. Environ. Eng. 2010, 136, 804–814. [Google Scholar] [CrossRef]
  9. Jafari, N.H.; Stark, T.D.; Thalhamer, T. Progression of Elevated Temperatures in Municipal Solid Waste Landfills. J. Geotech. Geoenvironmental Eng. 2017, 143, 05017004. [Google Scholar] [CrossRef]
  10. Sabrin, S.; Nazari, R.; Fahad, M.G.R.; Karimi, M.; Everett, J.W.; Peters, R.W. Investigating Effects of Landfill Soil Gases on Landfill Elevated Subsurface Temperature. Appl. Sci. 2020, 10, 6401. [Google Scholar] [CrossRef]
  11. Koerner, G.R.; Koerner, R.M. Long-Term Temperature Monitoring of Geomembranes at Dry and Wet Landfills. Geotext. Geomembr. 2006, 24, 72–77. [Google Scholar] [CrossRef]
  12. Emmi, G.; Zarrella, A.; Zuanetti, A.; De Carli, M. Use of Municipal Solid Waste Landfill as Heat Source of Heat Pump. Energy Procedia 2016, 101, 352–359. [Google Scholar] [CrossRef]
  13. Lewis, A.W.; Yuen, S.T.S.; Smith, A.J.R. Detection of Gas Leakage from Landfills Using Infrared Thermography—Applicability and Limitations. Waste Manag. Res. 2003, 21, 436–447. [Google Scholar] [CrossRef] [PubMed]
  14. Kim, Y.M.; Park, M.H.; Jeong, S.; Lee, K.H.; Kim, J.Y. Evaluation of Error Inducing Factors in Unmanned Aerial Vehicle Mounted Detector to Measure Fugitive Methane from Solid Waste Landfill. Waste Manag. 2021, 124, 368–376. [Google Scholar] [CrossRef] [PubMed]
  15. Kane, S.N.; Mishra, A.; Dutta, A.K. Application of Close-Range Aerial Infrared Thermography to Detect Landfill Gas Emissions: A Case Study. J. Phys. Conf. Ser. 2016, 755, 011001. [Google Scholar] [CrossRef]
  16. Kwarteng, A.; Al-Enezi, A. Assessment of Kuwait’s Al-Qurain Landfill Using Remotely Sensed Data. J. Environ. Sci. Health 2011, 39, 351–364. [Google Scholar] [CrossRef] [PubMed]
  17. Jafari, N.H.; Stark, T.D.; Roper, R. Classification and Reactivity of Secondary Aluminum Production Waste. J. Hazard. Toxic Radioact. Waste 2014, 18, 04014018. [Google Scholar] [CrossRef]
  18. Frid, V.; Doudkinski, D.; Liskevich, G.; Shafran, E.; Averbakh, A.; Korostishevsky, N.; Prihodko, L. Geophysical-Geochemical Investigation of Fire-Prone Landfills. Environ. Earth Sci. 2010, 60, 787–798. [Google Scholar] [CrossRef]
  19. Lega, M.; Napoli, R.M.A. A New Approach to Solid Waste Landfills Aerial Monitoring. WIT Trans. Ecol. Environ. 2008, 109, 193–199. [Google Scholar] [CrossRef]
  20. Martin, J.W.; Stark, T.D.; Thalhamer, T.; Gerbasi-Graf, G.T.; Gortner, R.E. Detection of Aluminum Waste Reactions and Waste Fires. J. Hazard. Toxic Radioact. Waste 2013, 17, 164–174. [Google Scholar] [CrossRef]
  21. Zuberi, M.J.S.; Ali, S.F. Greenhouse Effect Reduction by Recovering Energy from Waste Landfills in Pakistan. Renew. Sustain. Energy Rev. 2015, 44, 117–131. [Google Scholar] [CrossRef]
  22. Allen, G.; Hollingsworth, P.; Kabbabe, K.; Pitt, J.R.; Mead, M.I.; Illingworth, S.; Roberts, G.; Bourn, M.; Shallcross, D.E.; Percival, C.J. The Development and Trial of an Unmanned Aerial System for the Measurement of Methane Flux from Landfill and Greenhouse Gas Emission Hotspots. Waste Manag. 2019, 87, 883–892. [Google Scholar] [CrossRef] [PubMed]
  23. Lavoie, T.N.; Shepson, P.B.; Cambaliza, M.O.L.; Stirm, B.H.; Karion, A.; Sweeney, C.; Yacovitch, T.I.; Herndon, S.C.; Lan, X.; Lyon, D. Aircraft-Based Measurements of Point Source Methane Emissions in the Barnett Shale Basin. Environ. Sci. Technol. 2015, 49, 7904–7913. [Google Scholar] [CrossRef] [PubMed]
  24. Battulwar, R.; Winkelmaier, G.; Valencia, J.; Naghadehi, M.Z.; Peik, B.; Abbasi, B.; Parvin, B.; Sattarvand, J. A Practical Methodology for Generating High-Resolution 3D Models of Open-Pit Slopes Using UAVs: Flight Path Planning and Optimization. Remote Sens. 2020, 12, 2283. [Google Scholar] [CrossRef]
  25. Sliusar, N.; Filkin, T.; Huber-Humer, M.; Ritzkowski, M. Drone Technology in Municipal Solid Waste Management and Landfilling: A Comprehensive Review. Waste Manag. 2022, 139, 1–16. [Google Scholar] [CrossRef] [PubMed]
  26. Guimarães, C.C.; Barbosa, A.M.; Gandolfo, O.C.B. Visual Interpretation of Satellite and Aerial Images to Identify and Study the Evolution of Inadequate Urban Waste Disposal Sites. Detritus 2019, 6, 85–95. [Google Scholar] [CrossRef]
  27. Incekara, A.H.; Delen, A.; Seker, D.Z.; Goksel, C. Investigating the Utility Potential of Low-Cost Unmanned Aerial Vehicles in the Temporal Monitoring of a Landfill. ISPRS Int. J. Geo-Inf. 2019, 8, 22. [Google Scholar] [CrossRef]
  28. Azimov, O.; Schevchuk, O.; Azimova, K.; Dorofey, Y.; Tomchenko, O. Integration of GIS and RSE Aiming to the Effective Monitoring of the Surroundings of Landfills. Ukr. J. Remote Sens. 2020, 27, 4–12. [Google Scholar] [CrossRef]
  29. Daugela, I.; Visockiene, J.S.; Kumpiene, J. Detection and Analysis of Methane Emissions from a Landfill Using Unmanned Aerial Drone Systems and Semiconductor Sensors. Detritus 2020, 10, 127–138. [Google Scholar] [CrossRef]
  30. Messinger, M.; Silman, M. Unmanned Aerial Vehicles for the Assessment and Monitoring of Environmental Contamination: An Example from Coal Ash Spills. Environ. Pollut. 2016, 218, 889–894. [Google Scholar] [CrossRef]
  31. Tomaštík, J.; Mokroš, M.; Surový, P.; Grznárová, A.; Merganič, J. UAV RTK/PPK Method-An Optimal Solution for Mapping Inaccessible Forested Areas? Remote Sens. 2019, 11, 721. [Google Scholar] [CrossRef]
  32. Ngoc Qui, B.; Dinh Hien, L.; Quoc Long, N.; Si Son, T.; Anh Quan, D.; Van Hiep, P.; Thanh Hai, P.; Thi Lan, P. Method of Defining the Parameters for UAV Point Cloud Classification Algorithm. Inz. Miner. 2020, 1, 49–56. [Google Scholar] [CrossRef]
  33. Pérez-Álvarez, R.; Sedano-cibrián, J.; de Luis-Ruiz, J.M.; Fernández-Maroto, G. Mining Exploration with UAV, Low-Cost Thermal Cameras and GIS Tools—Application to the Specific Case of the Complex Sulfides Hosted in Carbonates of Udías (Cantabria, Spain). Minerals 2022, 12, 140. [Google Scholar] [CrossRef]
  34. Chaudhry, M.H.; Ahmad, A.; Gulzar, Q. Impact of UAV Surveying Parameters on Mixed Urban Landuse Surface Modelling. ISPRS Int. J. Geo-Inf. 2020, 9, 656. [Google Scholar] [CrossRef]
  35. Nazari, R.; Alfergani, H.; Haas, F.; Karimi, M.E.; Fahad, M.G.R.; Sabrin, S.; Everett, J.; Bouaynaya, N.; Peters, R.W. Application of Satellite Remote Sensing in Monitoring Elevated Internal Temperatures of Landfills. Appl. Sci. 2020, 10, 6801. [Google Scholar] [CrossRef]
  36. Emran, B.J.; Tannant, D.D.; Najjaran, H. Low-Altitude Aerial Methane Concentration Mapping. Remote Sens. 2017, 9, 823. [Google Scholar] [CrossRef]
  37. Fjelsted, L.; Christensen, A.G.; Larsen, J.E.; Kjeldsen, P.; Scheutz, C. Assessment of a Landfill Methane Emission Screening Method Using an Unmanned Aerial Vehicle Mounted Thermal Infrared Camera—A Field Study. Waste Manag. 2019, 87, 893–904. [Google Scholar] [CrossRef]
  38. Mønster, J.; Kjeldsen, P.; Scheutz, C. Methodologies for Measuring Fugitive Methane Emissions from Landfills—A Review. Waste Manag. 2019, 87, 835–859. [Google Scholar] [CrossRef]
  39. Muleya, M. Photogrammetry Based Analysis for the Risks Associated with Landfilling in Developing Countries: Case Study, Chunga Landfill; Auckland University of Technology: Lusaka, Zambia, 2020. [Google Scholar]
  40. Yeşiller, N.; Hanson, J.L.; Kopp, K.B.; Yee, E.H. Heat Management Strategies for MSW Landfills. Waste Manag. 2016, 56, 246–254. [Google Scholar] [CrossRef]
  41. Moon, D.; Chung, S.; Kwon, S.; Seo, J.; Shin, J. Comparison and Utilization of Point Cloud Generated from Photogrammetry and Laser Scanning: 3D World Model for Smart Heavy Equipment Planning. Autom. Constr. 2019, 98, 322–331. [Google Scholar] [CrossRef]
  42. de Luis-Ruiz, J.M.; Sedano-Cibrián, J.; Pereda-García, R.; Pérez-Álvarez, R.; Malagón-Picón, B. Optimization of Photogrammetric Flights with UAVs for the Metric Virtualization of Archaeological Sites. Application to Juliobriga (Cantabria, Spain). Appl. Sci. 2021, 11, 1204. [Google Scholar] [CrossRef]
  43. Mesas-Carrascosa, F.J.; Pérez-Porras, F.; de Larriva, J.E.M.; Frau, C.M.; Agüera-Vega, F.; Carvajal-Ramírez, F.; Martínez-Carricondo, P.; García-Ferrer, A. Drift Correction of Lightweight Microbolometer Thermal Sensors On-Board Unmanned Aerial Vehicles. Remote Sens. 2018, 10, 615. [Google Scholar] [CrossRef]
  44. de Luis-Ruiz, J.M.; Sedano-Cibrián, J.; Pérez-Álvarez, R.; Pereda-García, R.; Malagón-Picón, B. Metric Contrast of Thermal 3D Models of Large Industrial Facilities Obtained by Means of Low-Cost Infrared Sensors in UAV Platforms. Int. J. Remote Sens. 2021, 43, 457–483. [Google Scholar] [CrossRef]
  45. Tonkin, T.N.; Midgley, N.G. Ground-Control Networks for Image Based Surface Reconstruction: An Investigation of Optimum Survey Designs Using UAV Derived Imagery and Structure-from-Motion Photogrammetry. Remote Sens. 2016, 8, 786. [Google Scholar] [CrossRef]
  46. Maes, W.H.; Huete, A.R.; Steppe, K. Optimizing the Processing of UAV-Based Thermal Imagery. Remote Sens. 2017, 9, 476. [Google Scholar] [CrossRef]
  47. Koch, T.; Körner, M.; Fraundorfer, F. Automatic and Semantically-Aware 3D UAV Flight Planning for Image-Based 3D Reconstruction. Remote Sens. 2019, 11, 1550. [Google Scholar] [CrossRef]
  48. Pan, Y.; Dong, Y.; Wang, D.; Chen, A.; Ye, Z. Three-Dimensional Reconstruction of Structural Surface Model of Heritage Bridges Using UAV-Based Photogrammetric Point Clouds. Remote Sens. 2019, 11, 1204. [Google Scholar] [CrossRef]
  49. Nex, F.; Remondino, F. UAV for 3D Mapping Applications: A Review. Appl. Geomat. 2014, 6, 1–15. [Google Scholar] [CrossRef]
  50. Roca, D.; Lagüela, S.; Díaz-Vilariño, L.; Armesto, J.; Arias, P. Low-Cost Aerial Unit for Outdoor Inspection of Building Façades. Autom. Constr. 2013, 36, 128–135. [Google Scholar] [CrossRef]
  51. Lv, M.; Xiao, S.; Tang, Y.; He, Y. Influence of UAV Flight Speed on Droplet Deposition Characteristics with the Application of Infrared Thermal Imaging. Int. J. Agric. Biol. Eng. 2019, 12, 10–17. [Google Scholar] [CrossRef]
  52. Kelly, J.; Kljun, N.; Olsson, P.O.; Mihai, L.; Liljeblad, B.; Weslien, P.; Klemedtsson, L.; Eklundh, L. Challenges and Best Practices for Deriving Temperature Data from an Uncalibrated UAV Thermal Infrared Camera. Remote Sens. 2019, 11, 567. [Google Scholar] [CrossRef]
  53. Wan, Q.; Brede, B.; Smigaj, M.; Kooistra, L. Factors Influencing Temperature Measurements from Miniaturized Thermal Infrared (Tir) Cameras: A Laboratory-Based Approach. Sensors 2021, 21, 8466. [Google Scholar] [CrossRef] [PubMed]
  54. Kim, J.; Lee, S.; Seo, J.; Lee, D.E.; Choi, H.S. The Integration of Earthwork Design Review and Planning Using Uav-Based Point Cloud and Bim. Appl. Sci. 2021, 11, 3435. [Google Scholar] [CrossRef]
  55. Senkal, E.; Kaplan, G.; Avdan, U. Accuracy Assessment of Digital Surface Models From Unmanned Aerial Vehicles’ Imagery on Archaeological Sites. Int. J. Eng. Geosci. 2021, 6, 81–89. [Google Scholar] [CrossRef]
  56. Ferrer-González, E.; Agüera-Vega, F.; Carvajal-Ramírez, F.; Martínez-Carricondo, P. UAV Photogrammetry Accuracy Assessment for Corridor Mapping Based on the Number and Distribution of Ground Control Points. Remote Sens. 2020, 12, 2447. [Google Scholar] [CrossRef]
  57. Jin Yu, J.; Woo Kim, D.; Jung Lee, E.; Woo Son, S. Determining the Optimal Number of Ground Control Points for Varying Study Sites through Accuracy Evaluation of Unmanned Aerial System-Based 3d Point Clouds and Digital Surface Models. Drones 2020, 4, 49. [Google Scholar] [CrossRef]
  58. Silvestri, M.; Marotta, E.; Buongiorno, M.F.; Avvisati, G.; Belviso, P.; Sessa, E.B.; Caputo, T.; Longo, V.; De Leo, V.; Teggi, S. Monitoring of Surface Temperature on Parco Delle Biancane (Italian Geothermal Area) Using Optical Satellite Data, UAV and Field Campaigns. Remote Sens. 2020, 12, 2018. [Google Scholar] [CrossRef]
  59. Hartmann, W.; Tilch, S.; Eisenbeiss, H.; Schindler, K. Determination of the Uav Position By Automatic Processing of Thermal Images. Int. Arch. Photogramm. Remote Sens. Spat. Inf. Sci. 2012, XXXIX-B6, 111–116. [Google Scholar] [CrossRef]
  60. Hoegner, L.; Tuttas, S.; Xu, Y.; Eder, K.; Stilla, U. Evaluation of Methods for Coregistration and Fusion of RPAS-Based 3D Point Clouds and Thermal Infrared Images. Int. Arch. Photogramm. Remote Sens. Spat. Inf. Sci.-ISPRS Arch. 2016, 41, 241–246. [Google Scholar] [CrossRef]
  61. Maes, W.H.; Huete, A.R.; Avino, M.; Boer, M.M.; Dehaan, R.; Pendall, E.; Griebel, A.; Steppe, K. Can UAV-Based Infrared Thermography Be Used to Study Plant-Parasite Interactions between Mistletoe and Eucalypt Trees? Remote Sens. 2018, 10, 2062. [Google Scholar] [CrossRef]
  62. Daffara, C.; Muradore, R.; Piccinelli, N.; Gaburro, N.; de Rubeis, T.; Ambrosini, D. A Cost-Effective System for Aerial 3d Thermography of Buildings. J. Imaging 2020, 6, 76. [Google Scholar] [CrossRef] [PubMed]
  63. Yang, Y.; Lee, X. Four-Band Thermal Mosaicking: A New Method to Process Infrared Thermal Imagery of Urban Landscapes from UAV Flights. Remote Sens. 2019, 11, 1365. [Google Scholar] [CrossRef]
  64. Kapil, R.; Castilla, G.; Marvasti-Zadeh, S.M.; Goodsman, D.; Erbilgin, N.; Ray, N. Orthomosaicking Thermal Drone Images of Forests via Simultaneously Acquired RGB Images. Remote Sens. 2023, 15, 2653. [Google Scholar] [CrossRef]
  65. De Marco, J.; Maset, E.; Cucchiaro, S.; Beinat, A.; Cazorzi, F. Assessing Repeatability and Reproducibility of Structure-from-Motion Photogrammetry for 3d Terrain Mapping of Riverbeds. Remote Sens. 2021, 13, 2572. [Google Scholar] [CrossRef]
  66. Lapeña-Mañero, P.; García-Casuso, C.; Cañizal, J.; Sagaseta, C. Shear Strength Characterization of Fresh MBT and MSWI Wastes from a Spanish Treatment Facility. Waste Manag. 2022, 154, 15–26. [Google Scholar] [CrossRef]
  67. García Cueto, R.; Santillán Soto, N.; Ojeda-Benítez, S. Balance Radiativo y Sus Consecuencias En El Comportamiento Térmico En Tiraderos Municipales: Estudio de Caso En La Ciudad de Mexicali, B.C., México. Rev. Int. Contam. Ambient. 2012, 28, 107–115. [Google Scholar]
Figure 1. Diagram of the proposed workflow for the 4D model generation and identification of landfill thermal anomalies.
Applsci 13 13164 g001
Figure 2. General overview of the Meruelo MSW landfill and distribution of the different facilities: treatment and recovery plant, landfill, and leachate plant.
Applsci 13 13164 g002
Figure 3. Image of the DJI Mavic 3T UAV which was used for the flight over the landfill.
Applsci 13 13164 g003
Figure 4. Double grip UAV flight plan designed for the Meruelo MSW landfill.
Applsci 13 13164 g004
Figure 5. RGB orthoimage of the MSW landfill.
Applsci 13 13164 g005
Figure 6. 3D thermal model (X,Y,Z-temperature) of the MSW landfill. The 4D point cloud provides the position in space and the temperature for each point.
Applsci 13 13164 g006
Figure 7. Thermal orthoimage of the Meruelo MSW landfill.
Applsci 13 13164 g007
Figure 8. Hot spots identified through photointerpretation of the surface temperature distribution in the thermal orthoimage of the Meruelo MSW landfill.
Applsci 13 13164 g008
Figure 9. Detail of the thermal and RGB photointerpretation for the hot spots A and D. These thermal anomalies are due to the exposure of geotextiles in the Meruelo MSW landfill.
Applsci 13 13164 g009
Figure 10. Detail of the thermal and RGB photointerpretation of the hot spot G, which is associated with the leachate collection system.
Applsci 13 13164 g010
Figure 11. Detail of the thermal and RGB photointerpretation of homogeneous terrain areas where the non-justified hot spots B and C are identified.
Applsci 13 13164 g011
Figure 12. Detail of the thermal and RGB photointerpretation of the non-justified hot spot due to stockpiling E.
Applsci 13 13164 g012
Figure 13. Detail of the thermal and RGB photointerpretation of non-justified hot spot F in the oldest area of the landfill.
Applsci 13 13164 g013
Figure 14. The overlapping of the identified hotspots and the LFG recovery well locations enables evaluation of the performance of the emissions control system.
Applsci 13 13164 g014
Table 1. UAV platform specification parameters.
Specifications
Weight920 g
Dimensions347.5 × 283 × 107.7 mm
Autonomy45 min
Speed15 m/s
GNSSGPS + Galileo + BeiDou + GLONASS
Table 2. M3T RGB camera features.
Specifications
Sensor size1/2″ CMOS
Resolution4000 × 3000 px
Focal distance4.4 mm
Image formatJPEG
Table 3. M3T thermal camera specifications.
Specifications
Sensor typeUncooled Vox microbolometer
Resolution640 × 512 px
Spectral range8–14 µm
Accuracy±2 °C
Focal distance9.0 mm
Image formatJPEG, R- JPEG
Table 4. Definition of the parameters of the UAV flight plan over the landfill.
Flight Parameters
Height (m)100
Speed (m/s)3
Frontlap (%)80
Sidelap (%)80
Resolution (cm/px)4.77 (RGB) 10.71 (IR)
Number of photographs1289
Flight time (min)87
Disclaimer/Publisher’s Note: The statements, opinions and data contained in all publications are solely those of the individual author(s) and contributor(s) and not of MDPI and/or the editor(s). MDPI and/or the editor(s) disclaim responsibility for any injury to people or property resulting from any ideas, methods, instructions or products referred to in the content.

