Featured Application
Contributing to the development of an innovative performance-based design approach for enhancing the safety and resilience of the built environment in the wildland–urban interface (WUI).
Abstract
This paper presents the results obtained from a field fire test, aiming to reproduce a wildland–urban interface scenario to collect relevant information concerning the impact of wildfires on the built environment. The objective was to understand heat transfer mechanisms from forest fires to structures. During the fire test, the temperatures at the exposed face of one building component were monitored, as well as those in the vicinity of that component, using thermal imaging. The detailed characterization of the field test and building component and obtained experimental results of the fire test were then used to develop and validate a complex computational fluid dynamics model (full physics models) using the Fire Dynamics Simulator (FDS). Several numerical models were previously developed to reproduce the behaviour of individual shrubs and trees in fires considering available results in the literature. The developed Computational Fluid Dynamics (CFD) models can accurately reproduce the field test, including the fire spread and the temperature evolution on the surface of the exposed construction component. The obtained maximum temperature in the construction element was 1038 °C, whereas the maximum average temperature was approximately 638 °C. According to the results from the numerical model, the construction element was exposed to a very high heat flux (above 40 kW/m2), indicating direct contact of the flames with the construction element. The use of CFD enables the quantification of the characteristics of the fire and the exposure of structures to fire in the wildland–urban interface (WUI), allowing for the definition of a performance-based design approach for buildings in the WUI. This contributes to developing safe and resilient structures, as well as mitigating and reducing the impacts of wildfires in the built environment.
1. Introduction
The wildland–urban interface (WUI) refers to the area where human development and wildland or vegetative fuels intermix or overlap. It is characterized by the proximity and potential interaction between structures and flammable vegetation [1,2,3,4,5,6,7]. Nowadays the concepts of intermix and interface are also deeply connected to the definition of WUI, differentiating the areas where human developments and wildland vegetation overlap (intermix) from the areas adjacent to a densely vegetated wildland (interface) [2,7].
The general trends in WUI dynamics indicate that the expansion of human settlements into previously uninhabited or sparsely populated areas will continue, which may worsen the problem in the near future. This trend is primarily driven by population growth and urban sprawl, land use changes through the conversion of agricultural and/or forest areas into urban ones, economic and infrastructure developments in rural areas (tourism and the chase for natural amenities), and climate change [1,7].
Fires in the WUI are becoming increasingly frequent around the world, mainly due to human activities, the continuous expansion of urban areas into forested regions, and the abandonment of rural activities that contribute to increased fuel continuity [1,2,3,4,5,6,7,8,9]. Additionally, short-term global climate change scenarios show how they will actively contribute to exacerbating the fire risk due to the increase in recurrent and longer heatwaves and dry periods [10,11]. Consequently, fires at the WUI and their impacts have increased significantly [12] in the last few decades. The catastrophic events in Portugal in 2017 resulting in 114 fatalities [13,14] and the 2018 Camp Fire in Northern California resulting in 82 fatalities [15,16] are a few clear examples of the severe impacts arising from uncontrolled wildfires reaching the WUI. The loss of property in these cases was huge; 458 homes and 521 industrial buildings were damaged in Portugal in 2017 [14,17,18], with an estimated cost of EUR 1.5 billion. In 2022, according to the European Forest Fire Information System (EFFIS, https://effis.jrc.ec.europa.eu/ (accessed on 4 December 2023)), the burned area in Europe was one of the highest ever recorded since 2006, affecting several countries such as Portugal, Romania, and Spain.
The increasing frequency of such events leads to the need for a detailed understanding and mapping of the critical WUI areas around the world, employing strategies and methodologies that enable permanent updates [2]. Several studies show that, worldwide, the WUI increased significantly in the last few decades [2,3,4,7], taking into consideration mapping methods relying on building density, vegetation proportion and cover, and distance from buildings to high-density vegetation (zonal approach for mapping the WUI) [2,7]. Shug et al. [7] presented a comprehensive study characterizing the global WUI, concluding that by 2020, the total WUI area was about 4.7% of the global land area. The majority (3.6%) represented intermix areas, illustrating the territorial sprawl of urban areas. A more focused study was performed in Portugal, adopting a novel strategy for mapping the WUI and defining the concepts of direct (urban areas in physical contact with flammable vegetation) and indirect (urban areas are less than a specified distance away from flammable vegetation) interface [19]. The adopted approach to WUI delineation mapped 29,977 km of direct WUI and 11,192 km of indirect WUI in Portugal and identified substantial regional variations in the length and density of both kinds of WUI, reflecting differences in the degree of urbanization and extent of wildlands, and indicating different levels of urban area exposure to wildfires [19]. José M. Pereira et al. [19] also discussed the WUI length and density as the ratio of WUI length to urban area. In the case of Portugal, the WUI density was the highest in thinly urbanized, rural areas which are located in the most fire-prone regions [19]. This indicates the predominance of the most critical areas as the ones in the WUI intermix, where scattered houses intermingle with wildland vegetation. More recently, Bar-Massada et al. [20] presented the first high-resolution WUI map of Europe, showing that the WUI covers approximately 7.4% of the European area. Different mapping approaches have been adopted worldwide, mainly using two types of land cover, namely built-up areas and flammable vegetation, but considering different approaches to quantify the two types of land cover [2,7,19,20].
One of the greatest challenges associated with the fire risk in the WUI is the vulnerability of structures and infrastructures to ignition mechanisms [21] resulting from exposure to direct flame contact and heat fluxes from fires or firebrands. It is worth noting that Potter and Leonard stated that 90% of building ignitions occur due to firebrands [22]. The WUI fire problem is extremely complex due to the interaction between multiple influencing factors [23]. The most relevant influencing factors are the fuel type arrangement and accumulation, weather conditions and impacts of climate change, human activities, community design and structure vulnerability, fire suppression capabilities and management strategies, and finally community preparedness and awareness. In the vicinity of the built environment, a comprehensive understanding of the ignition and combustion of both natural and non-natural fuels is crucial [24,25]. Spot fires, primarily initiated by firebrands, are microscale events occurring in the “Home Ignition Zone” (HIZ) as defined by Cohen [26]. Protecting this HIZ relies on the definition of a protected space where preventive actions like cleaning, avoiding the deposit of fuels, and maintaining a safe distance from vegetation are undertaken regularly. However, additional measures are needed at the structure level, ensuring that, in the vicinity of forests, structures fulfil additional requirements in terms of fire safety (structures exposed to external fires), going beyond the traditional requirements for compartment fires. Some standards already present specific guidelines for the design of buildings in the vicinity of forest areas, such as the AS 3959 [27]. Assessing the behaviour of structures exposed to forest fires is nowadays a critical global concern, requiring extensive experimental [28,29,30,31,32] and numerical investigations [33,34,35,36,37] to ensure a deep understanding of the involved phenomena. This deeper understanding will enable the development and implementation of innovative and intelligent technical solutions and the extensive use of the performance-based design approach to enhance the resistance and resilience of the built environment.
Computational Fluid Dynamics tools, such as the Fire Dynamics Simulator (FDS) [38], have been widely used to model fire scenarios at the microscale level, assessing and quantifying the characteristics of the modelled fire scenario. FDS is well-suited for simulating complex fire scenarios, including modelling of fire dynamics, combustion, and heat transfer, since it can reproduce intricate interactions between fire and the surrounding environment. Moreover, the reported research involves complex scenarios where the fire interacts with structural geometries representative of the built environment. FDS [38] is a well-validated tool [39] but still requires further developments, for instance on the generation of firebrands and their interaction with structures. Firebrands are modelled as Lagrangian particles including their thermo-physical properties, geometric parameters, transport, and behaviour [40]; however, the basic characteristics, namely the release rate and speed, must be defined as inputs to the model. As some examples of the highly relevant investigations conducted using FDS, one can mention the work performed by Khan et al. [41] and Vanella et al. [36]. Khan et al. [41] used FDS to reproduce the model outlined in the AS 3959 standard [27] and to perform additional parametric studies by varying wind velocity, fuel load, and moisture content of the vegetation. It was found that by modifying the previously mentioned parameters, much larger incident radiant heat fluxes to the structure could be found. Vanella et al. [36] tested different modelling strategies, namely the Particle Model, the Boundary Fuel Model, and the Level Set Method, for different length scales, showing the suitability of FDS for accurately modelling fire spread at different scales. Some relevant studies have already been conducted concerning firebrands’ generation and transport by fire buoyancy [37,40], assessing the influence of firebrand characteristics and fire intensity in the observed distribution. Generally, it was demonstrated that the developed models were qualitatively similar to the experimental data for short-range spotting for Eucalyptus vegetation [40,42].
In this investigation, a field fire test was performed, assessing the impacts of a wildfire on a building component (sandwich panels). The building component was instrumented with disk type-K thermocouples to monitor the temperature evolution during the fire test. Additionally, an IR camera, static cameras, and drones were used to monitor both fire spread and temperature evolution. Based on the detailed characterization of the field test, numerical models using FDS were developed, modelling explicitly the terrain, the vegetation, and the building component (construction product). The goal was to reproduce, in detail and accurately, the fire scenario in the real test in order to quantify, using the CFD model, the basic heat transfer mechanisms occurring from the wildfire to the building component (heat release rate, radiative heat fluxes, gas, and surface temperatures, etc.). In particular, for this analysis, topography, meteorology, materials, and fuels were modelled explicitly following the information collected during the experimental test.
This investigation contributes to the definition of a performance-based design approach for buildings in the WUI by characterizing and quantifying the thermal action. Note that significant limitations still exist, and that further research is needed to ensure the full integration and coupling between CFD and the Finite Element Model (FEM). This integration is necessary to evaluate the mechanical behaviour of structures exposed to wildfires, considering explicitly the degradation of material properties as temperature increases.
2. Materials and Methods
2.1. Description of the Field Test
The field fire test was conducted in the central region of Portugal, in Lousã, with the cooperation of the National School for Firefighters (ENB). The experimental test was performed in November 2021. The GPS coordinates of the field are 40°08′49.6″ N and 8°14′44.6″ W, respectively, and the altitude is 122 m above sea level. The field was previously prepared, and a triangular shape was considered for the test. The test field was approximately 1400 m2. The length was approximately 70 m, and the width was 40 m (Figure 1a). The average slope is approximately 10%. The fuel break delimiting the test field was the only intervention, creating a path and clear zones to position all the equipment used. A few trees were also in the field, namely 3 Pinus pinaster trees located at the top of the test field (Figure 1). The vegetation is characterized by the presence of grass and low–medium height shrubs (0.5 to 1.5 m in height) and the Pinus pinaster trees with a maximum height of 9 m. The most common shrub species in the field were Ulex europaeus from the Fabaceae family.
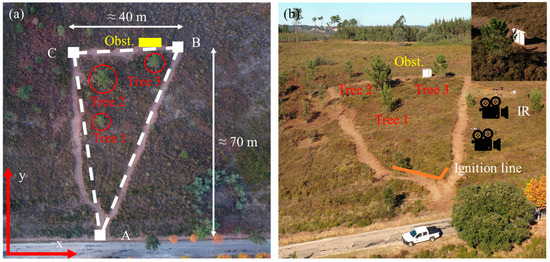
Figure 1.
Overview of the field: (a) main dimensions, (b) positioning of the obstruction, IR camera, and ignition line.
On the top of the field, a building component was positioned (Figure 1). As previously mentioned, the objective of the test was to gather information concerning the combustion and fire spread and quantify the temperature evolution in the building components mimicking real structures. In this case, sandwich panels with a polyurethane (PUR, with a density of 40 kg/m3) core were used. This type of construction product is widely used as cladding in industrial buildings. The external metallic layers of the sandwich panels were fabricated in S250GD+Z steel, according to EN 10346 [43], with a thickness of 0.5 mm. The height of the panels was 2.5 m, and the width was 1.0 m. The thickness of the vertical panels was 200 mm, whereas the thickness of the top horizontal panel was 80 mm. The reaction to fire classification of PUR according to EN 13501-1 [44] is B-s2, d0.
The physical obstruction, comprising a set of sandwich panels, was instrumented with 15 disk type-K (TMS Europe, Hope Valley, UK; chrome–alumel wires, Cr-Al) thermocouples at different locations, as depicted in Figure 2, to monitor, during the entire test, the temperature evolution in the surface of the panel when exposed to a wildfire. The distances between shrubs and the building component and between the tree (Tree 3) and the building component were 0.5 and 5 m, respectively. The fire test was also monitored using drones, stationary cameras, and IR cameras (FLIR A600, through FLIR representative MRA, Grupo ALAVA, Lisbon, Portugal), positioned approximately 25 m from the building component. The field was ignited from the bottom part of the field, hence reproducing an upslope fire scenario. The ignition was performed using a drip torch.
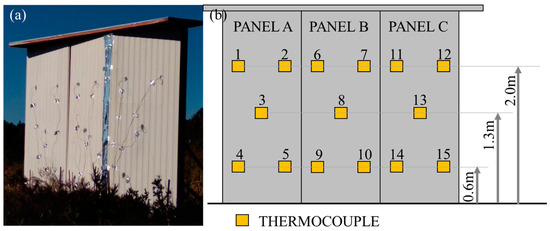
Figure 2.
Positioning of the disk type-K thermocouples (a) on the real structures and (b) schematic view.
The weather conditions were assessed and monitored before the test for that specific location. Additional data was also provided by IPMA (Instituto Português do Mar e da Atmosfera, Lisbon, Portugal). The average weather conditions were as follows: ambient temperature of 20.6 °C, relative humidity of 43%, and a wind velocity of 1.5 m/s in the northeast (NE) direction. It is worth mentioning that one of the most important objectives of this test was to collect data to feed the advanced full-physics CFD models under development. In the following section, the full-physics model developed to reproduce this experimental test is described.
2.2. Development of the Full-Physics Model
The full-physics model (physics and chemistry of fire spread are simulated) was developed using the Fire Dynamics Simulator (FDS 6.7.8) software [38]. FDS is a CFD software developed by the National Institute of Standards and Technology (NIST). It was initially developed to model compartment fires, but it is also a capable tool for modelling wildfires, and specifically wildfires in the WUI, focusing mainly on microscale scenarios. Full-physics CFD models demand very high computational resources, making them unsuitable for reproducing large wildfire scenarios. However, for microscale scenarios, this tool is of utmost importance to further understand heat transfer phenomena and fire spread from forest fires to fires in the built environment. In this investigation, FDS version 6.7.8 was used.
FDS numerically solves a form of the Navier–Stokes equations, appropriate for low-speed Mach number, thermally driven fluid, focusing on smoke and heat transport from fires [30]. Fluid dynamics is solved using three governing equations referring to the conservation of mass, momentum, and energy [30]. FDS provides the Lagrangian Particle Model (LPM) to model different types of vegetation and consequent fire spread in the vegetation. Grass, trees, and firebrands can be modelled as a collection of Lagrangian particles that are eventually heated by radiation and convection [36]. The vegetation, including the canopy of the trees and shrubs, is able to absorb and emit heat and undergo thermal degradation. Using the LPM, the fire spread rate is computed by the model provided that all thermo-physical properties are provided. The pyrolysis model consists of three reactions, namely the endothermic moisture evaporation, the endothermic pyrolysis of dry vegetation, and exothermic char oxidation. The pyrolysis model obeyed an Arrhenius rate law, which defines a finite-rate reaction where the temperature-dependent reactions are characterized and based on the activation energy and Boltzmann distribution [38].
Exploring the capabilities of the software and showing the ability to reproduce vegetation in fire, a set of preliminary numerical models were developed, aiming to reproduce the behaviour of single trees and shrubs in fire. Available results in the literature were selected. The experimental study on single Douglas fir trees in fire reported by Mell et al. [40] and the study on the ignition of a cylindrical wire mesh basket filled with Pinus pinaster, reported by Dupuy et al. [45] and Mell et al. [46], were reproduced with FDS.
To model the shrubs, it is assumed that they are composed primarily of cellulose (C2.28H6.34O2.44). The heat of combustion is 15,600 kJ/kg. The fuel density is 640 kg/m3, and the bulk density is 20 kg/m3. The dimensionless drag coefficient used is 2.8. Additional thermophysical data and material properties can be found in Mell et al. [36]. During these preliminary numerical tests on a single tree and shrub, the computational domain was a volume of 1 × 1 × 2.4 m3 (in x, y, and z directions) with cubic grid cells of 2 cm.
To model the Douglas fir trees in the fire, the physical and thermal properties presented in Table 1 were used. The Douglas fir trees presented different heights and moisture content, ranging from 2 to 5 m and from 14% to 49%, respectively. To improve the calibration, different fuel chemical compositions were tested, namely C3.4H6.2O2.5 [47], CH1.7O0.74N0.002 [30], and C6H10O5 (i.e., cellulose), as found in Browne [48]. The heat of combustion was 14,516 kJ/kg [24]. Referring to grid size, two mesh sizes were tested: 25 cm and 10 cm. The 10 cm size was the same computational grid used by Mell et al. [39].

Table 1.
Physical and thermal properties used to reproduce the Douglas fir trees.
To model the field fire test, similar strategies and assumptions were used. The full test field was reproduced, as depicted in Figure 3. Figure 4 provides detailed information on the meshes adopted for the numerical model. For reproducing the terrain (modelled as an obstruction), the topography provided for the numerical model was extracted from the Digital Elevation Model (DEM; https://spacedata.copernicus.eu/collections/copernicus-digital-elevation-model (accessed on 4 December 2023)) of Copernicus. The extension of the domain is 55 m × 90 m × 33 m (in the x, y, and z directions). In total, 74 meshes were used, and different grid resolutions (with grid size cells ranging from 3.125 cm to 50 cm) were adopted with smaller resolutions when approaching the building component at the top of the field. In Figure 4, the 74 meshes adopted are represented, using different colours. The vegetation was modelled following the strategies described before, considering a fuel moisture content (FMC) of 30% for the trees and 8% for the shrubs. Also, a mass per volume of 20 kg/m3 and a particle surface density of 0.3 kg/m2 were used for the shrubs and grass, respectively.
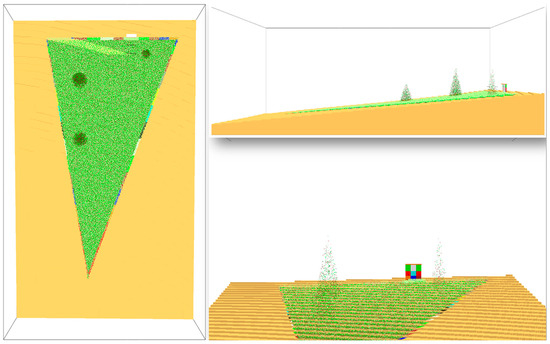
Figure 3.
Geometric configuration of the field test modelled using FDS.
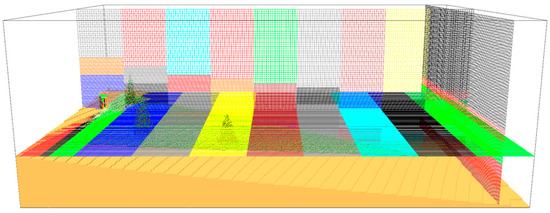
Figure 4.
Adopted meshes in the FDS model.
In this case, the key grid size is 25 cm since it is well-established in the literature for WUI scenarios [49]. Lateral boundaries (X = 0 m, X = 65 m, Y = 0 m, Y = 95 m) and the top boundary (Z = 33 m) were modelled as open. The wind field was specified via the Monin–Obukhov [50] similarity parameters as described by Vanella et al. [36], considering a wind speed of 1.7 m/s blowing from south to north.
Three categories of natural fuel were considered in this model: grass, shrubs, and trees. These three natural fuels were modelled considering the Lagrangian Particle Model (LPM). In Table 2, all properties used as input are presented. Additionally, non-natural fuels, such as polyurethane (the core of the steel sandwich panel) and steel, were also modelled. Details can be found in Table 3. However, it is worth mentioning that the pyrolysis of the sandwich model was not modelled in this investigation, as the main objective was to characterize and quantify the thermal attack by the wildfire.
Table 2.
Physical and thermal properties used to reproduce shrubs and grass.
Table 3.
Other material properties are used as input in the model.
3. Results
3.1. Experimental Test
As previously mentioned, ignition occurred at point A (Figure 1a) to obtain an upslope fire spread. The fire front developed and advanced upslope at a constant rate, eventually reaching the trees in the field and the building component positioned at the top of the test field (Figure 5). The total duration of the test was approximately 40 min, during which two distinct stages can be identified. The first stage corresponds to the fire spread in the vegetation with a duration of 20 min, while the second stage involves the combustion of the building component, which also lasted for approximately 20 min.
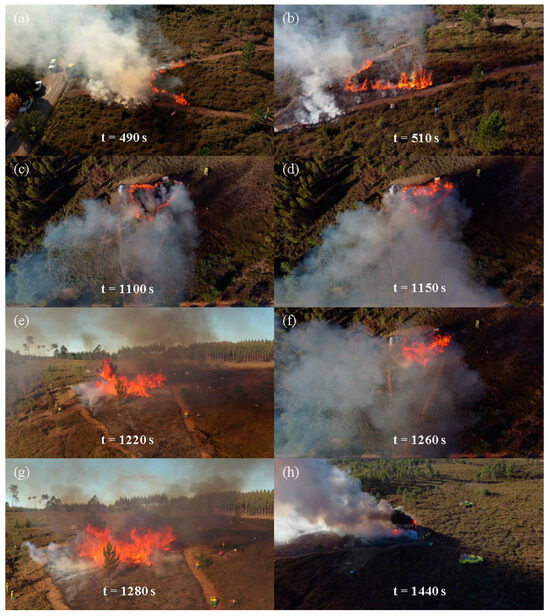
Figure 5.
Fire spread in the test field and ignition and combustion of the building component.
The cumulative rate of spread for the first stage of the fire was approximately 0.06 m/s. The maximum flame height recorded was approximately 10 m. During the fire spread, a curved (or V-shape, also following the shape of the fireline) shape was observed (see Figure 5), similar to what was reported by other authors [51,52,53], even if, in this specific scenario, the imposed fireline contributed more to the observed shape of the fire.
The largest amount of available fuel was located near to the top, with a shrub height between 1 and 1.5 m. At this location, dead fuel (moisture content of approximately 8%) cut from the perimeter of the field was positioned to increase the fuel load near the building component. Under direct exposure, the building component started to pyrolyze and ignited, completely burning the inner combustible core of the sandwich panel. The ignition started in the top part of the building component, which is consistent with the information collected from the disk type-K thermocouples. The ignition of the panel started at about 1200 s, and the wildfire extinction occurred at about 1650 s, which means that the recorded temperatures from 1650 s up to 2200 s correspond strictly to the combustion (including the decay phase) of the building component on fire. From 1200 s up to 1650 s, the recorded data was mainly a result of the building component being on fire, with a reduced contribution from the wildfire since it was already in its decay phase. The degradation of the mechanical properties of steel led to significant deformations in the sandwich panel and the separation of the steel parts from the core, allowing the complete combustion of the core. The temperature evolution recorded by the thermocouples is depicted in Figure 6. The position of the thermocouples is depicted in Figure 2. The temperature increase in the exposed surface of the building component was extremely fast, and the peak temperature was attained in the thermocouples located at the top of the building component. The maximum temperature of 1037.6 °C was recorded by thermocouple 11 (located on Panel C identified in Figure 2). Considering all recorded data, the maximum average temperature recorded was approximately 638 °C. During the test, it was observed that the ignition of the construction component occurred approximately at the beginning of the decay phase of the wildfire. As detailed in Figure 6, the building component kept burning even after the extinction of the wildfire. This was due to the presence of non-natural fuel (PUR foam) inside the panel.
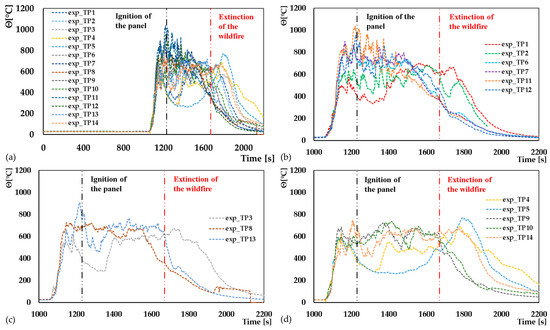
Figure 6.
Temperature evolution is monitored by thermocouples: (a) all, (b) top, (c) middle and (d) bottom.
Snapshots retrieved from the IR images are presented in Figure 7, where the maximum temperature in that specific frame is indicated.
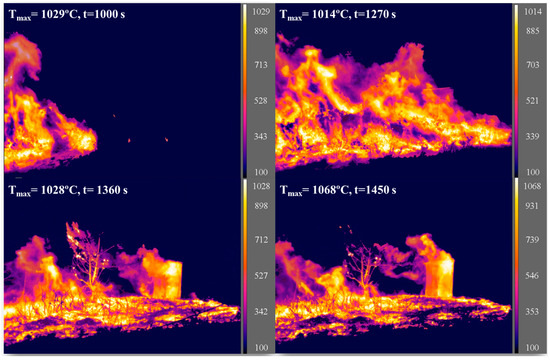
Figure 7.
Snapshots taken from the IR video recording.
3.2. Full-Physics Model Results
Explicitly modelling wildfire scenarios using full-physics models is a very complex and demanding task that still requires enhancements to ensure that the involved phenomena are accurately and reliably reproduced. To gain a deeper understanding of the most suitable modelling assumptions and strategies, the fire behaviour of individual trees, reported by Mell et al. [39], and of a cylindrical wire mesh basket filled with Pinus pinaster, reported by Dupuy et al. [45] and Mell et al. [46], was reproduced. Observing the results of the preliminary tests on single trees and shrubs, plotted in Figure 8, it can be stated that the numerical models can reproduce the combustion of different types of vegetation with a good level of accuracy. In Figure 8a, for the case of a tree with a height of 2 m and moisture content (MC) of 14%, the peak MLR values are 2.03 and 1.97 kg/m2/s, respectively, for C3.4H6.2O2.5 and the experimental curve. This means a peak-to-peak MLR difference of 3%. In addition, for a tree of 5 m height and MC of 26% (see Figure 8b), the peak-to-peak MLR difference is 2%, with peak MLR values of 0.409 and 0.418 expressed in kg/s (for C3.4H6.2O2.5 and the experimental curve). Concerning the observed behaviour of the shrub, it is worth noting that the numerical model slightly overpredicts the mass loss rate.
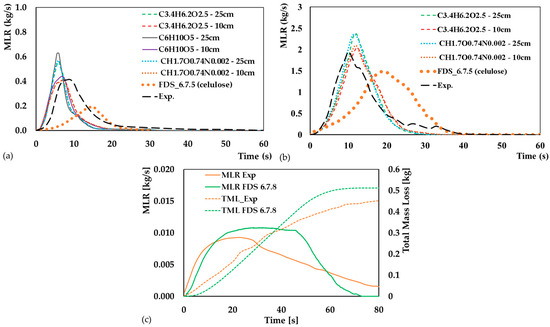
Figure 8.
Comparison between experimental results and FDS results: (a,b) single Douglas fir trees on fire with 2 and 5 m and moisture content of 14 and 26% and (c) shrubs on fire.
Using the previously described strategies and modelling assumptions, the full field fire test was reproduced. The simulation was run on the high-performance computer (HPC) available at the University of Coimbra (https://www.uc.pt/lca, accessed on 4 December 2023). Using 34 CPU cores, the simulation took 312 h to complete. Generally, the full-physics model was able to reproduce the experimental fire scenario both in terms of fire spread and thermal attack on the construction component. The obtained rate of spread was very similar to the experimental one. In Figure 9, the fire spread of the wildfire for different time steps is depicted. Comparing with the information presented in Figure 5, a good agreement can be observed since the fire spread rate and the time from the ignition point to the building component are very similar (approximately 1200 s), indicating that the developed numerical model accurately reproduced the observed fire behaviour and spread.
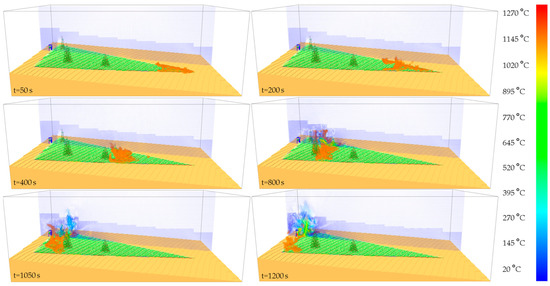
Figure 9.
Snapshots at different time steps of the numerical simulation reproducing the experimental fire scenario.
The temperatures monitored at the exposed surface increased extremely fast at about 1000 s after the beginning of the simulation (reproducing accurately what was observed in the experimental test). Also, the rate of temperature increase in the exposed face of the construction element shows a very good agreement with the experimental results, as depicted in Figure 10 (slope of the experimental and numerical curves plotted). Finally, the extinction of the wildfire in the simulation occurred after approximately 1520 s, which once again is in relatively good agreement (less than 9% difference) with what was observed in the experimental test (1670 s).
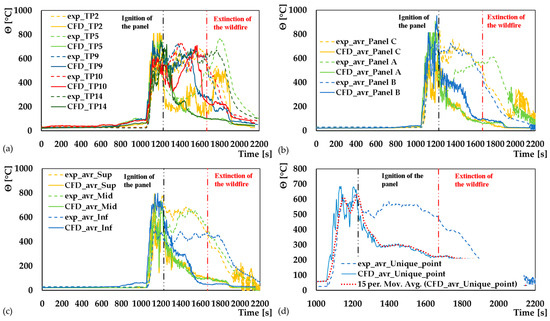
Figure 10.
Comparing experimental and numerical results: (a) individual thermocouples, (b) average results for individual panels, (c) average results for top, middle, and bottom lines of thermocouples, and (d) average results for all thermocouples positioned in the panels.
In Figure 10, the experimental results (dashed lines) are compared with the numerical ones (solid lines). A very good agreement was observed in the initial 1200 s of the reported tests since only the vegetation in fire was being reproduced. The results start to diverge from the moment the sandwich panels ignite. With increasing deformation of the sheet steel part (due to degradation of mechanical properties), suitable conditions were created so that the combustible core could be exposed directly and then burn completely, hence maintaining the temperatures at about 650 °C for a longer period. The decay stage in Figure 6 for the experimental results corresponds to the consumption of the inner core of the panel, whereas the decay stage in Figure 10 for the numerical results corresponds to the consumption of the natural fuel. This occurs at an earlier stage. However, it is worth mentioning, as depicted in Figure 10d, that the developed numerical model accurately reproduced the fire scenario and the fire attack on the construction component (the construction component on fire was not explicitly modelled as this was not the objective of this investigation). Considering the average of all readings from the thermocouples and comparing it with the average of all readings from the numerical model (Figure 10d), it can be concluded that the model can be used to reproduce complex wildfire scenarios in the WUI accurately and reliably.
In Figure 11, details concerning the evolution of the Heat Release Rate (HRR), Mass Loss Rate (MLR) of wood, Incident Radiative Heat Flux (IHF), and Radiative Heat Flux (RHF) are plotted. The maximum Heat Release Rate (HRR) recorded was 342.2 MW and the recorded incident heat fluxes show that the panel could experience thermal pyrolysis, as observed in the experimental test, mainly due to the proximity of vegetation. As an example, the critical incident heat flux for the pyrolysis of polyurethane is about 12.5 kW/m2 and for wood is about 10 kW/m2. Considering the Bushfire Attack Level (BAL) rating used in the Australian standard AS 3959:2009 [27] and the results plotted in Figure 11d, it is clear, as observed, that the construction component was directly exposed to flames (BAL FZ), and the construction elements are exposed to a heat flux greater than 40 kW/m2.
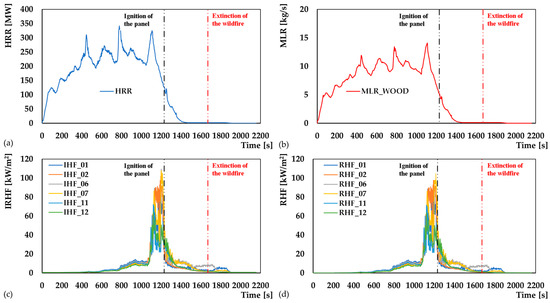
Figure 11.
Global outputs from the numerical simulation: (a) heat release rate, (b) Mass loss rate, (c) incident radiative heat flux, (d) radiative heat flux.
4. Conclusions
This paper outlines a field fire test aimed at simulating the thermal attack of a wildfire on the structure, replicating a realistic WUI fire scenario. Both the field and the building component were instrumented to monitor the temperature evolution at the exposed surfaces. Type-K thermocouples and IR cameras were used to monitor temperature evolution.
Considering the detailed characterization of the test field and the obtained results, full-physics CFD models, using FDS, were developed to reproduce the WUI fire scenario. Overall, the developed models were able to reproduce the experimental fire scenario with a good level of accuracy, showing that numerical modelling is a viable and reliable alternative to costly fire experiments.
Full-physics models can be used to simulate the fire attack on structures, and coupling those results with FEM will allow the complete assessment of the mechanical behaviour of structures exposed to wildfires. The concept of Adiabatic Surface Temperature (AST), as described by Wickstrom et al. [54], will be used to transfer data from CFD to Finite Element Method (FEM) models. The AST is the temperature of a surface which cannot absorb or lose heat to the environment [54,55] and can be used as a boundary condition to the heat transfer analysis to be performed using FEM. This study, as a first attempt, contributes to the definition of a performance-based design approach for structures in the WUI for future incorporation in the next generation of standards, addressing the problem of resistance and resilience of structures against wildfires, by exploring the use of CFD to estimate the thermal attack of a wildfire to the built environment. Future research needs include the explicit consideration of ember attacks.
Author Contributions
Conceptualization, H.D.C.; methodology, H.D.C. and A.S.; software, H.D.C., C.F. and B.G.; validation, H.D.C., C.F. and L.L.; formal analysis, H.D.C., L.L. and A.S.; investigation, H.D.C. and C.F.; writing—original draft preparation, H.D.C.; writing—review and editing, H.D.C., C.F., B.G., L.L. and A.S.; supervision, H.D.C. and A.S.; project administration, H.D.C.; funding acquisition, H.D.C. All authors have read and agreed to the published version of the manuscript.
Funding
The authors gratefully acknowledge the Portuguese Foundation for Science and Technology (FCT) for its support under the framework of the research project PCIF/AGT/0062/2018—“INTERFACESEGURA—Segurança e Resiliência ao Fogo das Zonas e Interface Urbana–Florestal”, financed by FCT through National funds and to the research project “Modelling fire spread from forest to the built environment at the wildland–urban interface (WUI) using Fire Dynamics Simulator”, with reference 2022.15641.CPCA.A1 (National Network for Advanced Computing—NNAC). This work was partly financed by FCT/MCTES through national funds (PIDDAC) under the R&D Unit Institute for Sustainability and Innovation in Structural Engineering (ISISE), under reference UIDB/04029/2020, and under the Associate Laboratory Advanced Production and Intelligent Systems ARISE under reference LA/P/0112/2020. This work is financed by national funds through FCT—Foundation for Science and Technology, under grant agreement 2020.03588.CEECIND attributed to the 1st author and under the grant agreement 2021.08194.BD attributed to the 2nd author.
Institutional Review Board Statement
Not applicable.
Informed Consent Statement
Not applicable.
Data Availability Statement
The data presented in this study are available on request from the corresponding author. The data are not publicly available due to the fact that additional investigations are ongoing considering the collected data.
Acknowledgments
The authors acknowledge the Laboratory for Advanced Computing at the University of Coimbra for providing {High Performance Computing, consulting} resources that contributed to the research results reported within this paper (URL: https://www.uc.pt/lca) and to the Escola Nacional de Bombeiros (ENB; National School for Firefighters) for their support in the preparation and execution of the experimental tests.
Conflicts of Interest
Author Bruno Guillaume was employed by the company EFECTIS. The remaining authors declare that the research was conducted in the absence of any commercial or financial relationships that could be construed as a potential conflict of interest.
References
- Bento-Gonçalves, A.; Vieira, A. Wildfires in the wildland-urban interface: Key concepts and evaluation methodologies. Sci. Total Environ. 2020, 707, 135592. [Google Scholar] [CrossRef] [PubMed]
- Li, S.; Dao, V.; Kumar, M.; Nguyen, P.; Banerjee, T. Mapping the wildland-urban interface in California using remote sensing data. Sci. Rep. 2022, 12, 5789. [Google Scholar] [CrossRef] [PubMed]
- Radeloff, V.C.; Hammer, R.B.; Stewart, S.I.; Fried, J.S.; Holcomb, S.S.; McKeefry, J.F. The wildland–urban interface in the United States. Ecol. Appl. 2005, 15, 799–805. [Google Scholar] [CrossRef]
- Kumar, M.; Li, S.; Nguyen, P.; Banerjee, T. Examining the Existing Definitions of Wildland-Urban Interface for California. Ecosphere 2022, 13, e4306. [Google Scholar] [CrossRef]
- Glickman, D.; Babbitt, B. Urban Wildland Interface Communities with Vicinity of Federal Lands that are at High Risk from Wildfire. Fed. Regist. 2001, 66, 751–777. [Google Scholar]
- Radeloff, V.C.; Helmers, D.P.; Kramer, H.A.; Mockrin, M.H.; Alexandre, P.M.; Bar-Massada, A.; Butsic, V.; Hawbaker, T.J.; Martinuzzi, S.; Syphard, A.D.; et al. Rapid growth of the US wildland-urban interface raises wildfire risk. Proc. Natl. Acad. Sci. USA 2018, 115, 3314–3319. [Google Scholar] [CrossRef] [PubMed]
- Schug, F.; Bar-Massada, A.; Carlson, A.R.; Cox, H.; Hawbaker, T.J.; Helmers, D.; Hostert, P.; Kaim, D.; Kasraee, N.K.; Martinuzzi, S.; et al. The global wildland–urban interface. Nature 2023, 621, 94–99. [Google Scholar] [CrossRef]
- Knorr, W.; Jiang, L.; Arneth, A. Climate, CO2; and human population impacts on global wildfire emissions. Biogeosciences 2016, 13, 267–282. [Google Scholar] [CrossRef]
- Krawchuk, M.A.; Moritz, M.A.; Parisien, M.-A.; Van Dorn, J.; Hayhoe, K. Global Pyrogeography: The Current and Future Distribution of Wildfire. PLoS ONE 2009, 4, e5102. [Google Scholar] [CrossRef]
- Masson-Delmotte, V.P.; Zhai, P.; Pirani, S.L.; Connors, C.; Péan, S.; Berger, N.; Caud, Y.; Chen, L.; Goldfarb, M.I.; Scheel Monteiro, P.M. IPCC, 2021. Summary for Policymakers. Climate Change 2021: The Physical Science Basis. Contribution of Working Group I to the Sixth Assessment Report of the Intergovernmental Panel on Climate Change; CSIR: Cambridge, UK; New York, NY, USA, 2021. [Google Scholar]
- Vilà-Vilardell, L.; Keeton, W.S.; Thom, D.; Gyeltshen, C.; Tshering, K.; Gratzer, G. Climate change effects on wildfire hazards in the wildland-urban-interface—Blue pine forests of Bhutan. For. Ecol. Manag. 2020, 461, 117927. [Google Scholar] [CrossRef]
- Manzello, S.L.; Almand, K.; Guillaume, E.; Vallerent, S.; Hameury, S.; Hakkarainen, T. FORUM position paper. Fire Saf. J. 2018, 100, 64–66. [Google Scholar] [CrossRef] [PubMed]
- Chas-Amil, M.-L.; García-Martínez, E.; Touza, J. Iberian Peninsula October 2017 wildfires: Burned area and population exposure in Galicia (NW of Spain). Int. J. Disaster Risk Reduct. 2020, 48, 101623. [Google Scholar] [CrossRef]
- Oliveira, R.; Oliveira, S.; Zêzere, J.; Viegas, D. Human perception of fire hazard in wildland-urban interface areas: A Portuguese survey analysis of spot fires. In Advances in Forest Fire Research; Imprensa da Universidade de Coimbra: Coimbra, Portugal, 2018; pp. 1130–1136. [Google Scholar] [CrossRef]
- Ager, A.A.; Day, M.A.; Alcasena, F.J.; Evers, C.R.; Short, K.C.; Grenfell, I. Predicting Paradise: Modeling future wildfire disasters in the western US. Sci. Total Environ. 2021, 784, 147057. [Google Scholar] [CrossRef] [PubMed]
- Spearing, L.A.; Faust, K.M. Cascading system impacts of the 2018 Camp Fire in California: The interdependent provision of infrastructure services to displaced populations. Int. J. Disaster Risk Reduct. 2020, 50, 101822. [Google Scholar] [CrossRef]
- Guerreiro, J.; Fonseca, C.; Salgueiro, A.; Fernandes, P.; Lopez Iglésias, E.; de Neufville, R.; Mateus, F.; Ribau, C.; Sande Silva, J.; Moura, J.M. Comissão Técnica Independente. In Avaliação dos Incêndios Ocorridos Entre 14 e 16 de Outubro de 2017 em Portugal Continental. Relatório Final; Assembleia da Republica: Lisbon, Portugal, 2018. [Google Scholar]
- Viegas, D.X.; Almeida, M.; Ribeiro, L.M.; Raposo, J.; Alves, D. An overview of the Fires in Portugal in 2017 Global Observations of Forest Cover. In Proceedings of the GOFC Copernicus Meeting, London, UK, 21 November 2017; Available online: https://gofcgold.org/sites/default/files/fireit_meetings/GOFC_Fire_IT_2017/day2/Viegas.pdf (accessed on 4 December 2023).
- Pereira, J.M.C.; Alexandre, P.M.; Campagnolo, M.L.; Bar-Massada, A.; Radeloff, V.C.; Silva, P.C. Defining and mapping the wildland-urban interface in Portugal. Adv. For. Fire Res. 2018, I, 742–749. [Google Scholar] [CrossRef][Green Version]
- Bar-Massada, A.; Alcasena, F.; Schug, F.; Radeloff, V.C. The wildland-urban interface in Europe: Spatial patterns and association with socioeconomic and demographic variables. Landsc. Urban Plan. 2023, 235, 104759. [Google Scholar] [CrossRef]
- Fernandez, F.; Guillaume, B.; Porterie, B.; Ganteaume, A.; Guerra, F. Modelling fire spread and damage in wildland-urban interfaces. In Advances in Forest Fire Research; Imprensa da Universidade de Coimbra: Coimbra, Portugal, 2018; pp. 818–825. [Google Scholar] [CrossRef]
- Potter, M.; Leonard, J. Spray System Design for Ember Attack—Research Findings and Discussion Paper; CSIRO Sustainable Ecosystems: Canberra, Australia, 2011. [Google Scholar]
- Mell, W.E.; Manzello, S.L.; Maranghides, A.; Butry, D.; Rehm, R.G. The wildland-urban interface fire problem-current approaches and research needs. Int. J. Wildland Fire 2010, 19, 238–251. [Google Scholar] [CrossRef]
- Vacca, P.; Caballero, D.; Pastor, E.; Planas, E. WUI fire risk mitigation in Europe: A performance-based design approach at home-owner level. J. Saf. Sci. Resil. 2020, 1, 97–105. [Google Scholar] [CrossRef]
- Biswas, K.; Werth, D.; Gupta, N. A Home Ignition Assessment Model Applied to Structures in the Wildland-Urban Interface; Thermal Performance of the Exterior Envelopes of Whole Buildings XII; Building Technologies Research and Integration Center: Oak Ridge, TN, USA, 2013. [Google Scholar]
- Cohen, J.D. Preventing disaster: Home ignitability in the wildland-urban interface. J. For. 2000, 98, 15–21. [Google Scholar]
- Construction of Buildings in Bush Fire Prone Areas (AS 3959); Technical report, AS 3959; Standards Australia: Sydney, NSW, Australia, 2009.
- Grishin, A.M.; Filkov, A.I.; Loboda, E.L.; Reyno, V.V.; Kozlov, A.V.; Kuznetsov, V.T.; Kasymov, D.P.; Andreyuk, S.M.; Ivanov, A.I.; Stolyarchuk, N.D. A field experiment on grass fire effects on wooden constructions and peat layer ignition. Int. J. Wildland Fire 2014, 23, 445–449. [Google Scholar] [CrossRef]
- Finney, M.A.; Pearce, G.; Strand, T.; Katurji, M.; Clements, C. New Zealand prescribed fire experiments to test convective heat transfer in wildland fires. In Advances in Forest Fire Research; Imprensa da Universidade de Coimbra: Coimbra, Portugal, 2018; pp. 1288–1292. [Google Scholar] [CrossRef]
- Vaz, G.; Raposo, J.; Reis, L.; Monteiro, P.; Viegas, D. Rigid Protection System of Infrastructures against Forest Fires. Fire 2022, 5, 145. [Google Scholar] [CrossRef]
- Santoni, P.; Simeoni, A.; Rossi, J.; Bosseur, F.; Morandini, F.; Silvani, X.; Balbi, J.; Cancellieri, D.; Rossi, L. Instrumentation of wildland fire: Characterisation of a fire spreading through a Mediterranean shrub. Fire Saf. J. 2006, 41, 171–184. [Google Scholar] [CrossRef]
- Butler, K. Wind-Driven Fire Spread to a Structure from Fences and Mulch; NIST Special Publication: Washington, DC, USA, 2022. [Google Scholar] [CrossRef]
- Ghodrat, M.; Shakeriaski, F.; Nelson, D.J.; Simeoni, A. Existing Improvements in Simulation of Fire–Wind Interaction and Its Effects on Structures. Fire 2021, 4, 27. [Google Scholar] [CrossRef]
- Suzuki, S.; Manzello, S.L. Investigating the Effect of Structure to Structure Separation Distance on Firebrand Accumulation. Front. Mech. Eng. 2021, 6, 628510. [Google Scholar] [CrossRef]
- Ghaderi, M.; Ghodrat, M.; Sharples, J.J. LES Simulation of Wind-Driven Wildfire Interaction with Idealized Structures in the Wildland-Urban Interface. Atmosphere 2020, 12, 21. [Google Scholar] [CrossRef]
- Vanella, M.; McGrattan, K.; McDermott, R.; Forney, G.; Mell, W.; Gissi, E.; Fiorucci, P. A Multi-Fidelity Framework for Wildland Fire Behavior Simulations over Complex Terrain. Atmosphere 2021, 12, 27. [Google Scholar] [CrossRef]
- Wickramasinghe, A.; Khan, N.; Moinuddin, K. Determining Firebrand Generation Rate Using Physics-Based Modelling from Experimental Studies through Inverse Analysis. Fire 2022, 5, 6. [Google Scholar] [CrossRef]
- McGrattan, K.; Hostikka, S.; McDermott, R.; Floyd, J.; Weinschenk, C.; Overholt, K. Fire Dynamics Simulator, User’s Guide; FDS Version 6.7.7; NIST Special Publication: Washington, DC, USA, 2021; p. 402. [Google Scholar]
- Mell, W.; Maranghides, A.; McDermott, R.; Manzello, S.L. Numerical simulation and experiments of burning Douglas fir trees. Combust. Flame 2009, 156, 2023–2041. [Google Scholar] [CrossRef]
- Wadhwani, R.; Sullivan, C.; Wickramasinghe, A.; Kyng, M.; Khan, N.; Moinuddin, K. A review of firebrand studies on generation and transport. Fire Saf. J. 2022, 134, 103674. [Google Scholar] [CrossRef]
- Khan, N.; Sutherland, D.; Wadhwani, R.; Moinuddin, K. Physics-Based Simulation of Heat Load on Structures for Improving Construction Standards for Bushfire Prone Areas. Front. Mech. Eng. 2019, 5, 35. [Google Scholar] [CrossRef]
- Wadhwani, R.; Sutherland, D.; Moinuddin, K. Simulated transport of short-range embers in an idealised bushfire. In Proceedings of the 6th International Fire Behavior and Fuels Conference, Sydney, Australia, 29 April–3 May 2019. [Google Scholar]
- EN 10346:2015; Continuously Hot-Dip Coated Steel Flat Products for Cold Forming—Technical Delivery Conditions. CEN: Brussels, Belgium, 2015.
- EN 13501-1; Fire Classification of Construction Products and Building Elements—Part 1: Classification Using Data from Reaction to Fire Tests. CEN: Brussels, Belgium, 2018.
- Dupuy, J.; Maréchal, J.; Morvan, D. Fires from a cylindrical forest fuel burner: Combustion dynamics and flame properties. Combust. Flame 2003, 135, 65–76. [Google Scholar] [CrossRef]
- Mell, W.E.; Manzello, S.L.; Maranghides, A. Numerical modelling of fire spread through trees and shrubs. For. Ecol. Manag. 2006, 234, S82. [Google Scholar] [CrossRef]
- Hostikka, S.; McGrattan, K.B. Large Eddy Simulation of Wood Combustion. In Proceedings of the Ninth International Interflam Conference, Scotland, UK, 17–19 September 2001; Available online: https://tsapps.nist.gov/publication/get_pdf.cfm?pub_id=861077 (accessed on 4 July 2022).
- Browne, F.L. Theories of the Combustion of Wood and Its Control; Forest Products Laboratory, Forest Service, US Department of Agriculture: Madison, WI, USA, 1950. [Google Scholar]
- Abu-Zidan, Y.; Rathnayaka, S.; Mendis, P.; Nguyen, K. Effect of wind speed and direction on facade fire spread in an isolated rectangular building. Fire Saf. J. 2022, 129, 103570. [Google Scholar] [CrossRef]
- Dyer, A.J. A review of flux-profile relationships. Bound. Layer Meteorol. 1974, 7, 363–372. [Google Scholar] [CrossRef]
- Drissi, M. Modeling the spreading of large-scale wildland fires. In Proceedings of the Large Scale Wildland Fires Conference, Missoula, MT, USA, 19–23 May 2014. [Google Scholar]
- Linn, R.R.; Winterkamp, J.L.; Weise, D.R.; Edminster, C. A numerical study of slope and fuel structure effects on coupled wildfire behaviour. Int. J. Wildland Fire 2010, 19, 179–201. [Google Scholar] [CrossRef]
- Tihay, V.; Morandini, F.; Santoni, P.A.; Perez-Ramirez, Y.; Barboni, T. Combustion of forest litters under slope conditions: Burning rate, heat release rate, convective and radiant fractions for different loads. Combust Flame 2014, 161, 3237–3248. [Google Scholar] [CrossRef]
- Wickstrom, U.; Dathinh, D.; McGrattan, K. Adiabatic surface temperature for calculating heat transfer to fire exposed structures. In Proceedings of the 11th International Conference on Fire Science and Engineering Interflam, London, UK, 3–5 September 2007. [Google Scholar]
- Wickström, U. The adiabatic surface temperature and the plate thermometer. Fire Saf. Sci. 2011, 10, 1001–1011. [Google Scholar] [CrossRef]


Disclaimer/Publisher’s Note: The statements, opinions and data contained in all publications are solely those of the individual author(s) and contributor(s) and not of MDPI and/or the editor(s). MDPI and/or the editor(s) disclaim responsibility for any injury to people or property resulting from any ideas, methods, instructions or products referred to in the content. |
© 2023 by the authors. Licensee MDPI, Basel, Switzerland. This article is an open access article distributed under the terms and conditions of the Creative Commons Attribution (CC BY) license (https://creativecommons.org/licenses/by/4.0/).