Article

A Single-Cell Electroporation Model for Quantitatively Estimating the Pore Area Ratio by High-Frequency Irreversible Electroporation

1
Division of Biomedical Engineering, College of Engineering, University of Saskatchewan, Saskatoon, SK S7N 5A9, Canada
2
Intelligent Energy-Based Tumor Ablation Laboratory, School of Mechatronic Engineering and Automation, Shanghai University, Shanghai 200444, China
3
Department of Surgery, College of Medicine, University of Saskatchewan, Saskatoon, SK S7N 5E5, Canada
*
Authors to whom correspondence should be addressed.
Appl. Sci. 2023, 13(3), 1808; https://doi.org/10.3390/app13031808
Submission received: 13 December 2022 / Revised: 25 January 2023 / Accepted: 28 January 2023 / Published: 31 January 2023

Abstract

:

Featured Application

Electroporation-based techniques, e.g., tumor ablation, cardiac ablation, bacterial decontamination, gene electrotransfer, and electrochemotherapy.

Abstract

The electroporation technique utilizes pulsed electric fields to induce porous defects in the cell membrane, and the technique can be used for delivering drugs into cells and killing cancer cells. To develop an electric pulse protocol in the clinic with this technique, the key issue is to understand the evolution of pores in the cell membrane during the process of electroporation. This paper presents a study to address this issue. Specifically, a mathematical model of single-cell electroporation (SCE) was developed, which includes pore area ratio (PAR) as an indicator of the electroporation dynamics and area weight for considering the 3D nature of cells. The model was employed to simulate the electroporation of a single cell with different high-frequency irreversible electroporation (H-FIRE) protocols. The simulation result has found that the change of PAR with respect to the time duration of electroporation follows a sigmoid pattern to increase under specific protocols, which is called the cumulative effect of PAR. Subsequently, the relationship between the protocol of H-FIRE, described by a set of pulse parameters such as pulse width, pulse delay, electric field strength, and pulse burst duration, and the cumulative effect of PAR was established, which thereby allows designing the protocol to kill cells effectively. The study concluded that the proposed SCE model, along with the cumulative effect of PAR, is useful in designing H-FIRE protocols for the ablation of cancer tumors in the clinic.

1. Introduction

Electroporation is the term that describes the creation of porous defects in the cell membrane when the cell is exposed to a pulsed electric field (PEF) [1,2,3]. Electroporation can be used in two ways: reversible and irreversible. For reversible electroporation (RE), the pores in nanometers induced in the cell membrane are transient and expected to recover after the removal of the PEF; this process has been used to introduce drugs or DNA into cells [4,5,6,7,8]. In the case of irreversible electroporation (IRE), however, larger pores are created, pores that are not able to recover and which will lead to permanent injuries and eventual cell death. IRE has been used for bacterial decontamination [9,10] and tissue ablation [11,12,13,14,15,16]. The generation of pores in the cell membrane has been thought to depend on the pulsing protocol of the PEF, described by a set of parameters such as pulse width, pulse strength, and the rate that pulses are delivered [17,18]. There is a need to quantitatively describe the relationship between the pulsing protocol and pore evolution in the cell membrane, and this would allow further customization of this promising technique for different scenarios [19,20,21,22].
Currently, several probing techniques have been applied to provide insights into electroporation, such as fluorescent dyes [23], cell impedance monitoring [24], and transmembrane potential visualization [25]. However, the information acquired from these methods is not enough to reflect an event in which the temporal and spatial resolution is at the micro- or nanoscale. On the other hand, the mathematical modelling of electroporation has yielded acceptable results in the prediction of pore evolution [26,27,28]. With the development of numerical techniques, mathematical modelling has become a powerful tool in providing a dynamic analysis for electroporation [29,30] and has been widely acknowledged in relevant fields [31,32].
State-of-the-art mathematical modelling of electroporation should suffice to describe the pore evolution, i.e., pore formation, pore expansion, and pore resealing [2,33]. Because the size of a pore can be precisely characterized by the mathematical model of electroporation, increasing attention has been garnered in pore size monitoring [34], specifically, the termination of the pore (i.e., recoverable or irrecoverable) [35,36]. However, currently, the relationship between the pulsing protocols and the pore evolution is yet to be explored. In this study, the ratio of the total area of all the pores on a cell to the surface area of the cell membrane (the pore area ratio, PAR) was adopted as an indicator of the overall pore evolution. The PAR integrates pore number and pore size to characterize the dynamics of electroporation in a single cell.
The surface tension of the cell membrane has not been accounted for in pore evolution using PAR as an indicator [35,37]. Furthermore, in prior reports, cells were considered in two dimensions in existing mathematical models of electroporation [28,34,36,37], which inevitably sacrificed accuracy in the estimation of the PAR. To address this issue, an area weight (explained in Section 2.1) was proposed in this study to allow cells to be considered in a three-dimensional manner.
The second generation of PEF, high-frequency irreversible electroporation (H-FIRE), has attracted great interest in the field of tissue ablation due to the fact that electric pulses can be administered without nerve activation or muscle contractions [38,39,40,41,42]. An H-FIRE protocol usually includes the selection of several pulse-setting parameters, such as positive pulse and negative pulse widths, inter-phase and inter-pulse delays, pulse burst duration, and pulse frequency. It is noteworthy that no study has yet delineated the relationship between the pulse-setting parameters of H-FIRE and the dynamics of electroporation (i.e., PAR). However, it is increasingly clear that a comprehensive understanding of such a relationship is critical in the design of H-FIRE protocols for desirable clinical outcomes [41,43,44,45]. Therefore, a single-cell electroporation (SCE) model considering PAR and area weight was established to study the relationship between the pulse-setting parameters of H-FIRE protocols and the dynamics of electroporation.

2. Materials and Methods

2.1. Mathematical Modelling of Electroporation

In this study, a spherical cell with a radius of 10 μ m was immersed in conductive media and exposed to an equivalent PEF generated by two parallel plates, as shown in Figure 1a. The electric potential distribution in this model was governed by Equation (1).
λ ψ ε 0 ε r t ψ = 0 ,
where ψ represents the electric potential, λ denotes the conductivity, ε 0 is the permittivity of free space, and ε r is the relative dielectric constant.
The transmembrane potential (TMP) is defined as the difference between the potential at the inner side of the membrane ψ i t and the outer side of the membrane ψ o t ,
Δ ψ = ψ i t ψ o t .
When a pore is formed, there will be an extra conductive pathway for current density besides the conduction current density and the induction current density, as follows:
J t = λ m 0 Δ ψ d + ε 0 ε m e m d Δ ψ t + J E P t ,
where the first item means the conduction current density, λ m 0 is the initial conductivity of the plasm membrane, and d is the thickness of the plasm membrane; the second item represents the induction current density, and ε m e m is the relative dielectric constant; the third item denotes the current density induced by electroporation, and it is further determined by Equation (4).
J E P t = i E P t N t ,
where i E P t represents the current density passing through an individual pore, and N t represents the pore density.
The current-voltage relationship of an individual pore, i E P t , can be described as:
i E P t = Δ ψ R p + R i = Δ ψ d λ p π r 2 + 1 2 λ p r ,
where R p represents pore resistance and R i represents input resistance, which are in series [46,47], λ p means the conductivity of the solution filling the pore, and r is the radius of the pore. Equation (5) provides a nonlinear relationship between the pore radius and its conductance, contrary to the assumption that conductance is irrelevant to the pore size [30,37].
To simplify the calculation, the dynamic conductivity of the plasm membrane, λ m t , was introduced to merge the J E P t into the conduction current density:
λ m t = λ m 0 + N t d R p + R i ,
J t = λ m t Δ ψ d + ε 0 ε m e m d Δ ψ t .
To reduce the calculation cost, this study ignores the hydrophobic stage in the pore evolution process and assumes that all nanopores appear with an initial radius r * . The rate of pore production is determined by an ordinary differential equation,
d N t d t = α e Δ ψ t V E P 2 1 N t N 0 e q Δ ψ t V E P 2 ,
where V E P is the characteristic voltage of electroporation, N 0 is the equilibrium pore density for Δ ψ = 0 , α is the creation rate coefficient, and q is the constant for pore creation rate. Equation (8) is solved with an initial condition N t = 0 (no pores) and can describe not only pore creation but also pore resealing [48].
The mechanical variation determines the pore size during the pore evolution; more specifically, the rate of radius change is related to the electric force induced by the local TMP, the steric repulsion of lipid heads, the line tension acting on the pore perimeter, and the surface tension of the cell membrane. Their mathematical relationship is described as
d r d t = D k T Δ ψ 2 F m a x 1 + r h r + r t + 4 β r * r 4 1 r 2 π γ + 2 π σ e f f r ,
where D is the diffusion coefficient of the pore radius, k is the Boltzmann constant, T is the absolute temperature, F m a x is the maximum electric force when TMP is equal to 1, r h and r t are two constants for advection velocity, β is the steric repulsion energy, r * is the minimum radius of hydrophilic pores, γ is the edge energy, and σ e f f is the effective surface tension of the membrane, which varies with A p , the combined area of all existing pores on the membrane, as shown in Equation (10).
σ e f f A p = 2 δ 2 δ δ 0 1 A p A c 2 ,
where δ is the energy per area of the hydrocarbon-water interface, δ 0 is the tension of the membrane without pores, and A c is the surface area of the cell. Here, A p / A c actually is the PAR.
Previous studies [37,41] adopted a line integral along the membrane boundary, calculated as A p as A p = L N t π r 2 d l , which ignores the area weight of different polar angles. Given the rotation symmetry of a sphere, an area weight was taken into consideration in this study, and A p is governed as
A p = L N ( t ) π r 2 · π r c | sin θ | d l ,
where the differential of arc, d l , at different positions θ has a different area weight, π r c sin θ , represented by the red semicircular arch, as shown in Figure 1b.

2.2. Numerical Implementation of the SCE Model

In the present study, a standard sphere was adopted in the 2D SCE model, as shown in Figure 1a, in which a 10- μ m -radius cell with a 5- nm plasma membrane was surrounded by 200- μ m -length intracellular media. It was worth mentioning that a parameter θ was used to indicate the differential of arc, d l , with a different position on the plasma membrane. The numerical implementation of this SCE model was conducted using the commercial finite element software (COMSOL Multiphysics 5.5, COMSOL Inc., Burlington, MA, USA).
The SCE model was solved in conjunction with the transient state solution in the electric currents module for calculating the space potential and the ordinary differential equations (ODE) module for pore density and pore radius. The transmembrane potential (TMP) varies with θ such that a set variable containing a series of Δ ψ along the circumference was defined for the ODE calculation. In this study, we applied the linear extrusion operator to define the electric potential difference between the inner and outer membrane. Then, we adopted the general extrusion operator to extend its definition into the whole plasma membrane area. In this way, we can obtain such a set variable.
By assigning the plasm membrane domain the dynamic conductivity, the electric currents module was coupled with the ODE module to construct an interaction loop for pore evolution and electric field distribution.
To describe the resting potential of the cell before electroporation, the initial conditions of the domain outside and inside the plasma membrane were set as:
ψ i 0 = V r e s t ψ o 0 = 0 .
One of a pair of plate electrodes was set to the H-FIRE protocols, while the other was set to ground, which is for creating an equivalent parallel electric field.
All other external domain boundaries that did not contact another domain were set as electrical insulation.
A free triangular mesh was generated in the model except for the plasma membrane domain, which was constructed by the mapped mesh, as shown in Figure 1c.
The simulations required approximately 15 min to solve for each protocol on an Intel i7-8550U processor with 8 GB of RAM.

2.3. Simulation Protocols

In this study, the symmetric bipolar H-FIRE protocols were investigated, which are composed of three pulse-setting parameters (pulse width, pulse delay, and pulse burst duration), as shown in Figure 1d. To simplify the discussion of the H-FIRE protocols, a shorthand notation P–D–N is used, where P is the positive pulse width, N is the negative pulse width, and D is the pulse delay between alternating polarity pulses, all in microseconds. The reason to investigate the symmetric bipolar protocols lies in their unique effect on migrating muscle contraction and, consequently, their dominating usage in clinical applications. The value and the source of the physical variables used in the simulation are listed in Table 1.

3. Results

Electroporation is a spatial-temporal dynamic process occurring at the plasma membrane. To have a comprehensive understanding of the H-FIRE protocols, the spatial-temporal changes of transmembrane potential (TMP), pore density, pore radius, and PAR, respectively, are shown in Figure 2.

3.1. Membrane Partition Based on Pore Evolution Pattern

In this study, the plasma membrane can be separated into three subregions based on different patterns of pore evolution regarding polar angle θ , i.e., polar region (0°~X°), transition region (X°~Y°), and equatorial region (Y°~90°), as indicated in Figure 1a. The pores in the polar region are the densest, but they are unable to grow. The key distinguishing feature between the transition and the polar regions is that the pores in the transition region can continuously expand with pulse delivery. The equatorial region can be considered irrelevant to electroporation because the normal electric field here is very weak (near zero) and, therefore, induces a negligible amount and size of pores. Electroporation is a dynamic process in which the boundary between three regions (i.e., X and Y) shifts over time. The changes in X and Y over time using the 1-1-1 protocol with 1000 V/cm are summarized in Figure 3a. It was observed that the transition region shrinks with time, which indicates that large pores expand in a contracting transition region and inhibit the growth of pores in other regions by adjusting the effective membrane surface tension σ e f f . In addition, electric field strength also plays a role in membrane partitioning. The changes in X and Y using the 1-1-1 protocol with different electric field strengths are shown in Figure 3b. A trend is observed whereby a stronger electric field broadens the polar region and moves the transition region into the high-latitude zone. Meanwhile, the transition region, as well as the equatorial region, shrinks due to the expansion of the polar region.

3.2. Evolution of TMP and Pore Density during Electroporation

TMP is the most fundamental factor in driving pore evolution, and its temporal-spatial distribution is shown in Figure 2a. The temporal variation of TMP keeps up with the pace of the exogenous pulses, positively/negatively increasing when positive/negative pulses are on and discharging once pulses are off. Significantly, there is a TMP decline near the end of the first pulse, which is a result of the negative feedback caused by the increasing local conductivity when enough pores are formed, as indicated in the gray area in Figure 2f. The spatial distribution of TMP varies significantly regarding the polar angle, θ . The polar region experiences an approximate peak TMP (about 1 V), while in the high-latitude regions, i.e., partial transition region and equatorial region, the peak TMP decreases dramatically toward 0 V.
Directly associated with the peak TMP, the pore density follows a similar spatial distribution with the peak TMP, as shown in Figure 2b, with the polar regions possessing the majority of pores. Unlike the TMP temporal distribution, the pore density develops entirely within the first pulse width and is sustained at the same level for the remaining time, as shown in Figure 2f.

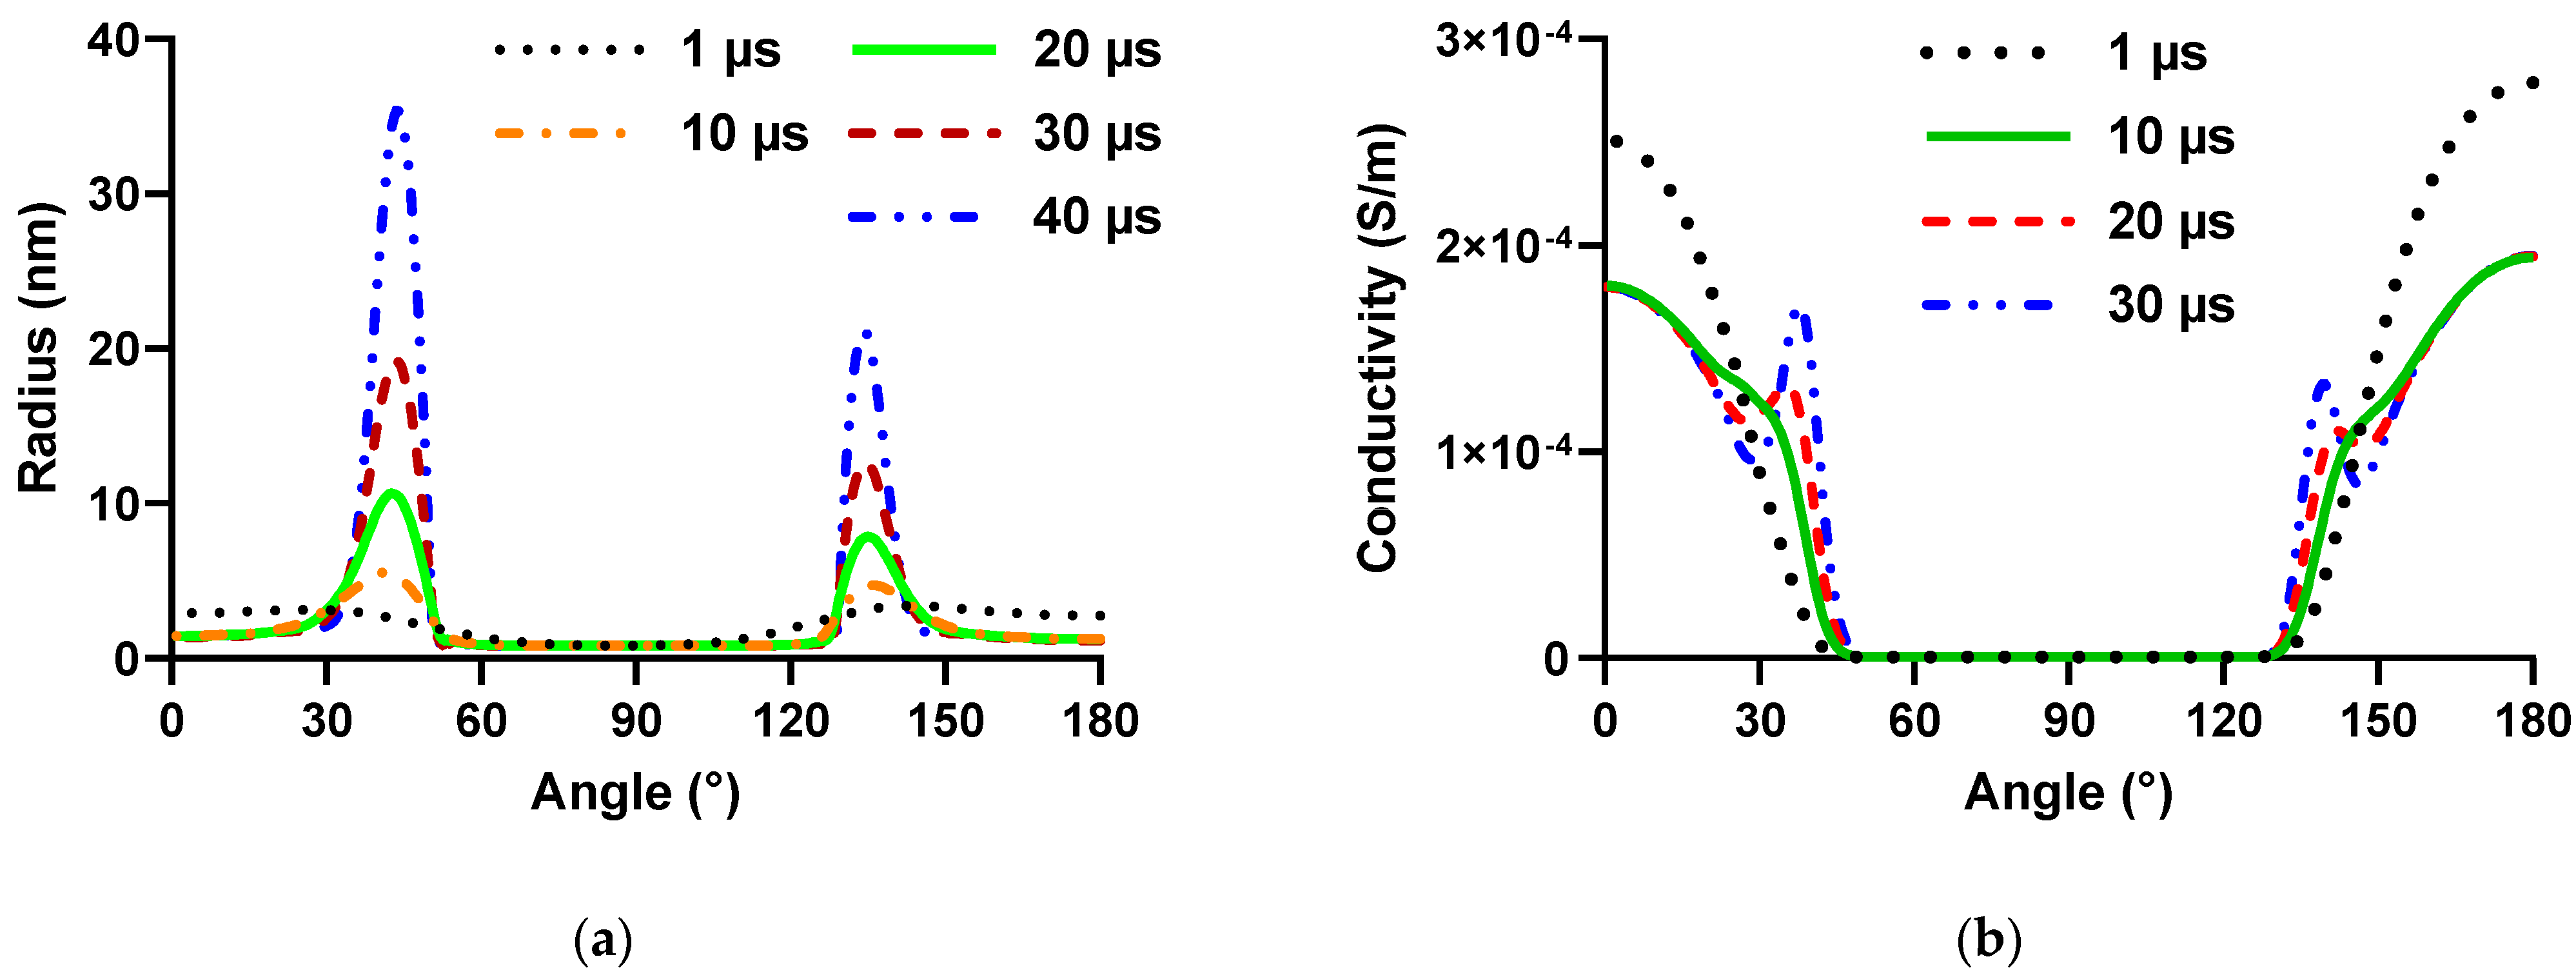
3.3. Evolution of Pore Size and PAR during Electroporation

The evolution of pore radius is simultaneously driven by TMP and pore density. Regardless, the size change mostly occurred in the polar and transition regions, and the radius of the pores in the equatorial regions is always approximately 0.8 nm, known as the minimum energy radius [51]. A distinguishing feature of pore radius is that the largest pores are induced in the transition region, not in the more electrically charged polar regions, where one might expect (see Figure 4a). The reason for this phenomenon is that the densest pores in the polar region exert a negative influence and suppress the further expansion of the pore size. The detailed mechanism is further interpreted through the local dynamic conductivity of the cell membrane (see Figure 4b) in the Discussion. Overall, under the combined effect of TMP and pore density, the SCE model predicts that large pores will be produced in the transition regions.
Given that PAR integrates information on both pore number and size, we have selected PAR as the indicator to evaluate the dynamics of electroporation. The values of PAR around the circumference are shown in Figure 2d. It is noted that the value of PAR in the transition region is the largest. The reasons behind this are (1) although the pore number in the transition regions is less than that in the polar regions, their order of magnitude are the same, while the pore size in the transition region can be much larger than that in the polar regions; (2) the spherical shape dictates that the area weight of the transition region is larger than that of the polar region (for a spherical cell, the 0~30° region occupies 13.4% of the total area, the 30~60° region accounts for 36.6%, and the 60~90° region accounts for 50%). Overall, the primary source of PAR comes from the polar and transition regions at the beginning of pulse delivery, and the transition regions are the predominant contributor to PAR. As the pulsing protocol goes on (up to hundreds of microseconds), the percentage sourced from the transition region to the pore area constantly increases, and a small part of the membrane (38~47° and 132~139° region) provides more than 95% PAR, as shown in Figure 2e. The formation of large pores is responsible for the majority of the increase in PAR and comprises the majority of the pore area as the pulses continue. It should be noted that the appearance of the two peaks of PAR is different. This is thought to be due to the existence of the resting potential, which leads to subtle differences on two sides of the cell membrane, strengthening one side and weakening the other side [26,28].
In conclusion, our simulation reveals some basic rules about pore evolution: (1) most pores are formed during the first applied electrical pulse, and these small pores occupy a majority of the pore area at the beginning; (2) with the delivery of pulses, large pores evolve in the transition region and comprise the majority of the pore area for pore formation in the long term. This same observation has been made in other simulations and experiments [28,52].

3.4. The Cumulative Effect of PAR

As indicated before, PAR was considered a suitable index in the setting of IRE because a higher PAR corresponds to a higher likelihood of cell death. PAR contains information from both pore number and size. Pore density can be considered steady after the first pulse on most membrane regions; hence, PAR is deeply affected by pore size. In most cases, it was found that PAR will fluctuate along with the pore size fluctuation, such as in protocol 1-3-1 with 1000 V/cm, as the solid line shown in Figure 5a. Under specific protocols, PAR was found to constantly increase instead of fluctuating with a sigmoid pattern, as in the dashed line seen for the protocol 1-1-1 with 1000 V/cm shown in Figure 5a. This sigmoid pattern of PAR changing with respect to time duration is termed the cumulative effect. The cumulative effect of PAR is desirable in H-FIRE protocol design and considered high-performance in the context of tumor ablation because it reflects a high probability of irrecoverable damage to cells. Therefore, this cumulative effect was investigated further in our study to provide guidance for high-performance H-FIRE protocol design. The key to achieving the cumulative effect requires certain combinations of pulse width and pulse delay. For instance, in all protocols with a pulse width of 1 μ s and electric field strength of 1000 V/cm, only a pulse delay of 2 μ s or less can trigger the cumulative effect, as shown in Figure 5b. On the other hand, electric field strength also plays a role in driving the cumulative effect. In Figure 5c, the occurrence of the cumulative effect requires a minimum electric field strength of 520 V/cm for 1-1-1 protocols.

3.5. The Effect of Electric Field Strength, Pulse Width, Pulse Delay, and Pulse Burst Duration on the Dynamics of Electroporation

The parameters that describe a protocol, i.e., electric field strength, pulse width, pulse delay, and pulse burst duration, are of particular interest to researchers when designing H-FIRE protocols. Yet comprehensive guidelines for protocol design have not yet been elucidated due to the complex interactions between the pulse-setting parameters. To date, only a few qualitative recommendations have been made based on numerical studies [34,41] and experimental studies [53,54], e.g., a higher electric field strength and a longer pulse width will lead to a greater extent of electroporation. In this study, quantitative guidelines were given for H-FIRE protocol design based on our SCE model.
As shown in Figure 6a, there is a plateau of the PAR, which reflects the occurrence of the cumulative effect described earlier. The range of the plateau serves as a recommendation for protocol selection. Specifically, for a pulse width of 1 μ s , the boundary of the pulse delay is around 2 μ s , and the margin of electric field strength is about 500 V/cm. This indicates that the 1- μ s pulse width should be preferentially matched with a pulse delay shorter than 2 μ s , and the electric field strength should be higher than 500 V/cm. Importantly, the influence of the pulse burst duration on the cumulative effect was also given in this study, which is rarely mentioned in other papers. As mentioned earlier, the value of PAR exhibits a sigmoid curve with pulse burst duration. That means the cumulative effect will be cut off before reaching the plateau if the pulse burst duration is not long enough. Thus, the time required to reach the plateau for every pulse setting is summarized in Figure 6b. The results show that the required pulse burst duration is shorter when the electric field strength is higher and/or the pulse delay is shorter. Significantly, the boundary of the plateau on the side of pulse delay exhibits an abrupt increase in pulse burst duration, while the edge on the side of electric field strength does not exhibit such a sharp change. Additionally, the PAR plateau and the time to reach the plateau for a longer pulse width, 2 μ s , were shown in Figure 6c,d, respectively. It was noticed that the plateau of a longer pulse width is more extensive regardless of the pulse delay side or the electric field strength side. This means a broader range of pulse settings is possible for a longer pulse width. The time to reach the plateau for 2- μ s pulses was similar to that for 1- μ s ones. The average time to finish the cumulative effect (inland of the plateau in Figure 6b,d) is about 100 μ s . The time on the boundary can sharply reach more than 200 μ s . This demonstrates that the pulse burst duration should not be too short, and the recommendation from a conservative perspective is more than 300 μ s .

4. Discussion

In the present study, the dynamics of pore evolution caused by symmetric bipolar H-FIRE protocols were investigated using a proposed SCE model, which integrates electric field theory and pore mechanics to provide a principle-based modeling approach. The SCE model demonstrated the process of pore evolution within a pulse burst, showing most pores occur in the transition and polar regions during the administration of the first pulse in a small size (i.e., <5 nm), and the pores located in the transition region are found to expand to tens to hundreds of nm in diameter with the delivery of pulses (see Figure 4a). In the early phase of a pulse burst (e.g., the first 8 microseconds), the polar region and transition region contributed to PAR at the same magnitude, but in the later phase of the pulse burst (e.g., after 100 microseconds), large pores started to evolve in the transition regions and composed the majority of PAR (more than 95%) due to the cumulative effect of ongoing exposure to H-FIRE protocols.
The cumulative effect was found to be critical in the electroporation dynamics, and this should guide the design of protocols to have a high probability of cell death. In this study, four pulse-setting parameters (pulse width, pulse delay, pulse burst duration, and electric field strength) for each of the two H-FIRE protocols (1-D-1 and 2-D-2) were investigated. The results indicated that, for 1- μ s pulses, the pulse delay should not exceed 2 μ s , and the pulse delay for 2- μ s pulses should not be longer than 4 μ s . Additionally, a minimum limit for the electric field strength leading to the cumulative effect was identified, which increases with an increase in the pulse width. The electric field strength should be at least 500 V/cm and 400 V/cm for 1- μ s and 2- μ s pulses, respectively. Additionally, the pulse burst duration was recommended to be longer than 300 μ s .
The relationship between the cumulative effect of PAR and pulse-setting parameters can be illustrated by taking the cell membrane as a capacitor in the study. At first, the essence of the cumulative effect is the continuous expansion of the pore size in the transition regions, as discussed in Section 3.1. Based on the results shown in Figure 2c, the size of pores will expand when the pulses are on but will also shrink when the pulses are off. Based on this phenomenon, it can be concluded that the leading cause of the cumulative effect is that the increment in pore size when the pulse is on is larger than the decrement in pore size when the pulse is off. This explains why there is a minimum limit in the pulse delay that changes with the pulse width.
Furthermore, to gain a deeper understanding of the cumulative effect from a quantitative perspective, the influences of the pulse-setting parameters on the rate of pore size change were illustrated here. Based on Equation (9), the rate of pore size change depended on two external factors, TMP and the effective membrane surface tension. The TMP can be affected significantly by the application or removal of PEFs, leading to the fluctuation of TMP as a process of charging and discharging a capacitor. Because the TMP does not reduce to zero instantly even if the pulse is off, the residual TMP is found to be able to mitigate the shrinkage of pores. Thus, the discharging time also exerts an influence on pore evolution. A long discharging time can hinder pores from shrinking during the pulse delay and be positive for the occurrence of the cumulative effect. The discharging time is determined by the local conductivity of the cell membrane, which depends on the local dynamics of electroporation. The relationship between the discharging time (which equals 5 τ c e l l ) and the local dynamic conductivity of the cell membrane was proposed in [55]. The local dynamic conductivity varies at different locations of the cell membrane (see Figure 4b), which leads to different discharging times at different locations. It is interesting to mention that the discharging time in the polar region is the shortest, which explains why pores in this region are unable to grow.
In addition, the effective membrane tension σ e f f also plays a significant role in the rate of pore size change. The σ e f f is a positive source for pore expansion. However, the increasing overall pore area will lead to a decrease in the σ e f f , which adversely hinders pores from growing. This closed loop explains why all pulsing protocols have an approximate plateau of PAR. Besides, given that the proportion of PAR is limited, those pores with less energy to grow will fail in competition with more energetic pores, and consequently, more PAR is gradually allocated to those energetic pores, allowing them to become larger. That is the reason why the transition region constantly shrinks over time.
The SCE model is a widely recognized principle-based modeling approach in the field of electroporation. It is built on the transient aqueous pore theory [56,57], which posits that pores initially appear in a hydrophobic state and spontaneously transition to a hydrophilic state when they exceed a certain free energy threshold. The process of pore evolution during electroporation is consistent with results observed in the molecular dynamics simulations [32,58]. Over the years, the SCE model has become a powerful tool for understanding and predicting the evolution of pores during electroporation-based applications. It can effectively reflect the dynamics of electroporation at the scale of a single cell or multiple cells over a period of several minutes to hours. On the other hand, molecular dynamics techniques provide a more detailed understanding at the molecular scale but require a significant amount of computational power and time and, consequently, can only simulate a small portion of the cell membrane.
To predict the ablation zone of electroporation, numerical models based on the electric field distribution are the prevailing method. With a lethal threshold determined through experiments, the electric field distribution of a given scenario can be used to predict the ablation zone [59,60]. Some derivative modeling methods have been developed to improve the effectiveness of this electric field distribution-based approach [19,61,62]. However, all relevant methods are inevitably dependent on the experimental data, making them semi-empirical in nature. In general, there are three main modeling methods in electroporation. The smaller scale a method can simulate, the more detailed insights it can provide. From the perspective of determining pulse-setting parameters, the SCE model is a suitable choice as it incorporates the principles behind electroporation and can simulate the process of electroporation at the cellular scale.
Early studies were dedicated to understanding the principles behind the SCE model, with one notable example being [28]. Since then, researchers have focused on exploring the potential of the SCE model in various applications. For instance, Pucihar et al. [30] applied it to irregular cell shapes, Talele et al. [34] utilized it to explore sinusoidal pulses, and Yao et al. [37] employed it to evaluate the role of duty cycle and interval in H-FIRE protocols. Salimi et al. [63] expanded its applicability to nanosecond pulses by introducing dielectric dispersion. Guo et al. [64] and Mi et al. [36] deepened the exploration of nanosecond pulses.
In the field of tumor ablation, the likelihood of cell death is of particular interest, such that understanding the relationship between the probability of cell death and the dynamics of electroporation is crucial, which is yet poorly understood. Without a quantitative understanding of this relationship, the use of the SCE model in this field is limited, particularly in the design of pulse-setting parameters. To bridge this gap, we adopted PAR as an index to reflect the overall degree of electroporation of a cell. It was found that certain combinations of pulse-setting parameters can induce a particularly high PAR, i.e., the cumulative effect. Therefore, the study into the exact mechanism by which pulse-setting parameters can trigger the cumulative effect is necessary for the optimal design of pulsing protocols. This is the first attempt to quantitatively connect the SCE model with the field of tumor ablation, and it is believed that this study provides a good hint towards further research in this area. Specifically, our methodology allows for the identification of specific combinations of four pulse-setting parameters (electric field strength, pulse width, pulse delay, and pulse burst duration) that have a high probability of cell death. For example, in the pulsing protocol 1-1-1, it is supposed that increasing the pulse burst duration beyond 300 μ s and the electric field strength above 500 V/cm can result in a noticeable increase in cell death probability compared to pulsing protocols where the pulse burst duration or electric field strength do not meet the minimum requirements.

5. Conclusions and Future Work

An SCE model with area weight was established in this study to provide a more representative estimation of PAR during electroporation. It can be concluded that the proposed SCE model, which includes the concept of the cumulative effect, can dynamically and quantitatively describe the relationship between pulse-setting parameters and the evolution of electroporation. This information is helpful in the design of H-FIRE protocols for tumor ablation in the clinical setting.
To the best of our knowledge, our work represents the first description of the relationship between the H-FIRE protocols and the dynamics of electroporation (i.e., PAR). However, there are some limitations to our work. The results achieved in this study rely heavily on the accuracy of the SCE model, which must be further validated by experiments. Second, the commonly used values for cell physical properties, such as the conductivity of the solution filling the pore, the extracellular conductivity, and the cytoplasm conductivity, are adopted from the literature, and a spherical shape of a cell membrane is used in this study. Therefore, the results and conclusions may not be applicable to other shapes of cell membranes. Adjustments in the cell’s physical parameters are highly recommended when the proposed SCE model is used to predict pore evolution in other cell scenarios.

Author Contributions

Conceptualization, L.D. and B.Z.; methodology, L.D.; software, L.D. and Z.F.; data curation, L.D. and Z.F.; writing—original draft preparation, L.D.; writing—review and editing, B.Z., W.Z. and M.A.J.M.; supervision, B.Z., M.A.J.M. and W.Z. All authors have read and agreed to the published version of the manuscript.

Funding

This research was supported in part by the National Natural Science Foundation of China (Grant No. 81801795), and the first author would like to acknowledge the financial support from the Chinese Scholarship Council (CSC, Grant No. 202006740029) and the NSERC (Natural Sciences and Engineering Research Council of Canada) CREATE (Collaborative Research and Training Experience) program (Grant No. 565429-2022).

Institutional Review Board Statement

Not applicable.

Informed Consent Statement

Not applicable.

Conflicts of Interest

The authors declare no conflict of interest.

References

  1. Tsong, T.Y. Electroporation of cell membranes. Biophys. J. 1991, 60, 297–306. [Google Scholar] [CrossRef] [PubMed] [Green Version]
  2. Weaver, J.C.; Chizmadzhev, Y.A. Theory of electroporation: A review. Bioelectrochem. Bioenerg. 1996, 41, 135–160. [Google Scholar] [CrossRef]
  3. Rubinsky, B. Irreversible Electroporation in Medicine. Technol. Cancer Res. Treat. 2007, 6, 255–259. [Google Scholar] [CrossRef]
  4. Heller, L.C.; Heller, R. In Vivo Electroporation for Gene Therapy. Hum. Gene Ther. 2006, 17, 890–897. [Google Scholar] [CrossRef] [PubMed]
  5. Heller, R.; Heller, L.C. Chapter Eight—Gene Electrotransfer Clinical Trials. In Advances in Genetics; Huang, L., Liu, D., Wagner, E., Eds.; Academic Press: Cambridge, MA, USA, 2015; Volume 89, pp. 235–262. [Google Scholar]
  6. Mir, L.M.; Orlowski, S.; Belehradek, J.; Teissié, J.; Rols, M.P.; Serša, G.; Miklavčič, D.; Gilbert, R.; Heller, R. Biomedical applications of electric pulses with special emphasis on antitumor electrochemotherapy. Bioelectrochem. Bioenerg. 1995, 38, 203–207. [Google Scholar] [CrossRef]
  7. Miklavčič, D.; Serša, G.; Brecelj, E.; Gehl, J.; Soden, D.; Bianchi, G.; Ruggieri, P.; Rossi, C.R.; Campana, L.G.; Jarm, T. Electrochemotherapy: Technological advancements for efficient electroporation-based treatment of internal tumors. Med. Biol. Eng. Comput. 2012, 50, 1213–1225. [Google Scholar] [CrossRef] [Green Version]
  8. Babikr, F.; Wan, J.; Xu, A.; Wu, Z.; Ahmed, S.; Freywald, A.; Chibbar, R.; Wu, Y.; Moser, M.; Groot, G.; et al. Distinct roles but cooperative effect of TLR3/9 agonists and PD-1 blockade in converting the immunotolerant microenvironment of irreversible electroporation-ablated tumors. Cell. Mol. Immunol. 2021, 18, 2632–2647. [Google Scholar] [CrossRef] [PubMed]
  9. Novickij, V.; Zinkevičienė, A.; Perminaitė, E.; Čėsna, R.; Lastauskienė, E.; Paškevičius, A.; Švedienė, J.; Markovskaja, S.; Novickij, J.; Girkontaitė, I. Non-invasive nanosecond electroporation for biocontrol of surface infections: An in vivo study. Sci. Rep. 2018, 8, 14516. [Google Scholar] [CrossRef] [Green Version]
  10. Kotnik, T.; Frey, W.; Sack, M.; Haberl Meglič, S.; Peterka, M.; Miklavčič, D. Electroporation-based applications in biotechnology. Trends Biotechnol. 2015, 33, 480–488. [Google Scholar] [CrossRef]
  11. Hong, J.; Stewart, M.T.; Cheek, D.S.; Francischelli, D.E.; Kirchhof, N. Cardiac ablation via electroporation. Annu. Int. Conf. IEEE Eng. Med. Biol. Soc. 2009, 2009, 3381–3384. [Google Scholar] [CrossRef]
  12. Sugrue, A.; Maor, E.; Ivorra, A.; Vaidya, V.; Witt, C.; Kapa, S.; Asirvatham, S. Irreversible electroporation for the treatment of cardiac arrhythmias. Expert Rev. Cardiovasc. Ther. 2018, 16, 349–360. [Google Scholar] [CrossRef] [PubMed]
  13. Arena, C.B.; Sano, M.B.; Rylander, M.N.; Davalos, R.V. Theoretical considerations of tissue electroporation with high-frequency bipolar pulses. IEEE Trans. Biomed. Eng. 2011, 58, 1474–1482. [Google Scholar] [CrossRef] [PubMed]
  14. Davalos, R.V.; Mir, I.L.; Rubinsky, B. Tissue ablation with irreversible electroporation. Ann. Biomed. Eng. 2005, 33, 223–231. [Google Scholar] [CrossRef] [PubMed]
  15. Ding, L.; Moser, M.; Luo, Y.; Zhang, W.; Zhang, B. Treatment Planning Optimization in Irreversible Electroporation for Complete Ablation of Variously Sized Cervical Tumors: A Numerical Study. J. Biomech. Eng. 2020, 143, 014503. [Google Scholar] [CrossRef]
  16. Fang, Z.; Chen, L.; Moser, M.A.J.; Zhang, W.; Qin, Z.; Zhang, B. Electroporation-Based Therapy for Brain Tumors: A Review. J. Biomech. Eng. 2021, 143, 100802. [Google Scholar] [CrossRef]
  17. Weaver, J.C.; Smith, K.C.; Esser, A.T.; Son, R.S.; Gowrishankar, T.R. A brief overview of electroporation pulse strength–duration space: A region where additional intracellular effects are expected. Bioelectrochemistry 2012, 87, 236–243. [Google Scholar] [CrossRef] [Green Version]
  18. Hui, S.W. Effects of Pulse Length and Strength on Electroporation Efficiency. In Plant Cell Electroporation and Electrofusion Protocols; Nickoloff, J.A., Ed.; Springer: New York, NY, USA; Totowa, NJ, USA, 1995; pp. 29–40. [Google Scholar]
  19. Fang, Z.; Mao, H.; Moser, M.A.J.; Zhang, W.; Qian, Z.; Zhang, B. Irreversible Electroporation Enhanced by Radiofrequency Ablation: An In Vitro and Computational Study in a 3D Liver Tumor Model. Ann. Biomed. Eng. 2021, 49, 2126–2138. [Google Scholar] [CrossRef]
  20. Shu, T.; Ding, L.; Fang, Z.; Yu, S.; Chen, L.; Moser, M.A.J.; Zhang, W.; Qin, Z.; Zhang, B. Lethal Electric Field Thresholds for Cerebral Cells With Irreversible Electroporation and H-FIRE Protocols: An In Vitro Three-Dimensional Cell Model Study. J. Biomech. Eng. 2022, 144, 101010. [Google Scholar] [CrossRef]
  21. Ita, K. Perspectives on Transdermal Electroporation. Pharmaceutics 2016, 8, 9. [Google Scholar] [CrossRef] [Green Version]
  22. Mali, B.; Jarm, T.; Corovic, S.; Paulin-Kosir, M.S.; Cemazar, M.; Sersa, G.; Miklavcic, D. The effect of electroporation pulses on functioning of the heart. Med. Biol. Eng. Comput. 2008, 46, 745–757. [Google Scholar] [CrossRef]
  23. Gabriel, B.; Teissié, J. Direct observation in the millisecond time range of fluorescent molecule asymmetrical interaction with the electropermeabilized cell membrane. Biophys. J. 1997, 73, 2630–2637. [Google Scholar] [CrossRef] [Green Version]
  24. Huang, Y.; Sekhon, N.S.; Borninski, J.; Chen, N.; Rubinsky, B. Instantaneous, quantitative single-cell viability assessment by electrical evaluation of cell membrane integrity with microfabricated devices. Sens. Actuators A Phys. 2003, 105, 31–39. [Google Scholar] [CrossRef]
  25. Hibino, M.; Shigemori, M.; Itoh, H.; Nagayama, K.; Kinosita, K. Membrane conductance of an electroporated cell analyzed by submicrosecond imaging of transmembrane potential. Biophys. J. 1991, 59, 209–220. [Google Scholar] [CrossRef] [PubMed] [Green Version]
  26. DeBruin, K.A.; Krassowska, W. Modeling Electroporation in a Single Cell. I. Effects of Field Strength and Rest Potential. Biophys. J. 1999, 77, 1213–1224. [Google Scholar] [CrossRef] [Green Version]
  27. Gurtovenko, A.A.; Vattulainen, I. Ion leakage through transient water pores in protein-free lipid membranes driven by transmembrane ionic charge imbalance. Biophys. J. 2007, 92, 1878–1890. [Google Scholar] [CrossRef] [PubMed] [Green Version]
  28. Krassowska, W.; Filev, P.D. Modeling Electroporation in a Single Cell. Biophys. J. 2007, 92, 404–417. [Google Scholar] [CrossRef] [PubMed] [Green Version]
  29. Kotnik, T.; Miklavcic, D. Theoretical evaluation of voltage inducement on internal membranes of biological cells exposed to electric fields. Biophys. J. 2006, 90, 480–491. [Google Scholar] [CrossRef] [PubMed] [Green Version]
  30. Pucihar, G.; Miklavcic, D.; Kotnik, T. A time-dependent numerical model of transmembrane voltage inducement and electroporation of irregularly shaped cells. IEEE Trans. Biomed. Eng. 2009, 56, 1491–1501. [Google Scholar] [CrossRef] [PubMed] [Green Version]
  31. Ho, M.C.; Casciola, M.; Levine, Z.A.; Vernier, P.T. Molecular dynamics simulations of ion conductance in field-stabilized nanoscale lipid electropores. J. Phys. Chem. B 2013, 117, 11633–11640. [Google Scholar] [CrossRef] [PubMed]
  32. Tarek, M. Membrane electroporation: A molecular dynamics simulation. Biophys. J. 2005, 88, 4045–4053. [Google Scholar] [CrossRef]
  33. Rems, L.; Kasimova, M.A.; Testa, I.; Delemotte, L. Pulsed Electric Fields Can Create Pores in the Voltage Sensors of Voltage-Gated Ion Channels. Biophys. J. 2020, 119, 190–205. [Google Scholar] [CrossRef] [PubMed]
  34. Talele, S.; Gaynor, P.; Cree, M.J.; van Ekeran, J. Modelling single cell electroporation with bipolar pulse parameters and dynamic pore radii. J. Electrost. 2010, 68, 261–274. [Google Scholar] [CrossRef] [Green Version]
  35. Yao, C.; Liu, H.; Zhao, Y.; Mi, Y.; Dong, S.; Lv, Y. Analysis of Dynamic Processes in Single-Cell Electroporation and Their Effects on Parameter Selection Based on the Finite-Element Model. IEEE Trans. Plasma Sci. 2017, 45, 889–900. [Google Scholar] [CrossRef]
  36. Mi, Y.; Xu, J.; Liu, Q.; Wu, X.; Zhang, Q.; Tang, J. Single-cell electroporation with high-frequency nanosecond pulse bursts: Simulation considering the irreversible electroporation effect and experimental validation. Bioelectrochemistry 2021, 140, 107822. [Google Scholar] [CrossRef] [PubMed]
  37. Yao, C.; Zhao, Y.; Dong, S.; Lv, Y.; Liu, H.; Tang, L.; He, L.; Wang, X. Differences in the Effects of Duty Cycle and Interval on Cell Response Induced by High-Frequency Pulses Under Different Pulse Durations. IEEE Trans. Plasma Sci. 2016, 44, 2097–2110. [Google Scholar] [CrossRef]
  38. Arena, C.B.; Sano, M.B.; Rossmeisl, J.H.; Caldwell, J.L.; Garcia, P.A.; Rylander, M.N.; Davalos, R.V. High-frequency irreversible electroporation (H-FIRE) for non-thermal ablation without muscle contraction. BioMedical Eng. OnLine 2011, 10, 102. [Google Scholar] [CrossRef] [Green Version]
  39. Ringel-Scaia, V.M.; Beitel-White, N.; Lorenzo, M.F.; Brock, R.M.; Huie, K.E.; Coutermarsh-Ott, S.; Eden, K.; McDaniel, D.K.; Verbridge, S.S.; Rossmeisl, J.H., Jr.; et al. High-frequency irreversible electroporation is an effective tumor ablation strategy that induces immunologic cell death and promotes systemic anti-tumor immunity. EBioMedicine 2019, 44, 112–125. [Google Scholar] [CrossRef] [Green Version]
  40. Zhang, B.; Liu, F.; Fang, Z.; Ding, L.; Moser, M.A.J.; Zhang, W. An in vivo study of a custom-made high-frequency irreversible electroporation generator on different tissues for clinically relevant ablation zones. Int. J. Hyperth. 2021, 38, 593–603. [Google Scholar] [CrossRef]
  41. Yao, C.; Dong, S.; Zhao, Y.; Lv, Y.; Liu, H.; Gong, L.; Ma, J.; Wang, H.; Sun, Y. Bipolar Microsecond Pulses and Insulated Needle Electrodes for Reducing Muscle Contractions during Irreversible Electroporation. IEEE Trans. Biomed. Eng. 2017, 64, 2924–2937. [Google Scholar] [CrossRef]
  42. Arena, C.; Davalos, R. Advances in Therapeutic Electroporation to Mitigate Muscle Contractions. J. Membr. Sci. Technol. 2012, 2, e102. [Google Scholar] [CrossRef]
  43. Sano, M.B.; Arena, C.B.; DeWitt, M.R.; Saur, D.; Davalos, R.V. In vitro bipolar nano- and microsecond electro-pulse bursts for irreversible electroporation therapies. Bioelectrochemistry 2014, 100, 69–79. [Google Scholar] [CrossRef] [PubMed]
  44. Miklovic, T.; Latouche, E.L.; DeWitt, M.R.; Davalos, R.V.; Sano, M.B. A Comprehensive Characterization of Parameters Affecting High-Frequency Irreversible Electroporation Lesions. Ann. Biomed. Eng. 2017, 45, 2524–2534. [Google Scholar] [CrossRef]
  45. Sano, M.B.; Volotskova, O.; Xing, L. Treatment of Cancer In Vitro Using Radiation and High-Frequency Bursts of Submicrosecond Electrical Pulses. IEEE Trans. Biomed. Eng. 2018, 65, 928–935. [Google Scholar] [CrossRef]
  46. Newman, J. Resistance for Flow of Current to a Disk. J. Electrochem. Soc. 1966, 113, 501. [Google Scholar] [CrossRef]
  47. Powell, K.T.; Derrick, E.G.; Weaver, J.C. A quantitative theory of reversible electrical breakdown in bilayer membranes. Bioelectrochem. Bioenerg. 1986, 15, 243–255. [Google Scholar] [CrossRef]
  48. Neu, J.C.; Krassowska, W. Asymptotic model of electroporation. Phys. Rev. E 1999, 59, 3471–3482. [Google Scholar] [CrossRef]
  49. Smith, K.C.; Neu, J.C.; Krassowska, W. Model of creation and evolution of stable electropores for DNA delivery. Biophys. J. 2004, 86, 2813–2826. [Google Scholar] [CrossRef] [Green Version]
  50. Yang, J.; Huang, Y.; Wang, X.; Wang, X.-B.; Becker, F.F.; Gascoyne, P.R. Dielectric properties of human leukocyte subpopulations determined by electrorotation as a cell separation criterion. Biophys. J. 1999, 76, 3307–3314. [Google Scholar] [CrossRef] [Green Version]
  51. Glaser, R.W.; Leikin, S.L.; Chernomordik, L.V.; Pastushenko, V.F.; Sokirko, A.I. Reversible electrical breakdown of lipid bilayers: Formation and evolution of pores. Biochim. Biophys. Acta (BBA)-Biomembr. 1988, 940, 275–287. [Google Scholar] [CrossRef]
  52. Marszalek, P.; Liu, D.; Tsong, T.Y. Schwan equation and transmembrane potential induced by alternating electric field. Biophys. J. 1990, 58, 1053–1058. [Google Scholar] [CrossRef]
  53. Dong, S.; Yao, C.; Zhao, Y.; Lv, Y.; Liu, H. Parameters optimization of bipolar high frequency pulses on tissue ablation and inhibiting muscle contraction. IEEE Trans. Dielectr. Electr. Insul. 2018, 25, 207–216. [Google Scholar] [CrossRef]
  54. Sano, M.B.; Fesmire, C.C.; DeWitt, M.R.; Xing, L. Burst and continuous high frequency irreversible electroporation protocols evaluated in a 3D tumor model. Phys. Med. Biol. 2018, 63, 135022. [Google Scholar] [CrossRef] [PubMed]
  55. Grosse, C.; Schwan, H.P. Cellular membrane potentials induced by alternating fields. Biophys. J. 1992, 63, 1632–1642. [Google Scholar] [CrossRef] [PubMed] [Green Version]
  56. Weaver, J.C. Transient Aqueous Pores: A Mechanism for Coupling Electric Fields to Bilayer and Cell Membranes. In Mechanistic Approaches to Interactions of Electric and Electromagnetic Fields with Living Systems; Blank, M., Findl, E., Eds.; Springer: Boston, MA, USA, 1987; pp. 249–270. [Google Scholar]
  57. Powell, K.T.; Weaver, J.C. Transient aqueous pores in bilayer membranes: A statistical theory. Bioelectrochem. Bioenerg. 1986, 15, 211–227. [Google Scholar] [CrossRef]
  58. Böckmann, R.A.; de Groot, B.L.; Kakorin, S.; Neumann, E.; Grubmüller, H. Kinetics, Statistics, and Energetics of Lipid Membrane Electroporation Studied by Molecular Dynamics Simulations. Biophys. J. 2008, 95, 1837–1850. [Google Scholar] [CrossRef] [Green Version]
  59. Latouche, E.L.; Sano, M.B.; Lorenzo, M.F.; Davalos, R.V.; Martin, R.C.G., 2nd. Irreversible electroporation for the ablation of pancreatic malignancies: A patient-specific methodology. J. Surg. Oncol. 2017, 115, 711–717. [Google Scholar] [CrossRef]
  60. Wandel, A.; Ben-David, E.; Ulusoy, B.S.; Neal, R.; Faruja, M.; Nissenbaum, I.; Gourovich, S.; Goldberg, S.N. Optimizing Irreversible Electroporation Ablation with a Bipolar Electrode. J. Vasc. Interv. Radiol. 2016, 27, 1441–1450.e1442. [Google Scholar] [CrossRef]
  61. Golberg, A.; Rubinsky, B. A statistical model for multidimensional irreversible electroporation cell death in tissue. Biomed. Eng. Online 2010, 9, 13. [Google Scholar] [CrossRef] [Green Version]
  62. Yang, Y.; Moser, M.A.J.; Zhang, E.; Zhang, W.; Zhang, B. Development of a statistical model for cervical cancer cell death with irreversible electroporation in vitro. PLoS ONE 2018, 13, e0195561. [Google Scholar] [CrossRef] [Green Version]
  63. Salimi, E.; Thomson, D.J.; Bridges, G.E. Membrane dielectric dispersion in nanosecond pulsed electroporation of biological cells. IEEE Trans. Dielectr. Electr. Insul. 2013, 20, 1256–1265. [Google Scholar] [CrossRef]
  64. Guo, F.; Qian, K.; Zhang, L.; Deng, H.; Li, X.; Zhou, J.; Wang, J. Anisotropic conductivity for single-cell electroporation simulation with tangentially dispersive membrane. Electrochim. Acta 2021, 385, 138426. [Google Scholar] [CrossRef]
Figure 1. The schematic diagram of (a) the simulation space and three regions classified by different patterns of pore evolution, (b) the area weight of a differential of arc d l regarding the position θ , (c) the mesh construction of the SCE model and the close-up view of the mapped mesh of the cell membrane, (d) the symmetric bipolar H-FIRE protocol used in this study.
Applsci 13 01808 g001
Figure 2. The temporal-spatial changings of (a) TMP, (b) pore density, (c) pore radius, (d) PAR in the short-term, and (e) PAR in the long-term under 1-1-1 protocol with 1000 V/cm, and (f) the TMP, pore density, and pore radius variation at the polar point ( θ = 0 ° ) under 1-1-1 protocol with 1000 V/cm.
Applsci 13 01808 g002aApplsci 13 01808 g002b
Figure 3. Two boundaries of the transition region, X and Y, shift with (a) time and (b) electric field strength.
Applsci 13 01808 g003
Figure 4. The changes of (a) pore radius and (b) conductivity along the semi-circumference from 0°~180° at different moments using 1-1-1 protocol with 1000 V/cm.
Applsci 13 01808 g004
Figure 5. The change of PAR with respect to (a) time duration of protocols 1-1-1 and 1-3-1; the maximum of PAR with respect to (b) pulse delay when the pulse width is fixed at 1 μ s and the electric field strength is fixed at 1000 V/cm, and to (c) electric field strength when the pulse width is fixed at 1 μ s and the pulse delay is fixed at 1 μ s .
Applsci 13 01808 g005
Figure 6. The joint effect of the pulse delay and the electric field strength on (a) PAR and (b) the time required to reach plateau when the pulse width is 1 μ s ; The joint effect of the pulse delay and the electric field strength on (c) PAR and (d) the time required to reach plateau when the pulse width is 2 μ s .
Applsci 13 01808 g006
Table 1. Physical variables used in the SCE model.
Physical VariableSymbolValueReference
External radius of the cell r c 10   ( μ m ) [30]
Plasma membrane thickness d m e m 5   ( nm )
Extracellular conductivity λ o 0.14   ( S / m )
Initial conductivity of plasma membrane λ m 0 5   ×   10 7   ( S / m )
Cytoplasm conductivity λ c 0.3   ( S / m )
Conductivity of the solution filling pores λ p 2   ( S / m ) [49]
Extracellular relative permittivity ε o 80[30]
Relative permittivity of plasma membrane ε m e m 5
Cytoplasm relative permittivity ε c 154.4[50]
Creation rate coefficient α 1   ×   10 9   ( m 2 s 1 ) [30]
Equilibrium pore density at Δ ψ = 0 N 0 1.5   ×   10 9   ( m 2 ) [26]
Characteristic voltage of electroporation V E P 170   ( mV ) [30]
Rest potential V r e s t 80   ( mV ) [50]
Pore creation rate q 2.46
Relative entrance length of pores n 0.15[30]
Energy barrier within the pore ω 0 2.65
Faraday’s constant F 9.65   ×   10 4   ( C / mol ) -
Gas constant R 8314   ( JK 1 mol 1 )
Absolute temperature T 295   ( K ) [28]
Minimum radius of hydrophilic pores r * 0.51   ( nm )
Diffusion coefficient for radius of pores D 5   ×   10 14   ( m 2 s 1 )
Steric repulsion energy β 1.4   ×   10 19   ( J )
Edge energy γ 1.8   ×   10 11   ( J / m )
Bilayer tension without pores δ 1   ×   10 6   ( J / m 2 )
Tension of hydrocarbon-water interface δ 2   ×   10 2   ( J / m 2 )
Maximum electric force for Δ ψ = 1 V F m a x 0.7   ×   10 9   ( N / V 2 )
Constant for advection velocity r h 0.97   ×   10 9   ( m )
Constant for advection velocity r t 0.31   ×   10 1   ( m )
Disclaimer/Publisher’s Note: The statements, opinions and data contained in all publications are solely those of the individual author(s) and contributor(s) and not of MDPI and/or the editor(s). MDPI and/or the editor(s) disclaim responsibility for any injury to people or property resulting from any ideas, methods, instructions or products referred to in the content.

