Article

A Wrapped Approach Using Unlabeled Data for Diabetic Retinopathy Diagnosis

1
Institute of Clinical Medicine of Jeonbuk National University-Biomedical Research Institute of Jeonbuk National University Hospital, Jeonju 54907, Republic of Korea
2
Office of Strategic R&D Planning, Ministry of Trade, Industry and Energy, Sejong City 30118, Republic of Korea
3
Department of Psychiatry, Jeonbuk National University Hospital, Jeonju 54907, Republic of Korea
4
Industry-Academic Cooperation Foundation, Daejeon University, Daejeon 34520, Republic of Korea
5
Department of Computer Engineering, Kyungnam University, Changwon 51767, Republic of Korea
6
Department of Computer Engineering, Daejeon University, Daejeon 34520, Republic of Korea
*
Author to whom correspondence should be addressed.
Appl. Sci. 2023, 13(3), 1901; https://doi.org/10.3390/app13031901
Submission received: 3 December 2022 / Revised: 16 January 2023 / Accepted: 17 January 2023 / Published: 1 February 2023
(This article belongs to the Special Issue Applications of Artificial Intelligence in Biomedical Data Analysis)

Abstract

:
Large-scale datasets, which have sufficient and identical quantities of data in each class, are the main factor in the success of deep-learning-based classification models for vision tasks. A shortage of sufficient data and interclass imbalanced data distribution, which often arise in the medical domain, cause modern deep neural networks to suffer greatly from imbalanced learning and overfitting. A diagnostic model of diabetic retinopathy (DR) that is trained from such a dataset using supervised learning is severely biased toward the majority class. To enhance the efficiency of imbalanced learning, the proposal of this study is to leverage retinal fundus images without human annotations by self-supervised or semi-supervised learning. The proposed approach to DR detection is to add an auxiliary procedure to the target task that identifies DR using supervised learning. The added process uses unlabeled data to pre-train the model that first learns features from data using self-supervised or semi-supervised learning, and then the pre-trained model is transferred with the learned parameter to the target model. This wrapper algorithm of learning from unlabeled data can help the model gain more information from samples in the minority class, thereby improving imbalanced learning to some extent. Comprehensive experiments demonstrate that the model trained with the proposed method outperformed the one trained with only the supervised learning baseline utilizing the same data, with an accuracy improvement of 4~5%. To further examine the method proposed in this study, a comparison is conducted, and our results show that the proposed method also performs much better than some state-of-the-art methods. In the case of EyePaCS, for example, the proposed method outperforms the customized CNN model by 9%. Through experiments, we further find that the models trained with a smaller but balanced dataset are not worse than those trained with a larger but imbalanced dataset. Therefore, our study reveals that utilizing unlabeled data can avoid the expensive cost of collecting and labeling large-scale medical datasets.

1. Introduction

Diabetic retinopathy (DR) is a common complication of diabetes that manifests as damage to the retinal blood vessels, and is the leading cause of blindness [1]. Compared to the large number of DR patients, there is a relatively severe shortage of ophthalmologists, which reduces the capacity to examine DR patients and delays treatment [2,3,4]. Automated DR diagnosis allows medical experts to make early, regular, easier, and real-time examinations for patients to slow or avert the progression to their vision impairment. It also helps to save time, cost, and medical resources in response to an increasing prevalence of DR [3,4,5].
Applications of automated DR detection involve the classification of the presence and severity of DR; segmentation of lesions such as blood vessel, hemorrhagic, and exudative lesions; and the localization and segmentation of the optic disk, macula, and fovea [3,4,5,6]. CNN-based deep learning has attracted major interest in DR detection, and provides better performance than traditional approaches [3,4,6]. Numerous studies on DR detection using deep learning have been reported. Ensemble learning combines deep learning and other machine learning algorithms such as principal component analysis (PCA), support vector machine (SVM), random forest (RF), etc. Most of the data used for automated DR detection systems have been fundus images, with some tasks using optical coherence tomography images. The performance of DR detection is usually assessed by accuracy, sensitivity, specificity, precision, F1 score, etc., [3,4,5,6].
The application of deep learning in identifying DR can be considered as having two parts. The first part is a feature extractor (i.e., encoder) and the second part classifies DR using the extracted features. CNNs are often used as the backbone networks. Features extracted by a CNN model are then used by a dense neural network or other machine learning algorithms such as SVM, RF, decision tree, Gaussian techniques, PCA, etc., to perform a classification task [3,4]. Learning is usually implemented with the supervised learning baseline, and the start-of-the-art models such as VGG, ResNet, and those in the Inception family are commonly employed to extract features [3,4,6]. These CNN models have been trained on ImageNet, so they can be used as pre-trained models with the learned parameters. These pre-trained models are popularly used to initialize the feature extractor via transfer learning, which involves the removal of the top layer of the network [7,8,9,10,11,12,13,14]. Additional to making use of these off-the-shelf networks, CNN-based models are also customized or modified and trained from scratch to learn DR features [15,16,17]. In addition to multilayer perceptrons (MLPs) and the various machine learning methods mentioned above, some studies used ensemble methods to produce classifiers, i.e., used multiple learning algorithms to obtain better prediction performance than using one algorithm alone [4]. As described by Zhang et al. [8], a classier is the average of three softmax outputs, and each softmax is the final output of a four-layer MLP. Tymchenko et al. [10] and Qummar et al. [18] also used the method of combining several encoders to form an ensemble model. The final output is the average of the fused results of the ensemble model. In Antal et al. [19], several classifiers using different algorithms such as decision tree, MLP, SVM, and RF were trained to construct an ensemble classier. Even more interesting is the use of the Siamese-like CNN to detect left and right retinal fundus images, respectively [20]. Designing and adding a useful module to the CNN backbones is used to address the imbalanced DR grading problem [13]. It is accomplished using self-supervised learning to train a model for retinal disease diagnosis using multimodal data. These multimodal data consist of raw and transformed fundus images, as well as synthesized fundus fluorescein angiography (FFA) modality data generated by a GAN model [21]. The small network modules are comprised of a selected number of the layers to learn salient features from the data [22]. The layers include convolution, batch normalization, ReLU, and max pooling [22]. The deep-feature generator is designed by the non-fixed size patch division model [23]. Since most DR datasets lack sufficient data or have an imbalanced distribution between classes, several approaches are considered to deal with this problem. These approaches include using transfer learning to exploit information of the models pre-trained on large-scale datasets by applying augmentation techniques or generating synthetic data through GANs to increase the diversity of the data [4], and developing a self-training deep neural network model to utilize unlabeled data [24]. Zhu et al. proposed a brain tumor segmentation method based on the fusion of a semantic segmentation module, an edge detection module, and a feature fusion module. This method of fusion outperforms several state-of-the-art brain tumor segmentation methods [25].
Modern deep learning algorithms have produced unprecedented achievements for object recognition recently. Large-scale datasets are one of the main factors determining the success of deep-learning-based models when performing visual tasks [26]. This demonstrates that more training data ensures that the learning algorithm can obtain more meaningful and discriminating representations from the data. The models depend on training data, and the more data, the better the results, as large amounts of data avoids overfitting and enables the development of more sophisticated and robust models [27]. However, unlike image data from nature, medical data are not readily available, especially images from samples medically identified as abnormal, because the average number of patients with a given disease is much lower than the number of healthy individuals. On the other hand, annotation is also a factor in the difficulty of obtaining sufficient medical image data. As a result, a shortage of sufficient data and interclass imbalanced data distribution often arise in the medical field of the real world [28,29]. Unfortunately, neural networks suffer greatly from imbalanced learning due to the class-imbalanced data distribution, and they often suffer from overfitting due to the lack of sufficient medical data [30,31].
This challenging situation also exists in DR image data. Due to the relatively fewer data samples with DR symptoms in the dataset available for training a model, the model is biased to represent the majority category without DR symptoms, leading to false-negative predictions of models. For a medical diagnosis, a false-negative prediction is more serious and dangerous to patients than a false-positive diagnosis because it ignores the disease [32]. Therefore, importance should be attached to this biased classification problem caused by the skewed distribution of training data. However, there are currently very few studies dedicated to DR detection with imbalanced learning.
This paper is focused on learning DR detection from such an interclass imbalanced fundus image dataset. The purpose of this paper is to propose methods to overcome this biased DR detection in order to reduce the error diagnosis rate and improve the performance of the DR detection system. The principle of supervised learning is to learn to make decisions in the direction of given supervision signals related to target tasks. The lack of sufficient labeled data limits the generalization ability of supervised learning. To overcome this and further improve the ability of the model to recognize under-represented data, this paper considers training the model with a self-supervised or semi-supervised learning-based approach to facilitate learning. Both semi-supervised and self-supervised learning are effective ways to leverage information from unlabeled data, avoiding the expensive cost of collecting and annotating large datasets.
Self-supervised learning, which is a subset of unsupervised learning methods, has been proposed to learn features from the images themselves without any annotation [33]. Contrastive self-supervised learning is a technique for learning representations by comparing among multiple input samples. Its emergence has significantly narrowed the gap between unsupervised learning and supervised learning. In recent years, the promising performance of contrastive self-supervised learning both in computer vision (CV) and natural language processing (NLP) has shown that the underlying latent representations can be learned from unlabeled data by contrastive self-supervised learning [34]. Semi-supervised learning is a learning paradigm that uses a combination of labeled and unlabeled data to train a model. Adding unlabeled samples to the training dataset changes the distribution of the original dataset, which consequently affects the model in terms of making decisions. If two points, x1 and x2, are close in a high-density region, then the corresponding output y1 should be close to y2. Under such a smoothness assumption, the additional unlabeled data help the model to find a more accurate decision boundary [33]. According to recent advances in deep learning, semi-supervised learning outperforms supervised learning that uses only labeled data [35].
There are few studies that have applied either self-supervised or semi-supervised learning in DR detection. Common approaches used to apply self-supervised or semi-supervised learning in other fields usually employ these learning methods to perform the target tasks directly. Instead, self-supervised and semi-supervised learning are both used as a wrapper algorithm in this study. Specifically, the model is first pre-trained on unlabeled retinal fundus data with self-supervised or semi-supervised learning; then, the learned presentations are transferred to a model that will be fine-tuned for DR detection with supervised learning using the labeled data, so that the useful knowledge learned from unlabeled data in the same domain can help the target model to move in the right direction of finding appropriate parameters from the beginning. Adopting a wrapper algorithm that utilizes unlabeled DR data to the basic supervised learning baseline shows better performance than using supervised learning alone. Furthermore, the combination of self-supervised and semi-supervised learning proposed in this study also results in improved accuracy and significant reduction in training time. This novel approach is very useful when labeled data are too sparse to train a model for annotating unlabeled data. Regarding imbalanced learning, the biased model caused by imbalanced labels can be re-balanced to some extent under the influence of unlabeled data. To further deal with the imbalanced learning problem, the classifier of the model is additionally fine-tuned on the re-balanced training dataset obtained by re-sampling.
The results of the experiment demonstrate that the proposed methods enhance the performance of DR detection from a supervised learning baseline by improving the performance on the imbalanced data. Accuracy (ACC), sensitivity (TPR), and specificity (TNR) were used as evaluation metrics. In the case of evaluating the model using the balanced EyePaCS [36] test dataset, the false-negative error rate, which was 100%, was reduced to 14.8%, and the accuracy rate, which was only 50%, improved to 86.4%. The best performance was obtained on the balanced DDR [37] test dataset, with an ACC of 89.62%, TPR of 86.39%, and TNR of 92.84%; this model was trained on the smaller balanced training set. The performance of the model, which was trained on the imbalanced training dataset, achieved an ACC of 89.50%, TPR of 87.81%, and TNR of 91.18%. The examination results obtained on both EyePaCS and DDR test data are higher than those reported previously [13,15]. Test results of the Messidor-2 [38] dataset significantly outperformed the state-of-the-art model results [14], with an ACC of 90.68%, a TPR of 86.0%, and a TNR of 92.33%. The models trained by adopting a wrapper algorithm that leveraged the unlabeled DR data used in self-supervised or semi-supervised learning are 4~5% higher in accuracy than the ones trained on the labeled data used in supervised learning only. It can be observed that the performance of the model trained on a relatively small but balanced training set is not worse than that of the model trained by a relatively large but imbalanced dataset. This reveals that it is not necessary to use a large-scale dataset to feed deep-learning-based CNN models to obtain better performance. Under the circumstances, where it is very difficult to collect clean, labeled medical data, it is crucial to use a small amount of data to ensure that the model works well. The proposed method can be applied to any deep learning model. The main contributions of this study can be outlined as follows:
(1). We present a method in the form of a wrapper algorithm to help improve DR detection using supervised learning. It uses semi-supervised or self-supervised learning to first learn and gain features from unlabeled data, and then transfers these learned features to a model using supervised learning to optimize learning.
(2). A combination of self-supervised and semi-supervised learning is used to perform DR detection, and this combined approach can significantly reduce the learning time while providing a viable solution for training models when labeled data are particularly scarce.
(3). To analyze the impact of data imbalance on learning, this study draws two different training datasets, one larger and imbalanced, and the other a smaller and balanced, using down-sampling. All experiments are conducted on these two datasets, and the results show that the small balanced dataset is more advantageous for training models than the larger and imbalanced data.
(4). To examine the proposed method, we conduct experimental tests on three different DR datasets: EyePaCS, DDR, and Messidor-2.
The remainder of this paper is organized as follows: Section 2 describes the proposed methods for DR detection. Section 3 presents experiments, result analyses, and comparisons with the previous results. Finally, the discussion and conclusion are given in Section 4 and Section 5, respectively.

2. The Proposed DR Detection System

DR detection includes extracting useful features from the pre-processed retinal fundus images, which are input into the network, and the classification using these obtained features. ResNet [39], which is a famous deep learning model applied in the residual design to optimize learning, is commonly used as a backbone network in various tasks in computer vision. ResNet-50 was employed as an encoder to learn presentations from the input data in this study. The classifier is actually a MLP with two fully connected layers, and the softmax function is used as an activation function in the final layer. The classifier accepts the flattened input vectors and outputs two values denoting probabilities of RDR or No-RDR for each corresponding input.

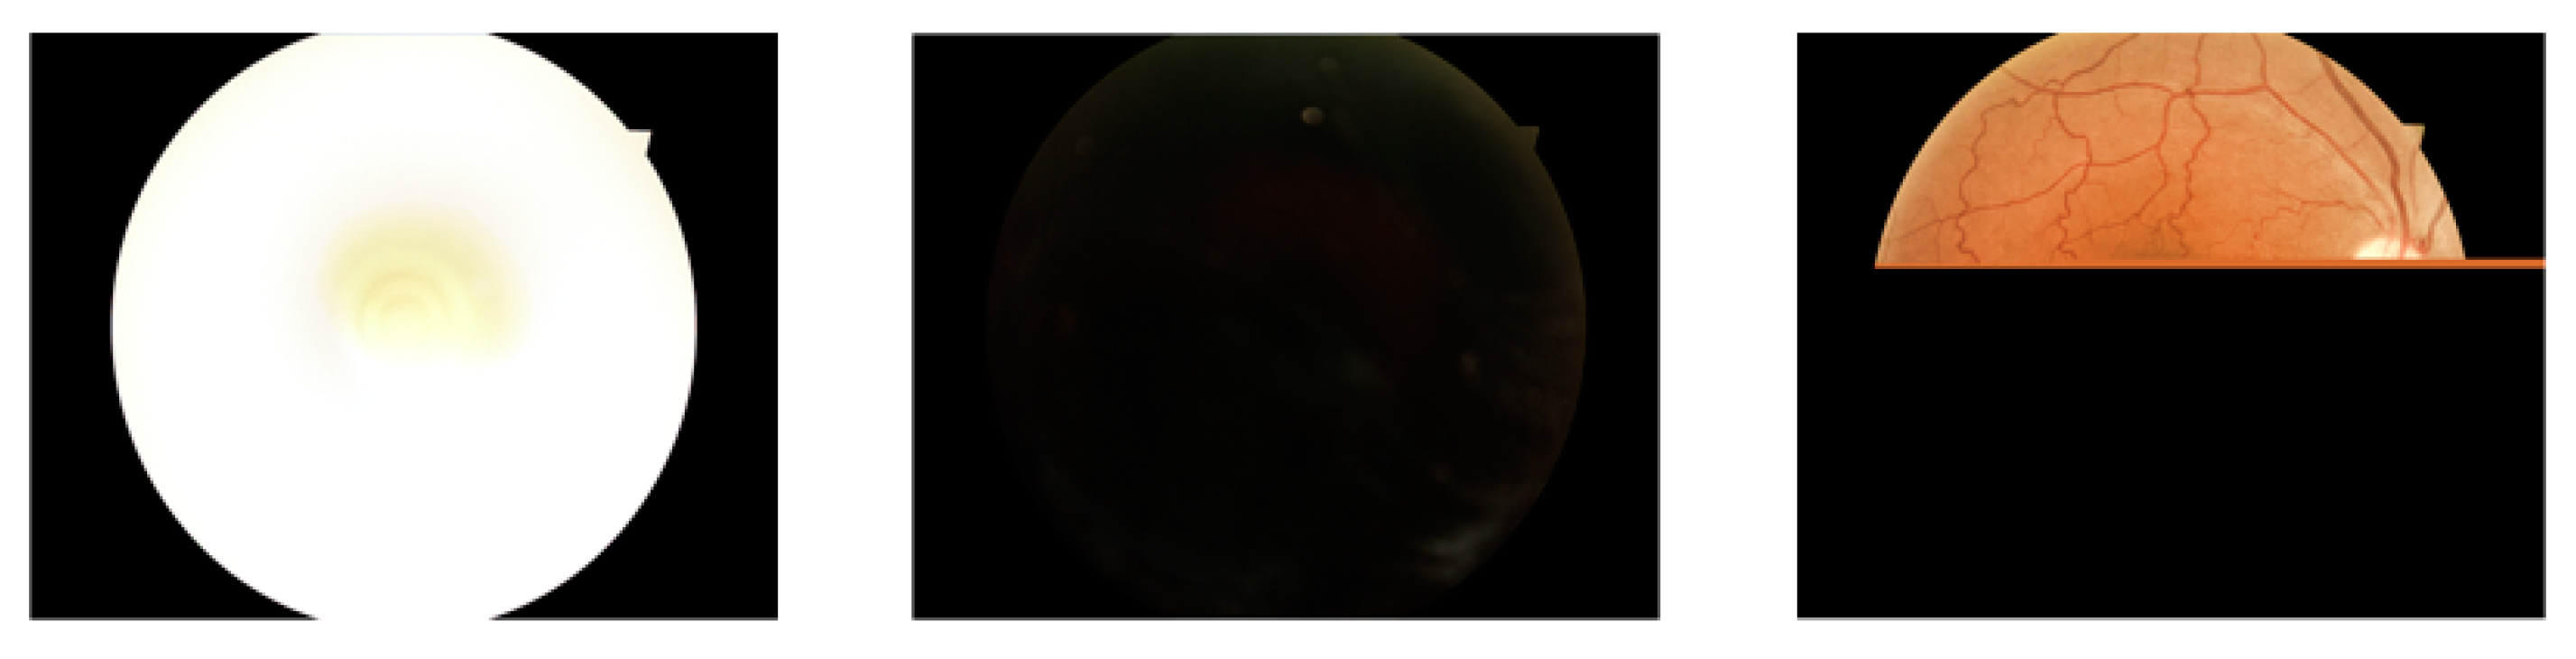
2.1. Data Pre-Processing

The retinal fundus image data used for training and testing were obtained from three open datasets: EyePaCS [36], DDR [37], and Messidor-2 [38]. We removed some images from EyePaCS because they were overexposed or underexposed, or had lost information. Figure 1 shows several examples of these discarded images. The original images are circled by a wide border on the black background where no information is provided for the DR detection task. Therefore, the extra black border was cropped out to leave the central part of each image containing task-related features. The source and images, the borders of which are removed, are shown in Figure 2. All images were re-sized to 512 × 512 and normalized before being fed into the network. After normalization, the pixels of each channel were in the range −1 to 1, with a standard deviation of 1.

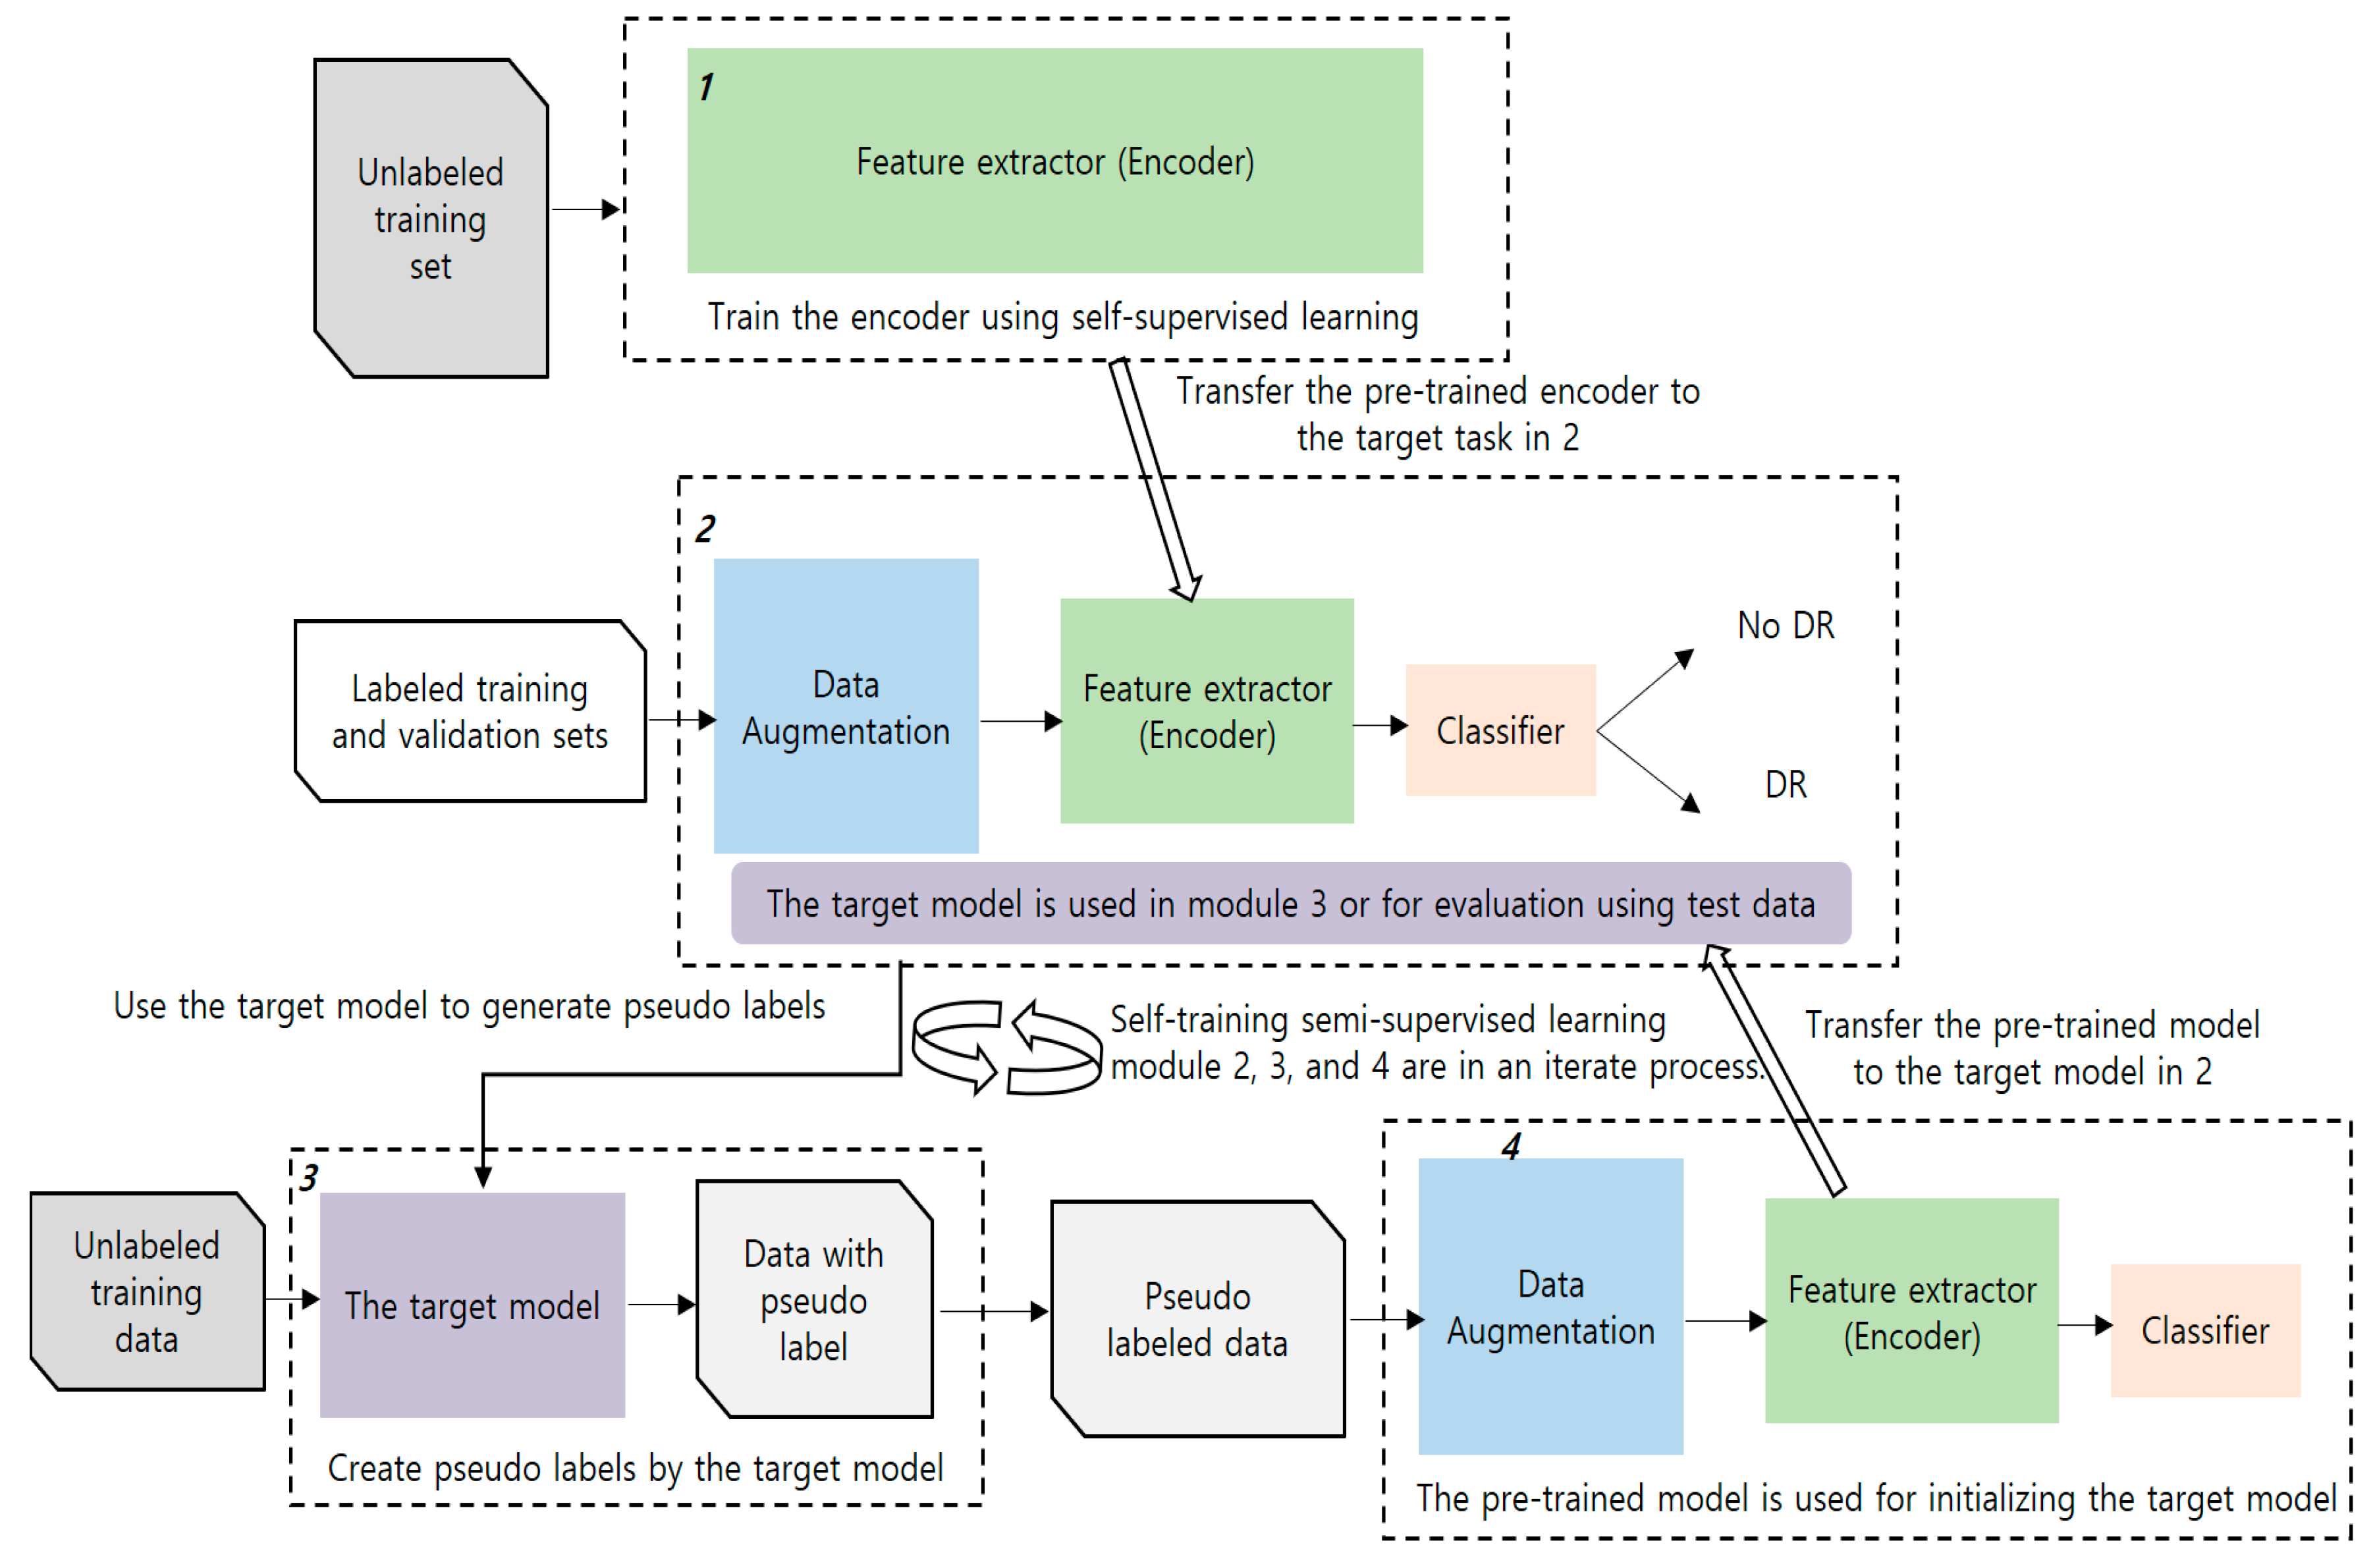
2.2. The Proposed Method

In the absence of sufficient data with balanced distribution between classes, the study was conducted to improve DR detection by utilizing unlabeled data. The model was pre-trained with retinal fundus images without human annotations, and then the trained model was fine-tuned on the labeled data to perform DR detection. The pre-training was performed using self-supervised learning and semi-supervised learning, while the fine-tuning procedure was implemented using supervised-learning. The main framework of DR detection using pre-training and fine-tuning based on the CNN model is illustrated in Figure 3. Self-supervised and semi-supervised learning were used as wrapper algorithms by which a more useful set of parameters can be learned in advance for the target task performed by supervised learning.

2.2.1. Pre-Training Using Self-Supervised Learning

The approach of using self-supervised and semi-supervised learning in this study was inspired by the work of exploring pre-training and the semi-supervised and self-training methods to utilize unlabeled data of the text corpus for improving performance on the text classification task [40]. The results of Sun et al. show the obvious improvement in the performance using both pre-training and self-training [40]. In addition, these authors also found that if there was a text corpus consisting of a large-scale dataset in the domain, then it was not necessary for their model to be pre-trained on the general open-domain corpus. For example, the size of an unlabeled in-domain dataset is hundreds of times larger than its labeled dataset. However, in practical research, collecting millions of pieces of medical data is almost impossible. In this study, therefore, self-supervised learning was applied for conducting the pre-training process to learn presentations from unlabeled fundus image data, and is presented as module ‘1’ in Figure 3. After pre-training, the learned parameters were used to initiate the encoder in module ‘2’, which represents the target model of performing DR detection trained or fine-tuned on the labeled data using supervised learning.
Contrastive self-supervised learning model was used in the pre-training task. The object for comparison is the similarity between two vectors or two groups of vectors on a hypersphere [41]. The similarity can be measured by the dot product of L2 normalization of the vectors, or the cosine similarity, defined as
S ( z i z j ) = z i T z j | z i | 2 | z j | 2 ,
The vectors z i and z j are projections of the representation (or embedding) projected out by the encoder of the network. Cosine similarity, which is defined based on the cosine of the angle between vectors, is a measure of similarity between vectors. An image can be transformed into two different versions through rotation, flipping, resizing, etc. These two transformed images from the same image are called a pair of positive samples, while other different data samples from the same batch are deemed as the negative samples for one positive sample. In theory, the similarity between positive samples should be higher than between negative samples [41]. The loss function is defined as
L i = log ( exp ( S ( z i , z j + ) / τ ) j = 0 K exp ( S ( z i , z j + ) / τ ) ,
where the above loss function is a form of the contrastive loss function called InfoNCE that uses similarity measured by dot product [41]. Here, τ is a temperature hyperparameter for controlling the alignment and uniformity to find a balance. The alignment property guarantees that the distance between positive vectors should be close in the unit hypersphere, while the uniformity property causes the feature vectors to be distributed uniformly on the unit hypersphere. The model was optimized by minimizing this loss function.

2.2.2. Pre-Training Using Semi-Supervised Learning

Another approach used for pre-training is pseudo-label-based semi-supervised learning. It is a cyclic process involving three steps: The first step is to train a model, called the teacher, using the labeled training data. This trained teacher model is used to annotate the unlabeled fundus image data and create pseudo labels. To create more reliable pseudo labels, we score the prediction values using a threshold of confidence. This step is shown in module 3 of Figure 3. The next step is to train a model using the data with generated pseudo labels, as shown in module 4 in Figure 4. This model is referred to as a student model. Once the student model is trained, it can be used to initialize the teacher model. The teacher model is then fine-tuned on the labeled training data, which goes back to the first step of the loop. Then, the student model can be regarded as a pre-trained model. After fine-tuning the teacher, a new teacher model is formed, which is then applied to predictions, and pseudo labels are assigned to the remaining unlabeled data. These three steps were iterated until all unlabeled data were predicted and used. This is a self-training method, which is usually used for semi-supervised learning.

2.2.3. A Combination of Self-Supervised and Semi-Supervised Learning

The pseudo labels are created by the teacher model. The first teacher model was obtained by training the model on the labeled dataset. However, the first teacher model used for labeling can also be a combination of an encoder trained on the unlabeled data and a classifier. This combined model is subsequently fine-tuned on the labeled data. That is, the first teacher model for generating pseudo labels can be built using the modules ‘1’ and ‘2’ in Figure 3. With the help of a pre-trained encoder trained using unlabeled data from module 1, the teacher model outperforms the model using only labeled data. Thus, a more reliable pseudo label is generated.

2.2.4. Additional Process for Imbalanced Learning

Some studies report that using self-supervised or semi-supervised learning can improve imbalanced learning to some extent [42,43]. However, the unlabeled dataset also has a nature of class-imbalanced data distribution in the real world. The biased learning will still be exerted on and affect the model, which pay attention to samples that belong to the majority class. This makes the semi-supervised learning perform worse on data compared to balanced training set. Data re-sampling and loss reweighting are the solutions for re-balancing data distribution between classes. However, these class re-balance strategies may bring the impaired representative ability of the learned model, and the corresponding methods such as bilateral-branch network, and decoupling of the encoder and the classifier were proposed [44,45]. This research result was followed but the model was not separated, and the classifier was additionally fine-tuned on the re-sampling labeled training dataset in this study.

3. Experiments

3.1. Datasets

Experiments were conducted using three retinal fundus image datasets: EyePaCS, DDR, and Messidor-2. Models were trained using EyePaCS dataset, and the models were evaluated on each of the three datasets. The datasets have five levels of labels from ‘0’ to ‘4’, denoting the severity of DR disease. Re-labeling was performed to make it suitable for the binary classification task in the study. According to the International Clinical Diabetic Retinopathy Scale [46], the severity of levels ‘0’ and ‘1’ is regarded as non-referable DR (No-RDR), while another class is referable DR (RDR) consisting of the levels of ‘2’, ‘3’, and ‘4’. From this point on, No-RDR will be represented as ‘0’ and RDR will be represented as ‘1’. EyePaCS provides more than 80,000 fundus photographs of the retina, of which 35,126 images come with labels and the rest are unlabeled data. The total number of labeled data after pre-processing was 35,039. Model training for supervised and unsupervised learning was performed using labeled and unlabeled data, respectively. After re-labeling, the percentages of data samples falling into the categories ‘0’ and ‘1’ were 80.42% and 19.58%, respectively. The re-labeled EyePaCS dataset for the experiments was divided into three subsets (i.e., training, validation, and test sets) with a ratio of 70:15:15. The distribution of data between classes in the training set was continuously imbalanced. This was thus called the imbalanced training set. By undersampling, we created a balanced training set between classes. That is, there were 4802 fundus images for each of the two classes. The split validation and test sets had 4227 and 1029 samples for the majority and minority class, respectively. However, we re-sampled data in an undersampling manner to acquire balanced validation and test sets, i.e., the number of examples in the majority class was reduced to ‘1029’. The datasets for these descriptions are reported in Table 1. The other test set from the DDR dataset contained ‘3380’ examples and ‘1690’ per category. Messidor-2 had a total of ‘1748’ data samples, of which ‘1291’ belonged to category ‘0’ and ‘457’ to category ‘1’. The test datasets from DDR and Messidor-2 are described in Table 2.

3.2. Experimental Setup

DR detection system was implemented on the PyTorch platform, run in a single GPU (GTX 1080 Ti). The Adam optimizer, which is an algorithm for optimization technique for gradient descent, was used in most experiments, while the SGD optimizer was adopted in other experiments, including self-supervised learning and fine-tuning of the classifier. In most experiments, the initial learning rate was set to 1 × 10⁻⁴ or 1 × 10⁻⁵, and the weight decay rate was set to 1 × 10⁻⁵ or 1 × 10⁻⁶. The learning rate was automatically adjusted according to the losses monitored by the program during training using the cosine decay schedule. The training process was stopped if the accuracy of the validation dataset did not increase fivefold. Data were augmented by rotation, flipping, cropping, and were affined during the training process.
To compare the DR detection performance before and after applying the proposed method, a baseline was set without resorting to the proposed method. Several different sets of experiments were performed at the baseline in order to choose the best experimental result for comparison with the proposed method.

3.3. Experimental Results at Baseline

We first conducted experiments to evaluate the effects of pre-processing. Pre-processing reduced the training time and improved the model’s performance significantly by increasing accuracy from 59.57% to 68.03%, which shows that the pre-processing method is effective.
At the baseline, we conducted three sets of experiments: training models from scratch, transfer learning, and data augmentation. The results of testing models trained from scratch on the imbalanced training set were poor, with an accuracy of 50.0%, a TPR of 0, and a TNR of 100. The model could classify two categories without serious biases when training the model from scratch on the balanced training set. However, it was hard for the model to converge. We employed ResNet-50 pre-trained on the ImageNet dataset. The model was initialized with the pre-trained models’ parameters and only trained with the modified fully connected layer; then, we fine-tuned the whole model. After transfer learning, the accuracy of the model improved to over 80% using either the imbalanced or balanced training set. Data augmentation was used to prevent overfitting observed during training. The models were improved further by data augmentation. The best choice is the use of the combination of transfer learning and data augmentation; thus, the results from this combination were regarded as the experimental baseline. The detailed results of three sets of experiments are reported in Table 3.

3.4. Experimental Results for the Proposed Method

We trained a model on the unlabeled data (U), and then used the trained model as a pre-trained model to fine-tune the model on the labeled data (D) with transfer learning, denoted by F(D). Three sets of experiments were performed to evaluate the proposed methods of exploiting the unlabeled data for dealing with imbalanced learning. All the experiments used ResNet-50 as the network backbone.
The first set was trained on unlabeled data using self-supervised learning. After that, the model was fine-tuned using the learned representations, denoted by T(U)F(D). For the second experiment, the model was trained using labeled data, denoted by T(D). Then, the trained model predicted the unlabeled data to generate pseudo labels (D′), denoted by L(U)→D′. Subsequently, the model was trained on these artificially labeled data, denoted by T(D′). Finally, the model was fine-tuned on the labeled data. This process can be denoted by T(D)L(U)→D′ T(D′)F(D). The third experiment was a combination of self-supervised learning and semi-supervised learning. Since the model, which was fine-tuned on the labeled training set, uses a pre-trained model, which was trained on the unlabeled dataset utilizing self-supervised learning, T(U)F(D) can also be used to create pseudo labels. The combined process is denoted by T(U)F(D) L(U)→D′ T(D′)F(D). It should be noted that the fine-tuning of the classifier was added when fine-tuning the model on the imbalanced data in each set of these experimental processes in order to handle the imbalanced learning problem. Since re-sampling hinders representation learning, additional fine-tuning of the classifier, denoted by F(cls), was implemented on the re-balanced sampling of labeled data after fine-tuning the whole model. The detailed experimental results of the EyePaCS test dataset for each set are presented in Table 4.
As shown in Table 4, the results of the three sets of experiments using the proposed method outperformed the ordinary supervised learning baseline. The accuracy was effectively improved by about 2~4% and 3~5% in the case of learning with imbalanced and balanced data, respectively. Additional fine-tuning of the model’s classifier on the re-sampling data helped to increase this by about 1%. Although no significant increase was observed when annotating unlabeled data with the result of T(U)F(D) compared to the results obtained from the second set, the combined method made the whole process much shorter than the experimental process in the second set. Thus, it saved more computational cost, since only two iterations were needed until no new pseudo labels were generated. However, when performing the second set of experiments, more than five iterations were required. Figure 4 is a visualization of the results on a heat map generated using Grad-CAM [47] for images classified to have diabetic retinopathy. According to the image, it can be inferred that the bright yellow areas are important, compared to the surroundings, for the classification of the disease.

3.5. Performance Testing on Other Datasets and Comparison with Previous Results
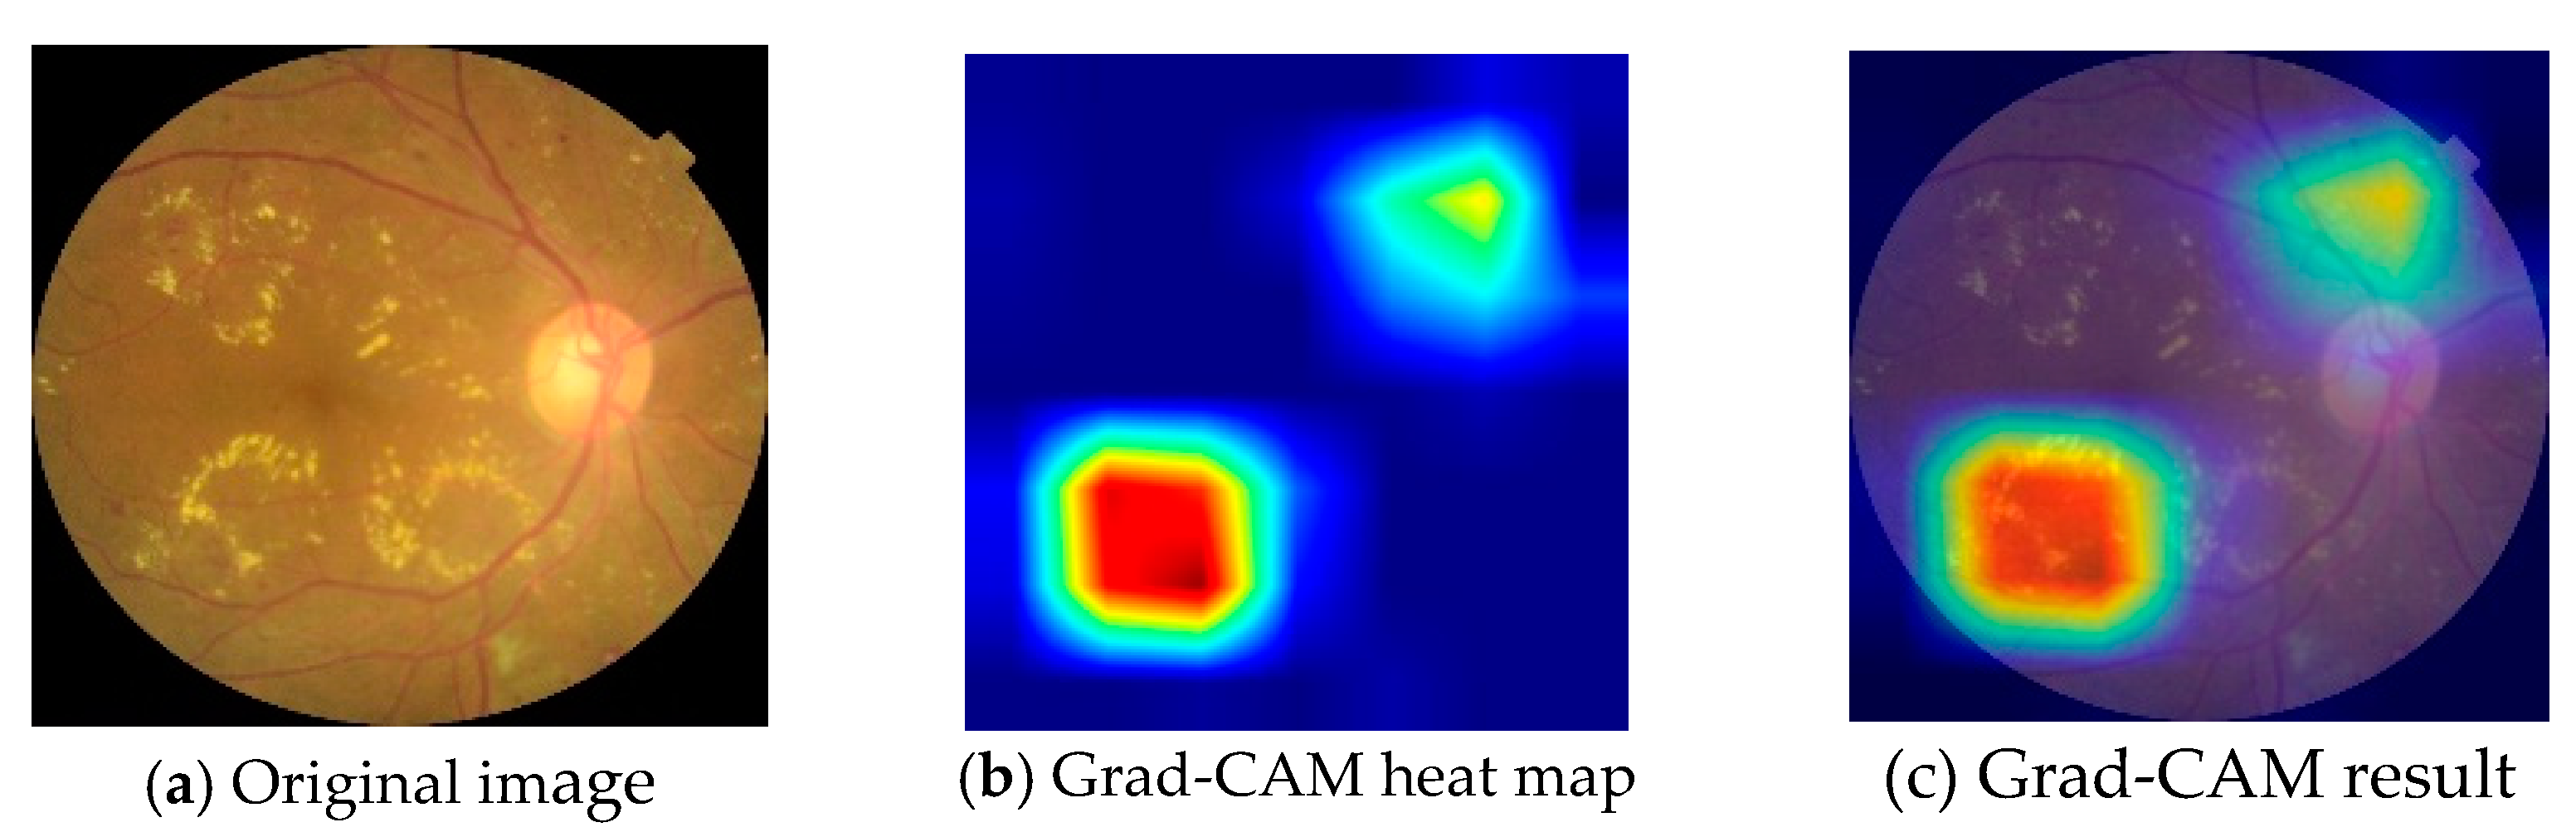
We evaluated the proposed method with test datasets from DDR and Messidor-2. The models trained with both imbalanced and balanced EyePaCS training datasets were tested using these two additional datasets. Experimental results corresponding to the DDR and Messidor-2 test datasets are reported in Table 5 and Table 6, respectively. The proposed method, which includes three techniques, (T(U)F(D), T(D)L(U)→D′ T(D′)F(D), and T(U)F(D)L(U)→D′ T(D′)F(D)), was tested on DDR and Messidor-2 datasets.
We used the test results obtained from the three datasets, EyePaCS, DDR, and Messidor-2, to compare with other methods. Three studies of recent DR detection for comparison are those of [13,14,15]. All these previous studies used the supervised learning baseline. The authors used a customized CNN model [15], while they used models modified by adding other modules to state-of-the-art CNN models such as DenseNet, ResNet-50, and Inception to improve the performance [14,15]. The test of model performance was conducted on EyePaCS and DDR, and accuracy (ACC) was used as one of the evaluation metrics [13]. Messidor-2 data was used to test the model, and the area under the curve (AUC), sensitivity (TPR), and specificity (TNR) were used as the evaluation metrics in [14]. Meanwhile, in [15], tests were performed using EyePaCS data, and the evaluation metrics were ACC, TPR, and TNR. The results that were reported in [13,14,15] are shown in Table 7. When using EyePaCS, [13] and [15] are compared with our proposed method; the best accuracies reported in [15] and [13] were 75% and 86.18%, respectively, which are lower than ours. The proposed method greatly outperforms the customized CNN model proposed in [15] in terms of TPR. CABNet [13], which addresses the imbalanced learning problem by adding a novel network called category attention block and a module called global attention block to the CNN model, outperformed their baselines and significantly improved performance. However, our wrapped approach of utilizing unlabeled data outperforms CABNet on the DDR test set substantially. In the case of Messidor-2 data, DLGP-DR, the authors of [14] added a Gaussian process to improve the generality of their model, and reported performance results of AUC 87.87%, TPR 72.37, and TNR 86.25, which are also significantly lower than ours.

4. Discussion

Our experimental results demonstrate that the proposed methods effectively deal with the imbalanced learning challenge, in which the model is absolutely biased towards the majority class. The methods are not limited by the network used, and can be applied to different backbone networks as well. The results would be improved if a larger-scale unlabeled dataset could be collected and used without being limited by the computational power provided. Nonetheless, the feasibility, effectiveness, and generality of the proposed methods are indicated experimentally.
The improved performance of the proposed methods in DR detection can be attributed to the approach of utilizing unlabeled data from the same domain, and to the specific strategies of dealing with the imbalanced learning issue in the case of training a model using an imbalanced dataset. The experimental results demonstrate that the sensitivity of the model can be increased substantially in each of these approaches using the wrapped self-supervised or semi-supervised algorithm. This means that a model with classification bias caused by imbalanced data distribution can be re-balanced to give more attention to the minority class (samples with DR disease), thus, the performance can be improved. Moreover, another improvement was observed when combining self-supervised learning with semi-supervised learning; this approach led to a significant reduction in training time. The effectiveness of this approach is obvious, as the model initially trained with supervised learning on labeled data certainly did not perform as well as the model that had been fine-tuned with the help of the pre-trained model, which was trained using self-supervised learning.
However, self-training using semi-supervised learning is relatively inefficient due to the iterative process. The semi-supervised learning method still suffers from the imbalanced dataset problem, which still poses a major challenge for semi-supervised learning, the current practice of which is to use a fully balanced dataset with reference to their pseudo labels. This is only feasible in the case where pseudo labels can be generated; what if this is not possible in practice? In this instance, it is feasible to use self-supervised learning to train the model first. Therefore, the research of combining semi-supervised and self-supervised learning is also a novel direction. It is difficult for self-supervised learning to interpret how to learn the underlying representation. Nonetheless, because of its explicability, self-supervised learning is said to be the closest AI principle to the way humans see.
It can be seen from the two experimental results for the imbalanced and balanced datasets that the performance of the model trained on the relatively smaller balanced dataset was not worse than that of the counterpart, which was the relatively larger imbalanced dataset. Furthermore, when using the small balanced dataset, there is no need to employ the additional re-balancing strategy of fine-tuning the classifier; it also saved computational costs because of its shorter training process. Thus, it raises the following question: why do we use large imbalanced datasets if there are appropriate ways to make the model perform as effectively on smaller datasets as it does on larger ones? This indicates that deep-learning-based CNN models do not necessarily have to use large datasets to achieve better performance. It is crucial to use a small amount of data to make the model perform well under the extraordinary difficulty of collecting clean and labeled medical data. If a model achieves good results on a small dataset, then the model will be much less dependent on a large amount of labeled data.
Both self-supervised learning and semi-supervised learning have the potential to learn from unlabeled data, and there should be more research in this field in the future. Studies in self-supervised learning have used interclass balanced benchmark datasets and have not yet considered the problem of imbalanced learning. Although it is not possible to categorize features learned from unlabeled data, there is no doubt that the learned features must be more representative of the majority class if imbalanced datasets are used to train models through self-supervised learning. Therefore, future research on self-supervised learning using imbalanced data will be initiated, while there should be improvements for imbalanced learning in semi-supervised deep learning algorithms. In addition, the DR diagnostic system not only discerns the presence or absence of symptoms, but also needs to grade the disease so that patients can understand the status of their illness in more detail, and thus take appropriate measures.
This study is limited to binary classification. Using self-training semi-supervised learning, which is not an efficient method, is also one of the limitations of our work. The current semi-supervised learning method with relatively better performance is the consistency regularization paradigm; however, since it also suffers from imbalanced learning, models have been restricted to training using balanced datasets. In this study, since we only focused on the learning problem arising from the use of imbalanced labeled datasets, only the self-trained method of iteratively generating balanced data using the reference provided by pseudo labeling was adopted. As can be seen from the data, the quantity of unlabeled data we used in the work did not reach a hundred times higher than the labeled data, which was limited by the availability of fundus data and limited computational resources. This study focused on how to utilize the unlabeled data in the method rather than improving the performance by the huge amount of data.

5. Conclusions

In this study, the implementation of a deep-learning-based binary classification task for the presence and absence of diabetic retinopathy using a labeled and imbalanced dataset is presented. The study focused on how to overcome the learning difficulty of deep-learning-based models caused by the use of training datasets with interclass imbalanced data distribution. The ideas proposed are mainly regarding how to utilize unlabeled data, the quantity of which is much larger than that of available labeled data, to address the imbalanced learning issue of modern models and improve their performance. The approaches used to exploit unlabeled data using self-supervised or semi-supervised learning, or a combination of self-supervised and semi-supervised learning, are explained in this paper. For comparison, both class-imbalanced and balanced datasets were compiled and used to train the models of the CNN. The proposed DR detection system was implemented and tested.
The proposed methods are explained in principle, and we confirm, through extensive experiments, that they can help supervised learning to improve performance in DR detection. Moreover, the proposed method is supported experimentally in terms of feasibility, effectiveness, and generality. However, self-training semi-supervised learning, which was used in the present work, is relatively inefficient due to the iterative process. Furthermore, this work was limited to diagnosing the presence or absence of DR. Nonetheless, researchers can gain some insight from this study on how to use unlabeled data to optimize learning when the unlabeled data in the domain are available, and the proposed method can undoubtedly be extended to multiple classifications. Though the proposed methods achieved good results for the DR detection task, there are still some limitations regarding its application in clinical practice. However, it can provide some reference for clinical diagnosis. To better utilize unlabeled data to further improve DR detection, future work should include addressing the imbalanced learning issue in semi-supervised or even self-supervised learning, not only to identify DR, but also to develop more reliable DR grading system.

Author Contributions

Conceptualization, X.Z. and Y.S.K.; Methodology, X.Z., Y.S.K. and S.-Y.R.; Software, X.Z., Y.S.K. and S.Y.; Validation, Y.K. and Y.-C.C.; Formal Analysis, Y.-C.C. and Y.K.; Data Curation, X.Z.; Writing—original draft preparation, X.Z.; Writing—review and editing, Y.S.K., Y.K. and Y.-C.C.; Funding acquisition, Y.S.K. and S.Y. All authors have read and agreed to the published version of the manuscript.

Funding

This work was supported by the National Research Foundation of Korea (NRF) grant funded by the Korea Government (MSIT) (No. NRF-2020R1G1A1100987).

Institutional Review Board Statement

Not applicable.

Informed Consent Statement

Not applicable.

Data Availability Statement

Not applicable.

Conflicts of Interest

The authors declare no conflict of interest.

References

  1. Memon, W.R.; Lal, B.; Sahto, A.A. Diabetic retinopathy. Prof. Med. J. 2017, 24, 234–238. [Google Scholar] [CrossRef]
  2. Liu, Y.-P.; Li, Z.; Xu, C.; Li, J.; Liang, R. Referable diabetic retinopathy identification from eye fundus images with weighted path for convolutional neural network. Artif. Intell. Med. 2019, 99, 101694. [Google Scholar] [CrossRef] [PubMed]
  3. Lakshminarayanan, V.; Kheradfallah, H.; Sarkar, A.; Balaji, J.J. Automated Detection and Diagnosis of Diabetic Retinopathy: A Comprehensive Survey. J. Imaging 2021, 7, 165. [Google Scholar] [CrossRef] [PubMed]
  4. Tsiknakis, N.; Theodoropoulos, D.; Manikis, G.; Ktistakis, E.; Boutsora, O.; Berto, A.; Scarpa, F.; Scarpa, A.; Fotiadis, D.I.; Marias, K. Deep learning for diabetic retinopathy detection and classification based on fundus images: A review. Comput. Biol. Med. 2021, 135, 104599. [Google Scholar] [CrossRef]
  5. Mookiah, M.R.K.; Acharya, U.R.; Chua, C.K.; Lim, C.M.; Ng, E.; Laude, A. Computer-aided diagnosis of diabetic retinopathy: A review. Comput. Biol. Med. 2013, 43, 2136–2155. [Google Scholar] [CrossRef]
  6. Mateen, M.; Wen, J.; Hassan, M.; Nasrullah, N.; Sun, S.; Hayat, S. Automatic Detection of Diabetic Retinopathy: A Review on Datasets, Methods and Evaluation Metrics. IEEE Access 2020, 8, 48784–48811. [Google Scholar] [CrossRef]
  7. Mansour, R.F. Deep-learning-based automatic computer-aided diagnosis system for diabetic retinopathy. Biomed. Eng. Lett. 2017, 8, 41–57. [Google Scholar] [CrossRef]
  8. Zhang, W.; Zhong, J.; Yang, S.; Gao, Z.; Hu, J.; Chen, Y.; Yi, Z. Automated identification and grading system of diabetic retinopathy using deep neural networks. Knowl.-Based Syst. 2019, 175, 12–25. [Google Scholar] [CrossRef]
  9. Li, F.; Liu, Z.; Chen, H.; Jiang, M.; Zhang, X.; Wu, Z. Automatic Detection of Diabetic Retinopathy in Retinal Fundus Photographs Based on Deep Learning Algorithm. Transl. Vis. Sci. Technol. 2019, 8, 4. [Google Scholar] [CrossRef]
  10. Tymchenko, B.; Marchenko, P.; Spodarets, D. Deep Learning Approach to Diabetic Retinopathy Detection. arXiv 2020, arXiv:2003.02261v1. [Google Scholar]
  11. Alyoubi, W.; Abulkhair, M.; Shalash, W. Diabetic Retinopathy Fundus Image Classification and Lesions Localization System Using Deep Learning. Sensors 2021, 21, 3704. [Google Scholar] [CrossRef] [PubMed]
  12. Hagos, M.T.; Kant, S. Transfer learning based detection of diabetic retinopathy from small dataset. arXiv 2019, arXiv:1905.07203v2. [Google Scholar]
  13. He, A.; Li, T.; Li, N.; Wang, K.; Fu, H. CABNet: Category Attention Block for Imbalanced Diabetic Retinopathy Grading. IEEE Trans. Med. Imaging 2020, 40, 143–153. [Google Scholar] [CrossRef] [PubMed]
  14. Cortés, S.T.; Pava MD, L.; Perdómo, O.; González, F.A. Hybrid deep learning Gaussian process for diabetic retinopathy diagnosis and uncertainty quantification. arXiv 2020, arXiv:2007.14994v1. [Google Scholar]
  15. Pratt, H.; Coenen, F.; Broadbent, D.M.; Harding, S.P.; Zheng, Y. Convolutional neural networks for diabetic retinopathy. Procedia Comput. Sci. 2016, 90, 200–205. [Google Scholar] [CrossRef]
  16. Islam, S.M.S.L.; Hasan, M.M.H.; Abdullah, S. Deep learning based early detection and grading of diabetic retinopathy using retinal fundus images. arXiv 2018, arXiv:1812.10595v1. [Google Scholar]
  17. Zhang, D.; Bu, W.; Wu, X. Diabetic retinopathy classification using deeply supervised ResNet. In Proceedings of the 2017 IEEE SmartWorld, Ubiquitous Intelligence & Computing, Advanced & Trusted Computed, Scalable Computing & Communications, Cloud & Big Data Computing, Internet of People and Smart City Innovation (SmartWorld/SCALCOM/UIC/ATC/CBDCom/IOP/SCI), San Francisco, CA, USA, 4–8 August 2017; pp. 1–6. [Google Scholar] [CrossRef]
  18. Qummar, S.; Khan, F.G.; Shah, S.; Khan, A.; Shamshirband, S.; Rehman, Z.U.; Khan, I.A.; Jadoon, W. A Deep Learning Ensemble Approach for Diabetic Retinopathy Detection. IEEE Access 2019, 7, 150530–150539. [Google Scholar] [CrossRef]
  19. Antal, B.; Hajdu, A. An ensemble-based system for automatic screening of diabetic retinopathy. Knowl.-Based Syst. 2014, 60, 20–27. [Google Scholar] [CrossRef]
  20. Zeng, X.; Chen, H.; Luo, Y.; Ye, W. Automated Diabetic Retinopathy Detection Based on Binocular Siamese-Like Convolutional Neural Network. IEEE Access 2019, 7, 30744–30753. [Google Scholar] [CrossRef]
  21. Li, X.; Jia, M.; Islam, T.; Yu, L.; Xing, L. Self-Supervised Feature Learning via Exploiting Multi-Modal Data for Retinal Disease Diagnosis. IEEE Trans. Med. Imaging 2020, 39, 4023–4033. [Google Scholar] [CrossRef]
  22. Ali, R.; Hardie, R.C.; Narayanan, B.N.; Kebede, T.M. IMNets: Deep Learning Using an Incremental Modular Network Synthesis Approach for Medical Imaging Applications. Appl. Sci. 2022, 12, 5500. [Google Scholar] [CrossRef]
  23. Kobat, S.G.; Baygin, N.; Yusufoglu, E.; Baygin, M.; Barua, P.D.; Dogan, S.; Yaman, O.; Celiker, U.; Yildirim, H.; Tan, R.-S.; et al. Automated Diabetic Retinopathy Detection Using Horizontal and Vertical Patch Division-Based Pre-Trained DenseNET with Digital Fundus Images. Diagnostics 2022, 12, 1975. [Google Scholar] [CrossRef] [PubMed]
  24. Ali, R.; Li, H.; Dillman, J.R.; Altaye, M.; Wang, H.; Parikh, N.A.; He, L. A self-training deep neural network for early prediction of cognitive deficits in very preterm infants using brain functional connectome data. Pediatr. Radiol. 2022, 52, 2227–2240. [Google Scholar] [CrossRef] [PubMed]
  25. Zhu, Z.; He, X.; Qi, G.; Li, Y.; Cong, B.; Liu, Y. Brain tumor segmentation based on the fusion of deep semantics and edge information in multimodal MRI. Inf. Fusion 2023, 91, 376–387. [Google Scholar] [CrossRef]
  26. Russakovsky, O.; Deng, J.; Su, H.; Krause, J.; Satheesh, S.; Ma, S.; Huang, Z.; Karpathy, A.; Khosla, A.; Bernstein, M.; et al. ImageNet large scale visual recognition challenge. arXiv 2015, arXiv:1409.0575v3. [Google Scholar] [CrossRef]
  27. Zhu, X.; Vondrick, C.; Fowlkes, C.C.; Ramanan, D. Do We Need More Training Data? Int. J. Comput. Vis. 2015, 119, 76–92. [Google Scholar] [CrossRef]
  28. Shen, D.; Wu, G.; Suk, H.-I. Deep Learning in Medical Image Analysis. Annu. Rev. Biomed. Eng. 2017, 19, 221–248. [Google Scholar] [CrossRef]
  29. Litjens, G.; Kooi, T.; Bejnordi, B.E.; Setio, A.A.A.; Ciompi, F.; Ghafoorian, M.; van der Laak, J.A.W.M.; van Ginneken, B.; Sánchez, C.I. A survey on deep learning in medical image analysis. Med. Image Anal. 2017, 42, 60–88. [Google Scholar] [CrossRef]
  30. Johnson, J.M.; Khoshgoftaar, T.M. Survey on deep learning with class imbalance. J. Big Data 2019, 6, 27. [Google Scholar] [CrossRef]
  31. He, H.; Garcia, E.A. Learning from Imbalanced Data. IEEE Trans. Knowl. Data Eng. 2009, 21, 1263–1284. [Google Scholar] [CrossRef]
  32. Jackson, B.R. The Dangers of False-Positive and False-Negative Test Results: False-Positive Results as a Function of Pretest Probability. Clin. Lab. Med. 2008, 28, 305–319. [Google Scholar] [CrossRef] [PubMed]
  33. Seeger, M. A taxonomy for semi-supervised learning methods. In Semi-Supervised Learning; Chapelle, O., Schölkopf, B., Zien, A., Eds.; The MIT Press: Cambridge, MA, USA; London, UK, 2006; pp. 15–31. [Google Scholar]
  34. Jaiswal, A.; Babu, A.R.; Zadeh, M.Z.; Banerjee, D.; Makedon, F. A Survey on Contrastive Self-Supervised Learning. Technologies 2020, 9, 2. [Google Scholar] [CrossRef]
  35. Yang, X.; Song, Z.; King, I.; Xu, Z. A Survey on Deep Semi-Supervised Learning. arXiv 2021, arXiv:2103.00550v2. [Google Scholar] [CrossRef]
  36. Cuadros, J.; Bresnick, G. EyePACS: An Adaptable Telemedicine System for Diabetic Retinopathy Screening. J. Diabetes Sci. Technol. 2009, 3, 509–516. [Google Scholar] [CrossRef] [PubMed]
  37. OIA-DDR Data for Diabetic Retinopathy Classification. Available online: https://github.com/nkicsl/DDR-dataset (accessed on 17 March 2022).
  38. Decencière, E.; Zhang, X.; Cazuguel, G.; Lay, B.; Cochener, B.; Trone, C.; Gain, P.; Ordóñez-Varela, J.-R.; Massin, P.; Erginay, A.; et al. Feedback on a publicly distributed image database: The Messidor database. Image Anal. Ster. 2014, 33, 231. [Google Scholar] [CrossRef]
  39. He, K.; Zhang, X.; Ren, S.; Sun, J. Deep residual learning for image recognition. In Proceedings of the IEEE Conference on Computer Vision and Pattern Recognition, Las Vegas, NV, USA, June 26–1 July 2016. [Google Scholar]
  40. Sun, Z.; Fan, C.; Sun, X.; Meng, Y.; Wu, F.; Li, J. Neural semi-supervised learning for text classification under large-scale pre-training. arXiv 2020, arXiv:2011.08626v2. [Google Scholar]
  41. He, K.; Fan, H.; Wu, Y.; Xie, S.; Girshick, R. Momentum Contrast for Unsupervised Visual Representation Learning. In Proceedings of the IEE/CVF Conference on Computer Vision and Pattern Recognition (CVPR), Virtual, 16 June 2022. [Google Scholar]
  42. Yang, Y.; Xu, Z. Rethinking the value of labels for improving class-imbalanced learning. Adv. Neural Inf. Process. Syst. 2020, 33, 19290–19301. [Google Scholar]
  43. Ciga, O.; Xu, T.; Martel, A.L. Self supervised contrastive learning for digital histopathology. Mach. Learn. Appl. 2021, 7, 100198. [Google Scholar] [CrossRef]
  44. Zhou, B.; Cui, Q.; Wei, X.-S.; Chen, Z.-M. BBN: Bilateral-Branch Network with Cumulative Learning for Long-Tailed Visual Recognition. In Proceedings of the IEEE/CVF Conference on Computer Vision and Pattern Recognition, Virtual, 16 June 2020. [Google Scholar]
  45. Kang, B.; Xie, S.; Rohrbach, M.; Yan, Z.; Gordo, A.; Feng, J.; Kalantidis, Y. Decoupling representation and classifier for long-tailed recognition. arXiv 2019, arXiv:1910.09217. [Google Scholar]
  46. American Academy of Ophthalmology. International Clinical Diabetic Retinopathy Disease Severity Scale Detailed Table; International Council of Ophthalmology: Brussels, Belgium, 2002. [Google Scholar]
  47. Selvaraju, R.R.; Cogswell, M.; Das, A.; Vedantam, R.; Parikh, D.; Batra, D. Grad-CAM: Visual Explanations from Deep Networks via Gradient-based Localization. arXiv 2019, arXiv:1610.02391. [Google Scholar]
Figure 1. Examples of unusable fundus image data (the images are from the EyePaCS dataset [36]).
Applsci 13 01901 g001
Figure 2. An example of source (left) and pre-processed (right) images (the image on the left is from the EyePaCS dataset [36]).
Applsci 13 01901 g002
Figure 3. The framework of the proposed DR detection system.
Applsci 13 01901 g003
Figure 4. Visualization results produced by Grad-CAM.
Applsci 13 01901 g004
Table 1. Imbalanced training, balanced training, validation, and test sets were constructed from EyePaCS data.
ClassImbalanced Training SetBalanced Training SetValidation SetTest Set
NumberPercentage (%)NumberPercentage (%)NumberNumber
019,72580.42480250.010291029
1480219.58480250.010291029
Table 2. Test datasets were constructed from DDR and Messidor-2 data.
ClassDDR Test SetMessidor-2 Test Set
NumberNumber
016901291
11690457
Table 3. Experimental results of the baseline.
DatasetImbalanced Training SetBalanced Training Set
MetricsACC (%)TPR (%)TNR (%)ACC (%)TPR (%)TNR (%)
Training from scratch50.00.0100.068.0365.8970.17
Transfer learning81.7868.4295.1480.2775.0285.52
Data augmentation82.1268.0396.1281.5374.0589.02
Table 4. Results of experiments performed with the proposed method (compared with the baseline).
DatasetImbalanced Training SetBalanced Training Set
MetricsACC (%)TPR (%)TNR (%)ACC (%)TPR (%)TNR (%)
BaselineT(D)82.1268.0396.2181.5374.0589.02
The proposed methodT(U)F(D)84.5074.3295.5184.6082.9086.72
T(U)F(D)F(cls)85.8181.8490.29---
T(D)L(U)→D′ T(D′)F(D)84.9978.5290.3886.4082.8090.90
T(D)L(U)→D′ T(D′)F(D)F(cls)85.6280.9590.28---
T(U)F(D)L(U)→D′ T(D′)F(D)---86.2582.6089.89
T(U)F(D)L(U)→D′ T(D′)F(D)F(cls)86.1085.1387.07---
Table 5. Experimental results obtained on DDR test set (imb set, the imbalanced training set).
DatasetImbalanced Training SetBalanced Training Set
MetricsACC (%)TPR (%)TNR (%)ACC (%)TPR (%)TNR (%)
T(U)F(D)(F(cls) for imb set)86.1583.4388.8888.3183.2093.43
T(D)L(U)→D′ T(D′)F(D)(F(cls) for imb set)89.288.6489.7388.7684.9792.54
T(U)F(D)L(U)→D′ T(D′)F(D)(F(cls) for imb set)89.5087.8191.1889.6286.3992.84
Table 6. Experimental results obtained on Messidor-2 test set (imb set, the imbalanced training set).
DatasetImbalanced Training SetBalanced Training Set
MetricsACC (%)TPR (%)TNR (%)ACC (%)TPR (%)TNR (%)
T(U)F(D)(F(cls) for imb set)87.3085.7887.8485.8184.9086.13
T(D)L(U)→D′ T(D′)F(D)(F(cls) for imb set)90.5689.2891.0187.8785.7888.61
T(U)F(D)L(U)→D′ T(D′)F(D)(F(cls) for imb set)90.6886.092.3388.9085.7890.01
Table 7. Comparison of the proposed method with other previous methods: ‘-‘ indicates that no value was provided for the item.
DatasetEyePaCSDDRMessidor-2
MetricsACC
(%)
TPR
(%)
TNR
(%)
ACC
(%)
TPR
(%)
TNR
(%)
AUC
(%)
TPR
(%)
TNR
(%)
Customized CNN model in [15]75.030.095.0------
CABNet in [13]86.18--78.98-----
DLGP-DR in [14]------87.8772.3786.25
The proposed method86.4082.8090.9089.6286.3992.8490.1589.2891.01
Disclaimer/Publisher’s Note: The statements, opinions and data contained in all publications are solely those of the individual author(s) and contributor(s) and not of MDPI and/or the editor(s). MDPI and/or the editor(s) disclaim responsibility for any injury to people or property resulting from any ideas, methods, instructions or products referred to in the content.

