Abstract
In Japan, the cohort structure of foreign residents and its spatial distribution significantly change along with the acceptance of a specialized and technically skilled workforce. This study aims to analyze the transition of foreign residents’ characteristics with time series with statistical viewpoints, in order to clarify the policy building for foreign migrants by local government. A nonnegative matrix factorization model (NMF) is applied to the cohort data of foreign residents in 47 Japanese prefectures in 2010, 2015 and 2020. By applying NMF to the ratio by cohort shifting, the common basis of foreign residents among the prefectures and its structures are obtained. The results show the cohort transition for foreign migrants with infants or children were significantly different, especially between Tohoku and Kyusyu regions from 2010 to 2020. The elderly cohort also had a significant change in Tohoku region from 2015 to 2020. Since the regions highlighted in this analysis include many depopulated areas, and the capacity of those local governments for the policy building would not be enough, they should be supported well by the national government.
1. Introduction
In Japan, a rapid aging of population and the decreasing fertility rate have been recognized as a big issue in social sustainability. To solve these problems, increasing the fertility rate and accepting foreign migrants are the main approaches to improve the demographic structure and national economic growth. However, the former requires a long time for substantial increase or supplying labor force to the industries, so that it is not appropriate for an immediate countermeasure. Therefore, the latter is a possible solution, as it is more quick and effective in resolving the need of Japan’s workforce and social problems.
Even though international migration to Japan is smaller than that of other industrialized countries in Europe and North America, foreign people have been a source of labor force supply in various industries in Japan. The industries suffering from a labor force shortage are agriculture, food-processing, and construction sectors. For those industries, the foreign workforce is an important stabilizer of labor supply in the current aging society of Japan. The number of migrants has gradually increased over the last decade, so then, the social structure of foreign residents has significantly transformed and affected Japanese society [1]. Japan’s foreign population has annually increased by about 200,000, while the overall Japanese population has been declining by roughly 500,000 in a year, according to the resident registration data of the Ministry of Internal Affairs and Communications (MIAC) [2]. In 2020, approximately 2.88 million foreign residents with foreign nationality were registered in Japan, which is a share of 2.2 percent of the total population in the Census of 2020, an increase of 835 thousand (43.6%) from 2015. According to the Japan Immigration Bureau (2021), China has the largest share of foreign nationals living in Japan, with 667 thousand people (27.8% of the total of the foreign residents), followed by Korea with 375 thousand (15.6%), and Vietnam with 321 thousand (13.4%). In terms of the status of foreign residents, permanent residents are 29.0%, technical intern trainees are 12.5% and students are 8.1%.
There were several significant policies for foreign migrants in Japan, such as creation of Technical Intern Training Program (TITP) to solve the labor force shortage and integration of College Student and Pre-College Student status in 2010, introduction of new residency management in 2012, implementation of Technical Intern Training Act in 2017, and establishment of Specified Skilled Worker System in 2019 (Figure 1). International migration to Japan started to increase with the introduction of new residency management in 2012. Foreign workforce immigration has significantly increased after 2015 with the impact of the Japan Revitalization Strategy approved in June 2014, which includes “Utilization of Foreign Workers” under the “Employment System Reform/Strengthening of Human Resources.” Under TITP, workers from foreign countries were recruited as interns for approximately one to five years, and they were not permitted to change jobs during their stay. In keeping with the no-immigration policy in Japan, the government has provided a minimum of support to the foreign workers during their stay, and the workers were expected to return home at the end of their internship in TITP [3]. This leads to the illegal disappearance of the interns from their assigned sites when the intern has an economic need to work in Japan beyond their authorized period of stay [4]. In order to mitigate the system faults of TITP, Japanese government tried to reform the immigration scheme with a legal framework for the admission of foreign unskilled or semi-skilled workers under TITP. In 2019, for the acceptance of work-ready foreign nationals to secure domestic human resources the statuses of residence, two statuses were established: (i) Specified Skilled Worker, which needs a considerable degree of knowledge or experience belonging to a specific industrial field from among 12 industrial fields such as “Nursing care”, “Building cleaning management”, “Machine parts and tooling/Industrial machinery/Electric, electronics and information industries”, “Construction industry”, “Shipbuilding and ship machinery industry”, “Automobile repair and maintenance”, “Aviation industry”, “Accommodation industry”, “Agriculture, Fishery and aquaculture”, “Manufacture of food and beverages”, “Food service industry” and (ii) Specified Skilled Worker, which requires proficient skills belonging to “Construction industry” and “Shipbuilding or ship machinery industry” [5]. The number of foreign workers hit a peak after the introduction of Specified Skilled Worker System for semi-skilled workers in 12 industries which were identified as having serious labor shortages. Even though Japanese immigration policies have been relaxed according to the above implementations, there is still a sizable imbalance between inbound and outbound international migration policies which need to be carefully monitored [6].
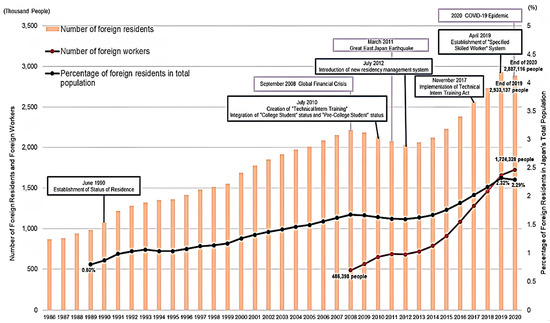
Figure 1.
Changes in the Situation of Foreign Residents in Japan (Source: Immigration Services Agency of Japan, https://www.moj.go.jp/isa/content/001335263.pdf, accessed on 15 May 2022).
The novel coronavirus (COVID-19) pandemic also affects international migration to Japan. The new foreign workforce immigration policy was launched in 2019; however, international and interregional population movements have been severely restricted by the national border closure and its strict control due to COVID-19. The foreign residents living in Japan or the work-ready foreigners visiting Japan was harmed due to the suspension or slow-down of production activities. As a result, thousands of foreign workers faced unemployment. Japanese government changed the policy for foreign workers to enable their job switching to deal with the pandemic, but job switching often requiring relocating in Japan, which was not easy for foreign workers. In addition, the strict boarder control caused many foreign workers to be unable to return to their own countries. On the other hand, some prospective trainees had been left on standby in their home countries due to the border closure. The Ministry of Justice and the Ministry of Health, Labor, and Welfare implemented the regulation of domestic population movement to prevent emergency outbreaks of COVID-19. This policy also severely impacted the domestic migration of foreign residents in 2020. The trend of foreign residents’ transition, as discussed above, became completely different in the domestic industries that had been accepting a foreign workforce.
There are a couple of studies focusing on interregional or domestic migration in Japan with respect to the demography. For example, Oo and Tsukai [7] predicted that the future population distribution of Japan will be highly concentrated in urbanized areas, because the trend in domestic migrants who will have moved from rural areas to urban areas has continued, and the migration from overseas will also be concentrated in urban areas due to the shortage of in the labor force. This could lead to even more rapid agglomeration and urbanization in existing urbanized areas and deepen the spiral of community aging and depopulation in rural areas. Sekiguchi et al. [8] focused on the relationship between the motivation to migrate and individual characteristics within living environments across prefectures by applying a decision tree analysis. This study provided helpful policy recommendations to the local government such as transportation, shopping, and geographic characteristics (e.g., heavy snow fall) to promote the U-turn migration for domestic residents. Note that these studies only focus on the Japanese residents.
A previous study on a cohort pattern of foreign residents in Japan focused on human rights, education, and training, performed by conducting a survey on foreign residents [9]. The study reported that after World War II, there was a significant change in the composition of foreign residents’ cohort structure so as to be composed of three groups: (1) professionals or skilled workers mainly with working-age cohorts (19 to 64), (2) students or industrial trainees in children cohorts (0–19) and younger-aged cohorts (20 to 34), and (3) descendants of Japanese, some of whom now reside permanently in Japan through marriage. In 2020, the largest cohorts of foreign residents are in their twenties and thirties, and this shows how foreign migrants compensate for the labor shortages [10]. Those foreign residents in Japan have grown rapidly over the past decades. Some other studies [11,12] focused on fertility, naturalization, ethnic economy, refugees, educational support, and policy issues as how foreign residents contribute to Japanese society. However, to the best of our knowledge, there is no study on foreign resident cohort transitions in Japan from the viewpoint of demographic geography.
In conventional studies, the acceptance of foreign residents and workforce in Japan discussed social aspects such as living conditions, cultural influences, and social interaction with Japanese society [13,14,15,16,17,18]. Population declines and ageing in Japan are obviously essential backgrounds, but the geographical heterogeneity connected with the demographic trends in the foreign residents did not attract interest in these studies. Previous studies [19,20,21,22] discussing how the international and internal migration would shape the regional demographic structure commonly concluded that the foreign immigrants have revitalized local industries, especially in the labor-intensive industries such as agriculture, construction, and social services, and they compensate to the domestic labor force who have left the job or retired. Additionally, there are significant links between internal and international migration to and from global cities via domestic labor substitution [23]. The mobility of the labor force also affected the regional employment structure in different regions of the national settlement system [24]. These studies focused on the internal and international migration of Western developed countries, which played an essential role in country urbanization and has contributed to a convergence in terms of regional demographic disparity. These studies and the lack of similar approaches in Japan supply a motivation to start a study on the foreign labor force transition.
A cohort approach to demographic transition can show important social implications, since it can observe the aging patterns by a comparison of multiple cross section data [25]. Because the cohort structure links past and present, cohort analysis can give a projection of future demographic structure [26]. Our study focuses on foreign residents’ cohort structure and its transition between 2010 to 2020, by using the whole nation’s statistics in order to clarify the regional disparities in foreign population dynamics. While the drastic increase in the number of foreign residents in Japan, the social services and supportive policies to them are still insufficient, and the inequity between domestic and foreign residents becomes as issue in local communities. According to Eren [27], Japanese prefectures are moving towards sustainability and livability with respect to the property market; it is necessary to make improvements about the foreign workers’ rights, job security and illegal activities, and about an appropriate acceptance of a variety of foreign residents. Therefore, there is an urgent need to construct a comprehensive migration policy that includes immigration control and a foreign residents’ integration program such as supporting language learning and vocational training of foreigners.
As an analytical tool to clarify the cohort structure, a nonnegative matrix factorization model (NMF) can clarify the potential patterns in a dataset with their weights. In this study, NMF is applied to the cohort data of foreign residents in 47 Japanese prefectures. The periods of the dataset are 2010, 2015, and 2020, which cover big social events, such as the Great East Japan Earthquake in 2011 and the changes in immigration control policy in Japan, that could possibly cause structural breaks in international migration. This study can clarify the transition of foreign residents’ cohorts’ trends in time series with the different patterns and geographical potential to make a flow of migrants. The data cover the beginning of COVID-19; the demographic patterns extracted by our analysis would be strongly affected by the transition between 2015 and 2019 rather than by that between 2019 and 2020. Therefore, the patterns from 2015 to 2020 will make the policy made after COVID-19 look like it was before COVID-19. This paper is divided into five sections. After introducing the background context, Section 2 describes the methodology flows. Section 3 introduces a summary of the data sources and the data sets used in this study. Section 4 shows and discusses the experimental results. Finally, Section 5 summarizes the findings and recommends future tasks.
2. Methods
Nonnegative matrix factorization (NMF) has now become a popular technique for the analysis of high-dimensional data, as it extracts sparse and significant characteristics with its weights from a set of nonnegative data vectors [28]. NMF is widely used in various fields such as artificial intelligence (AI), bioinformatics, computational biology, and demography [29,30,31,32]. NMF is a kind of technique of an unsupervised cluster analysis, which provides a simplified decomposition of the data matrix by the nonnegativity constraint on its outputs [33]. NMF can give the features of data that are easier to integrate then with other analytical methods. The primary approach of NMF is to estimate matrices W and H as a local minimum of the optimization problem [34], and it was popularized by Lee and Seung in 1999 [35]. The NMF general equation is as follows:
X is set up for n data points with m dimensions m n, i.e., (linear combination of W and H). By the estimation of NMF, the m original dimensions are reduced to k, which is the low rank approximation of X (k ≤ min (m, n)) and creates and . Each row of W gives weights of the basis that commonly appears in some rows of X, while each column of H gives the basis made up of the set of a column’s attributes in X. In other words, each row vector in X is approximated by a linear combination of the kth column of H, weighted by the corresponding row vector of W. A basic NMF is described in Equation (1), where the NMF solutions are not normalized. Given a nonnegative matrix X and a desired factorization rank k, the objective of the NMF algorithm is to find an approximation of X~WH. After initializing nonnegative matrices W and H randomly, they are iteratively updated to minimize the loss function D(X, WH), shown in Equation (2), specified as a generalized Frobenius distance in Equation (3).
where D is the function in approximation based on the Frobenius distance, a loss function; and R is an optional regularization function, which is smoothness or sparsity of the matrices W and H.
Equation (2) can be optimized by the alternated estimation of W and H as follows: In each iteration, W and H are updated by using the coupled multiplicative update rules as shown in Equations (4) and (5):
In practice, the optimization of Equations (4) and (5) is calculated from an arbitrary matrix with randomized elements, so then the estimated W and H are not unique but robust under an appropriate k. If k is not adequate, however, W and H become unstable, which makes the interpretation of the estimated basis difficult. To alleviate this problem, some existing methods enforce a simplicity of the basis by adding regularization terms to the NMF objective function [28]. Furthermore, in this study, the W matrix is standardized as W′ where rows of W are simply summed up, and each component (wmk) is divided by its row sum. For the H matrix, standardization is performed by summing up the entries in each column, and each component (hkn) is divided by its column sum to form H′ (influence factors of the corresponding samples). The standardization by Equations (6) and (7) makes it easier to compare the cluster membership and the interpretation of the basis.
W-matrix Standardization:
H-matrix Standardization:
In this study, the ratios of foreign residents’ cohorts between two cross section periods (2015/2010 and 2020/2015) of both genders in 47 prefectures are represented as an m n matrix X, where m is the number of 47 prefectures and n is 26, as there are 13 cohorts for each gender. The choice of k is an empirical problem worked on by comparing several outcomes obtained by different k settings [36]. In order to simplify the search for k from the viewpoint of interpretation, we assume that a set of cohort contributions of males and females in a basis of H should be basically similar, but some exceptions can be allowed. This criterion is applied after the statistical criterion gives several candidates for k.
3. Data
3.1. Data Sources
This study uses the dataset on the registered foreign population in Japanese prefectures in 2010, 2015, and 2020, conducted in the census of Japan by the Statistics Bureau of the MIAC [2]. Figure 2 describes the regions and prefectures appearing in the following outcomes. In this figure, colors express the regions and numbers show the names of prefectures in Japan. In the census, immigrants or long-term foreign visitors staying for more than three months, foreign residents having the status of permanent residents, and those who are married to Japanese are surveyed and summarized in 14 cohorts for each five-year-cohort group. Figure 3 shows the summary of cohort dynamics for Japan as a whole.
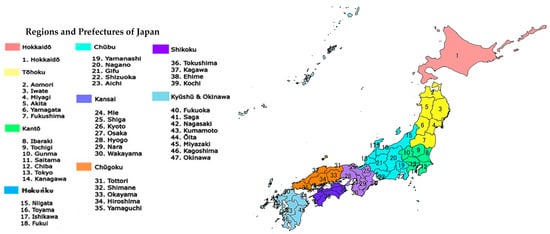
Figure 2.
Regions and Prefectures of Japan.
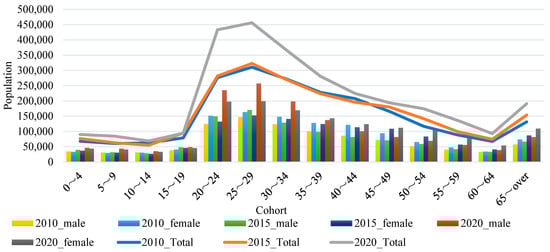
Figure 3.
Foreign Resident Cohorts in Japan from 2010 to 2020.
According to Figure 3, a minor increase and decrease occurred in some cohorts from 2010 to 2015, but basically, the distribution over cohorts was not significantly affected even though the Great East Japan Earthquake occurred. In 2015 and 2020, all the foreign residents’ cohorts in Japan were drastically increased, especially for working-age cohorts between the ages of 20 and 34. In 2020, all the male cohorts in the 0-to-19 and 20-to-34 age groups were larger than the female cohorts, while those in the over-35 age group were smaller than each of the female cohorts. For elderly cohorts in 2010, 2015 and 2020, female cohorts were larger than male cohorts. For simplicity, in the following discussion, we will discuss the experimental results based on four categories: children’s cohorts (0 to 19), younger-age cohorts (20 to 34), middle-age cohorts (35 to 64), and elderly cohorts (65 and over).
Figure 4a–c show the population of foreign residents in each prefecture in 2010, 2015, and 2020. These figures clarify that the distribution between urban and local regions is clearly different. For example, Akita has around 5000 foreign residents, while Tokyo has over 500,000. The foreign population in Japan is still concentrated in the urban areas between 2010 and in 2015, while the trend changes in 2020 as some rural regions start to attract the foreign population. According to Figure 5a–c, the share of foreign residents in the domestic population is continuously increasing around the prefectures, especially in urban areas and some local areas in Western Japan (such as Shikoku and Kyushu regions) in the decade. Based on Figure 4 and Figure 5, the geography of the foreign population is indeed transforming, and hence, in this study, the trend changes of the foreign population distribution are worth discussing.
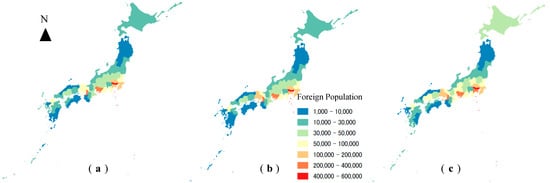
Figure 4.
Foreign Population in Japanese Prefectures (a) 2010 (b) 2015 (c) 2020.
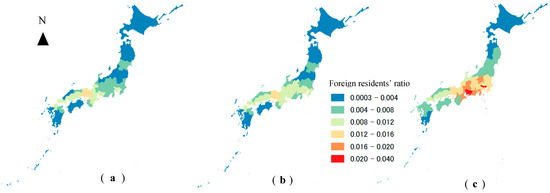
Figure 5.
Share of Foreign Residents in Domestic Population (a) 2010 (b) 2015 (c) 2020.
3.2. Data Setting for NMF
This study focuses on the demographic trend change in local regions with rather small populations, shown in Figure 5. In order to evenly deal with the prefectures regardless of their population size, the foreign cohorts’ data (5-year age groups) is aggregated into the ratio of cohorts shifted between two cross sections for both genders as shown in Equation (8):
where are the above ratios, and N is the number of foreign residents in each cohort for 47 prefectures.
If the ratio is calculated for the same age-group record in a couple of datasets observed in the different cross-sections for each, the ratios do not indicate the transition of the same cohort. Therefore, we applied cohort shifting to keep the consistency of the same cohorts among the different cross sections. For example, a cohort in 2010 (ex., 15–19) is recorded as the cohort in 2015 with 5-years’ upward shifting (ex., 20–24) because of the observation interval. It is worth noting that if a cohort in 2010 simply remains in the same region in 2015, the cohort growth will be 1. The ratios with cohort shifting can detect the net migration during the interval. Note that the shifting cannot apply to the newborn cohort (0–4), so then it is excluded from the NMF analysis. Moreover, the ratio of cohort shifting between two cross sections (later we will refer this term as cohort transition) is always positive, so then the dataset made by Equation (8) can be analyzed with NMF. Table 1 shows the aggregated dataset of the cohort transition calculated based on Equation (8). The color scales show the deviation from the average cohort transition of the prefectures for each cohort’s groups. Blue color represents the decreasing deviation, and red color represents the increasing deviation from the average cohort transition. According to Table 1, we can observe some prefectures attracting or losing the foreign cohorts. For example, from 2010 to 2015, Akita and Tokushima seriously lost the female children’s cohorts, and this trend changes from 2015 to 2020. In Oita, the cohort transitions of both male and female younger age cohorts were above the average in 2015, and this trend continues in 2020.

Table 1.
Cohort Transitions of Foreign Residents in Prefectures.
4. Results and Discussion
4.1. Transition of Newly-Born Cohort
Since the new-born cohort cannot be included in the dataset with the cohort shifting, the growth of the new-born cohort is discussed without the cohort shifting. Figure 6a,b show growth from 2010 to 2015 and that from 2015 to 2020, respectively. According to Figure 6a, Tottori, Tokushima, Kagawa, Kumamoto, and Miyazaki enjoyed a drastic increase in the new-born cohort, and all the urban areas also gained in the new-born cohort in 2015. Some of the local prefectures, such as Aomori, Gunma, and Shimane prefectures, decreased in the new-born cohort from 2010 to 2015. From 2015 to 2020, almost all the prefectures gained in the new-born cohort, and only Yamagata, Nagano, Yamanashi, and Kochi suffered from a decrease. It is remarkable that the geographical distribution of the growth from 2015 to 2020 is completely different from that from 2010 to 2015.
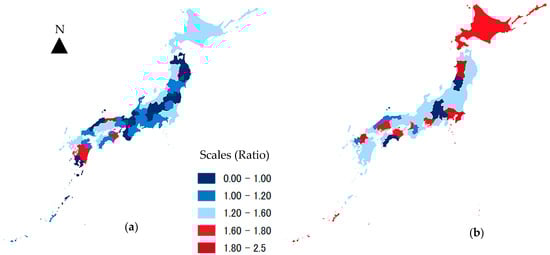
Figure 6.
Foreign Resident Newly-Born Cohort (0–4) Ratio (a) 2015/2010 (b) 2020/2015.
4.2. Pattern Extraction with NMF and Its Spatial Distribution
In NMF estimation, a previous study [37] suggested the number of patterns; k should be chosen to observe the plot between NMF model fit (Frobenius distance between the data and NMF model) against k. The “elbow” of the graph is k, such that it is an inflection point in the graph regarding k and the NMF model fit. The NMF model in this study was repeatedly estimated in k from 1 to 12. From Figure 7a,b, the Frobenius distance constantly decreases starting from k = 3, hence the “elbow” point can be determined to be k = 3. However, for simplest interpretability, k in this study is determined by also referring to the similarity in both genders of corresponding cohorts. According to our observation, the patterns with k = 3 are too complex, abstract, and unique for each gender cohort, making it difficult to interpret in terms of a trend-oriented discussion. Considering the purpose of statistical analysis in this study, the “elbow” criteria should be discarded, and the criteria for the similarity between the corresponding male and female cohorts should be referred to. We checked all the patterns starting from k = 4 to 12 in both models, and we selected the patterns with k = 8, which almost satisfy the similarity criteria for both models, with some exceptions. Therefore, the patterns in k = 8 are adopted for the output of the NMF model and then aggregated based on the four different age groups (children, younger age, middle age, and elderly) which we specified in the data sources section.
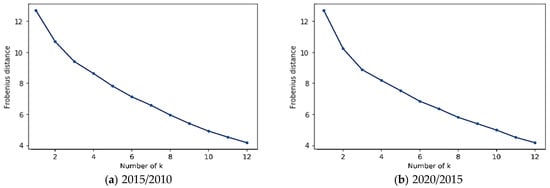
Figure 7.
Numbers of k by Frobenius Distance Graph.
Figure 8 and Figure 9 show the plot of the pattern matrix H of male and female cohort growth with k = 8. In Figure 8, Patterns 1 to 8 represent the characteristics of cohort transition from 2010 to 2015. Pattern 1 shows the characteristics of the 20–24 male and female cohorts; Pattern 2 shows the 15–19 female cohort characteristics; Pattern 3 shows the average cohort characteristics; and Pattern 4 represents the 25–29 female cohort characteristics. Pattern 5 shows the 55–59 male and female cohorts; Pattern 6 is about the 10–14 female cohort characteristics; Pattern 7 shows the 45–49 female cohort; and Pattern 8 represents the 50-and-over female cohort characteristics. From Figure 8, we can note that the patterns are common between males and females in Patterns 1, 3, 5 and 8, while in Patterns 2, 4, 6, and 7, it appears that the female cohorts’ characteristics appear stronger than the male cohorts’. In Figure 9, Patterns 1 to 8 represent the characteristics of cohort transition from 2015 to 2020. Pattern 1 shows the average cohort characteristics; Pattern 2 shows the 5–9 male and female cohort characteristics; Pattern 3 represents the stronger appearance of the working-age male cohorts between 25 and 54, except for the 45–49 cohort and the 60–64 female cohort characteristics; and Pattern 4 shows the elderly cohort characteristics. Pattern 5 shows the 25–29 male and female cohort characteristics; Pattern 6 shows the 55-and-over male and female cohort characteristics; Pattern 7 represents the 25-to-34 male cohorts characteristics along with the appearance of the 45–49 female cohort characteristic; and Pattern 8 shows a type of parent-child household, highlighting the 5–9 and 35–54 for both male and female cohorts characteristics. According to Figure 9, common patterns in male and female cohorts are observed in Patterns 1,2, 4, 6, and 8. Patterns 3 and 7 show a stronger appearance for male working-age cohorts than for female, except in Pattern 5. Figure 10 and Figure 11 show the shares of each pattern obtained from weight matrix W. On a couple of figures, we can observe the dominant patterns are differently distributed among the regions defined in Figure 2.
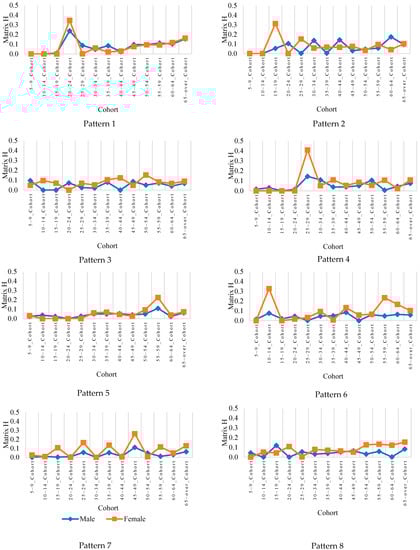
Figure 8.
Coefficient Matrix H for Foreign Resident Cohort Transitions from 2010 to 2015.
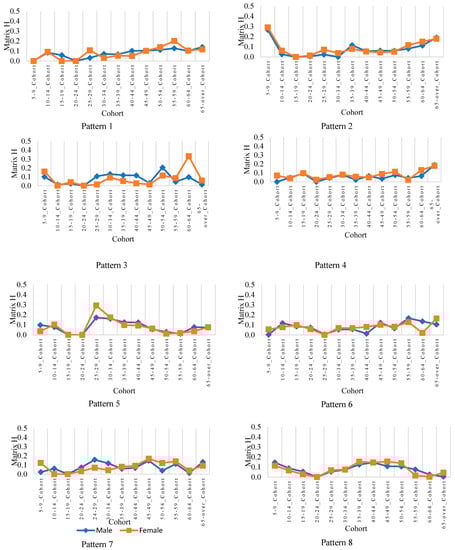
Figure 9.
Coefficient Matrix H for Foreign Resident Cohort Transitions from 2015 to 2020.
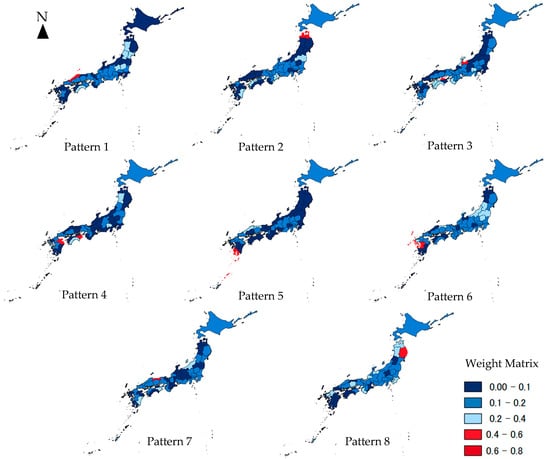
Figure 10.
Weight Matrix W for Foreign Resident Cohort Transitions from 2010 to 2015.
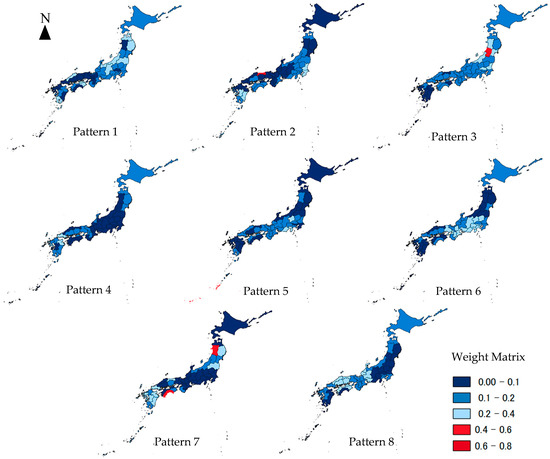
Figure 11.
Weight Matrix W for Foreign Resident Cohort Transitions from 2015 to 2020.
Table 2 is a recap of all the outputs of the above analysis. The third and fourth columns are the population transition of foreign residents in total and in the new-born cohort, respectively. The fifth column shows the change in foreign population share between the period from 2010 to 2015 and that from 2015 to 2020. In these three columns, the prefectures show the mark for top and bottom 10 prefectures. From the third to fifth columns, there are common tendencies among the three attributes: Hokkaido, Tohoku, Kyushu region, and Okinawa have lower growth rates in total population. Hokuriku, Kansai region, Chugoku region, and Shikoku region have middle to lower growth rates, while Kanto and Tokai regions located in central Japan have the highest growth rates from 2010 to 2020. The sixth and the seventh columns are the summary of patterns obtained with NMF analysis. In order to clarify the bias of each pattern from the viewpoint of regions, the pattern’s shares in each prefecture were calculated, and then the shares of each pattern were ranked to pick up the prefectures with higher shares. In Figure 10 and the sixth column of Table 2, we focus on the five representative patterns that have characteristics in children (Patterns 2 and 6, female), young (Patterns 1 and 4, female), and the middle and elder cohorts (Pattern 8, female). In terms of children cohorts of Pattern 2 (15–19 female) and Pattern 6 (10–14 female), the differences in the spatial distribution are seen between the urbanized areas (prefectures with the capital of each region) and the others. In Pattern 1 (20–24 cohorts), Akita, Yamagata, Tochigi, Wakayama, and Shimane have the highest shares. In terms of Pattern 4 (25–29 female), Akita, Yamanashi, and Nagasaki have the highest shares. For Pattern 8 (50 over female), Aomori, Iwate, Akita, Toyama, and Wakayama, which are mainly distributed in Eastern Japan and occupied with local prefectures, have the highest shares. The general trend of pattern distributions from 2010 to 2015 is that all the local capitals do not have distinct growth of foreign cohorts; however, some of local prefectures face an increase in foreign cohorts.
Table 2.
Summary of Foreign Resident Transition Characteristics. (Rank symbols: Top 10 = ▲, Middle 27 = ▬, Lowest 10 = ▼).
In Figure 11 and the seventh column of Table 2, we focus on the five representative patterns that have characteristics in children (Pattern 2), young (Pattern 5) and elder cohorts (Pattern 4) and composite Patterns 3 (20–44 male, 50–54 male and 60–64 female) and 8 (5–9 and 35–54). In terms of the young cohort of Pattern 2 (5–9), Chiba, Tottori, Kumamoto, Miyazaki, and Okinawa have the highest shares. Note that such growth of a young cohort was not seen from 2010 to 2015. In terms of the children cohort of Pattern 2 (5–9), Chiba, Tottori, Kumamoto, Miyazaki, and Okinawa have the highest shares. Note that the growth of such a lower end of a cohort was not seen from 2010 to 2015. In terms of Pattern 5 (25–29), Aomori, Yamaguchi, Fukuoka, Nagasaki and Oita have the highest shares. In Pattern 4 (65 over), Tochigi, Gunma, Shizuoka Kagawa, and Okinawa have the highest shares. Patterns 3 and 8 have multiple peaks in cohort contributions. Since the cohort in Patterns 5–9 cannot determine the residential location themselves, the increase in both them and the middle-age (25–49) cohort may indicate an increase in parent-child households. In terms of Pattern 3, Miyagi, Akita, Yamagata, Ibaragi, and Niigata, which are located in Eastern Japan have the highest shares. In Pattern 8, Fukui, Shimane, Hiroshima, Tokushima, and Ehime, which are located in Western Japan, have the highest shares.
4.3. Discussion about the Supporting Policies for Foreign Residents
Due to the change in policy on foreign labor-force acceptance in Japan, the trend of foreign migration from 2010 to 2020 was structurally changed. Table 3 describes the total numbers of foreign residents and the immigration policies’ implementation between 2010 to 2020, referring the report, Major Policies Related to Immigration Control Administration, by MOJ [38]. According to Table 3, the total number of foreign residents significantly increased after the introduction of the new residency management system in 2012. Comparing the trend from 2010 to 2015 with that from 2015 to 2020, the number of foreign migrants were still concentrated in the Kanto and Chubu regions. This was the result of the acceptance of foreign residents in entrepreneurship and housekeeping services starting from 2015 in national strategic special zones such as the Tokyo Area National Strategic Special Zone and the Aichi Prefecture National Strategic Special Zone. However, the trend of transition of foreign migrants for each cohort was significantly different, especially between the Tohoku and Kyusyu regions. From 2010 to 2015, the increase in workforce cohorts was mainly observed in Tohoku region, Shimane in Chugoku region, and some prefectures in Shikoku and in Kyusyu regions. According to the reports of the regional governments, agriculture, forestry, and fisheries are the primary industries in the Tohoku region [39]; transport equipment and shipbuilding are the primary industries in the Chugoku region [40]; and semiconductor, automobile, forestry, and fisheries are the primary industries in the Kyushu region [41]. Therefore, the cohort transition in these regions is the result of the implementation of policies that allow for the acceptance of foreign construction workers and shipbuilding workers starting from 2015, and the accepting of foreigners conducting agricultural work in 2017. Note that the increase in workforce cohorts was continued in those regions, but the increase in young cohorts (below 20) was accompanied with them from 2015 to 2020. Foreign migrants with infants or children have surely increased in the above regions. Such younger parents of those households would have a linguistic problem due to their rather short living period in Japan. Not only childcare, for example, but also linguistic support (translation and multi-linguistic documentation) is necessary in the above regions. Note that in Kyusyu region, the increase in the young cohort was continuously occurring, which also requires schooling support in that region. In terms of elder cohorts, their period of living in Japan would be longer than the working cohorts’, so then the linguistic problem would be minor. However, the transition of elder cohort from 2015 to 2020 was high in Tohoku region, where foreign residents are minor. This might be probably a result of the retirement of foreign residents, which we cannot observe in the actual dataset. Therefore, community acceptance and the creation of social bonds will be the matter in such a region. Through the above analysis, additions to the known problems of the supporting policies for foreign residents have been clarified for the regions where relatively large numbers of foreign people live, such as Kanto or Chubu, and the regions such as Tohoku and Kyusyu, where the foreign residents are still minor. The local government in those regions should care much for them in order to keep acceptance stable not only for the foreign workforce, but also for long term residents in Japan.
Table 3.
Number of Foreign Residents and Immigration Policy Implementation between 2010 and 2020.
5. Conclusions
In order to analyze the transition of foreign residents’ characteristics with pattern analysis of NMF, this study uses the cohort structure dataset on the registered foreign population in Japanese prefectures in the 2010, 2015 and 2020 census of Japan by the Statistics Bureau of MIAC. According to the actual dataset of foreign residents, the numbers of foreign migrants were concentrated in central Japan from 2010 to 2020, where the industrial workforce accumulates. However, the transition of foreign migrants for each cohort resulting from our pattern analysis with NMF was significantly different, especially between Tohoku and Kyusyu regions, where the foreign residents are still few in number. The increase in workforce cohorts was continued from 2010 to 2020 and accompanied with the increase in children cohorts (below 20) from 2015 to 2020 in those regions. From this observation, we can insist that these regions were accepting the next generation and the foreign workforce to compensate for the depopulation and the labor shortage. Our pattern analysis with NMF highlights the needs of policies such as linguistic support for foreign migrants, schooling support for the next generation, and community acceptance and the creation of social bonds for the elderly in order to keep stable the acceptance of foreign residents in the regions where the foreign residents are still few in number. Since the regions highlighted in this analysis include many depopulated areas, and the capacity of those local government for policy building would not be enough, they should be supported well by the national government.
This study is limited in the following ways. First, this study focused on prefecture data due to data availability. In future research, it is suggested to use the municipality as the target of analysis. The next limitation is related to the pattern extraction. The number of patterns we selected for this study was limited to eight patterns for simplicity. Larger numbers of patterns should be identified when the analysis is conducted at the municipal level. Furthermore, if the transition of cohort characteristics in foreign residents is linked to the industrial characteristics of each region, it can make for in-depth policy making.
Author Contributions
S.O. and M.T. contributed to the study conception and design. Material preparation, data collection, and analysis were performed by S.O. The first draft of the manuscript was also written by S.O. S.O. and M.T. commented on previous versions of the manuscript. All authors have read and agreed to the published version of the manuscript.
Funding
This research received no external funding.
Institutional Review Board Statement
Not applicable.
Informed Consent Statement
Not applicable.
Data Availability Statement
The data that support the findings of this study are available from the official statistic website-Statistics Bureau of Japan. (https://www.stat.go.jp/english/index.html, accessed on 1 May 2022).
Conflicts of Interest
The authors declare no conflict of interest.
References
- Sato, M. From Foreign Workers to Minority Residents: Diversification of International Migration in Japan. Ritsumeikan Annu. Rev. Int. Stud. 2004, 3, 19–34. [Google Scholar]
- Statistics Bureau, Ministry of Internal Affairs and Communications(MIAC). Portal Site of Official Statistics of Japan Website. Available online: https://www.e-stat.go.jp/ (accessed on 1 January 2020).
- Toshihiro, M. COVID-19 and the Crisis in Japanese Immigration Policy. Available online: https://www.nippon.com/en/in-depth/d00572/ (accessed on 20 March 2022).
- Ministry of Justice. Investigation into cases of disappearance: Outline of the Results of the Project Team’s Investigation and Review into Operation of the Technical Training System. Available online: https://www.moj.go.jp/isa/content/930004344.pdf (accessed on 20 March 2022).
- Specified Skilled Worker Systems (Initiatives to Accept Foreign Nationals and for the Realization of Society of Harmonious Coexistence). Immigration Services Agency of Japan. Available online: https://www.moj.go.jp/isa/content/001335263.pdf (accessed on 15 May 2022).
- Saito, J. Historical Background of the Japanese Restrictive Immigration Policy. Japanese Economy Update, Japan Center for Economic Research, 15 August 2022. Available online: https://www.jcer.or.jp/english/historical-background-of-the-japanese-restrictive-immigration-policy (accessed on 20 March 2022).
- Oo, S.; Tsukai, M. Long-Term Impact of Interregional Migrants on Population Prediction. Sustainability 2022, 14, 6580. [Google Scholar] [CrossRef]
- Sekiguchi, T.; Hayashi, N.; Sugino, H.; Terada, Y. The Effects of Differences in Individual Characteristics and Regional Living Environments on the Motivation to Immigrate to Hometowns: A Decision Tree Analysis. Appl. Sci. 2019, 9, 2748. [Google Scholar] [CrossRef]
- Analytical Report of the Foreign Residents Survey—Revised Edition; Center for Human Rights Education and Training: Tokyo, Japan, 2017.
- Annual Report on the Labor Force Survey; Statistic Bureau of Japan: Tokyo, Japan, 2020.
- Yoshida, M. Women, Citizenship, and Migration: The Resettlement of Vietnamese Refugees in Australia and Japan; Nakanishiya Shuppan: Kyoto, Japan, 2011. [Google Scholar]
- Ishikawa, Y. (Ed.) International Migrants in Japan: Contributions Inan Era of Population Decline; Trans Pacific Press: Tokyo, Japan, 2015. [Google Scholar]
- Matsutani, A. How Do They Live? Nihon Keizai Shinbun Shuppansha: Tokyo, Japan, 2007. [Google Scholar]
- Ono, G. Accepting Foreign Workers Spoils Japan; Yosensha: Tokyo, Japan, 2008. [Google Scholar]
- Menju, T. Dramatic Decrease of Population: Japan Needs Immigrants; Shinchosha: Tokyo, Japan, 2011. [Google Scholar]
- Kitawaki, Y. (Ed.) Design of “Open Japan”: Acceptance of Migrants and Social Integration of Them into Japanese Society; Koko Shuppan: Tokyo, Japan, 2011. [Google Scholar]
- Sakanaka, H. Population Collapse and Immigration Revolution: Immigrants State Declaration; Nihon Kajo Shuppan: Tokyo, Japan, 2012. [Google Scholar]
- Mitsuhashi, T. Immigration Is Ruinous to Japan: A Country for the Japanese Will Disappear! Tokuma Shoten: Tokyo, Japan, 2014. [Google Scholar]
- Hugo, G.; Morén-Alegret, R. International migration to non-metropolitan areas of high income countries: Editorial introduction. Popul. Space Place 2008, 14, 473–477. [Google Scholar] [CrossRef]
- Wulff, M.; Carter, T.; Vineberg, R.; Ward, S. Attracting New Arrivals to Smaller Cities and Rural Communities: Findings from Australia, Canada and New Zealand. J. Int. Migr. Integr. 2008, 9, 119–124. [Google Scholar] [CrossRef]
- Stillwell, J.; Hussain, S. Ethnic internal migration in England and Wales: Spatial analysis using a district classification framework. In Ethnicity and Integration: Understanding Population Trends and Processes; Springer: London, UK, 2010; Volume 3, pp. 105–132. [Google Scholar]
- Collantes, F.; Pinilla, V.; Sáez, L.A.; Silvestre, J. Reducing Depopulation in Rural Spain: The Impact of Immigration. Popul. Space Place 2014, 20, 606–621. [Google Scholar] [CrossRef]
- Sassen, K. Notes on the Incorporation of Third World Women into Wage-Labor Through Immigration and Off-Shore Production. Int. Migr. Rev. 1984, 18, 1144–1167. [Google Scholar] [CrossRef]
- Frey, C.B. New job creation in the UK: Which regions will benefit most from the digital revolution. In PwC UK Economic Outlook; PwC UK: St Albans, UK, 2015. [Google Scholar]
- Keyes, K.M.; Li, G. Age–Period–Cohort Modeling. In Injury Research; Li, G., Baker, S., Eds.; Springer: Boston, MA, USA, 2012. [Google Scholar] [CrossRef]
- Dowell, M.; Lee, H.; Simmons, P. Cohort Transitions and Age Group Analysis of Millennial Homeownership Demand: Understanding Trajectories of Recovery Following the Great Recession. Fannie Mae Working Paper, 2018. Available online: https://www.fanniemae.com/media/19341/display (accessed on 20 March 2022).
- Eren, F. Does the Asian property market work for sustainable urban developments. In Sustainable Cities in Asia; Caprotti, F., Yu, L., Eds.; Routledge: London, UK, 2018; pp. 32–47. [Google Scholar] [CrossRef]
- Suykens, J.A.K.; Signoretto, M.; Argyriou, A. (Eds.) Regularization, Optimization, Kernels, and Support Vector Machines, 1st ed.; Chapman and Hall/CRC: Boca Raton, FL, USA, 2014. [Google Scholar] [CrossRef]
- Hamamoto, R.; Takasawa, K.; Machino, H.; Kobayashi, K.; Takahashi, S.; Bolatkan, A.; Shinkai, N.; Sakai, A.; Aoyama, R.; Yamada, M.; et al. Application of non-negative matrix factorization in oncology: One approach for establishing precision medicine. Brief. Bioinform. 2022, 23, bbac246. [Google Scholar] [CrossRef] [PubMed]
- Alghamdi, N.S.; Taher, F.; Kandil, H.; Sharafeldeen, A.; Elnakib, A.; Soliman, A.; ElNakieb, Y.; Mahmoud, A.; Ghazal, M.; El-Baz, A. Segmentation of Infant Brain Using Nonnegative Matrix Factorization. Appl. Sci. 2022, 12, 5377. [Google Scholar] [CrossRef]
- Devarajan, K. Nonnegative Matrix Factorization: An Analytical and Interpretive Tool in Computational Biology. PLoS Comput. Biol. 2008, 4, e1000029. [Google Scholar] [CrossRef] [PubMed]
- Huffman, M.; Davis, A.; Park, J.; Curry, J. Identifying Population Movements with Non-Negative Matrix Factorization from Wi-Fi User Counts in Smart and Connected Cities. arXiv 2021, arXiv:2111.10459. [Google Scholar]
- Yang, H.; Seoighe, C. Impact of the Choice of Normalization Method on Molecular Cancer Class Discovery Using Nonnegative Matrix Factorization. PLoS ONE 2016, 11, e0164880. [Google Scholar] [CrossRef] [PubMed]
- Paatero, P.; Tapper, U. Positive matrix factorization: A non-negative factor model with optimal utilization of error estimates of data values. Environmetrics 1994, 5, 111–126. [Google Scholar] [CrossRef]
- Lee, D.D.; Seung, H.S. Learning the parts of objects by non-negative matrix factorization. Nature 1999, 401, 788–791. [Google Scholar] [CrossRef] [PubMed]
- Do, C.X.; Tsukai, M.; Fujiwara, A. Data quality analysis of interregional travel demand: Extracting travel patterns using matrix decomposition. Asian Transp. Stud. 2020, 6, 100018. [Google Scholar] [CrossRef]
- Brunet, J.-P.; Tamayo, P.; Golub, T.R.; Mesirov, J.P. Metagenes and molecular pattern discovery using matrix factorization. Proc. Natl. Acad. Sci. USA 2004, 101, 4164–4169. [Google Scholar] [CrossRef] [PubMed]
- Ministry of Justice. Report of Major Policies Related to Immigration Control Administration (Part 2). Available online: https://www.moj.go.jp/isa/content/930003771.pdf (accessed on 25 January 2023).
- Tohoku Bureau of Economy, Trade, and Industry. Economic Overview Of Tohoku Region. Available online: https://www.tohoku.meti.go.jp/s_kokusai/pdf/en2021.pdf (accessed on 25 January 2023).
- Chugoku Bureau of Economy, Trade, and Industry. The Outline of Chugoku Region in Japan. Available online: https://www.chugoku.meti.go.jp/policy/seisaku/glocal_pt/pdf/TheOutlineOfChugokuRegionInJapan_English.pdf (accessed on 25 January 2023).
- Kyushu Bureau of Economy, Trade, and Industry. Business and Investment Environment in Kyushu. Available online: https://www.kyushu.meti.go.jp/seisaku/kokusai/toushi/data/biz_env_en.pdf (accessed on 25 January 2023).


Disclaimer/Publisher’s Note: The statements, opinions and data contained in all publications are solely those of the individual author(s) and contributor(s) and not of MDPI and/or the editor(s). MDPI and/or the editor(s) disclaim responsibility for any injury to people or property resulting from any ideas, methods, instructions or products referred to in the content. |
© 2023 by the authors. Licensee MDPI, Basel, Switzerland. This article is an open access article distributed under the terms and conditions of the Creative Commons Attribution (CC BY) license (https://creativecommons.org/licenses/by/4.0/).