Article

Investigation of Compressive Strength Characteristics of Hardfill Material and Seismic Stability of Hardfill Dams

1
K-Water Ulsan Local Office, Korea Water Resources Corporation, Ulsan 44662, Republic of Korea
2
New Town Project Group, Incheon Housing and City Development Corporation, Incheon 21591, Republic of Korea
3
Department of Civil and Environmental Engineering, Dongguk University, Seoul 04620, Republic of Korea
*
Author to whom correspondence should be addressed.
Appl. Sci. 2023, 13(4), 2492; https://doi.org/10.3390/app13042492
Submission received: 23 January 2023 / Revised: 6 February 2023 / Accepted: 13 February 2023 / Published: 15 February 2023

Abstract

:
A hardfill dam can reduce the natural damage caused by the development of quarries and recycle submerged resources. However, the particle size distribution of the aggregate can result in large variations in the mix design, resulting in a wide range of strengths in the hardfill dam body. Therefore, quality control during construction is crucial, and the stability of the dam body after construction should be thoroughly examined in advance. This study investigated the strength characteristics of hardfill dam materials according to the particle size and mixing ratio through indoor uniaxial compressive strength tests using large specimens and uniaxial compressive strength tests for field compaction and collected cores. Furthermore, the stability of hardfill dams with three types of slopes during earthquakes was evaluated through a finite element analysis. The distributions of stress in the hardfill dam body and the strength required to stabilize the dam body were investigated. Except for a 1:0.6 inclined hardfill dam body to which artificial seismic waves were applied, the overall strength range calculated from the indoor specimens and field compaction cores exceeded the required hardfill strength, thereby ensuring stability in the event of an earthquake.

1. Introduction

Despite numerous technological advancements in the field of dams, the demands for further cost reductions and eco-friendly technology developments persist. A hardfill dam is a relatively new type of dam developed in response to such demands. A hardfill dam is constructed by evenly spreading and roller compacting a material that is continuously mixed with water and a small amount of cement (hardfill) in a simple, temporary facility. The construction process uses materials (such as bed gravel and soil) readily available near the dam construction site with minimal processing. The hardfill dams that broaden the choices of material sources for dam construction are advantageous from both economic and environmental perspectives because they can reduce the damage to nature caused by the development of quarries while recycling submerged resources [1,2,3,4].
Hardfill dams are often compared with roller-compacted concrete (RCC) dams constructed by the roller compaction of concrete, such as rockfill dams. RCC dams allow for faster construction relative to block-type concrete gravity dams; for example, the latter have drawbacks concerning the various processes required for controlling the hydration heat caused by pouring block-shaped mass concrete, resulting in an increased construction time (decreased construction speed) [5,6]. In other words, hardfill and RCC dams are similar in that the main material sources are aggregates, water, and cement, and the construction speeds are faster than those of concrete dams owing to the roller compaction [7,8]. However, hardfill dams have further advantages relative to RCCs. In particular, an RCC dam follows a mixing design method for concrete during manufacturing. Thus, the range of material sources (and, correspondingly, the particle size distribution of the aggregates, cement content, and unit water content) is regulated according to the design goal. Accordingly, complex mechanical equipment is often required during manufacturing. In contrast, a hardfill dam uses the on-site aggregate at the planned dam construction site as-is without requiring any additional treatment other than the removal of particles exceeding the maximum particle size (80 mm in general). Therefore, the dams can be manufactured with simpler equipment after determining the cement content and unit water content according to the characteristics of the aggregate, thereby simplifying the construction. Furthermore, in terms of structural stability, hardfill dams with a trapezoidal cross-section have a larger dam body volume than RCC dams with a right-triangle cross-section but nevertheless provide high stability against overturning and sliding [3,9]. Despite the above advantages, however, since hardfill dams use almost the same riverbed materials as the construction materials, the range of variations in the mix design can be large according to the particle size distribution (PSD) of the aggregate; correspondingly, the range of changes in the strength of the hardfill dam body can also be large [9,10]. This makes it difficult to manage the quality of the material(s). Therefore, in terms of the stability of the dam body and quality control, the differences in behavior according to the characteristics of the materials should be thoroughly examined during the design phase.
Many construction cases of hardfill dams have been reported from several countries since the first development of a hardfill dam in the early 1990s [11,12,13,14,15,16]. Moreover, meanwhile, a number of studies have been made on the mechanical properties of hardfill material and the stability of hardfill dams through experimental or numerical investigations by many researchers [15,16,17,18,19,20,21,22,23,24,25,26,27,28]. However, it is difficult to find studies investigating the strength characteristics of hardfill materials in different aggregate PSDs and mixing ratios and the resulting stability of hardfill dams by applying the same hardfill materials through indoor tests, field test construction, and numerical analyses at a time.
In this study, the maximum (coarse) and the minimum (fine) PSDs of aggregates with a maximum particle size of 80 mm, considered to be a suitable aggregate PSD range for the construction of hardfill dams [11], were selected for analysis. The analysis was based on the results of PSD investigations of the riverbed aggregates for each major river system in South Korea presently without hardfill dam construction. After fabricating large hardfill specimens by mixing the aggregate, cement, and water, the strength characteristics of the hardfill were investigated through laboratory uniaxial compressive strength tests. In addition, test constructions were conducted on-site by applying the same mixing ratios and aggregates as those for hardfill samples in the laboratory tests. Then, the hardfill’s constructability was not only investigated using the on-site compaction equipment, but also the strength range was obtained from uniaxial compressive strength tests on the cores collected from the test fills. Subsequently, by applying the properties of the hardfill obtained from the laboratory test results, a finite element analysis was performed for hardfill dams with three different cross-sectional slopes (i.e., 1:0.6, 1:0.8, and 1:1) and a height of 50 m, subjected to earthquake. The seismic stability of the hardfill dams was evaluated according to the changes in the strengths and cross-sections (slopes) of the hardfill dams.

2. Materials and Methods
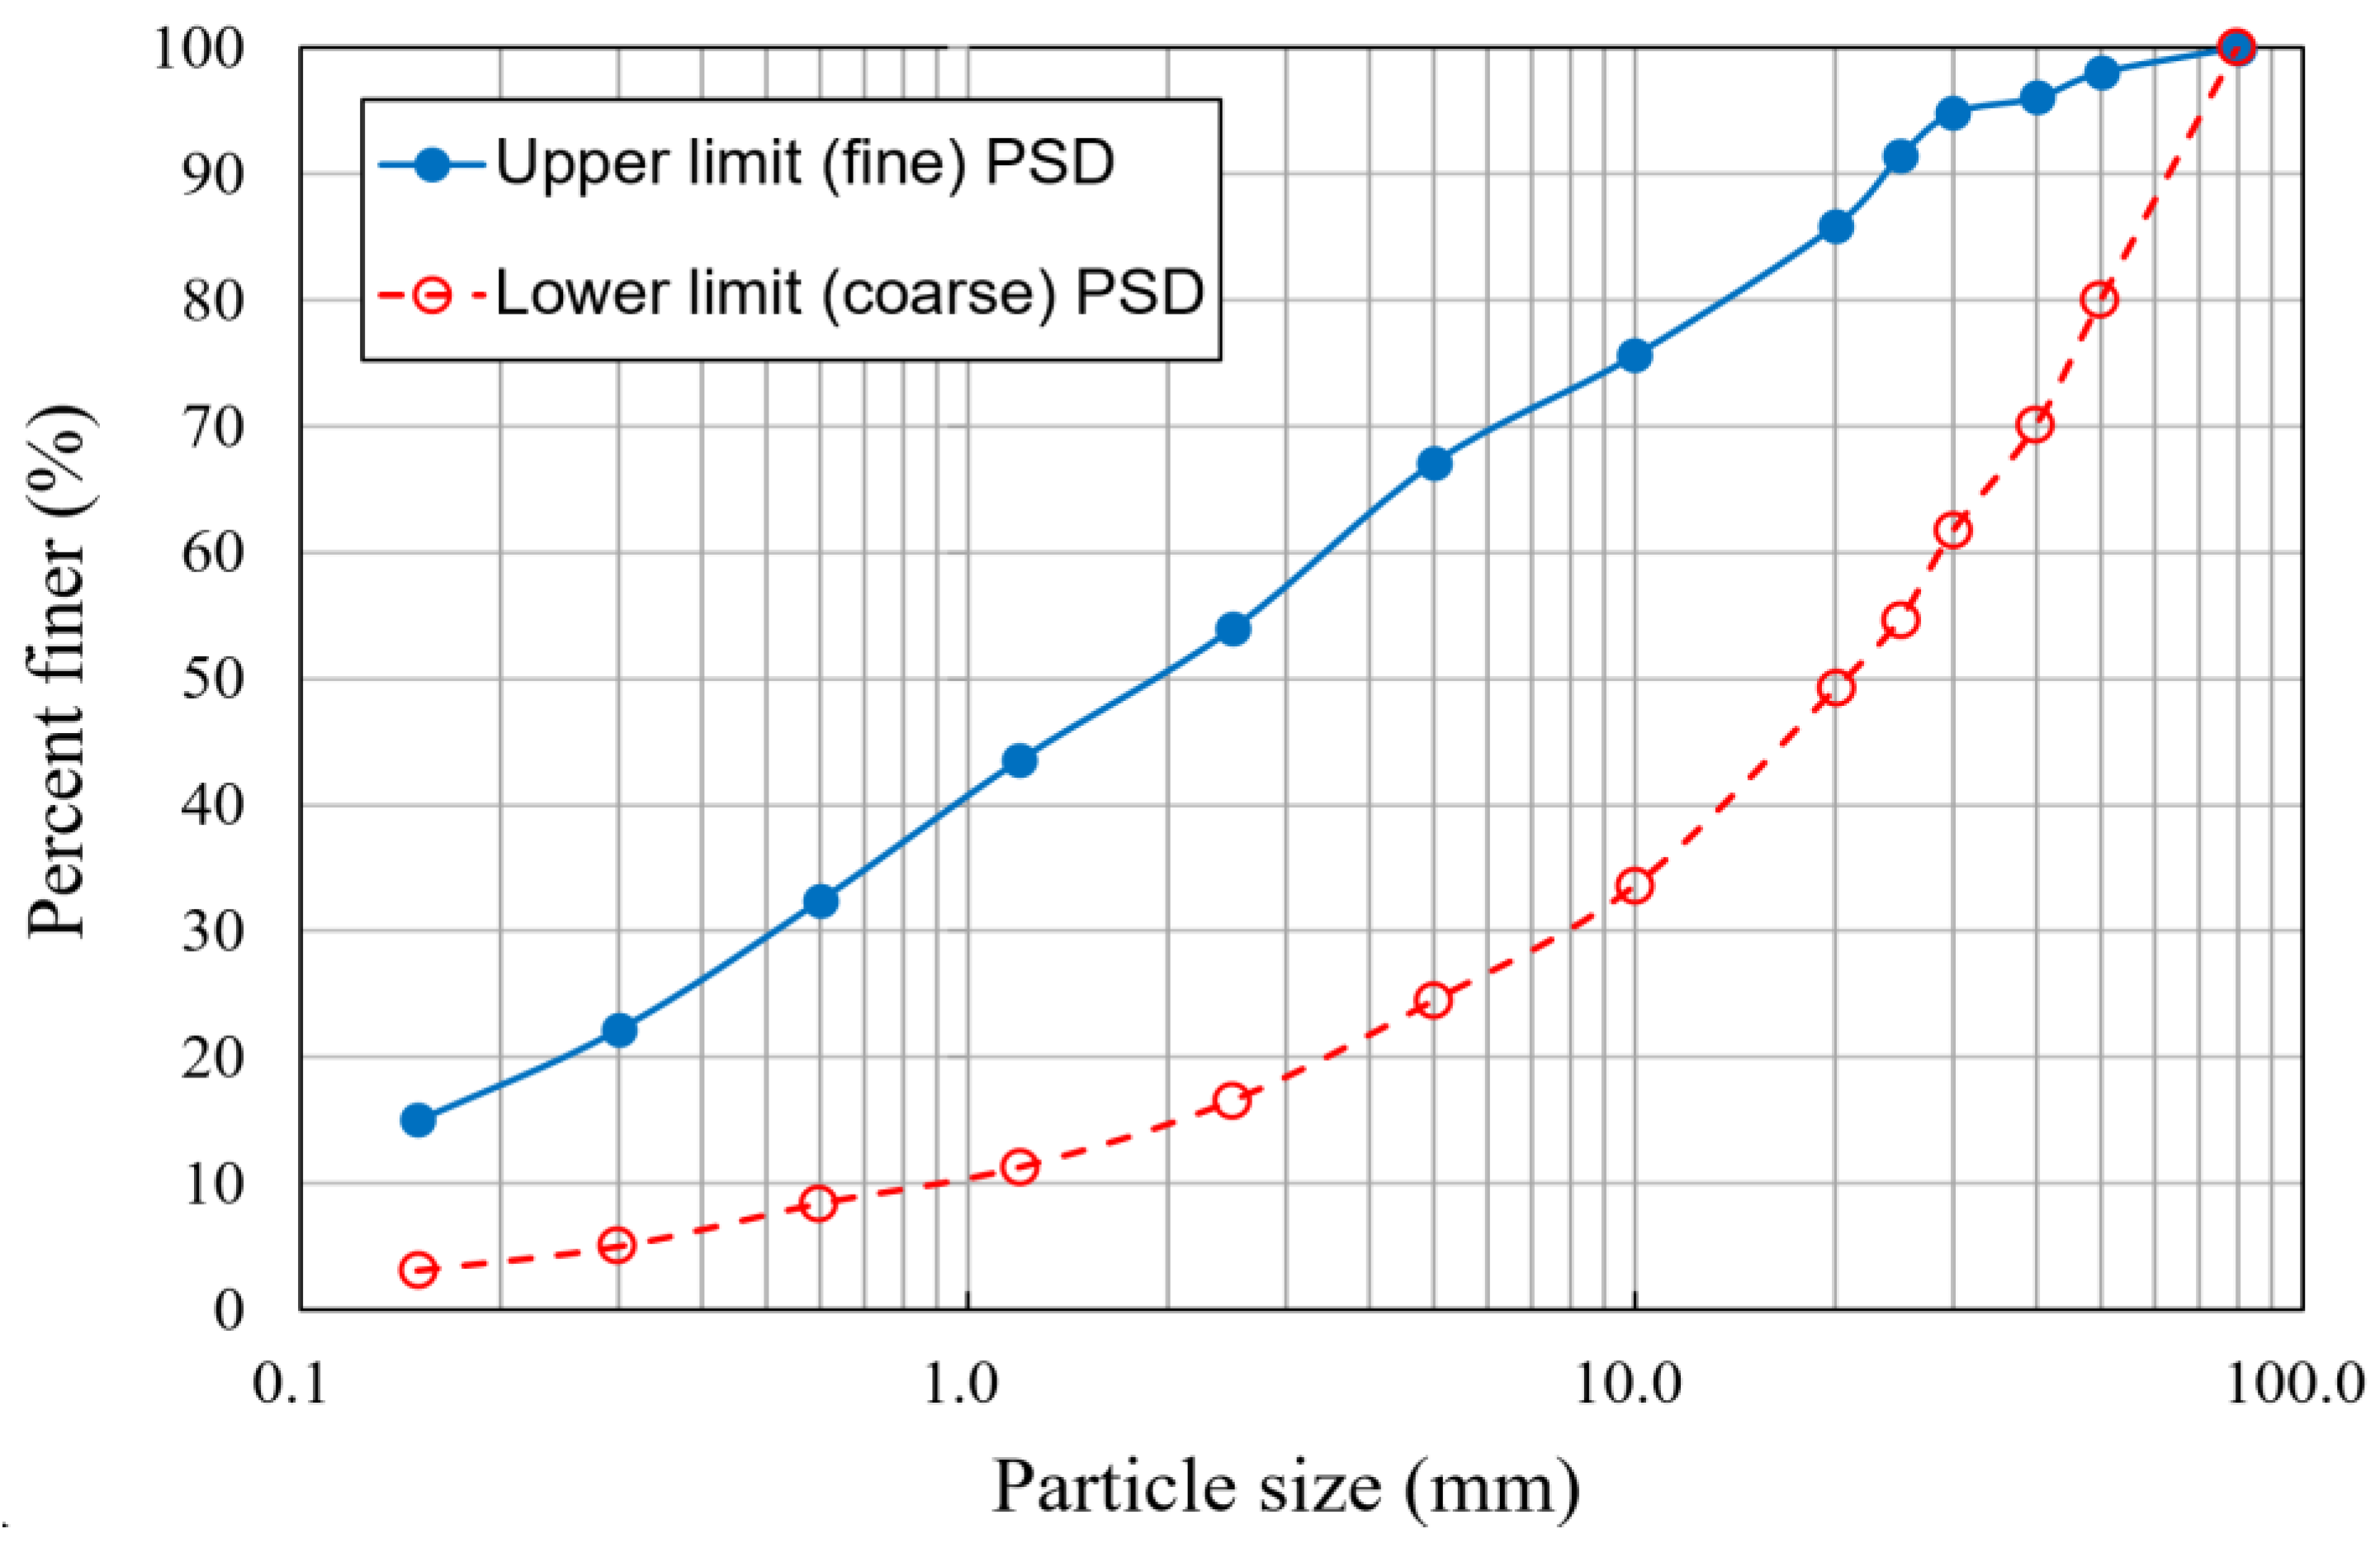
2.1. Materials

As stated in the introduction, the aggregates of a hardfill are typically unclassified, and their particle size is not adjusted (except for eliminating oversized particles and conducting crushing for effective utilization). Therefore, the differences in the PSDs of aggregate may be significant even in the same aggregate collection area, making it difficult to maintain a consistent unit water content. A hardfill dam’s strength naturally changes owing to the use of materials with variable particle size distributions and unit water content, even if the amount of cement remains constant. Accordingly, when designing a hardfill dam, the hardfill’s target strength is typically set after investigating the range of the hardfill strength according to changes in the aggregate PSD, unit cement content, and unit water content.
This study excluded aggregates with a maximum particle size exceeding 80 mm, as these generally have low applicability as hardfill aggregates, based on previous studies [18,19]. Two types of PSDs, i.e., maximum PSD (coarse aggregates) and minimum PSD (fine aggregates), were selected based on previous investigations of the aggregate PSD range in major river basins in South Korea [11]. The aggregates used in the experiment were collected from a spoil pit within the Danyang Submerged Weir construction site and a nearby river basin in Danyang-gun, Chungcheongbuk-do, South Korea. They were based on quartzose sandstone and generally well-graded. The shape of the aggregate particles was generally sub-rounded to rounded. An oversize cut was performed by applying the maximum aggregate size of 80 mm using a backhoe and aggregate separator. Then, the screened aggregates were transferred indoors. Figure 1 shows the PSDs of the two types of aggregates used in the laboratory test of this study. The same materials were applied in the laboratory and field tests as described in Section 2.3.
Prior to this study, standard specimens were fabricated using aggregates with a maximum particle diameter of 40 mm and particle size similar to that of the PSD collected from the same place shown in Figure 1, but with different quantities of cement. Then, compaction and uniaxial compressive strength tests were performed with the standard specimens [29,30,31]. Based on the results, a unit of cement content of 80 kg/m3 and three units of water content of 70, 85, and 100 kg/m3 were selected as the range of appropriate mixing ratios for the laboratory test investigation with large specimens using aggregates with a maximum particle diameter of 80 mm. Ordinary Portland cement (Type I) was used for the hardfill mix (Table 1).

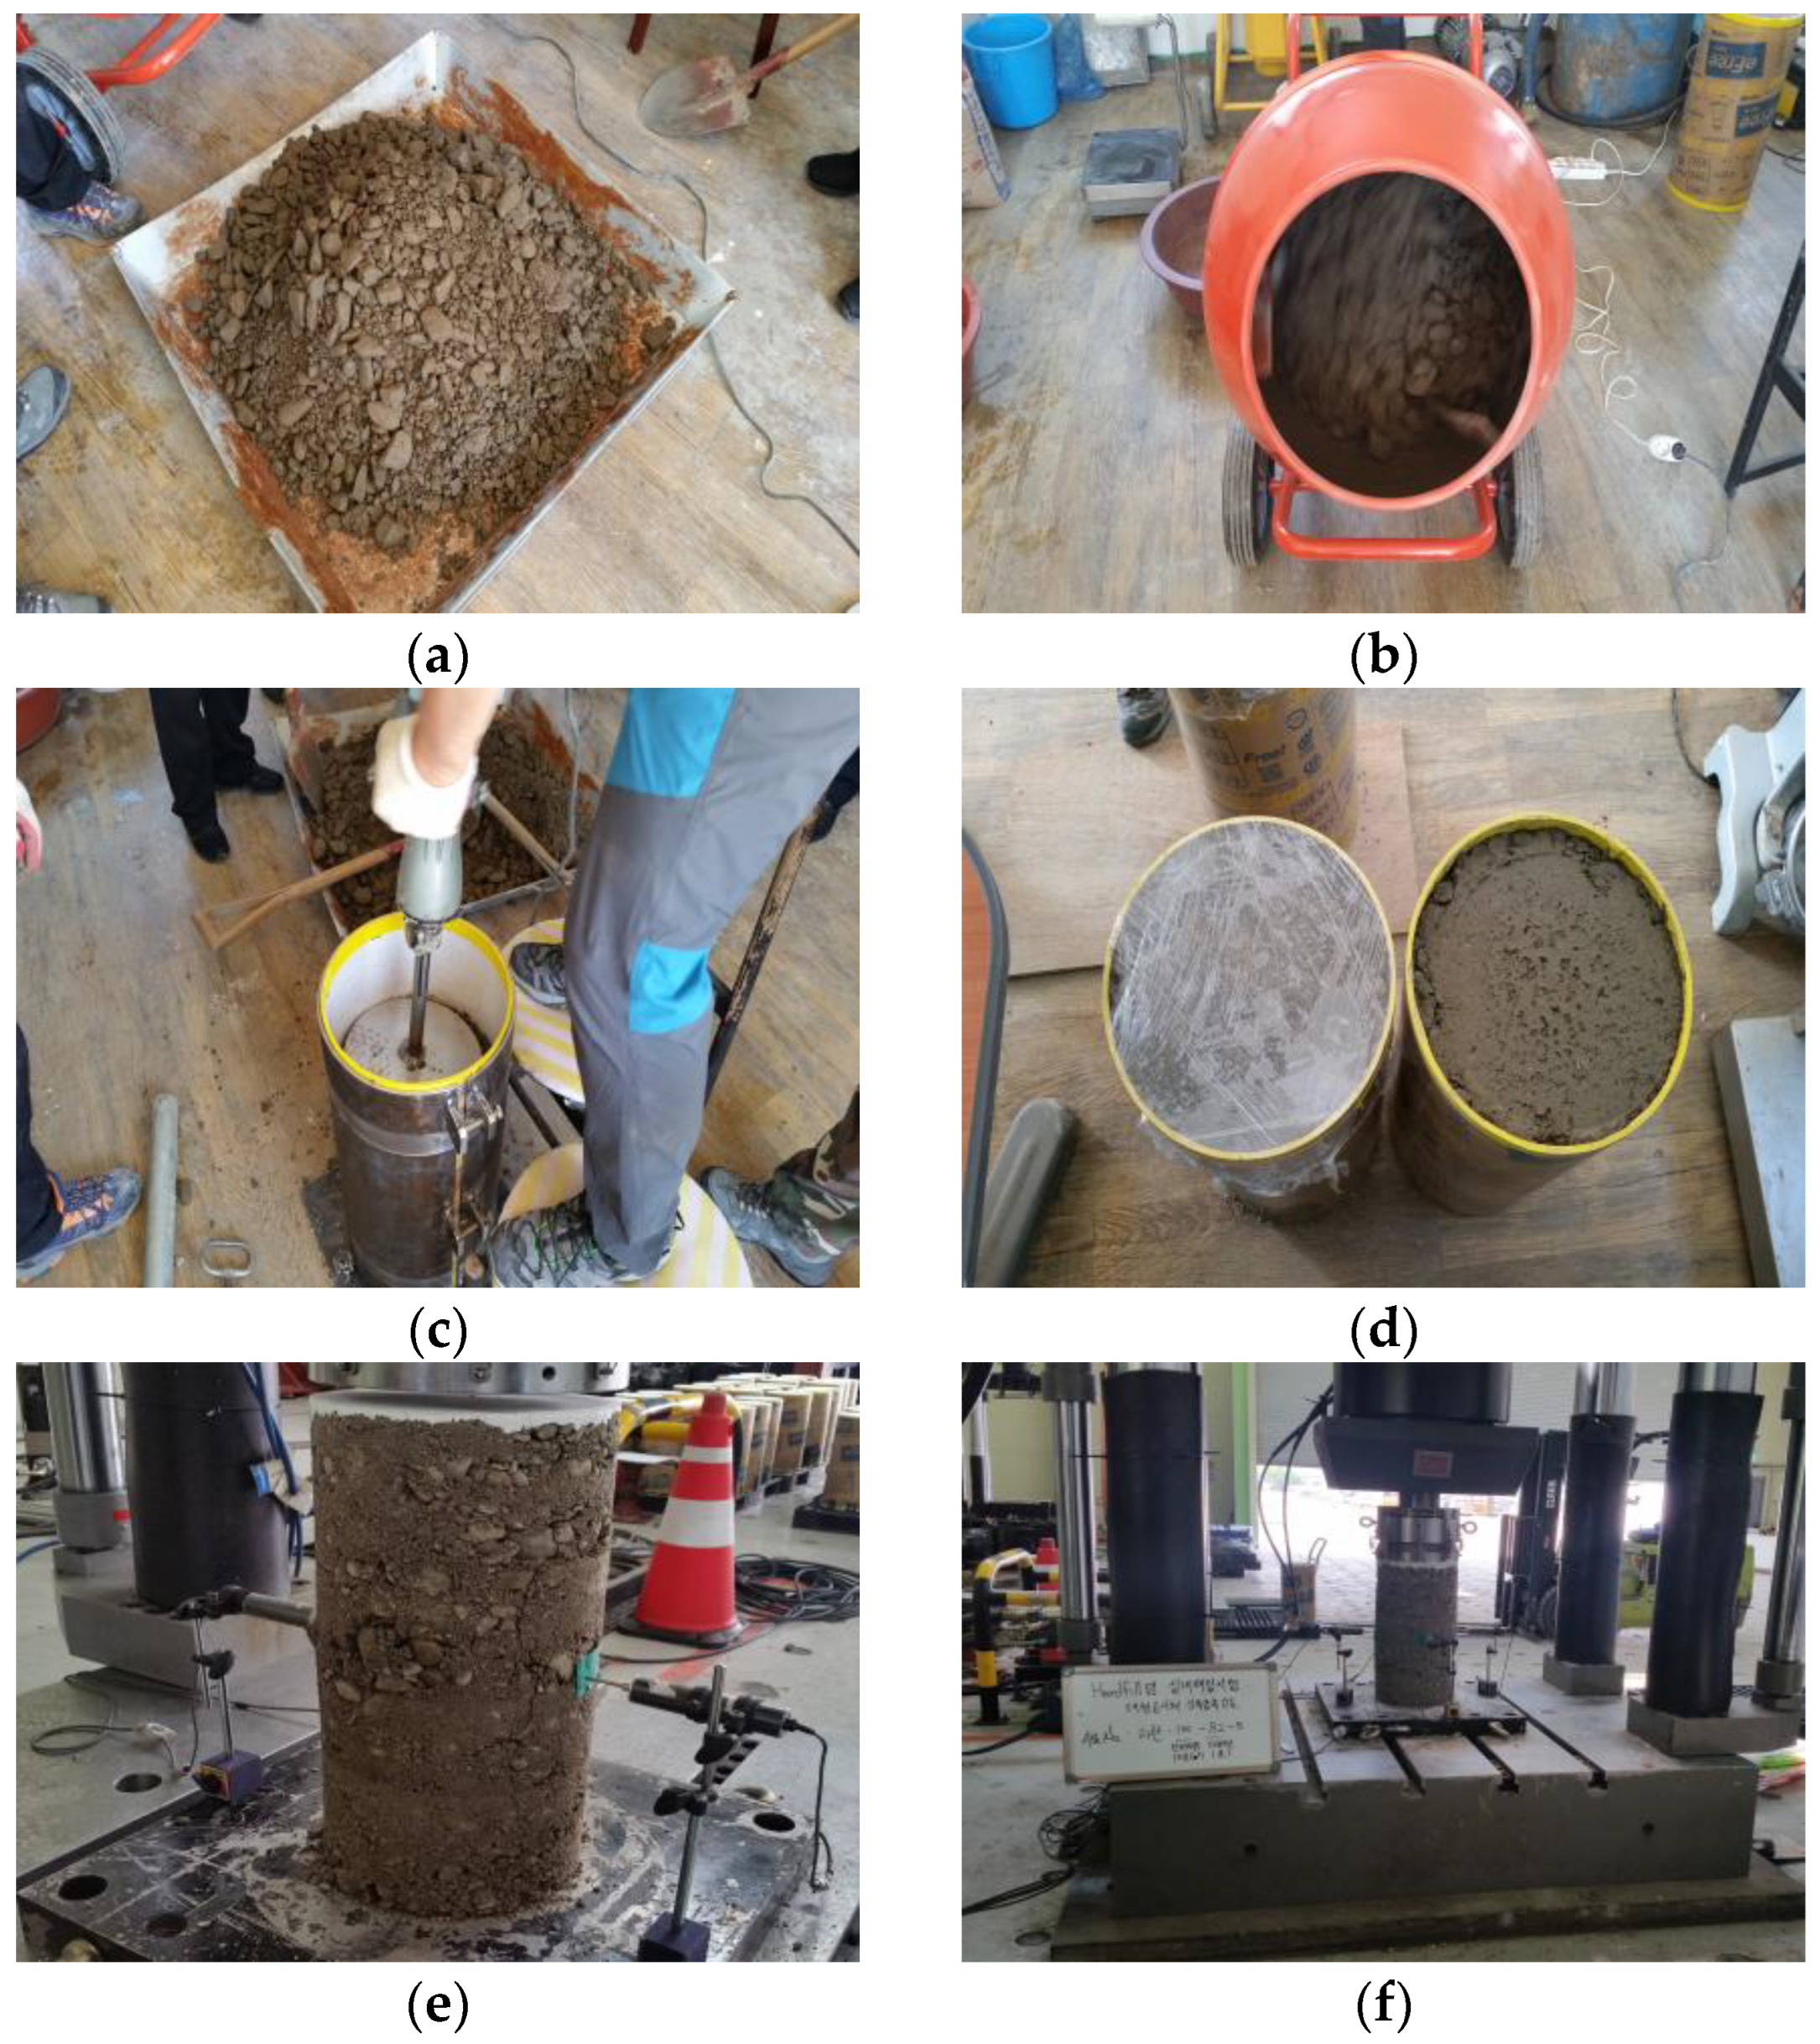
2.2. Laboratory Tests

For the laboratory tests (as described above), uniaxial compressive strength tests were performed on cylindrical large specimens with a diameter of 300 mm and height of 600 mm by applying the mixing ratio shown in Table 2 (i.e., a unit cement content of 80 kg/m3 and three unit water contents of 70, 85, and 100 kg/m3) to aggregates of fine (upper-limit) and coarse (lower-limit) PSDs with a maximum particle diameter of 80 mm. This corresponded to the same range of aggregate sizes used in the construction of hardfill dams in the actual field. Three large specimens (samples) were fabricated for each mixing ratio for a total of 18 specimens.
For the fabrication of the large specimens, the aggregate, cement, and water were mixed according to a predetermined mixing ratio, and then a mold was filled in four layers to prevent material separation. After compacting 25 times with a compaction rod for each layer, the compaction time at which a compaction energy equal to that of the field compaction roller was transmitted was calculated; then, a compaction was performed using a vibrating tamper. The compaction energy was based on the results from performing two non-vibration and six vibration compactions with a vibration roller during a field test. When compacting the sample in the mold using a hammer drill, the compaction time for each layer was calculated as 82 s, as shown in Table 3, so that the same energy as the field compaction energy would be transmitted to the sample. Then, the specimens were fabricated by performing the compaction for the calculated compaction time.
The compacted large specimens were sealed and cured for 28 d before performing the uniaxial compressive strength test. Each specimen for testing was continuously compressed to generate a compression strain of 1% per minute. Compression was terminated when more than 2% of the strain occurred after the maximum compressive force, when the maximum compressive force decreased by 2/3, or when the compressive strain reached 15%. Figure 2 shows the fabrication process of the large specimens and uniaxial compressive strength test for a specimen aged 28 d.

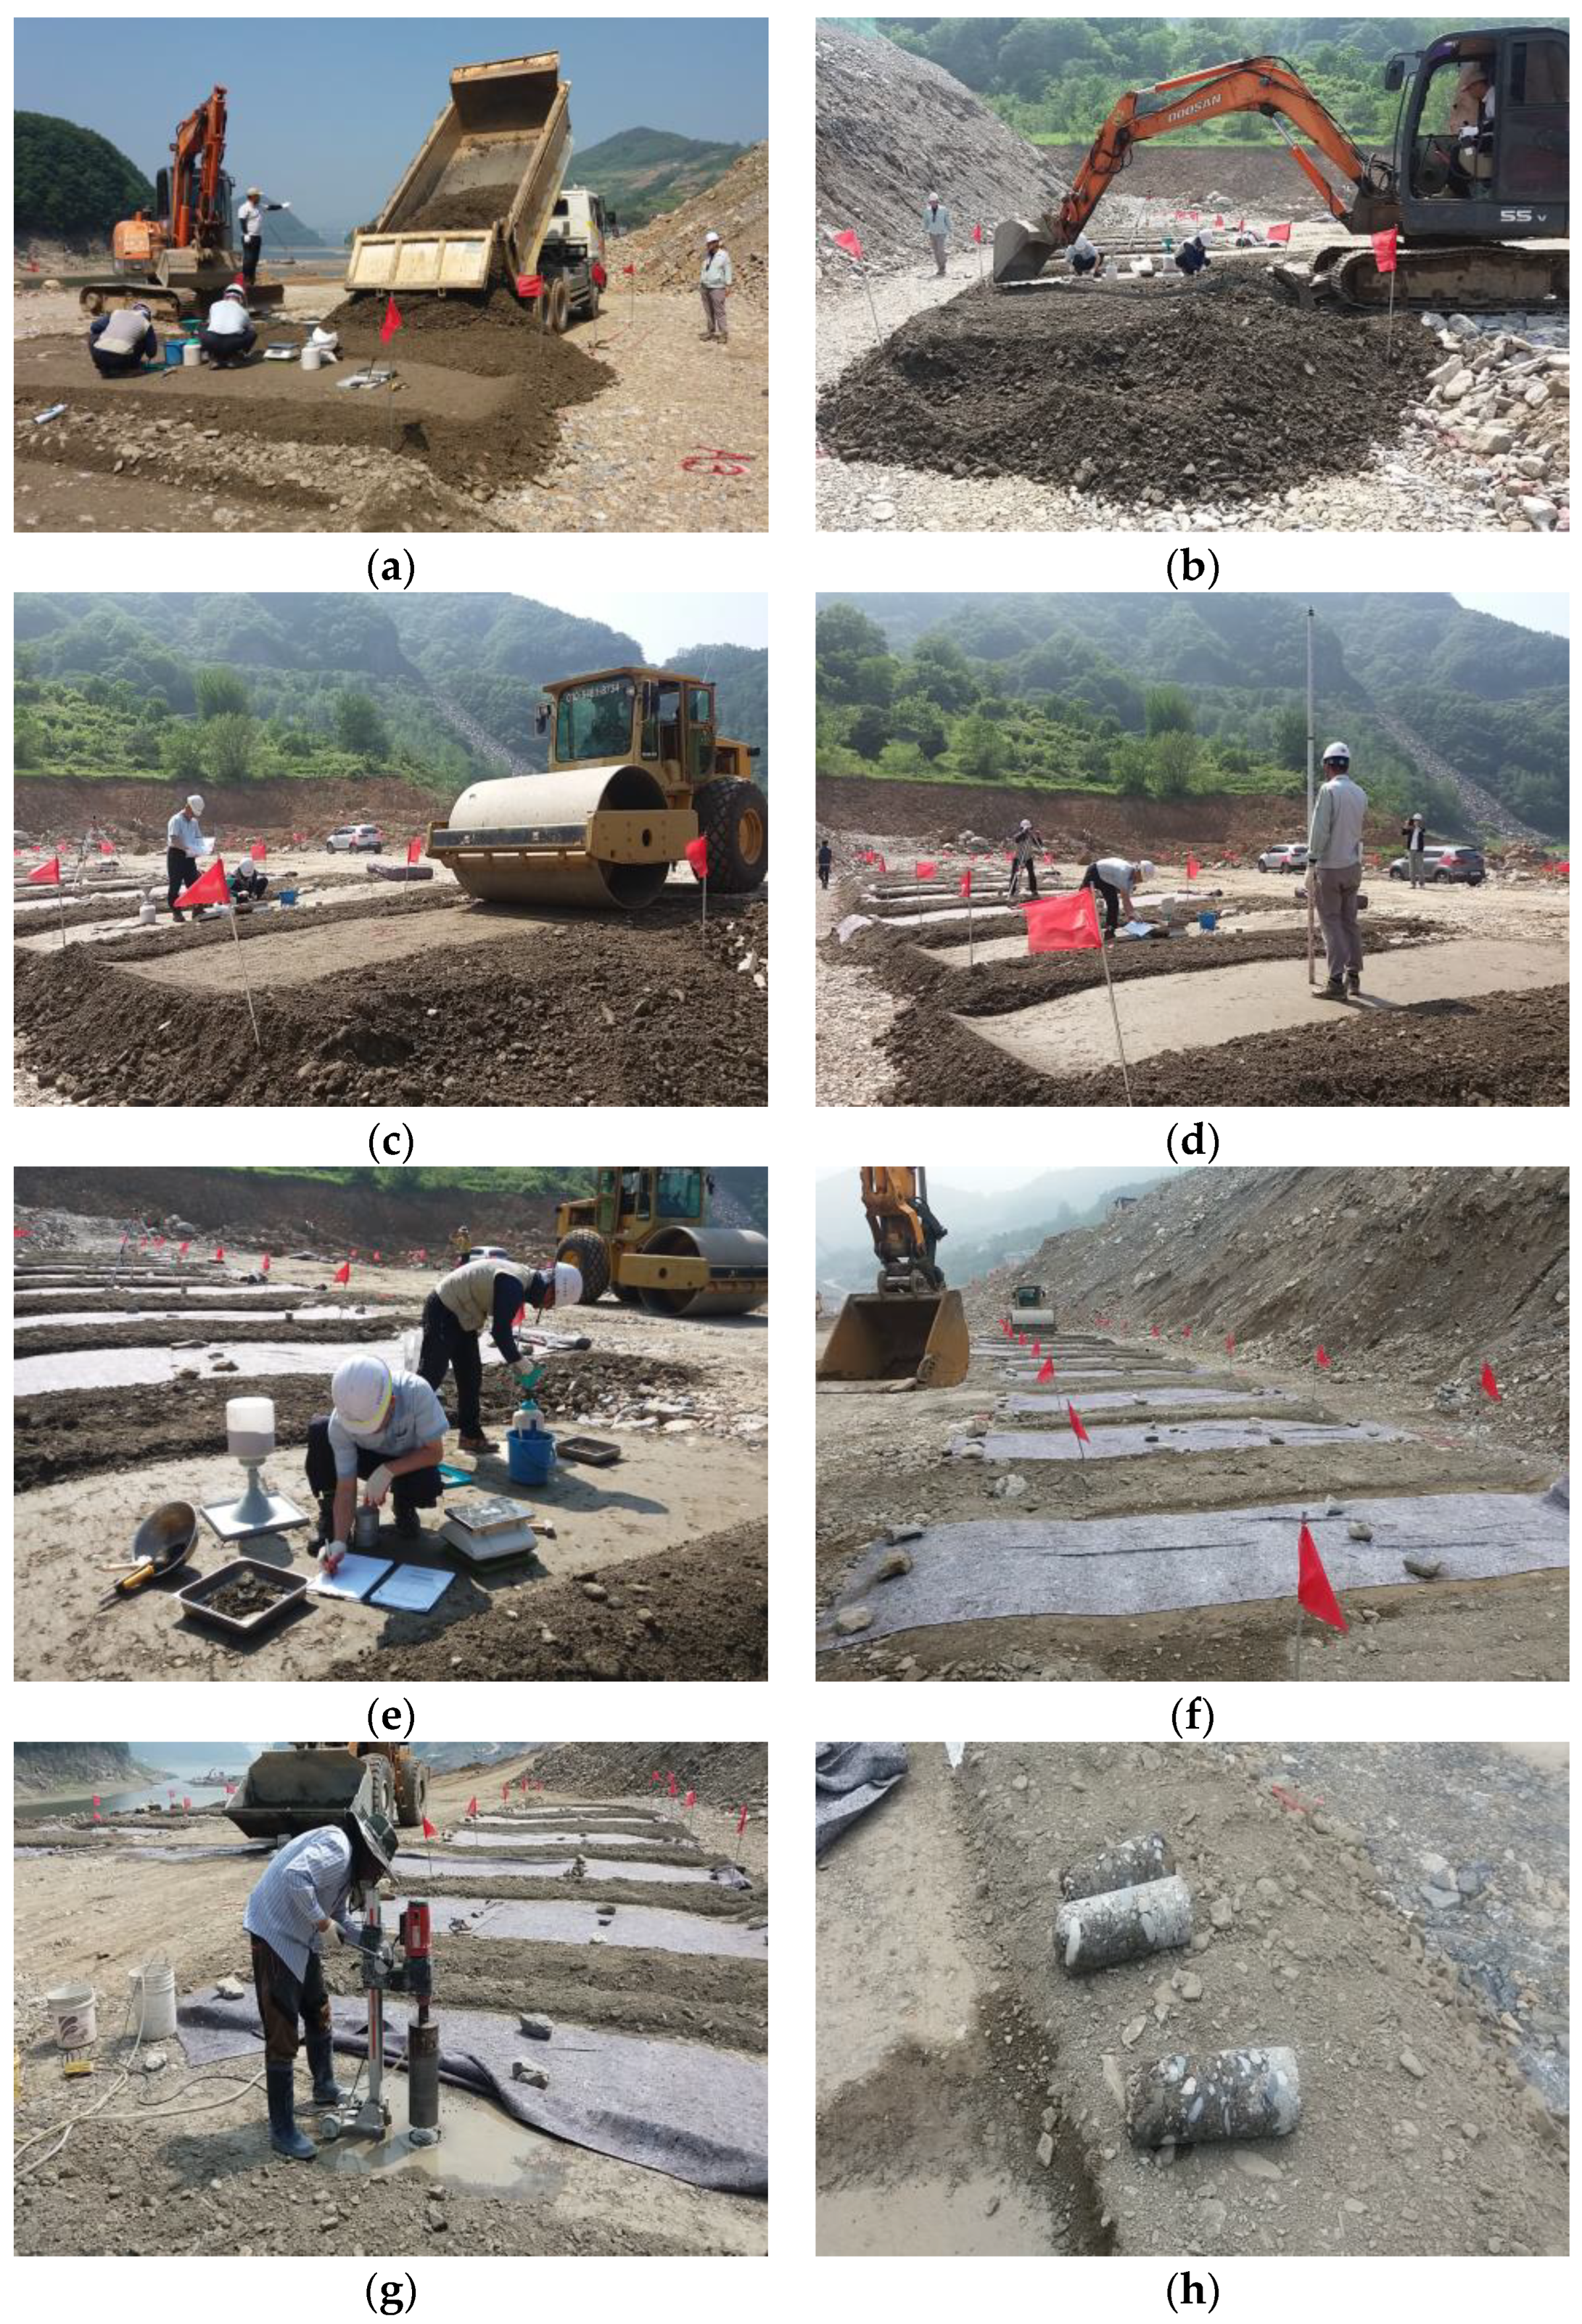
2.3. Field Test Construction

The constructability of hardfill on-site was examined through a field test construction using field compaction equipment. The construction specifications (lift thickness, number of roller passes) were established, and the strength range for the hardfill was derived in preparation for actual future construction of a hardfill dam. Furthermore, field test results were compared with the indoor laboratory tests and numerical analysis results. The field test construction site was a spoil area in the Danyang underwater weir construction site, i.e., the same place where the aggregate was collected for the indoor laboratory tests. The hardfill field mixing was performed by applying three unit water contents of 70, 85, and 100 kg/m3 and a unit cement content of 80 kg/m3 to the aggregates with a maximum particle size of 80 mm with a PSD similar to the lower limit of the PSD in the indoor test. The compaction conditions for the vibration roller were eight roller passes (six vibrated passes and two non-vibrated passes). The lift thicknesses of one layer were set as 50 cm and 75 cm, respectively. As a result, a total of six cases were tested.
The planned scale of the test construction was a compaction height of one floor on a floor area with a total width of 19 m and length of 44 m. Construction was performed by dividing sections for each test case according to material mixing conditions and lift thickness. Once each section was compacted using the vibration roller, the degree of compaction was measured by the sand cone method [32]. After measuring the field compaction degree, the corresponding section was covered with curing cloth, and a sufficient volume of water was sprayed for the first 2 to 3 d. Then, the specimens were cured for 28 d. Once curing was completed, the cores were collected, and a uniaxial compressive strength test was performed [33,34].
Table 4 and Figure 3 show the field test construction conditions and process, respectively.

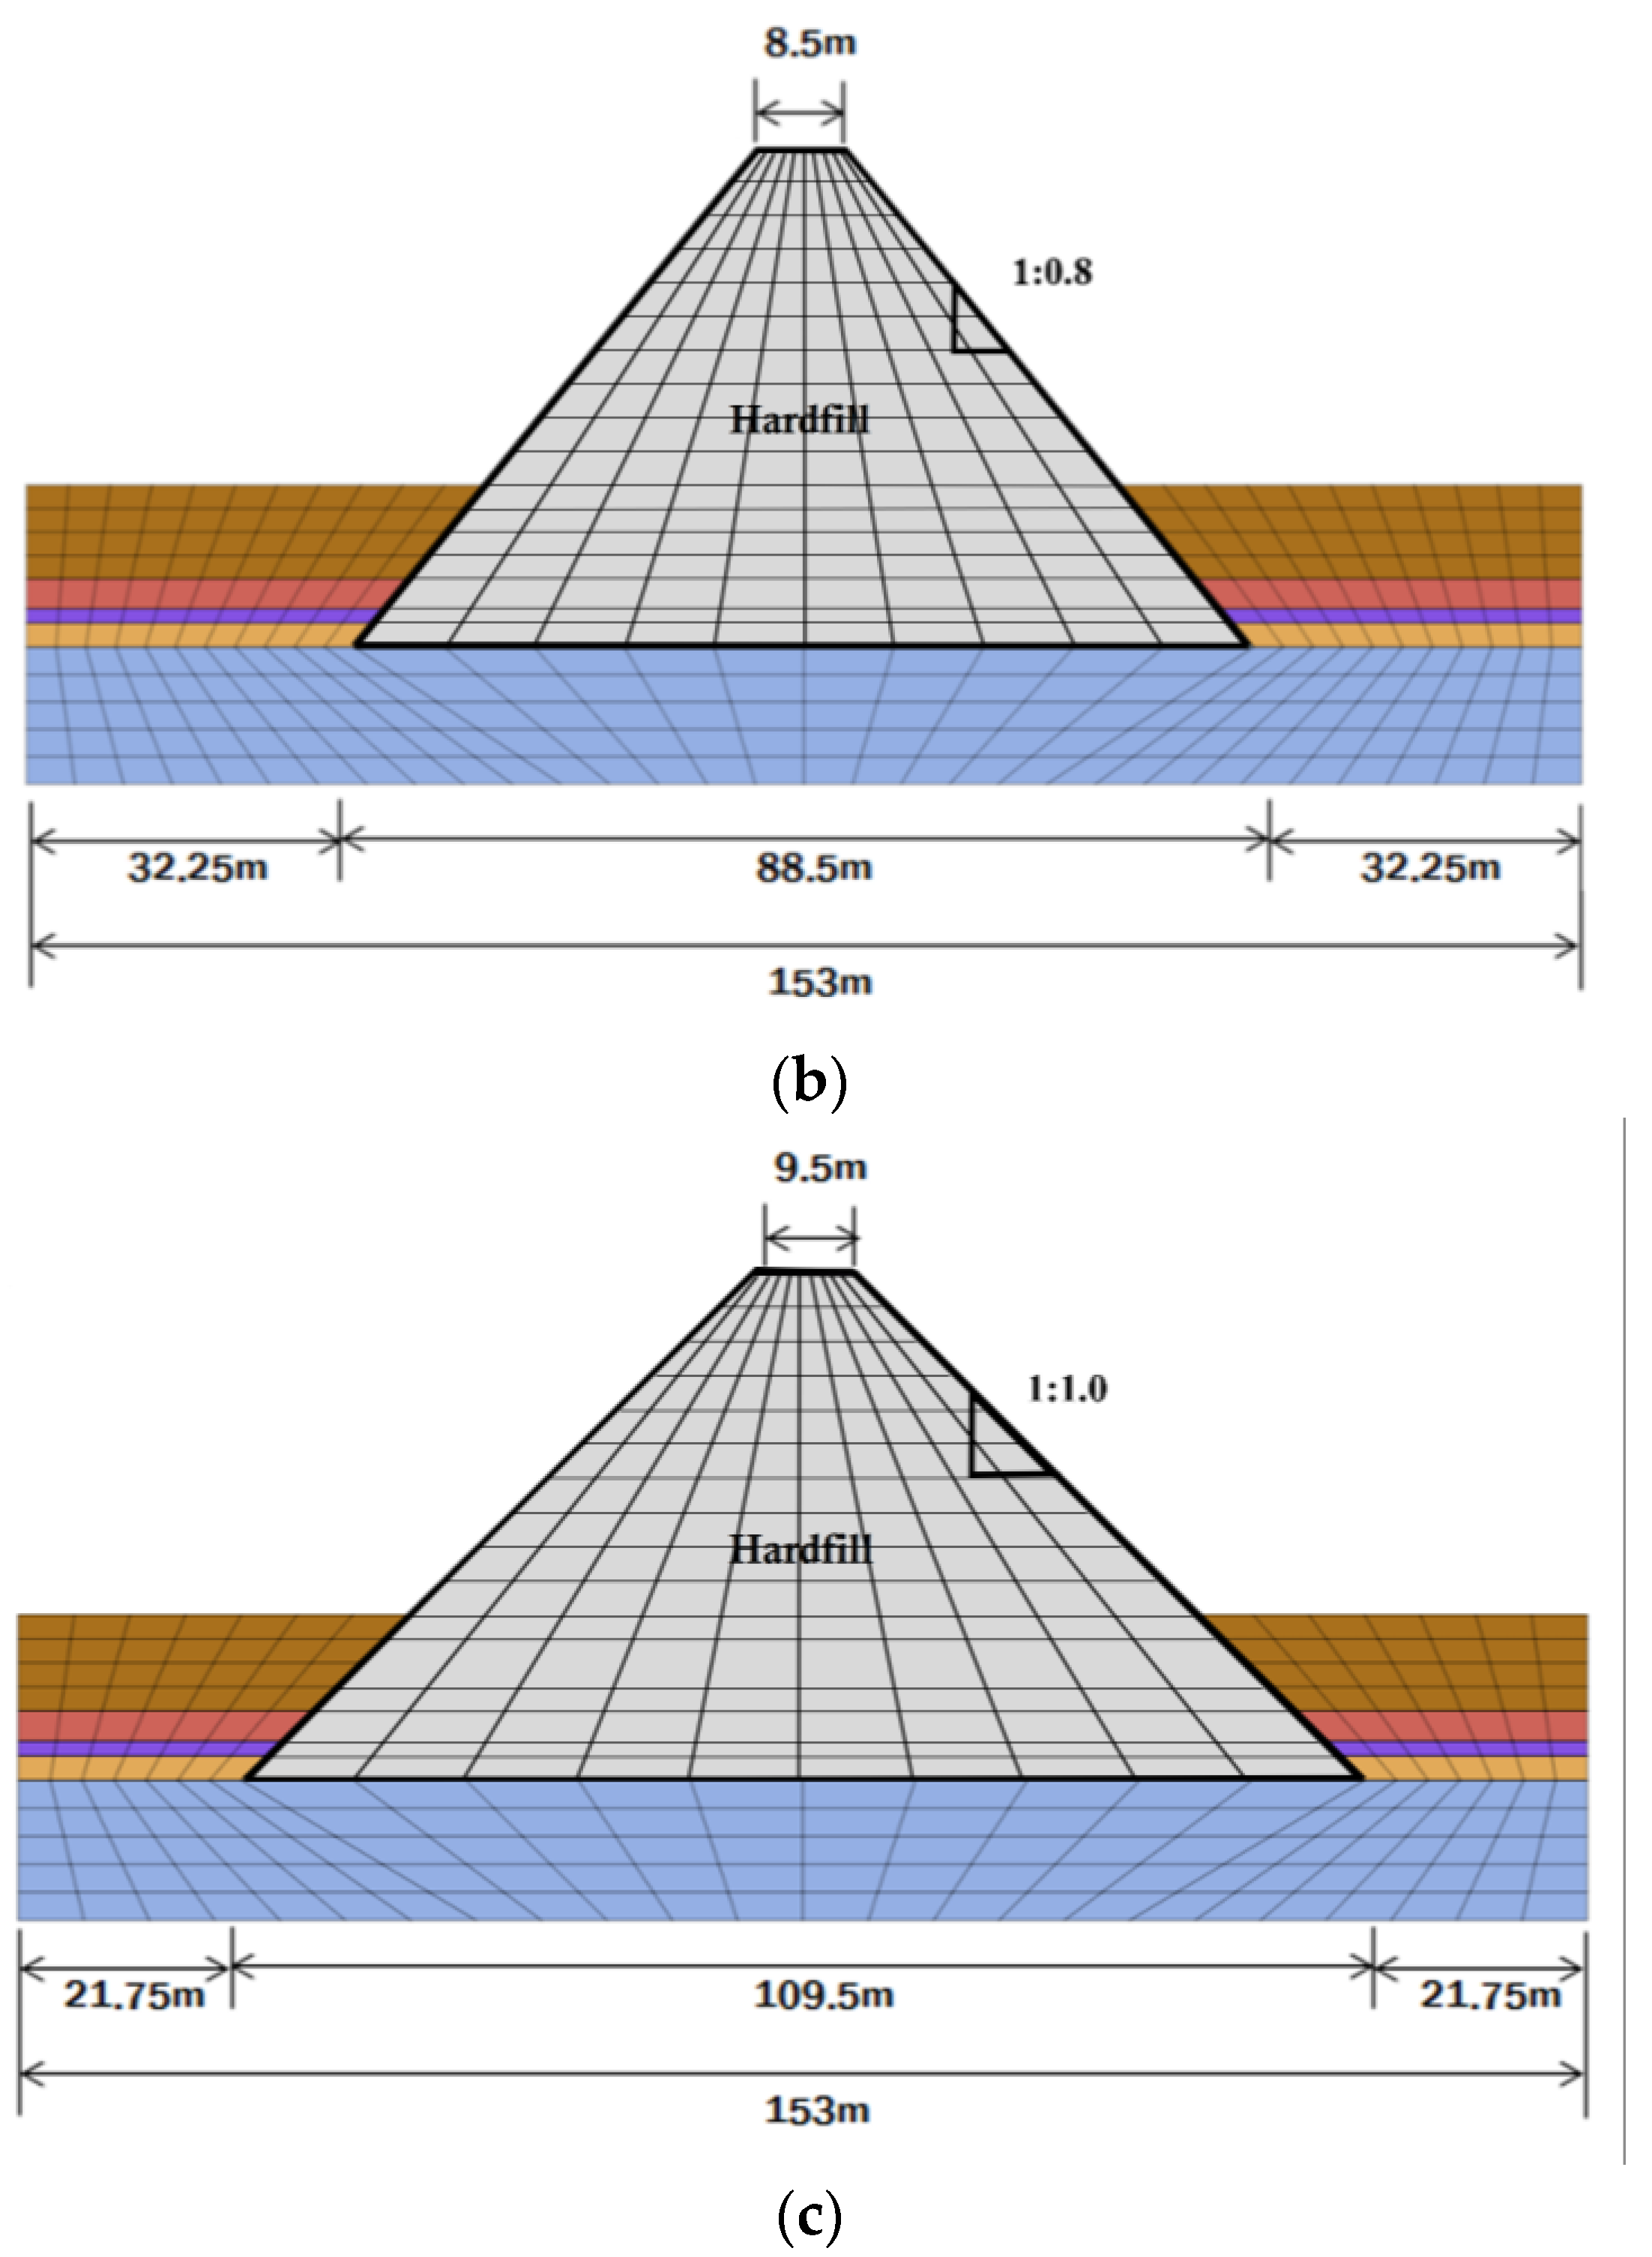
2.4. Numerical Investigation

As described above, the seismic stability was evaluated by performing a finite element analysis for a hardfill dam body (Figure 4) with three types of slopes (1:0.6, 1:0.8, and 1:1) and a height of 50 m, as constructed on a soft rock foundation based on the properties of the hardfill determined through the indoor laboratory tests. In this analysis, the state of the freshwater above the planned flood level was applied by setting the most vulnerable condition for the stability of the dam body. The hardfill was modeled as an elastic body with a unit weight of 24.1 kNg/m3, Young’s modulus of 991 MPa, and Poisson’s ratio of 0.29. Furthermore, the damping of the material was set in accordance with the first two eigenfrequencies of the dam and with an estimated damping coefficient equal to 5% for defining the Rayleigh’s coefficients. The dam foundation ground was assumed according to the ground conditions near Wonjucheon Dam in South Korea, which was determined to be suitable as a candidate site for the hardfill dam construction. The static and dynamic geotechnical parameters for the dam foundation ground for the analysis were selected based on the results from subsurface investigations conducted in the area (Table 5).
A time history analysis method was applied for the dynamic analysis. Three types of seismic waves were used as the input seismic waves: Ofunato and Hachinohe waves, i.e., representative short-period and long-period seismic waves widely used in dynamic analysis, respectively, and artificial waves generated by reflecting the characteristics of the Wonjucheon dam site (Figure 5). In the analysis domain, the left and right sides were fixed in the horizontal direction, and the lower part was set in the vertical direction. A viscous boundary condition was applied to show a behavior similar to reality when a seismic wave is applied by absorbing the wave reaching the boundary.
Lastly, from the numerical analysis results, the seismic stability of the hardfill dam body was evaluated by comparing the maximum stress generated inside the hardfill dam body with the “required hardfill strength” as applied with a safety factor of 1.5 under the seismic load condition [3].

3. Laboratory Test Results

3.1. Variations in Dry Unit Weight and Uniaxial Compressive Strength for Hardfill Mix Conditions with Different Aggregate Size Distributions and Water Content per Unit Volume

Figure 6 and Figure 7 show the relationship between the unit water content and dry unit weight and between the unit water content and uniaxial compressive strength for the fabricated large hardfill specimens, respectively. These specimens were fabricated by mixing aggregates with the upper-limit (fine) and lower-limit (coarse) particle size distributions as described in Section 2.1 with a unit cement content of 80 kg/m3 and three unit water contents of 70, 85, and 100 kg/m3, respectively. Since three specimens were fabricated and tested for one mixing condition, the average values for the corresponding mixing conditions are shown together with the measured values for each specimen.
The dry unit weight increases with the unit water content for both aggregate mixes with the upper-limit and lower-limit PSDs. The increase rate of dry unit weight is slightly higher in the aggregate mix with the upper-limit PSD condition than that with the lower-limit PSD condition (Figure 6). At the smallest unit water content (i.e., 70 kg/m3), the dry unit weight of the aggregate mix with the lower-limit PSD slightly exceeds that of the aggregate mix with the upper-limit PSD (2410 vs. 2357 kg/m3). However, the dry unit weights are similar at the largest unit water content (i.e., 100 kg/m3) (2468 vs. 2470 kg/m3). Meanwhile, the uniaxial compressive strength according to the unit water content change tends to increase gradually with the unit water content for both aggregate mixes with upper- and lower-limit PSDs (Figure 7). The ranges of the uniaxial compressive strengths according to the unit water content change are 3.152–4.106 MPa for the aggregate mix with the lower-limit PSD and 1.619–2.094 MPa for the aggregate mix with the upper-limit PSD. As a result, the uniaxial compressive strength of the aggregate mix with the lower-limit PSD exceeds that of the aggregate mix with the upper-limit PSD for the entire unit water content range.

3.2. Elastic Properties of Hardfill

In designing a hardfill dam, in general, the strength in the elastic region is taken as the strength of the hardfill from the stress–strain behavior, and the hardfill dam is assumed to be a structure that behaves like an elastic body. For all samples subjected to the uniaxial compressive strength test, the maximum compressive strength and elastic modulus in the elastic region were calculated from the stress–strain relationship obtained from the uniaxial compressive strength test. For the range of hardfill mixes investigated in this study (i.e., mixes in the range of unit cement content of 80 kg/m3 and unit water contents of 70–100 kg/m3 for aggregates with upper- and lower-limit PSDs), the relationship between the hardfill’s uniaxial compressive strength in the elastic range and elastic modulus is shown in Figure 8. For all mixing conditions, the hardfill’s elastic modulus is in the range of approximately 220 to 609 times the uniaxial compressive strength (i.e., 220 q–609 q, where q is the uniaxial compressive strength). The elastic modulus of the aggregate mix with the upper-limit PSD is approximately 433 times (i.e., 433 q) the uniaxial compressive strength on average, and the elastic modulus of the aggregate mix with lower-limit PSD is approximately 314 times (i.e., 314 q) on average. Consequently, the elastic modulus of the hardfill of the aggregate mix with the upper-limit PSD is rather large. As shown in Figure 7, the peak value of the stress–strain relationship in the uniaxial compressive strength test (that is, the uniaxial compressive strength measured at the time of sample failure) shows a smaller range in the hardfill of the aggregate mix with the upper-limit PSD than that in the hardfill of the aggregate mix with the lower-limit PSD. However, the above-mentioned elastic modulus results indicate that, on average, the hardfill’s stiffness, i.e., the elastic modulus (slope of the stress–strain curve) in the initial strain (elastic deformation) section is slightly larger in the hardfill of the aggregate mix with the upper-limit PSD than that in the hardfill of the aggregate mix with the lower-limit PSD.

4. Field Test Construction Results

Figure 9 shows the relationship between the unit water content and dry unit weight for field-compacted hardfills, i.e., hardfills mixed on-site using the same type of aggregates with the maximum particle diameter of 80 mm as used in the indoor laboratory test by matching the PSD and mixing ratio to the laboratory test conditions (i.e., a unit cement content of 80 kg/m3 and three unit water contents of 70, 85, and 100 kg/m3) and compacted on-site using a vibration roller. The change in the dry unit weight according to the unit water content shows that the dry unit weight increases in the case of the 50 cm lift compaction but decreases in the case of the 75 cm lift compaction. Thus, it shows a difference from the results from the indoor laboratory test, in which the values gradually increased in all mixing conditions. Regarding the range of changes in the unit water content, the average dry unit weight is in the range of 2232–2455 kg/m3, i.e., generally similar to the indoor test results (2357–2468 kg/m3) but shows a slightly larger range. In particular, the difference in the dry unit weight according to the lift thickness is larger with the unit water content of 70 kg/m3 than with other unit water contents.
Prior to this study, a preliminary test was conducted for the same type of aggregate. In the preliminary test, the maximum dry unit weight was measured using a compaction test [3,30] on a standard specimen with an aggregate with a maximum allowable particle size of 37.5 mm. Figure 10 shows the calculations of the relative compaction using the indoor test results and field compaction measurement results in this study. For the three unit water contents, both the 50 cm and 75 cm lift compactions show relative compactions in the range of 101.7–108.3%. Thus, both exceed 100%. These results are owing to the fact that the size and compaction energy of the hardfill aggregate in the field compaction conditions are larger than those in the standard specimen compaction conditions.
Figure 11 shows the results from uniaxial compressive strength tests for 28-day cores collected after 28 d from field-compacted hardfills. For comparison, the test results for the large indoor specimens were plotted together. The uniaxial compressive strength of the field-compacted hardfill cores ranges from 5.3 to 8.2 MPa in the unit water content range of 70 to 100 kg/m3 for the two lift thicknesses. The overall difference is more than doubles the range of 1.62–4.11 MPa in the indoor test results, and the largest strength value is observed at the unit water content of 85 kg/m3. Thus, there is a rather large difference from the trend of the indoor test results. As can be seen from the error bars added in the data plot, there are larger variations in the indoor test results. The large variations in the indoor test results may be attributed to the fact that, for a large indoor specimen with large aggregate particles in a mold, uniform compaction tends to be hardly achieved by vibrating tamper, compared with a roller-compacted field core. As a result, it seems that less uniformly compacted indoor specimens exhibit lower strength. Even acknowledging such differences, the relatively large difference between the laboratory (indoor) and field tests suggests that the strength measurements from laboratory specimens under similar mixing conditions can generally be evaluated conservatively.

5. Numerical Analysis Results

Figure 12 shows the finite element analysis results for a hardfill dam body with three slopes (1:0.6, 1:0.8, 1:1) and a height of 50 m. It shows the stress distribution of the cross-section of the dam body when the maximum compressive stress and maximum tensile stress occur in the dam body, and the three types of seismic waves in Figure 5 are applied. The location where the maximum compressive stress occurs in the dam body differs according to the type of seismic wave. The maximum compressive stress occurs at the lower part of the upstream side (left side) of the dam body with a 1:0.6 slope for the Hachinohe wave, at the upper part of the downstream side (right side) of the dam body with a 1:0.8 slope for the Ofunato wave, and at the upper side of the dam body with a 1:1.0 slope in the case of an artificial wave. Meanwhile, the maximum tensile stress occurs similarly at the lower part of the upstream side for all three types of seismic waves, as shown similarly in a previous study [13].
Figure 13 shows the changes in the maximum compressive stress and maximum tensile stress according to the change in the slope of the dam body for the three types of seismic waves. The maximum compressive stress is the largest at 2.14 MPa in the hardfill dam body, with the steepest slope of 1:0.6 when the artificial wave with the largest maximum acceleration is applied. However, it rapidly decreases to 1.3 MPa when the slope is relaxed to 1:0.8. The maximum compressive stresses under the action of the Hachinohe and Ofunato waves are 1.07 MPa and 1.14 MPa in the hardfill dam body with a slope of 1:0.6, respectively, i.e., significantly lower than that of the artificial wave. Subsequently, all of them gradually decrease as the slope is relaxed. The largest value of the maximum tensile stress occurs in the hardfill dam body with a slope of 1:0.6 when the artificial wave is applied, as in the case of the maximum compressive stress. However, the magnitude is only 0.1 MPa, i.e., significantly lower than that of the compressive stress. Furthermore, the maximum tensile stress tends to decrease overall as the slope of the dam body is relaxed. However, the decrease is relatively insignificant or increases in some parts (the dam body with a slope of 1:0.8 in the Hachinohe wave).
The hardfill comprising the dam body must have sufficient strength to resist the maximum compressive stress and maximum tensile stress occurring in the dam body. In this study, the stability of the hardfill dam body was evaluated by applying a safety factor of 1.5 to the maximum stress values shown in Figure 13. That is, the value obtained by multiplying the safety factor of 1.5 by the larger value of the maximum compressive stress and the compressive stress converted into seven times the maximum tensile stress was set as the minimum compressive strength of hardfill required to maintain the stability of the hardfill dam body (i.e., required hardfill strength) [3]. This was compared with the uniaxial compressive strengths of the large hardfill specimens through indoor laboratory tests described in Section 3 and the uniaxial compressive strengths of the field-compacted hardfill cores described in Section 4. The results are shown in Figure 14. The required hardfill strengths of the three inclined hardfill dam bodies for the three seismic waves are displayed as bar graphs. The upper and lower limits of the range of uniaxial compressive strength for the indoor and field samples in the unit water content range of 70 to 100 kg/m3 in Figure 11 are indicated by solid lines. As can be seen, except for the case where the artificial wave with the largest maximum acceleration is applied to the hardfill dam body with the steepest slope of 1:0.6, the uniaxial compressive strength range of the large hardfill specimens in the laboratory tests mostly appears to exceed the required strength of the hardfill dam body. Moreover, the range of the uniaxial compressive strength of the field-compacted hardfill core exceeds the required hardfill strength relatively significantly (approximately 2.7 to 3.8 times), thereby ensuring seismic stability.

6. Conclusions

In this study, the strength characteristics of a hardfill material and the stability of hardfill dams during earthquakes were investigated by conducting uniaxial compressive strength tests on both large indoor hard fill specimens and field-compacted cores and by performing a finite element analysis, respectively:
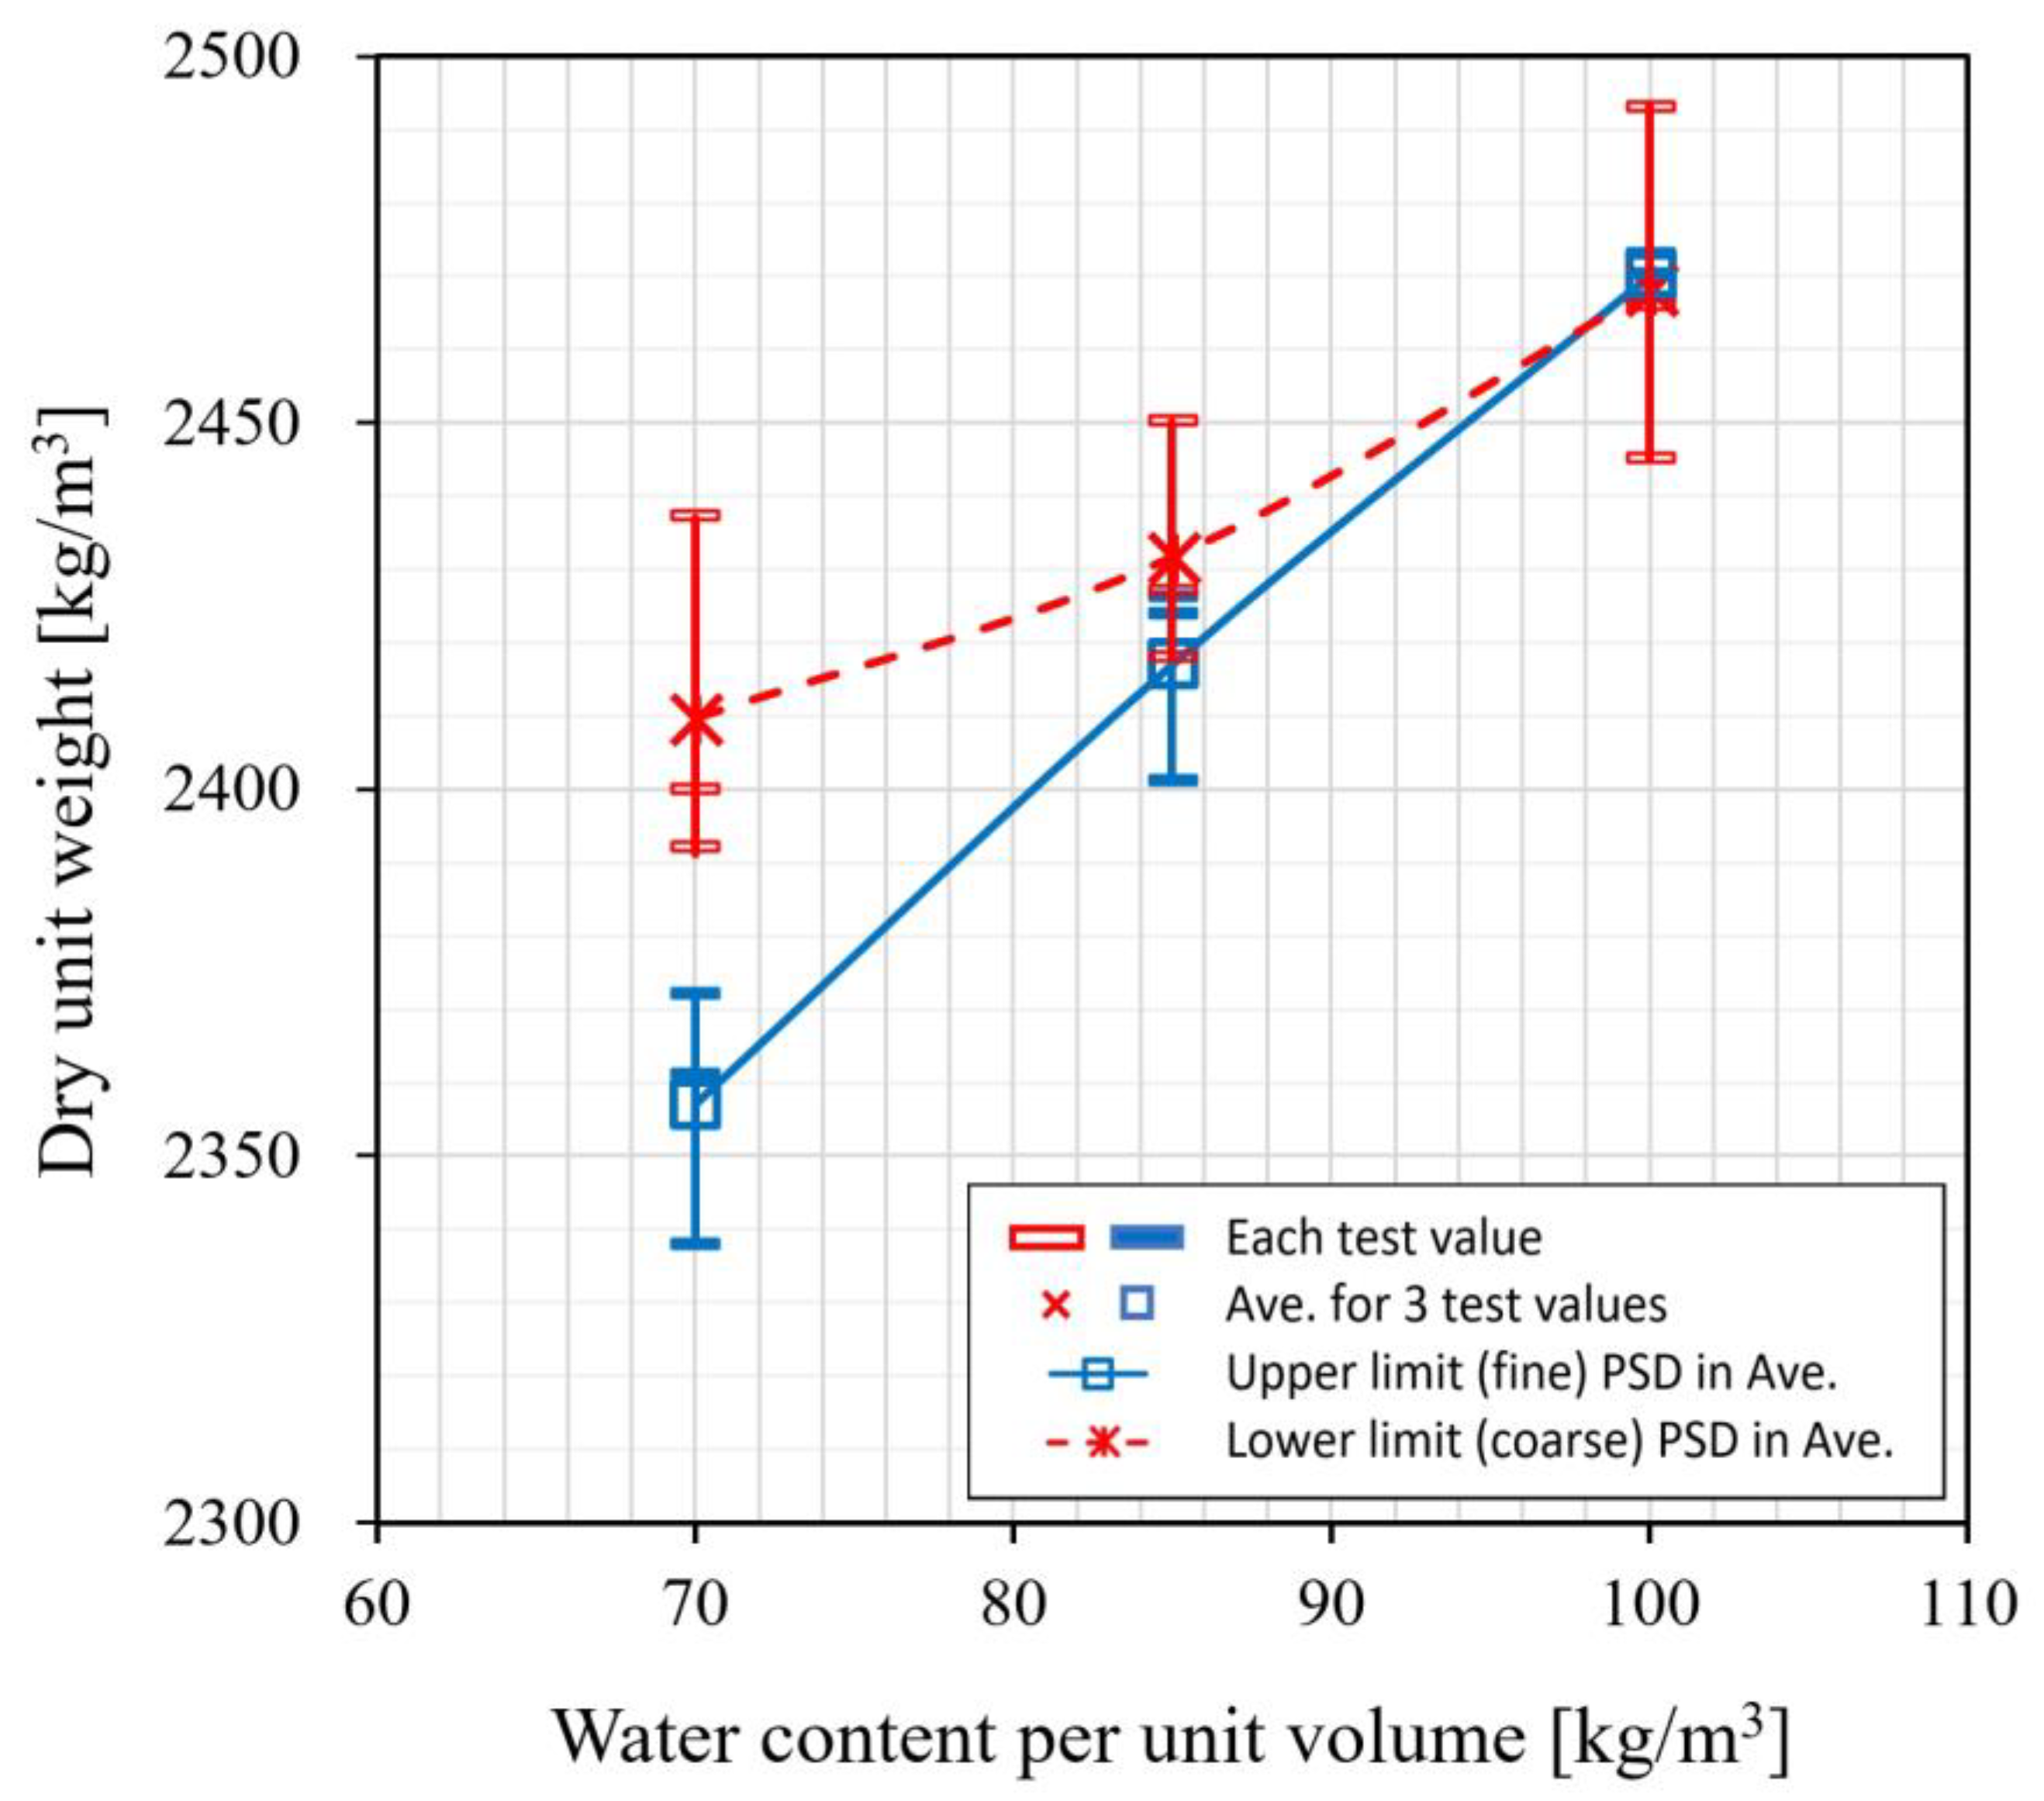
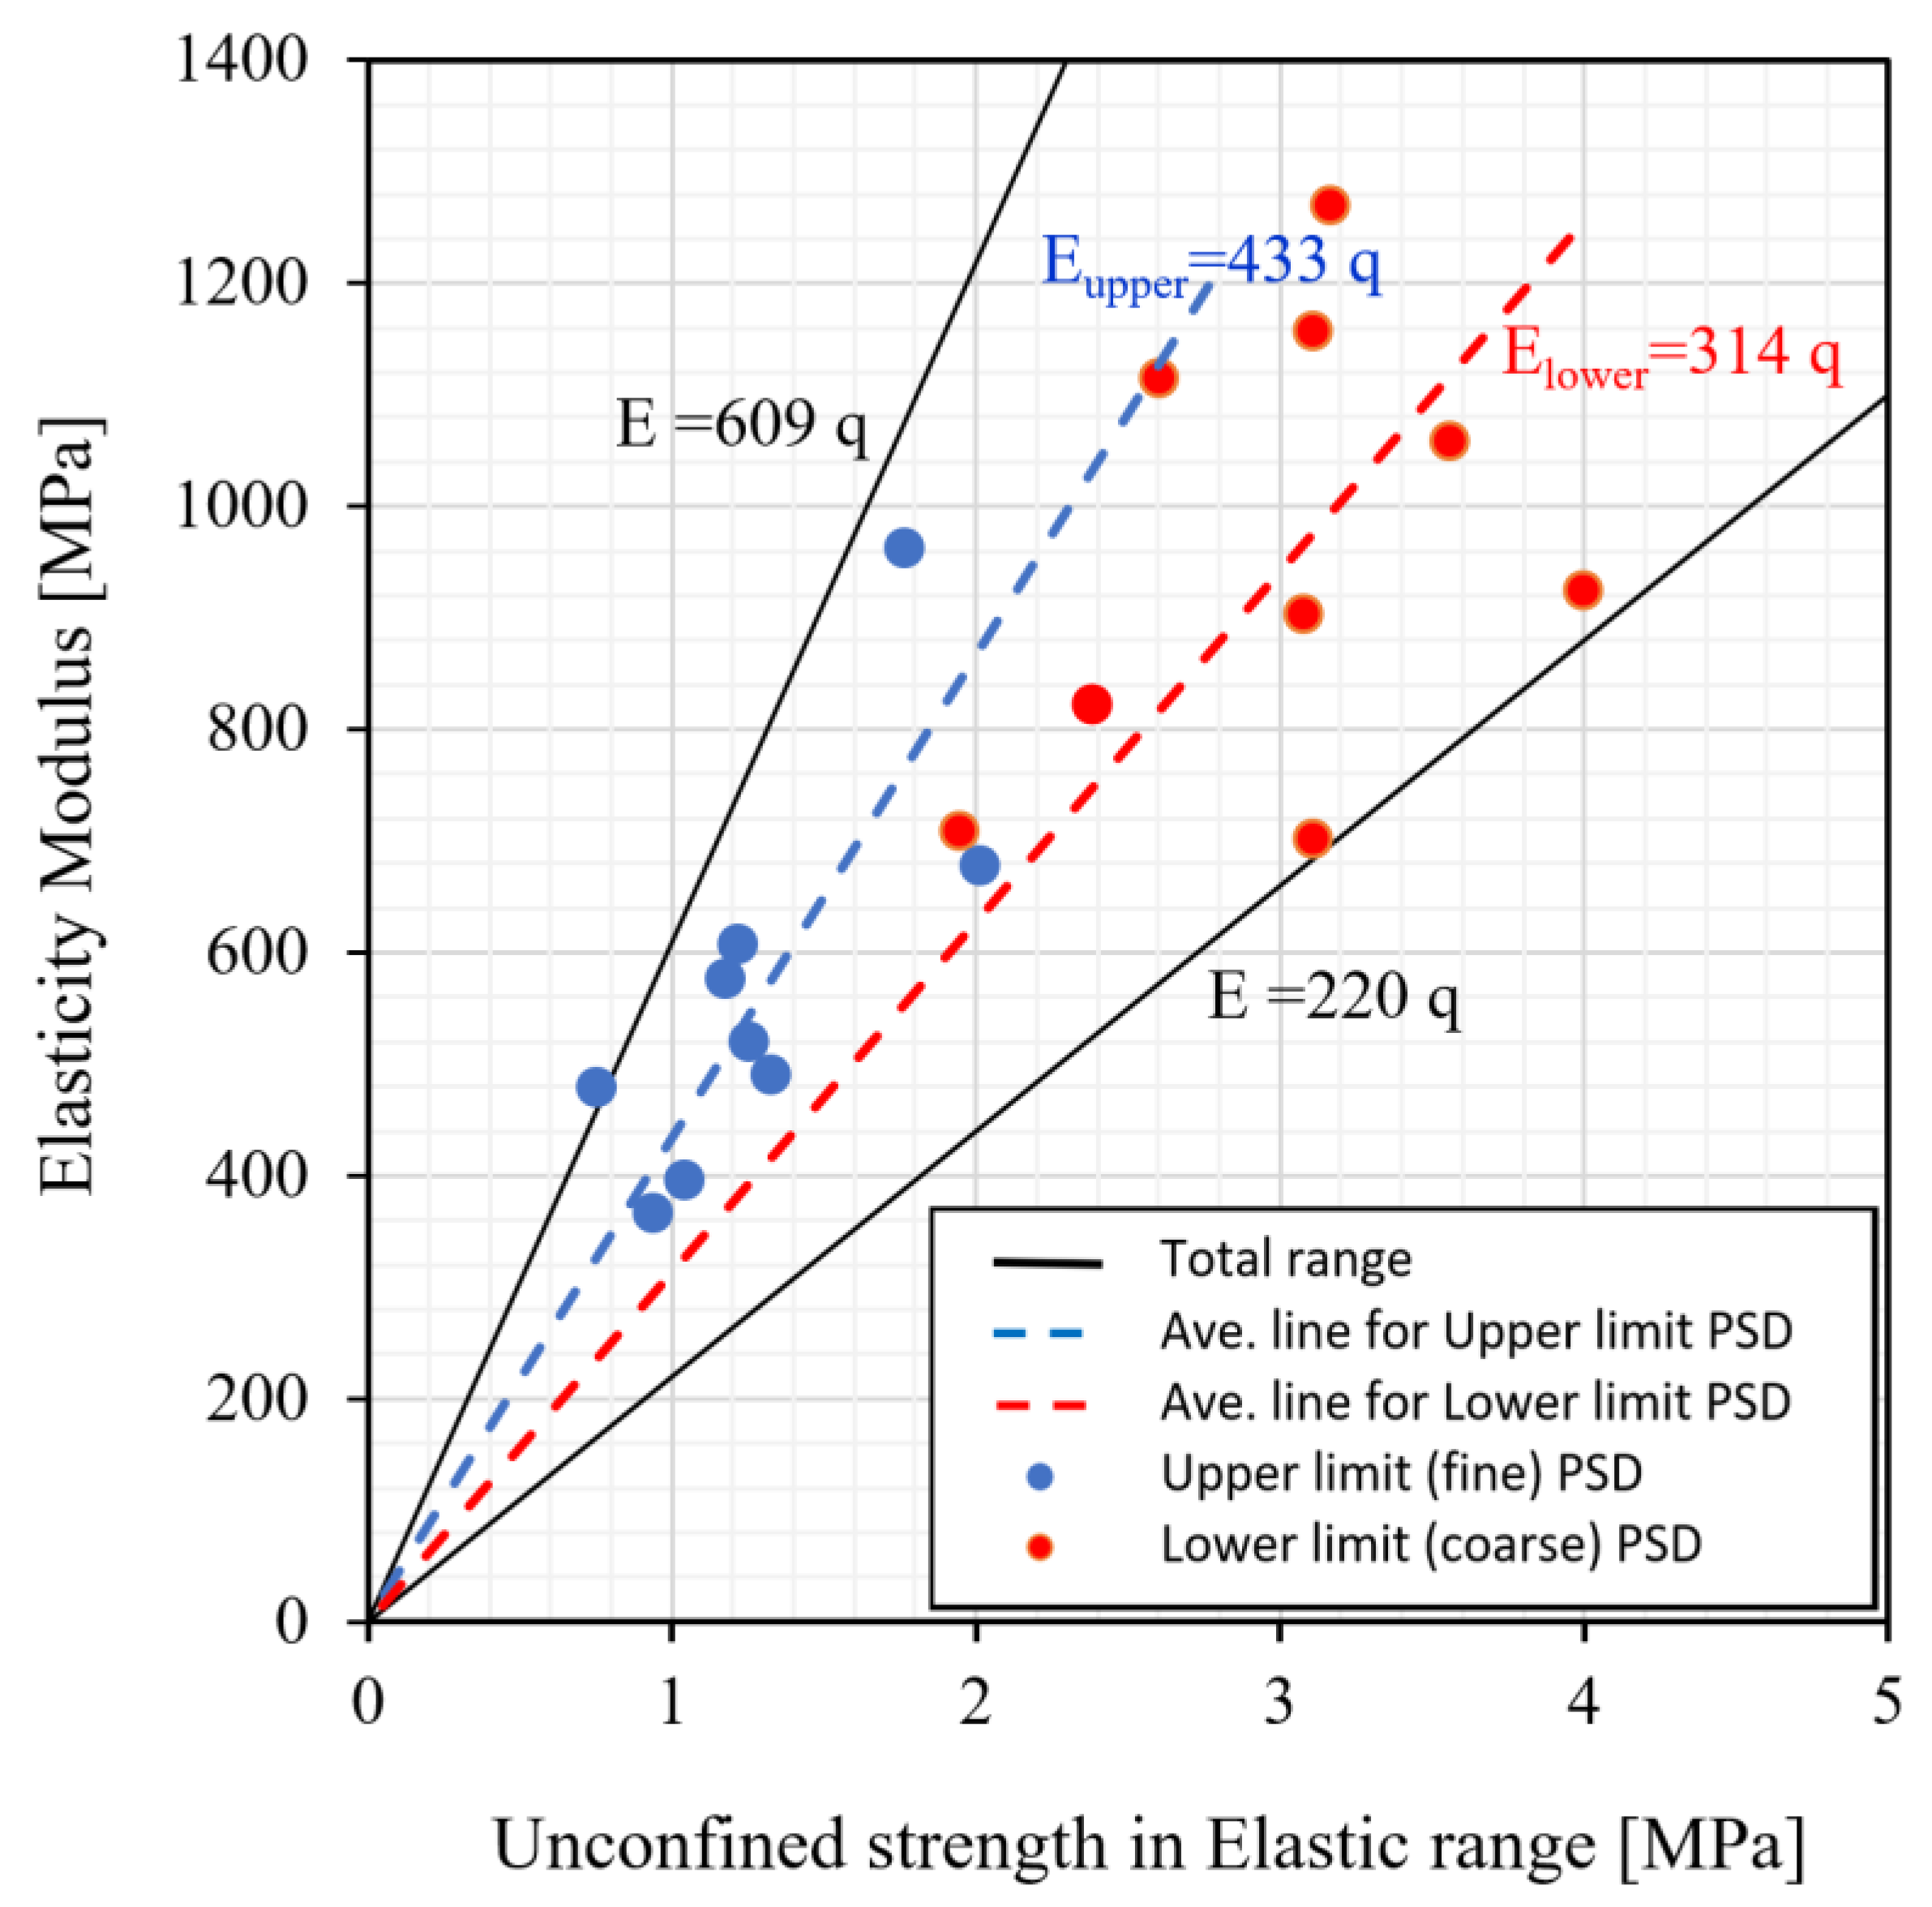
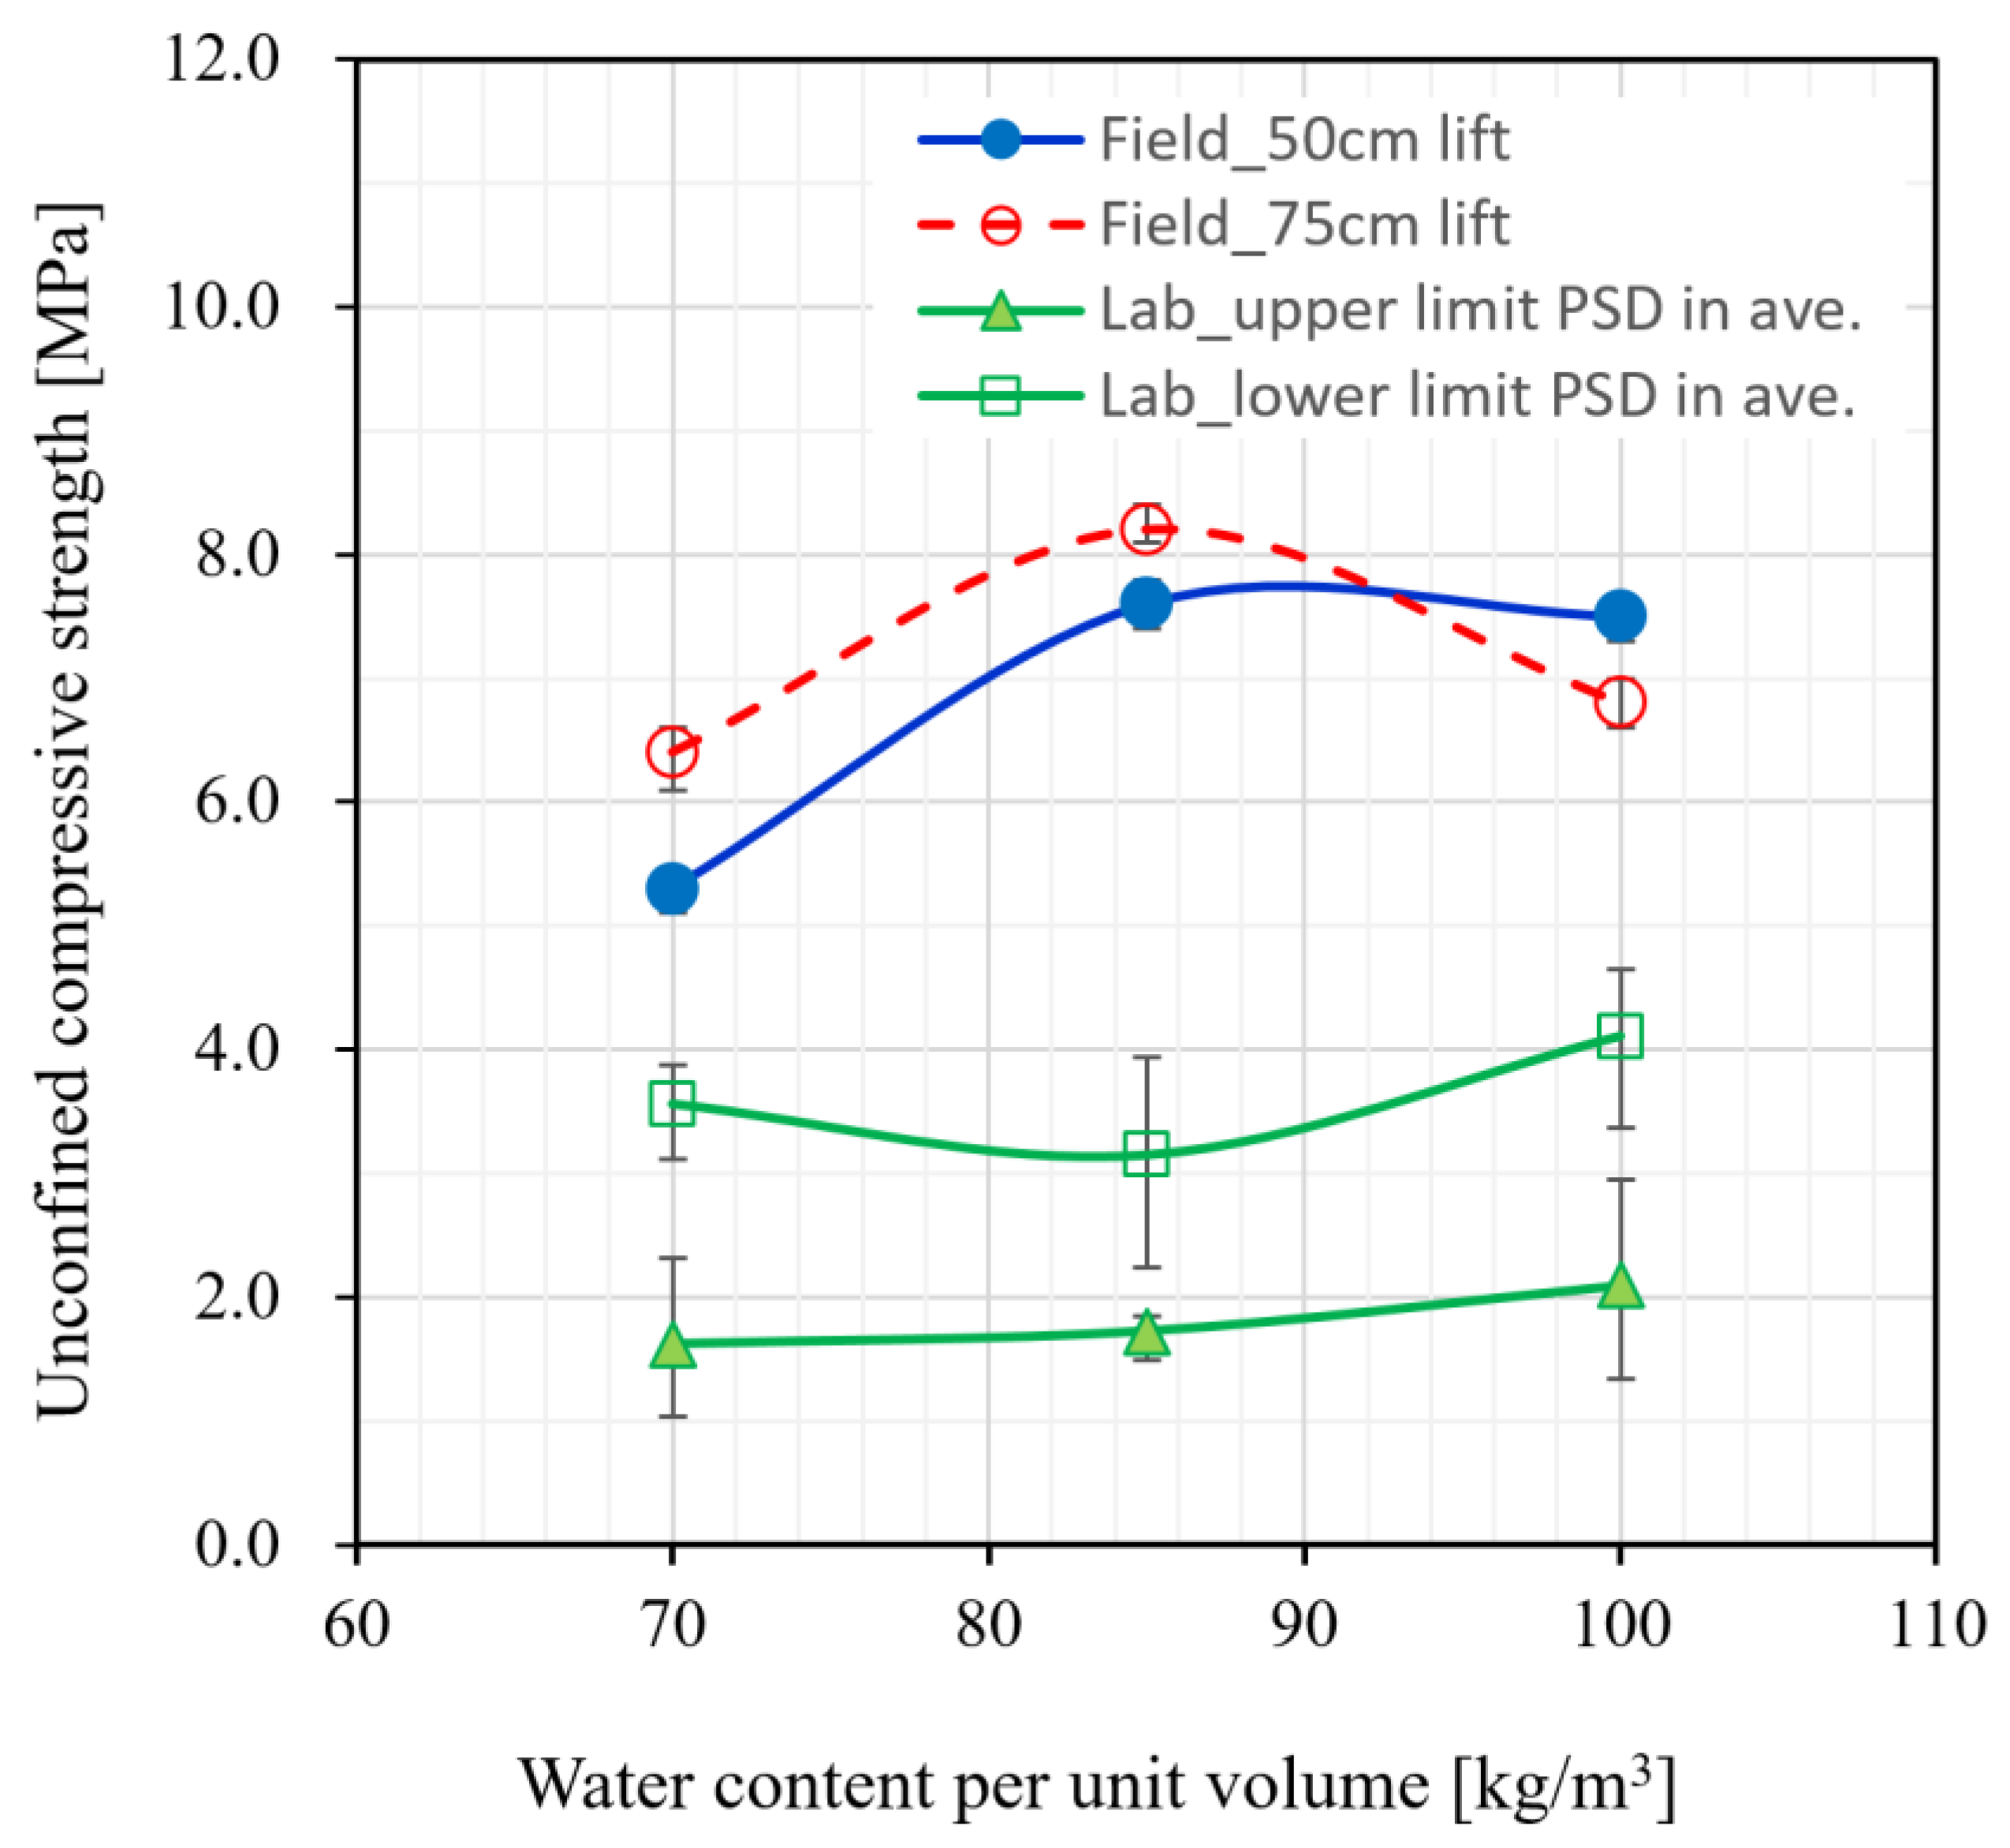
  • From the results of the uniaxial compressive strength test on the large indoor specimens, the compressive strength tended to increase very gently with the unit water content in general for both types of aggregate PSDs, i.e., the upper limit (fine) and lower limit (coarse), mixed with a unit cement content of 80 kg/m3 and three unit water contents of 70, 85, and 100 kg/m3, respectively. The strength range for the entire set of samples was 1.62–4.11 MPa, i.e., 3.15–4.11 MPa for the aggregate mix with the lower-limit PSD and 1.62–2.10 MPa for the aggregate mix with the upper-limit PSD. The uniaxial compressive strength of the aggregate mix with the lower limit PSD exceeded that of the aggregate mix with the upper limit PSD for the entire unit water content range. From the stress–strain relationship obtained from the uniaxial compressive strength test, the hardfill’s elastic modulus was found to be in the range of approximately 220 to 609 times the uniaxial compressive strength.
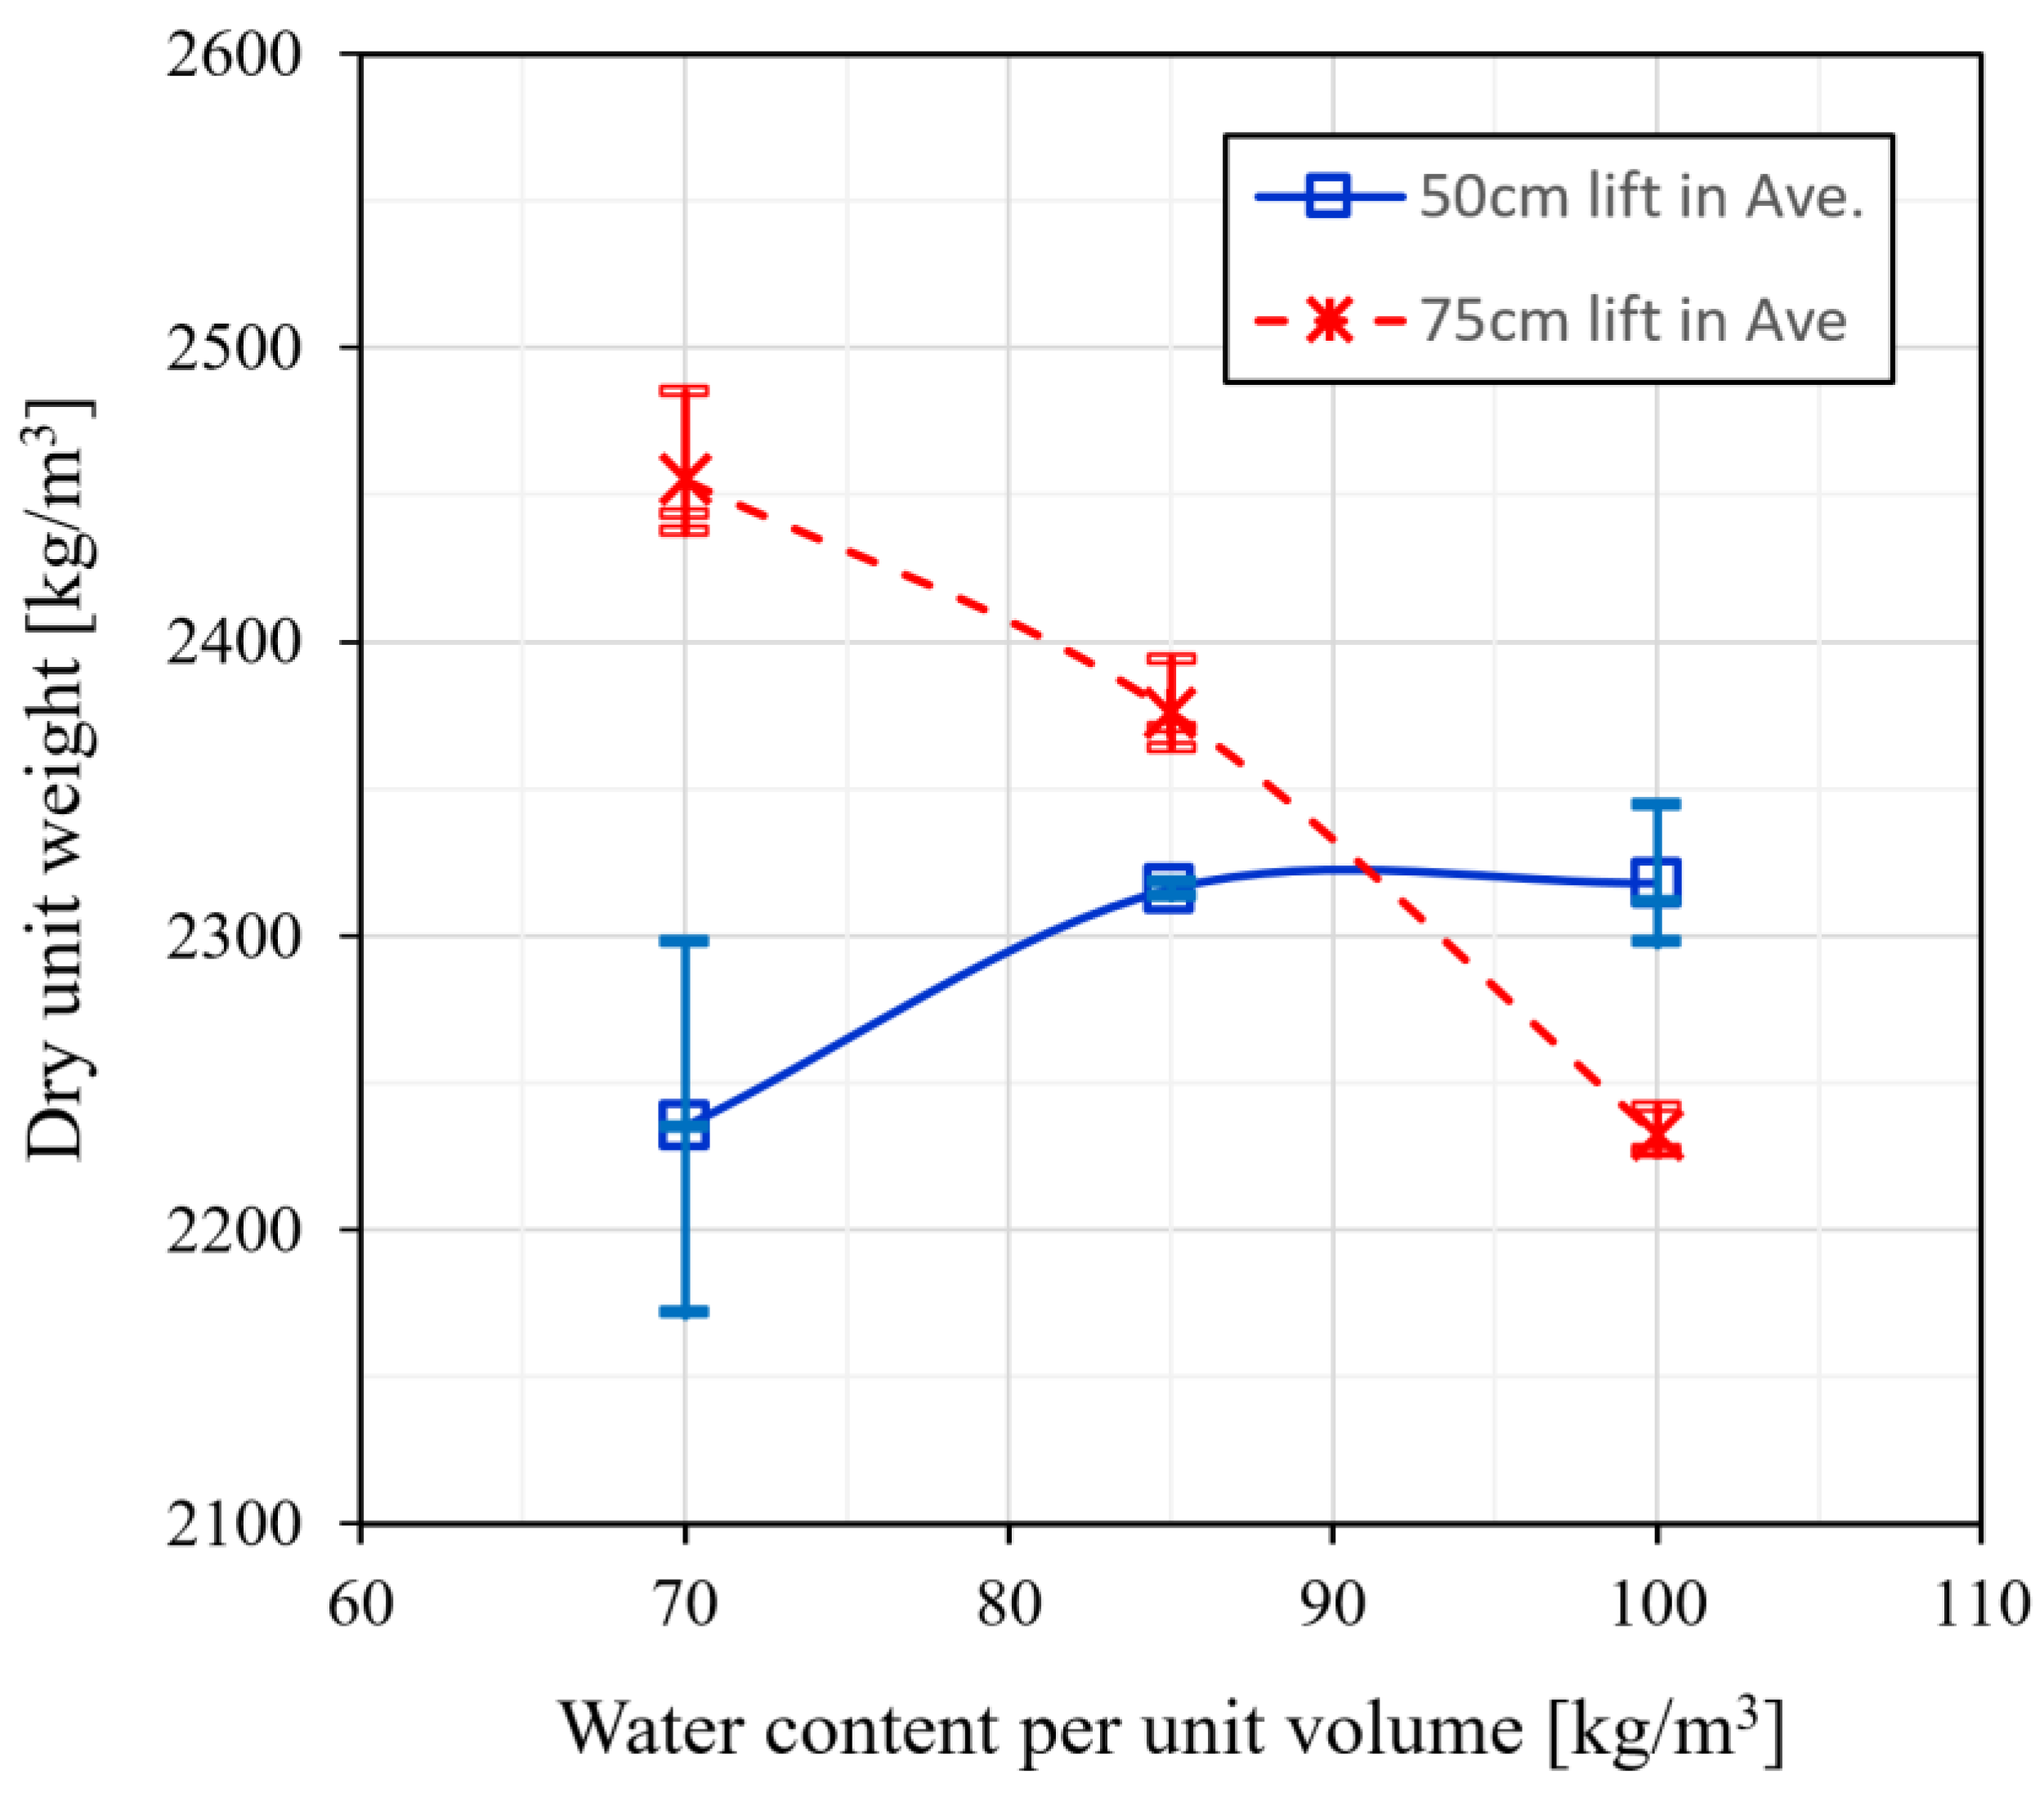
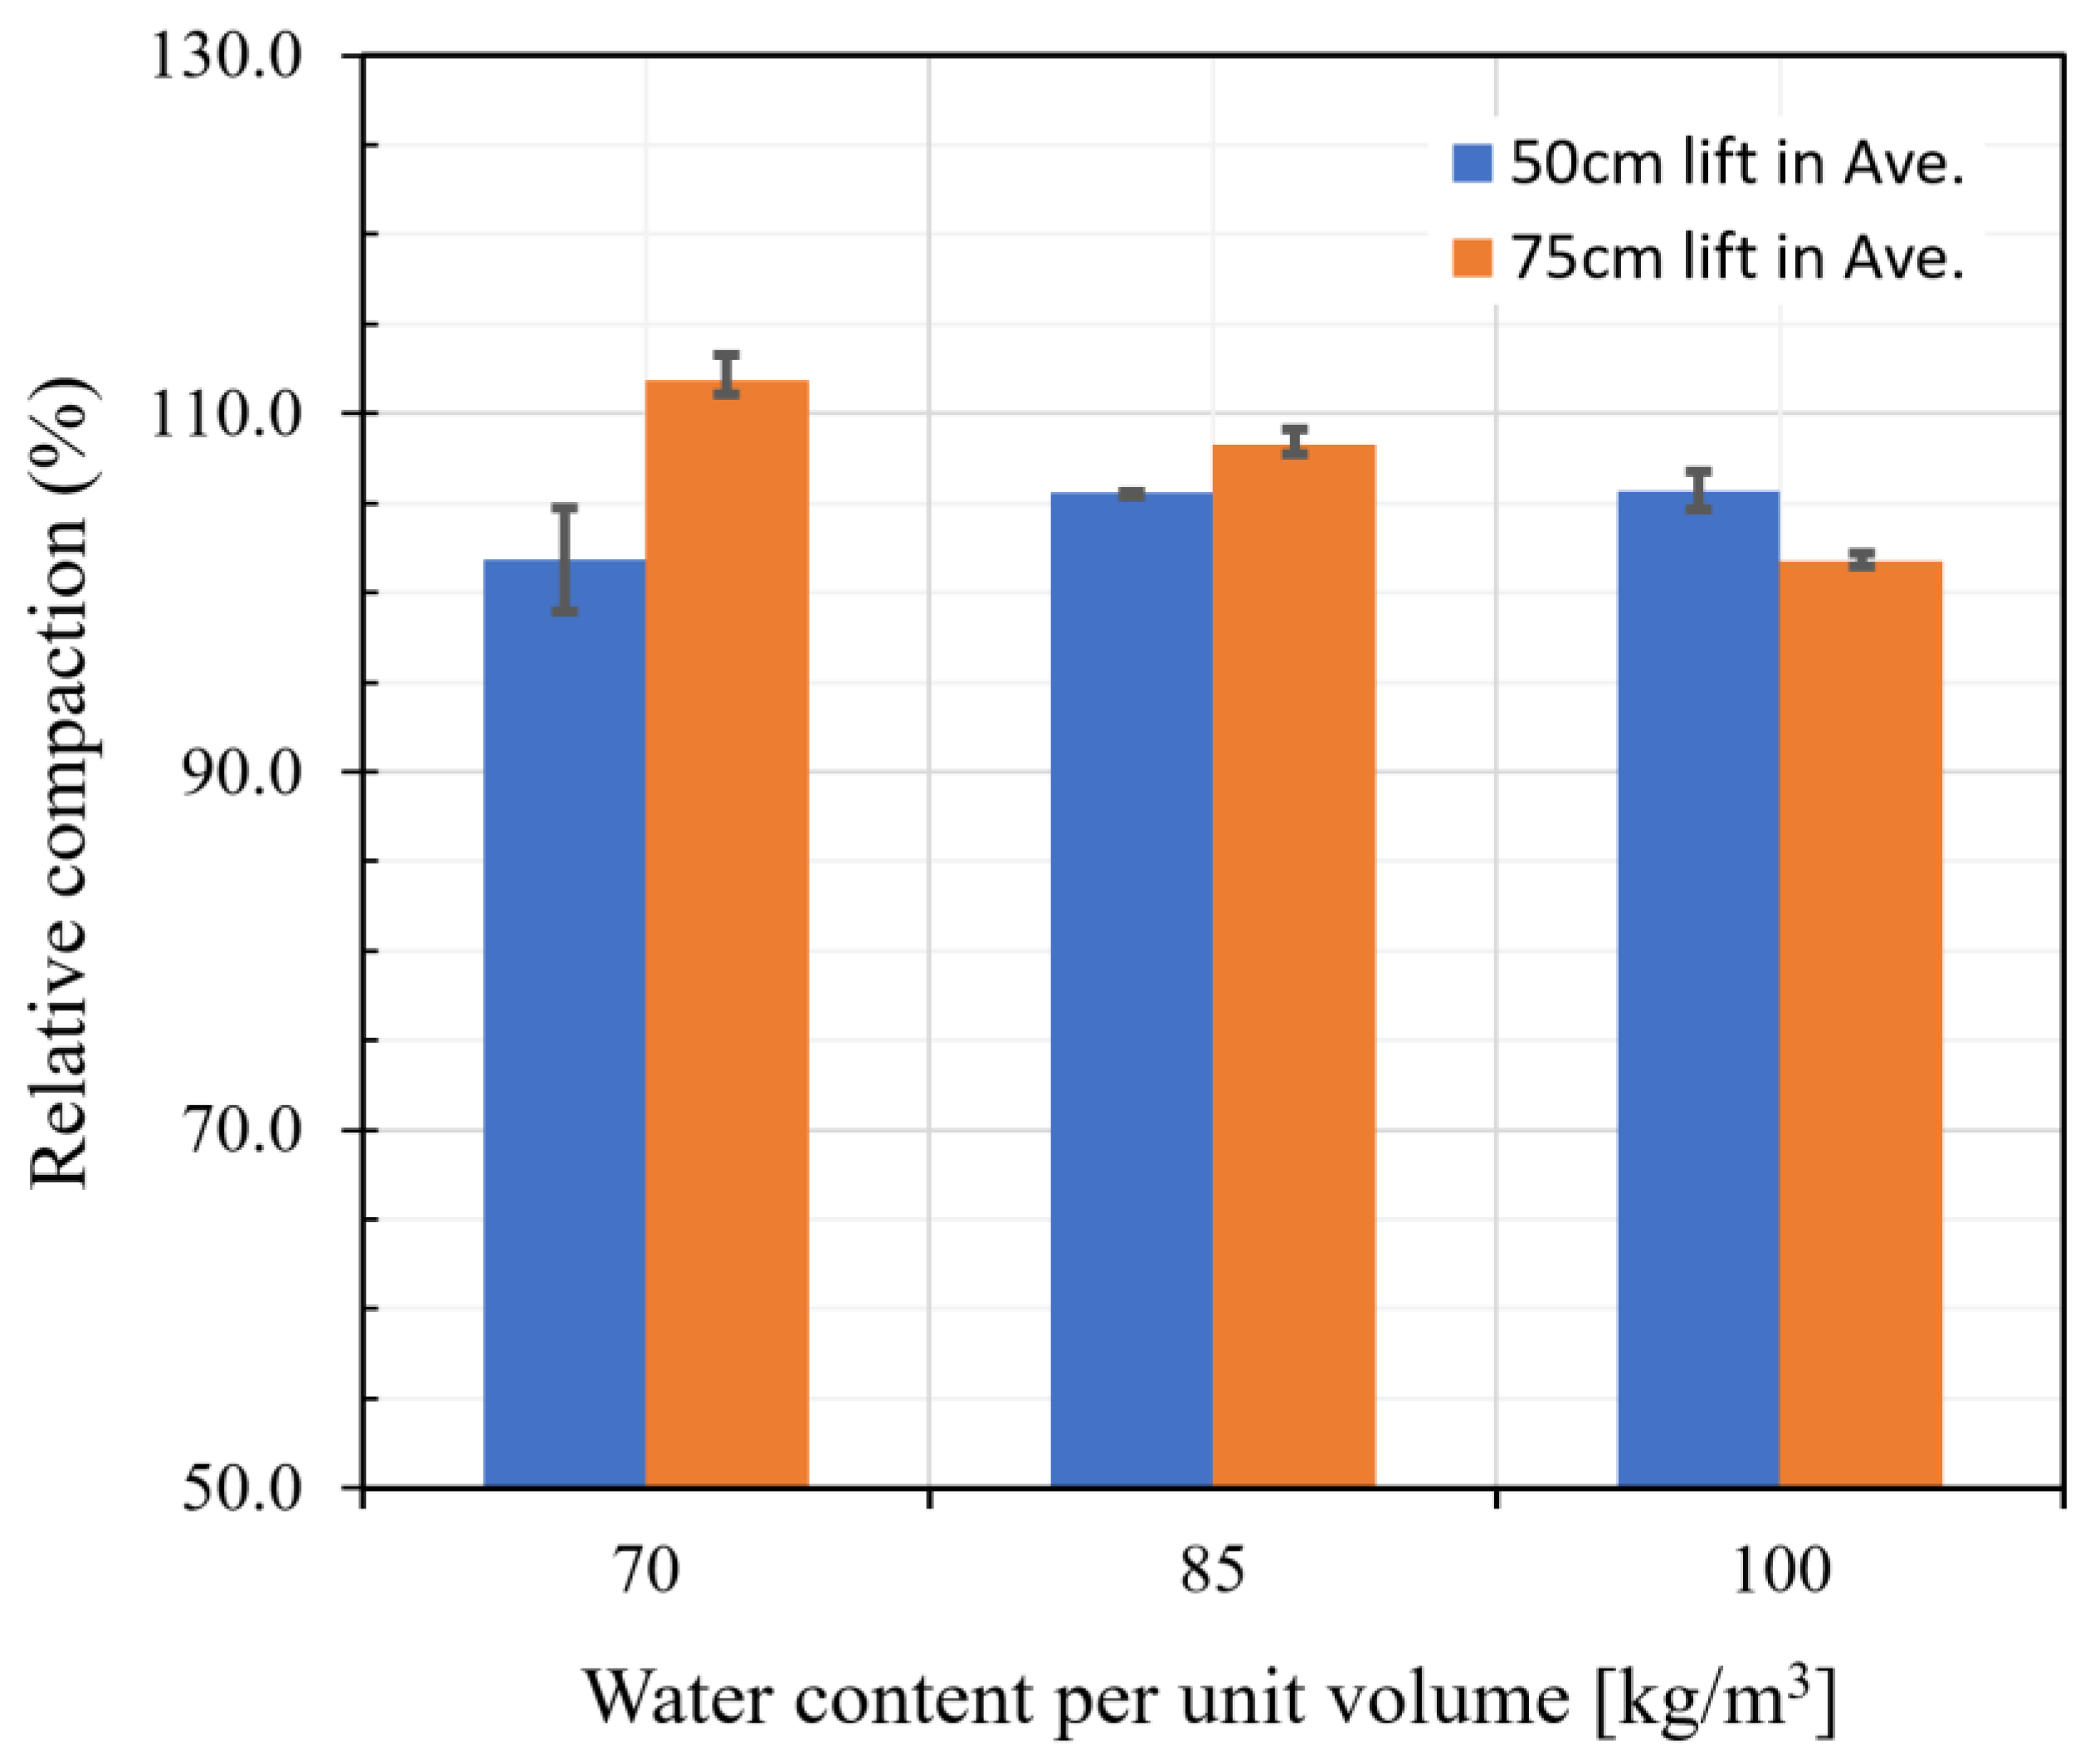
  • Field compaction was performed with a vibration roller on the same type of aggregates as used in the indoor laboratory test by matching the PSD and mixing ratio to the laboratory test conditions. The results of the uniaxial compressive strength test on the cores collected from the field compacted hardfill after 28 d showed that the strength range for the entire core was 5.30–8.20 MPa, i.e., more than twice as large as the indoor test results, suggesting that the strength measurement of a hardfill through a laboratory test can conservatively evaluate the strength of a field compacted hardfill.
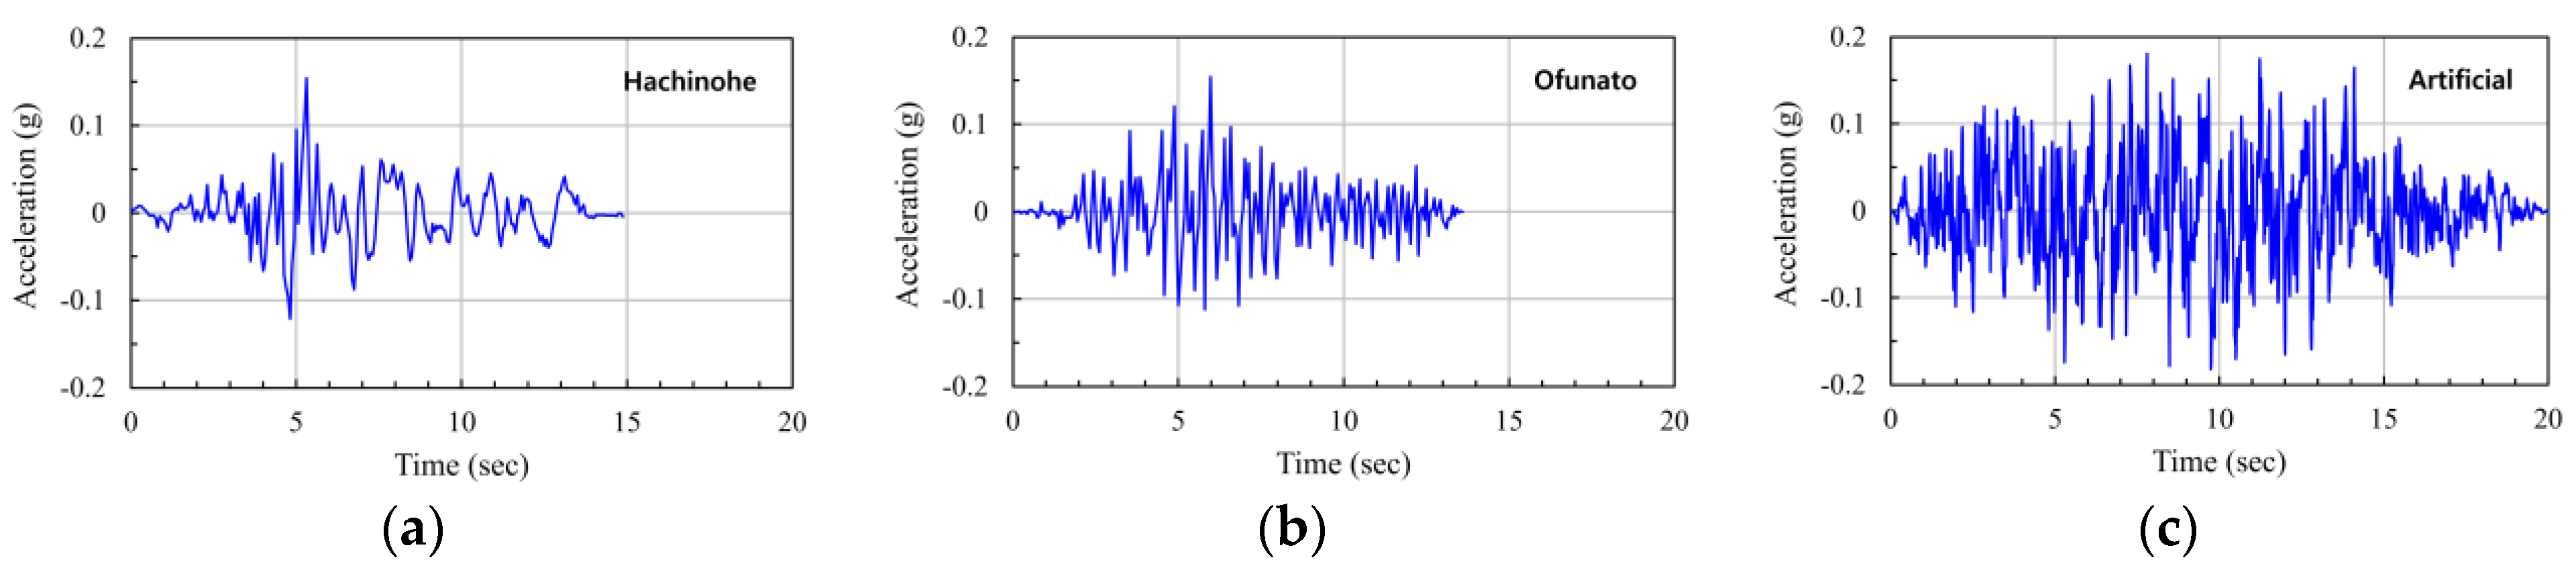
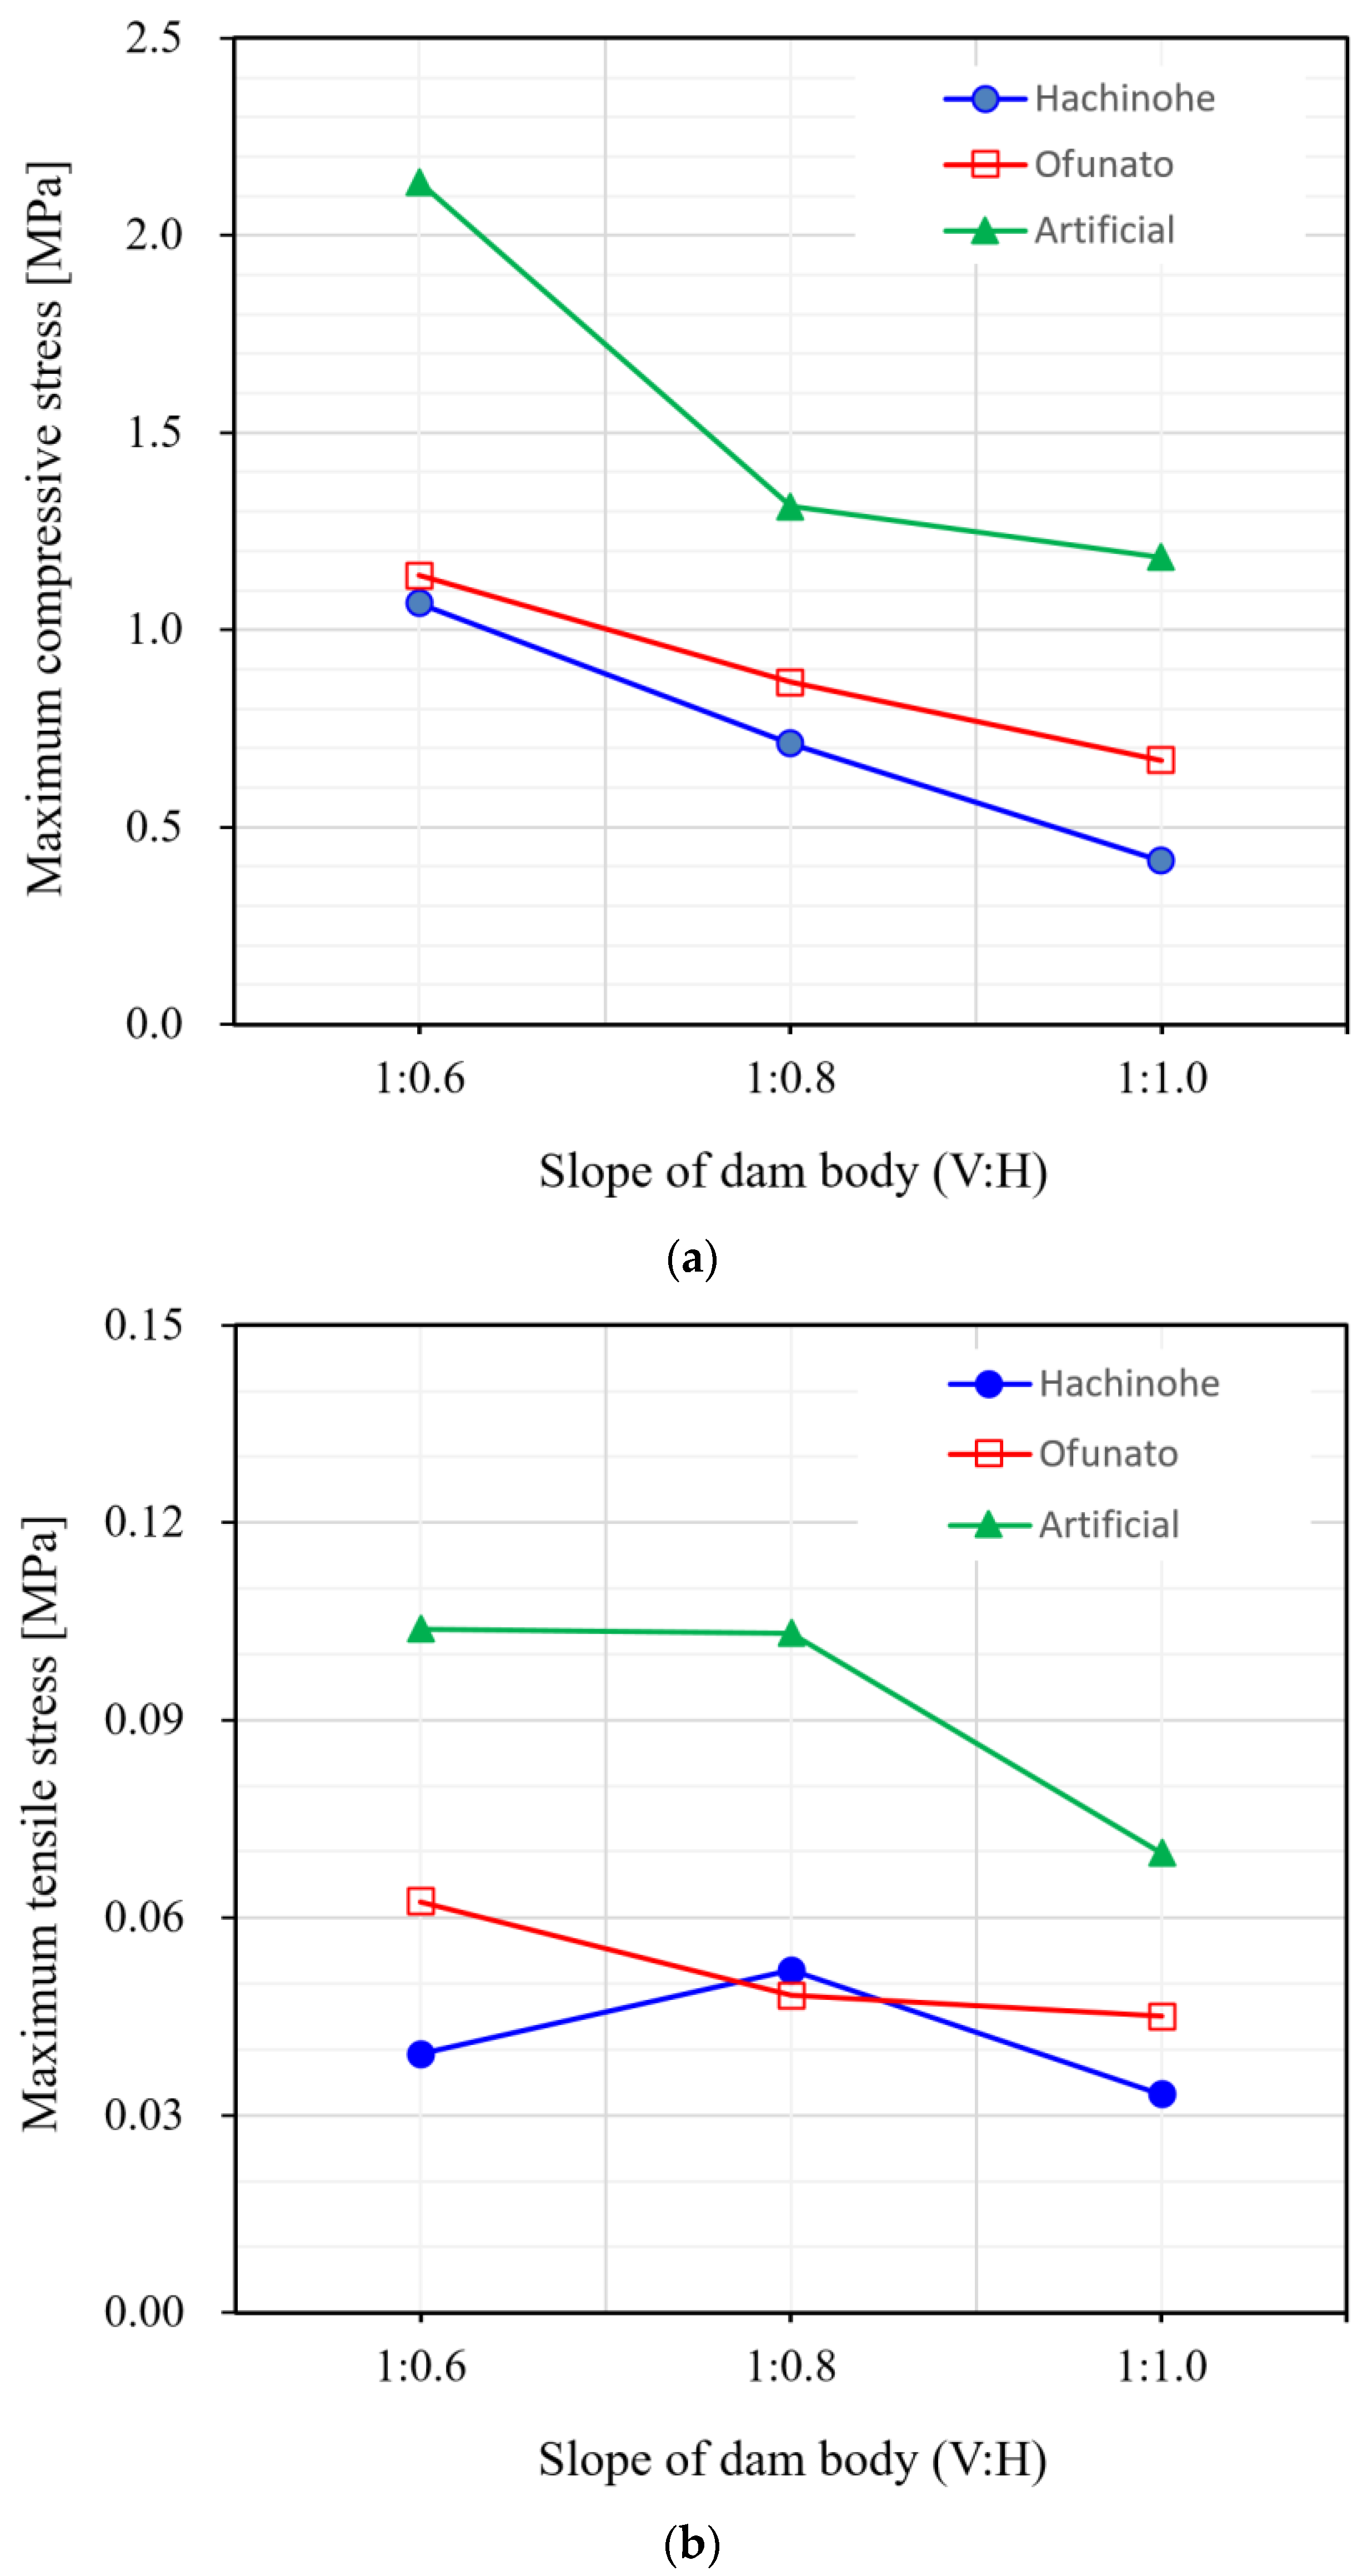
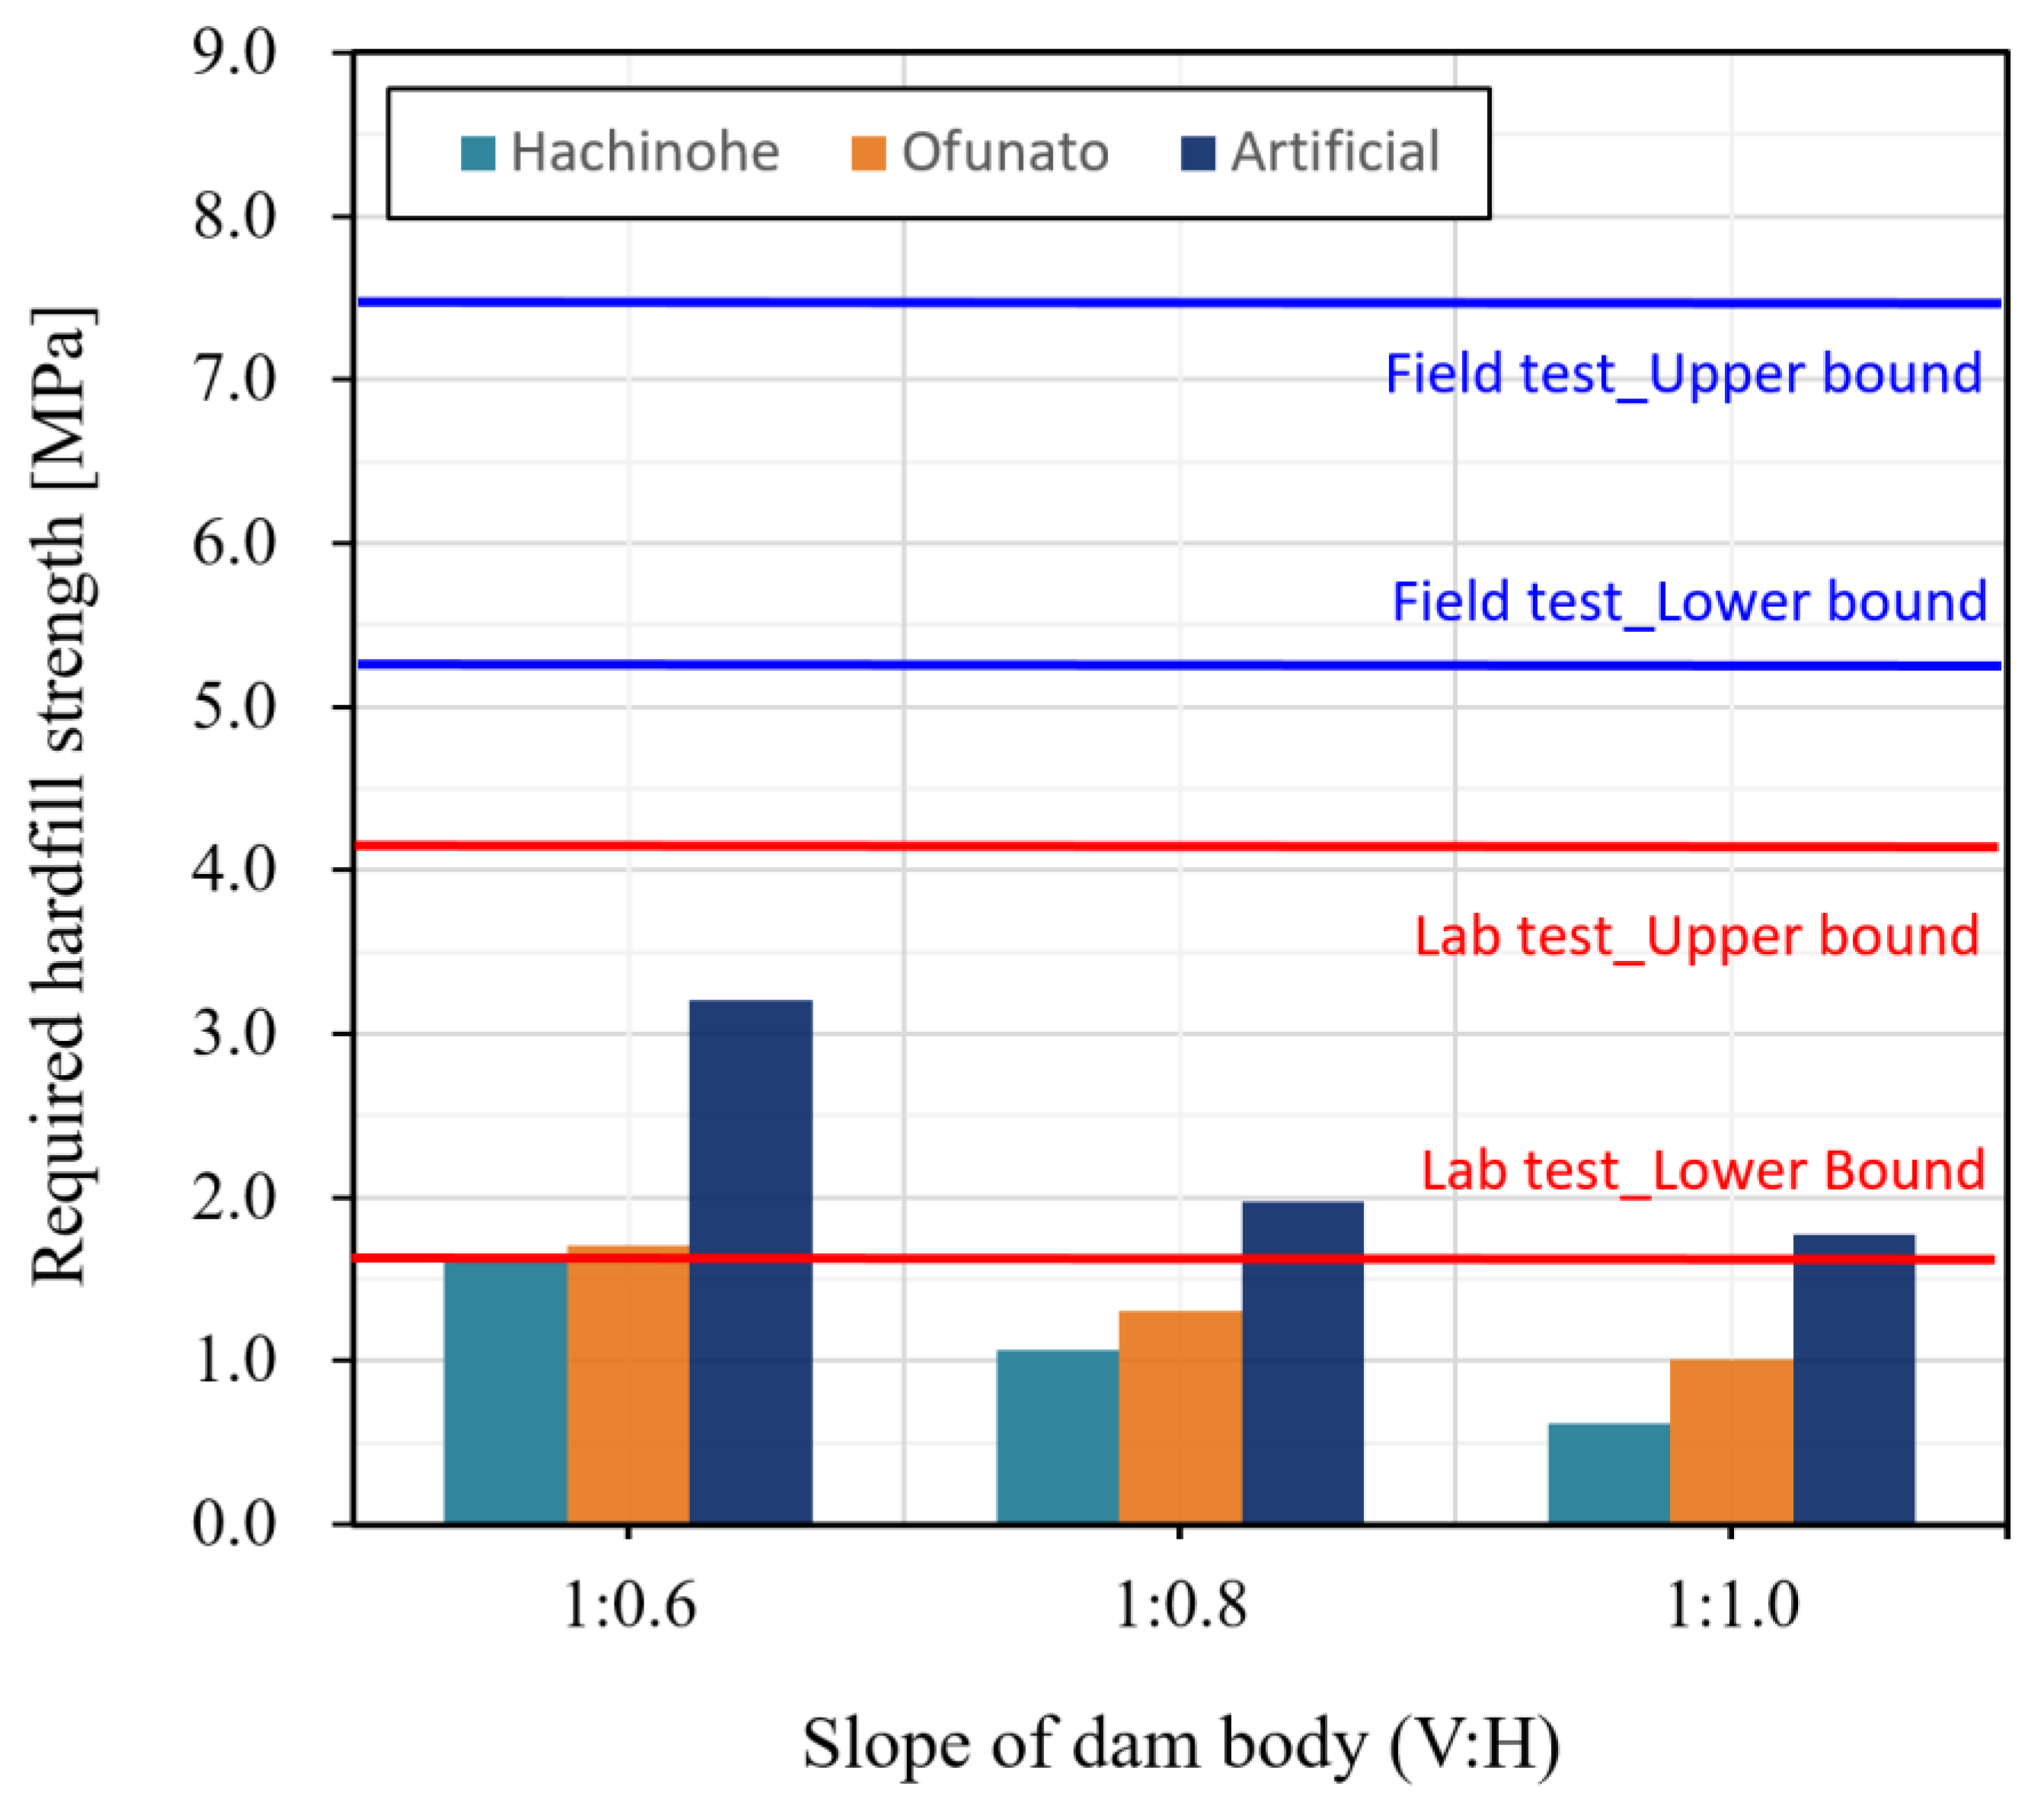
  • The results of the finite element analysis on the hardfill dams modeled using the parameters determined based on the laboratory test results showed that the largest value of the maximum tensile stress of 0.1 MPa occurs in the hardfill dam body with a slope of 1:0.6 when the artificial wave is applied. The maximum tensile stress tended to decrease overall as the slope of the dam body was relaxed. Furthermore, it was shown that the overall strength range obtained for the indoor laboratory specimens and field compaction cores exceeded the required strength of the hardfill, thereby securing seismic stability (except for the hardfill dam with a 1:0.6 slope to which artificial wave was applied).

Author Contributions

Formal analysis, W.C. and J.S.; Data curation, Y.K.; Writing—original draft, S.K.; Writing—review & editing, B.K. All authors have read and agreed to the published version of the manuscript.

Funding

This research was funded by the Korea Water Resources Corporation.

Institutional Review Board Statement

Not applicable.

Informed Consent Statement

Not applicable.

Data Availability Statement

Not applicable.

Acknowledgments

The authors wish to express their appreciation to the Korea Water Resources Corporation and the Expert Group for Earth and Environment Corporation for funding and supporting this work.

Conflicts of Interest

The authors declare no conflict of interest.

References

  1. Jia, J.; Lino, M.; Jin, F.; Zheng, C. The Cemented Material Dam: A New, Environmentally Friendly Type of Dam. Engineering 2016, 2, 490–497. [Google Scholar] [CrossRef]
  2. Kim, K.Y.; Park, H.G.; Jeon, J.S. Strength Characteristics of Cemented Sand and Gravel. J. Korean Geotech. Soc. 2005, 21, 61–71. (In Korean) [Google Scholar]
  3. Japan Dam Engineering Center. Engineering Manual for Design, Construction, and Quality Control of Trapezoidal CSG Dam; Japan Dam Engineering Center: Tokyo, Japan, 2012. (In Japan) [Google Scholar]
  4. Xia, B.; Ding, T.; Xiao, J. Life cycle assessment of concrete structures with reuse and recycling strategies: A novel framework and case study. Waste Manag. 2020, 105, 268–278. [Google Scholar] [CrossRef] [PubMed]
  5. Portland Cement Association. Guide for developing RCC Specifications and Commentary; Portland Cement Association: New York, NY, USA, 2000. [Google Scholar]
  6. U.S. Army Corps of Engineers. Engineering and Design Roller-Compacted Concrete; U.S. Army Corps of Engineers: Washington, DC, USA, 2006.
  7. Londe, P.; Lino, M. The faced symmetrical hardfill dam: A new concept for RCC. Int. Water Power Dam Constr. 1992, 44, 19–24. [Google Scholar]
  8. Toshio, H.; Tadahiko, F.; Hideaki, K.; Takashi, S. Design concept of trapezoid-shaped CSG dam. In Roller Compacted Concrete Dams; Routledge: London, UK, 2018; pp. 457–464. [Google Scholar]
  9. Cai, X.; Wu, Y.; Gui, X.; Ming, Y. Research review of the cement sand and gravel (CSG) dam. Front. Struct. Civ. Eng. 2012, 6, 19–24. [Google Scholar] [CrossRef]
  10. Chen, J.; Liu, P.; Xu, Q.; Li, J. Seismic analysis of hardfill dams considering spatial variability of material parameters. Eng. Struct. 2020, 211, 110439. [Google Scholar] [CrossRef]
  11. Yoon, J.S.; Park, W.Y.; Kim, K.T. Applicability analysis of Local Riverbed Aggregate for Hardfill Dam. Korean Soc. Civ. Eng. 2016, 10, 218–219. (In Korean) [Google Scholar]
  12. Guillemot, T.; Lino, M. Design and Construction Advantages of Hardfill Symmetrical Dams-Case Study: Safsaf Dam In Eastern Algeria. In Proceeding of the 6th International Symposium on Roller Compacted Concrete (RCC) Dams, Zaragoza, Algeria, 23–25 October 2012. [Google Scholar]
  13. Yuan, P.; He, Y.; Wang, Y. Study on seismic safety of Poshitougou flood intercepting dam. In IOP Conference Series: Earth and Environmental Science; IOP Publishing: Bristol, UK, 2021; Volume 861, pp. 072–073. [Google Scholar] [CrossRef]
  14. Karimi, S.; Aghajani, H.F. A New Type of Cemented Sand-Gravel (CSG) Mixtures for Water-Tightening of Hardfill Dams. Res. Sq. Platf. LLC 2021. [Google Scholar] [CrossRef]
  15. Zheng, C. Progress on Cemented Material Dams in CHINA. In Proceedings of the International Symposium on the State-Of-The-Art Dam Construction Technology, Daejoen, Republic of Korea, 5–6 November 2015. [Google Scholar]
  16. Ayagh, A.G.; Mohammadian, A. Optimum characteristic compressive strength for cmds (case study: Dasht-e-palang dam). In Proceedings of the 2017 International Conference on Long-Term Behaviour and Environmentally Friendly Rehabilitation Technologies of Dams, Tehran, Iran, 17–19 October 2017; pp. 243–250. [Google Scholar] [CrossRef]
  17. Karimizad, N.; Teshnizi, E.S.; Mahdad, M.; Karimiazar, J. Investigating the design features of CSG dams. JOJ Sci. 2020, 3, 555588. [Google Scholar]
  18. Kim, K.Y. The Factors Affecting the Unconfined Compressive Strength of C.S.G Materials. J. Korean Geotech. Soc. 2006, 22, 33–45. (In Korean) [Google Scholar]
  19. Kim, K.Y.; Jeon, J.S.; Kim, Y.S. Laboratory Mix Design of C.S.G Method. J. Korean Geotech. Soc. 2006, 22, 27–37. (In Korean) [Google Scholar]
  20. Omae, S.; Sato, N.; Oomoto, I. Dynamic properties of CSG. In Proceedings of the International Symposium on Roller Compacted Concrete (RCC) Dams, Madrid, Spain, 17–19 November 2003; pp. 511–518. [Google Scholar]
  21. Liu, Z.; Jia, J.; Feng, W.; Ma, F.; Zheng, C. Shear Strength of Cemented Sand Gravel and Rock Materials. Sains Malays. 2017, 46, 2101–2108. [Google Scholar] [CrossRef]
  22. Fujisawa, T.; Nakamura, A.; Kawasaki, H.; Hirayama, D.; Yamaguchi, Y.; Sasaki, T. Material Properties of CSG for the Seismic Design of Trapezoid-Shaped CSG Dam. In Proceedings of the 13th World Conference on Earthquake Engineering, Vancouver, BC, Canada, 1–6 August 2004; pp. 292–296. [Google Scholar]
  23. Peng, Y.; Yuan, Y. Analysis on the Dynamic Properties of Hardfill Materials. J. Appl. Sci. Eng. Innov. 2014, 1, 54–58. [Google Scholar]
  24. Ren, H.; Cai, X.; Wu, Y.; Jing, P.; Guo, W. A Study of Strength Parameter Evolution and a Statistical Damage Constitutive Model of Cemented Sand and Gravel. Materials 2023, 16, 542. [Google Scholar] [CrossRef] [PubMed]
  25. Farshbaf Aghajani, H.; Soltani-Jigheh, H.; Salimi, M.; Karimi, S.; Estekanchi, V.; Ahari, R.A. Investigating the strength, hydraulic conductivity, and durability of the CSG (cemented sand-gravel) check dams: A case study in Iran. SN Appl. Sci. 2022, 4, 169. [Google Scholar] [CrossRef]
  26. Guo, L.; Zhang, J.; Guo, L.; Wang, J.; Shen, W. Research on profile design criteria of 100 m CSG dams. Case Stud. Constr. Mater. 2022, 16, e01137. [Google Scholar] [CrossRef]
  27. Peng, Y. Study on Structural Characteristics of CSG Dam. Int. J. Sci. 2014, 1, 70–74. [Google Scholar]
  28. Zafeiratos, E.; Psycharis, I.; Papanicolaou, P. Dynamic behavior of faced symmetrical hardfill dams. In Proceedings of the 11th ICOLD European Club Symposium, Crete, Greece, 2–4 October 2019. [Google Scholar]
  29. Standard No. ASTM D698-12:2021; Standard Test Method for Laboratory Compaction Characteristics of Soil Using Standard Effort (12,400 ft-lbf/ft3 (600 kN-m/m3)). American Society for Testing and Materials (ASTM): West Conshohocken, PA, USA, 2021.
  30. Standard No. ASTM D1557-12:2021; Standard Test Methods for Laboratory Compaction Characteristics of Soil Using Modified Effort (56,000 ft-lbf/ft3 (2700 kN-m/m3)). American Society for Testing and Materials (ASTM): West Conshohocken, PA, USA, 2021.
  31. Standard No. KS F 2314:2018; Standard Test Method for Unconfined Compression Test of Soils. Korean Standards Association: Seoul, South Korea, 2013. (In Korean)
  32. Standard No. KS F 2311:2016; Standard Test Method for Density of Soil in Place by the Sand Cone Method. Korean Standards Association: Seoul, South Korea, 2016. (In Korean)
  33. Standard No. ASTM C42/C42M:2020; Standard Test Method for Obtaining and Testing Drilled Cores and Sawed Beams of Concrete. American Society for Testing and Materials (ASTM): West Conshohocken, PA, USA, 2020.
  34. Standard No. ASTM C39/C39M:2021; Standard Test Method for Compressive Strength of Cylindrical Concrete Specimens. American Society for Testing and Materials (ASTM): West Conshohocken, PA, USA, 2021.
Figure 1. Particle size distribution of aggregate.
Applsci 13 02492 g001
Figure 2. Preparation of a large specimen for unconfined compressive strength test. (a) Material placement; (b) material mixing; (c) sample compaction; (d) sample curing; (e) large specimen; (f) uniaxial compressive strength test.
Applsci 13 02492 g002
Figure 3. Field test construction and core collection. (a,b) Material transportation and placement; (c) compaction by vibration roller; (d) measurement of lift thickness; (e) measurement of field compaction (sand cone method); (f) curing after compaction; (g) core collection; (h) core aged 28 d.
Applsci 13 02492 g003
Figure 4. Cross-sections of dams for finite element (FE) analysis. (a) Dam slope gradient of 1:0.6 (vertical-to-horizontal ratio); (b) dam slope gradient of 1:0.8 (vertical-to-horizontal ratio); (c) dam slope gradient of 1:1.0 (vertical-to-horizontal ratio).
Applsci 13 02492 g004aApplsci 13 02492 g004b
Figure 5. Input seismic waves used in FE analysis. (a) Hachinohe wave; (b) Ofunato wave; (c) artificial wave.
Applsci 13 02492 g005
Figure 6. Change in dry unit weight according to hardfill unit water content.
Applsci 13 02492 g006
Figure 7. Change in hardfill’s uniaxial compressive strength according to unit water content.
Applsci 13 02492 g007
Figure 8. Relationship between unconfined compressive strength in elastic range and elastic modulus of hardfill.
Applsci 13 02492 g008
Figure 9. Compaction results for field-constructed hardfill (dry unit weight).
Applsci 13 02492 g009
Figure 10. Relative compaction of field-constructed hardfill.
Applsci 13 02492 g010
Figure 11. Uniaxial compressive strength of field-constructed hardfill (28 d of age).
Applsci 13 02492 g011
Figure 12. Results of FE analysis (stress distributions). (a) Compressive stress of Hachinohe wave (1:0.6); (b) tensile stress of Hachinohe wave (1:0.6); (c) compressive stress of Ofunato wave (1:0.8); (d) tensile stress of Ofunato wave (1:0.8); (e) compressive stress of artificial seismic wave (1:1.0); (f) tensile stress of artificial seismic wave (1:1.0).
Applsci 13 02492 g012
Figure 13. Results of FE analysis (maximum compressive and tensile stresses). (a) Maximum compressive stress. (b) Maximum tensile stress.
Applsci 13 02492 g013
Figure 14. Results of FE analysis (required hardfill strength).
Applsci 13 02492 g014
Table 1. Physical properties of cement.
Specific GravityFineness (cm2/g)Setting Time (min)Compressive Strength (MPa)
3.173475InitialFinal7 d28 d
20529544.459.3
Table 2. Mix ratios for large specimen.
AggregateCement Content per Unit Water Content (kg/m3)Water Content per Unit Water Content (kg/m3)
Upper-limit (fine) PSD8070, 85, 100
Lower-limit (coarse) PSD8070, 85, 100
Table 3. Estimation of compaction energy for large specimen.
Compaction energy of vibration roller per unit time
(E0p, J/min)
E 0 p = 2 a W + F 2 f = 983,443   J / min
where, a: vibrating width (=0.00131 m), W: weight of vibration roller (=10.6 t), F: Average vibrating force (17,900 kgf) and f: Frequency (1920 Hz)
Compaction energy in field E 0 = E 0 p n   t p = 354,040   J = 354   kJ
where, n: number of roller passes (=6) and tp: average time per compaction (=0.06 min)
Compaction energy of hammer drill per unit time
(E0l, J/min)
E0l = [single impact energy × number of impact per min] = 64,500 J/min
Compaction energy for large specimen E l = E 0 l L t l
where, L: number of compaction layer (=4) and tl: average compaction time per layer
Compaction time per layer for large specimen t l = E l E 0 l L   = 1.37   min = 82   s
Compaction energy of vibration roller per unit time
(E0p, J/min)
E 0 p = 2 a W + F 2 f = 983,443   J / min
where, a: vibrating width (=0.00131 m), W: weight of vibration roller (=10.6 t), F: Average vibrating force (17,900 kgf) and f: Frequency (1920 Hz)
Table 4. Conditions of field test construction.
Material (Mixing Ratio)
AggregatePSD between upper- and lower-limit PSD with 80 mm max. particle size
Cement content per unit volume80 kg/m3
Water content per unit volume70, 85, 100 (kg/m3)
Hardfill Test Construction
SizeOne fill lift with a floor area of 19 m width and 44 m length, which was partitioned into six parts for a total of six test cases
Lift thickness50, 75 (cm)
CompactionEight passes with a vibration roller (six vibrated passes and two non-vibrated passes)
Table 5. Finite element method (FEM) model parameters for the ground.
Unit Weight
(kN/m3)
Cohesion
(kPa)
Friction
Angle (°)
Elastic
Modulus
(MPa)
Poisson’s RatioP-Wave
Velocity
(m/s)
S-Wave
Velocity
(m/s)
Shear
Modulus
(MPa)
Dashpot
Coefficient
CP (=ρVp)CS (=ρVs)
Soil18.0525200.3845063.27.2810114
Soft rock24.02003415000.272000496.1590.648001191
Moderate rock25.03503740000.242300803.21612.957502008
Hard rock26.020004480000.2030001132.33333.378002944
Disclaimer/Publisher’s Note: The statements, opinions and data contained in all publications are solely those of the individual author(s) and contributor(s) and not of MDPI and/or the editor(s). MDPI and/or the editor(s) disclaim responsibility for any injury to people or property resulting from any ideas, methods, instructions or products referred to in the content.

