Abstract
Chronic kidney disease (CKD) may result in end-stage renal disorder and an increased mortality rate. Presently, kidney transplantation represents the only definitive treatment to restore normal life expectancy. Nevertheless, there is an elevated risk of organ rejection in the short–medium term after surgery. This preclinic study proposes the optimization of an innovative, fast, non-invasive, and cheap thermal desorption-gas chromatograph–mass spectrometry (TD-GC–MS) protocol, which provides simple monitoring of the respiratory profile of CKD-affected patients, before and during the first year after surgery, and aims to preemptively predict the rejection of the transplanted kidney. Twenty volatile organic compounds (VOCs), known as targets and, which are representative of the major classes of molecules discriminating between CKD-affected patients and healthy individuals, were selected from the literature, and employed to optimize the methodology. Calibration curves, linearity concentration ranges, the limit of detection (LOD), and the limit of quantification (LOQ) were estimated for the chosen molecules as well as the intraday and interday reproducibility of the method. The applicability of the TD-GC–MS developed approach was tested by analyzing the breath of healthy and pathological subjects using the ReCIVA® device. Sixty-seven molecules were identified, and between these, thirteen of the twenty selected compounds were quantified and were identified to have high prognostic values.
1. Introduction
Kidney failure is a major global health concern and is recognized as an extensive public health problem. In most cases, a kidney transplant represents the only strategy to improve the quality of life and life expectancy of CKD-affected patients [1].
In clinical practices, blood and urine tests, glomerular filtration rates, imaging, and kidney biopsies [2] are used to detect chronic kidney failure [3] and to diagnose transplanted kidney rejections. Some of these methods are complex, expensive, invasive, time-consuming, require skilled technicians, and may cause pain in some individuals.
In the last few years, exhaled breath analysis has captured the interest of scientists and clinicians, providing important information regarding crucial biochemical changes linked to certain pathologies [4,5,6,7,8,9,10]. Exhaled breath comprises condensates (EBCs; cytokines, H2O2, isoprostanes, and leukotriene), volatile inorganic compounds (e.g., O2, NO, CO2), and, notably, organic compounds [11,12,13], which are produced by cellular metabolism. These enter the blood, travel to the lungs, and are finally exhaled through the respiratory tract. When a person suffers from a certain disease, the components in the exhaled air change and can provide useful clues for clinical diagnoses and/or monitoring of a patient’s condition.
Breath analysis involves collecting breath samples from patients, and their subsequent analysis, and data processing. The advantages of breath analysis are that it is safe, non-invasive, reproducible, acceptable for patients, easy to operate, and fast. Another benefit is that samples are readily obtained, and compared to blood and urine collection, breath analysis is less time-consuming and requires a smaller sample [10]. Therefore, breath analysis is unique compared to traditional technologies, making it a research hotspot in the field of disease diagnosis, even though it is an old technique for diagnosing physical conditions. Hippocrates (460–370 BCE) first described it in his “treatise on respiratory aromas and diseases”. Over the past thirty years, scientists have identified thousands of different breath organic compounds, employing emerging analytical techniques, including proton-transfer-reaction–mass spectrometry (PTR–MS) [14,15,16,17], proton-transfer-reaction time-of-flight–mass spectrometry [18,19,20,21], selected ion stream tube–mass spectrometry (SIFT–MS) [22,23,24,25,26], laser spectroscopy [27,28], ion mobility spectrometry [29,30,31] sensor array [32], and electronic nose technology [33,34,35,36], even if the gold standard for detecting respiratory biomarkers is a combination of gas chromatography and mass spectrometry [37,38,39]. However, independently of the diagnostic technique employed, several studies have demonstrated that breath analysis may be a promising strategy for the detection and follow-up of kidney disease.
Nitrogen-containing VOCs, such as ammonia and amines, have been shown to be elevated in the breath of subjects with renal failure [40,41,42]. From ancient times, in fact, a “fishy-like” smell of exhaled breath was attributed to renal disorders [43], and ammonia and trimethyl amine (TMA) were used as useful biomarkers for real-time monitoring of hemodialysis efficacy [41,42]. Other than for the nitrogen-containing compounds, little is known about other classes of VOCs, including, sulfur compounds, ketones, alkenes, and aliphatic hydrocarbons, with short and long chains (e.g., propane, butane, pentane, hexane, decane, etc.), organic acids (e.g., acetic acid, butanoic acid, etc.), benzene derivates (e.g., toluene, xylenes, etc.), halogen-containing, and alcohols, whose concentrations in human breath change in response to the onset of specific pathologies [44,45,46], and have been shown to be essential in the fingerprint breath profile of healthy subjects [47,48,49,50,51].
This preclinical study aims to identify a pattern of VOCs that is useful in discriminating between CKD patients and healthy subjects through the TD-GC–MS analysis of breath. Furthermore, we propose a new non-invasive method that could detect the early rejection of kidneys in patients undergoing a kidney transplant.
The experimental procedure was established to employ a mixture of standard compounds, which were recognized as targets or selected as a representative of the major classes of molecules essential in the detection of CKD. Moreover, we expect an evolution of the breath profile towards that of a healthy subject, where successful transplantation and acceptance by the organism of the transplanted organ has occurred; thus, representative molecules of the major classes of compounds characterizing healthy breath were also incorporated into the study. Standard solutions of different concentrations were adsorbed by adsorbent tubes and then, thermally desorbed, before being injected and analyzed by GC–MS to test for, each selected compound, the linearity, the intraday, and the interday reproducibility of the developed method. The LOD and LOQ were also estimated for each chosen molecule. The TD tube desorption conditioning time and storage were also optimized.
Finally, the breath of twenty healthy subjects and ten CKD-affected patients was sampled with a ReCIVA® device and, then, analyzed through the optimized protocol, prior to undergoing a kidney transplant from a living organ donor.
2. Materials and Methods
2.1. VOCs GC-MS Analyses
Following the previously optimized protocols [49], VOCs were collected in stainless steel TD tubes, which are able to retain C4–C30 compounds (Markes International, Llantrisant, UK; inert biomonitoring sorbent tubes), were desorbed with a thermal desorber (Unity-xr, Markes International), directly connected to the gas chromatograph with a heated transfer line. The tube was heated for 10 min at 220 °C and the desorbed VOCs were directly transferred in the gas chromatograph injector at 200 °C, operating in split mode (50% in and 50% out), utilizing helium as a carrier gas, at a linear velocity of 0.5 cm·s−1. The separation and quantification of the desorbed VOCs were performed with a gas chromatograph (Clarus 680, PerkinElmer, Boston, MA, USA), coupled with a quadrupole mass spectrometer (Clarus SQ 8T, PerkinElmer, Boston, MA, USA). A 60 m × 0.25 mm i.d., 1.4 µm film thickness, capillary column Rtx®-VMS (Restek, Bellefonte, PA, USA) was utilized with the following oven temperature program: 50 °C for 5 min, then increased by 10 °C·min−1 to 160 °C, 5 min at 160 °C, increased by 10 °C·min−1 to 220 °C, and 5 min at 220 °C. The temperatures of the transfer line and the ion source of the quadrupole were 280 °C and 220 °C, respectively. The MS was performed at 70 eV electron impact ionization energy, in full-scan mode (SCAN) with a scan range of 40–250 amu. SCAN monitoring mode was used for compound identification and quantification in the case of acetonitrile. Quantification of the other selected analytes was made from extracted ion chromatogram (XIC) and obtained in SCAN mode. The Clarus SQ8 GC-MS software (PerkinElmer) allowed the acquisition and elaboration of data.
To prevent memory effects, after each analysis, two empty TD tubes (without the adsorbent phase) were analyzed to remove any eventual residues of the previous sample from the thermal desorber and analysis apparatus.
After each use, the TD tubes were conditioned at 340 °C for 3 h, as recommended by the producer, capped, sealed with parafilm, and stored at 8 °C.
2.2. Linear Regression Test, LOD, and LOQ of the GC-MS Method
After reviewing the literature, twenty VOCs, which were recognized as targets, or as representatives of the major class of molecules, essential to the elaboration of the breath of the CKD-affected patients and/or healthy subjects were selected, and are reported in Table 1.

Table 1.
Selected VOCs.
Stock solutions (1 mg·mL−1) of each chosen volatile molecule (purity ≥ 97%; Sigma-Aldrich, Milan, Italy) were prepared in methanol (purity ≥ 98%; Sigma-Aldrich), except for hydrocarbons, which were solubilized in hexane (purity ≥ 98%; Sigma-Aldrich), diluted to prepare working solutions, and stored at 8 °C.
A working solution (1 µL), containing authentic standards (5, 10, 15, 25, 50, and 100 ng·mL−1), was added into a biomonitoring sorbent tube and analyzed, following the procedure described above. The identification of the VOCs was performed with the MS database of the National Institute of Standards and Technology (NIST).
The proposed GC–MS method was tested by linear regression analysis, plotting the peak area against the amount (ng) of each analyte in the biomonitoring sorbent tube. The LOD and LOQ were determined by LOD ≅ (3·sda)/b and LOQ ≅ (10·sda)/b, where sda is the standard deviation of the Y-intercept and b is the slope of the regression line. The reproducibility, designated as the intraday (n = 3) and interdays (n = 3 over 7 days) percentages relative to the standard deviation (RSD %), was calculated at three concentration levels (five, ten, and twenty times the LOD and LOQ values in the TD tube) by analyzing daily prepared solutions with the same working mixtures stored at 8 °C.
2.3. Exhaled Breath Sampling and Analyses
After obtaining informed written consent, the breath samples of twenty healthy subjects and ten CKD-affected patients (Table 2), enlisted to undergo kidney transplants from a living donor, were sampled to test our proposed TD-GC–MS protocol.
Table 2.
Demographics and comorbidities in CKD and control groups.
Exhaled breath was collected with a ReCIVA® Breath Sampler (Owlstone Medical, Cambridge, UK), schematized in Figure 1.
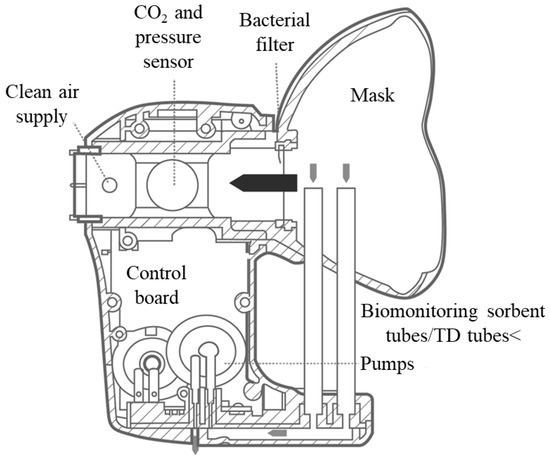
Figure 1.
Schematic of the ReCIVA® device.
The device was connected to a breath-sampling kit (mask and TD tubes), ensuring reproducible collection of the VOCs during real-time monitoring of the patient’s breathing. The exhaled breath of each patient was captured into four TD tubes (Markes International, Llantrisant, UK; biomonitoring sorbent tubes) capable of retaining a range of carbon compounds (from C4 to C30). The apparatus comprised infrared carbon dioxide detection with pressure sensors, permitting the selection of different volumes and fractions of the exhaled breath. A mask manufactured from medical grade silicone, which included a high-efficiency, low-resistance bacterial filter, was fixed onto the device before each sampling. This was connected to a medical air canister via a plastic pressure reducer and set to 15 L/min. A USB cable connected the ReCIVA® breath sampler to a laptop installed with breath-sampling software (Owlstone Medical), designed to ensure accurate monitoring of breathing air pressures (partial pressure of carbon dioxide). All subjects fasted for at least 4 h prior to breath sampling. Sampling was always performed in the same room, which was aerated for 30 min before each procedure. Patients were instructed to keep the mask securely adhered to their faces and to breathe normally with the air released by the medical air canister. After a 60 s ReCIVA® device washout with pure air (purity 99.99 percent; SOL Group, Monza, Italy), the patient’s breath was collected for 10 min under a PC-dedicated program control. At the completion of the sampling, the sorbent tubes were removed, covered with a plastic cap, and delivered to the chemistry department within 24 h for GC–MS analysis.
To exclude extraneous contamination, on each sampling day, three ReCIVA® steel tubes containing room air were sample–tested before the commencement of the breath sampling.
2.4. Ethical Approval
All methods were carried out in accordance with the relevant guidelines and regulations. The experimental protocol was approved by the ethics committee of the Azienda Ospedaliero-Universitaria Policlinico, Bari, Italy, and performed in compliance with the Declaration of Helsinki. All of the patients recruited provided informed written consent before the breath testing commenced.
3. Experimental Results
To test the experimental conditions set, in terms of the ability to detect and separate the twenty selected molecules, each analyte was individually analyzed. Specifically, 50 ng of each compound was added to a previously conditioned TD tube, according to the procedure described (Section 2.1).
The analysis of each standard VOC was repeated five times and the retention time (RT) of each molecule was recorded (Table 3); moreover, for each compound, the characteristic fragment ions at m/z (mass-to-charge) ratios were employed for its quantification in the XICs mode from the SCAN chromatogram. Only acetonitrile was quantified from the SCAN chromatogram.
Table 3.
Selected VOCs RTs and m/z ratios.
At the end of each analysis, the conditioning procedure for each used TD tube was repeated and the relative chromatogram was acquired, to verify that the cleaning method carried out was successful. Thus, each cleaned TD tube was capped, sealed, and stored as described (Section 2.1).
The optimized analytical conditions were tested using a linear regression analysis of the peak area versus the analyte amount, adding the TD tubes with aliquots of each standard molecule in quantities between 5 and 100 ng. Each measurement was repeated three times. Table 4 shows the linear ranges, the equations of the obtained calibration curves, and the LOD and LOQ for all the selected VOCs.
Table 4.
Calibration curves equations, correlation coefficients (R2), linear ranges, LOD, and LOQ values for selected VOCs.
The reproducibility of the investigated analytical procedure was evaluated in terms of intraday (n = 3) and interday (n = 3, over 7 days) RSD %, using standard solutions of the considered analytes at amount levels equal to five, ten, and twenty times the respective LOQs values. Experimental results are presented in Table 5.
Table 5.
Intraday and interday mean RSD % values for selected VOCs.
Finally, to evaluate the in vivo application of the developed TD-GC–MS method, the breath of twenty healthy subjects and ten CKD-affected patients, sampled before undergoing a kidney transplant from a living donor, was analyzed. Figure 2 shows the selected examples of the chromatograms of the breath of a healthy subject (Figure 2A) and of a CKD-affected patient (Figure 2B), acquired in SCAN mode.
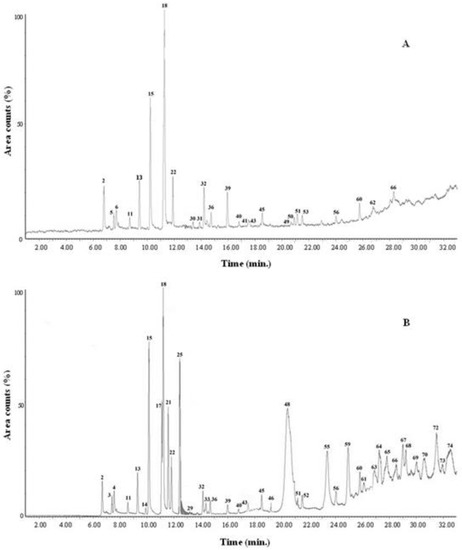
Figure 2.
Breath chromatographic profile (SCAN mode) of a healthy subject (A) and of a CKD-affected patient prior to undergoing a kidney transplant (B).
Overall, seventy-four VOCs were detected (S/N ≥ 3), while sixty-seven were identified and these are reported in Table 6.
Table 6.
List of molecules detected (S/N ≥ 3) in the breath of the twenty healthy subjects and four CKD-affected patients prior to undergoing a kidney transplant.
Finally, the concentration range of the thirteen selected target compounds was estimated for both the healthy subjects and/or the CKD-affected patient populations. The experimental results are presented in Table 7.
Table 7.
The concentration range of the thirteen selected VOCs identified in the exhaled breath samples for both healthy subjects and/or CKD-affected patient populations.
4. Discussion
Initially, it was demonstrated that the optimized TD-GC–MS operating conditions were able to adequately detect each selected standard molecule without any overlap between them. For all considered analytes, good linearity was ensured in the quantitative range explored, with the resulting R2 values always greater than 0.9719, and the linearity range being correct for the significant determination of the considered compounds. Moreover, the estimated LOD and LOQ values were in line with those previously reported in the literature. For example, Grabowska-Polanowska et al. reported for alkane (e.g., pentane and hexane), a LOD of about a few dozen pg·mL−1 alongside LOQ values of a maximum of 200 pg·mL−1 [51]. Similar values were recorded for nitrogen, sulfur-containing compounds, and ketones [51,52].
The breath analysis results showed that the two populations considered (healthy people and CKD-affected patients) were characterized by the presence of the same substances, except for the nitrogen-containing compounds (acetonitrile, ethylenediamine, propylamine), which were present only in the exhaled breath of the CKD-affected patients. As reported in the literature, nitrogen-based substances are an indication of renal failure. In fact, as previously underlined, ammonia and amines have been shown to be elevated in the breath of subjects affected by CKD [40,41,42,43,44,45,46,47,48,49,50,51,52].
In general, higher levels of aldehyde compounds are expected in the breath of CKD patients. These compounds can originate from membrane phospholipids during peroxidation processes by reactive oxygen species. Oxidative stress has been related to chronic renal failure [44]. Therefore, aldehydes can be considered biomarkers of oxidative stress [44]. For instance, Hermanns et al. induced renal oxidative damage in rats with a daily injection of ferric nitrilotriacetate, for thirteen days, and estimated the concentration of acetone and seven aldehydes in the urine, finding that acetaldehyde and propanal were significantly increased much earlier than the classic chemical–clinical parameters of renal damage. On the other hand, the urinary excretion of acetone, butanal, formaldehyde, hexanal, malondialdehyde, and pentanal was increased at the same time or shortly before that of the urinary parameters [46].
As shown in Table 6, alkanes with short and long chains, and the C6–C12 compounds, characterize the exhaled breath of both of the analyzed groups. Alhamdani et al. found significantly higher levels of these compounds in hemodialysis patients compared to the controls [45], suggesting that alkanes may be useful for monitoring the organism’s response to the transplanted organ.
Breath analysis of healthy subjects and CKD-affected patients highlighted the presence of thirteen of the twenty VOCs selected to optimize the experimental method, which were: 2-butanone, 3-heptanone, hexanal, acetonitrile, benzaldehyde, butanoic acid, decane, dichloromethane, dodecane, ethylenediamine, hexanoic acid, propylamine, and toluene. The other fifty-four molecules identified, common to both populations, belong to the same classes to which the twenty selected compounds are representative.
Traces of drugs were also found in the breath of two CKD-affected patients: hexestrol (an antitumor drug) and ibuprofen (nonsteroidal anti-inflammatory drug). Contamination of limonene and xylitol, which are compounds frequently used by the food industry as a seasoning, was also revealed in some of the analyzed breath samples.
Finally, based on the experimental differences found between the concentration levels of the thirteen selected substances in the breath of healthy people and patients with CKD, before undergoing kidney transplant (Table 7), it was possible to hypothesize that the molecules highlighted could be used as prognostic biomarkers.
5. Future Developments
In the near future, the breath of other CKD-affected patients, before undergoing a kidney transplant from a living donor and during the subsequent months after, will be sampled by a ReCIVA® device and then GC–MS analyzed, in conjunction with this validated protocol. The breath will be sampled and analyzed at regular intervals of time, over a year after surgery, since this represents the optimal time for eventually observing the rejection of the transplanted organ. A further thirty-five patients, minimum, will enter the study to eventually identify the qualitative and/or quantitative differences in the pattern of thirteen selected VOCs (2-butanone, 3-heptanone, hexanal, acetonitrile, benzaldehyde, butanoic acid, decane, dichloromethane, dodecane, ethylenediamine, hexanoic acid, propylamine, and toluene) expired by patients that undergo organ rejection, with respect to the subjects that will not suffer this complication. If this hypothesis is confirmed, it provides an opportunity to employ this optimized method to predict the rejection of an organ in a simple, inexpensive, fast, and non-invasive way.
Author Contributions
Conceptualization, N.D.V., A.M.A. and A.P.; Altomare, D.F.A. and C.Z.; Methodology, N.D.V., A.M.A., G.L. and A.P.; Validation, N.D.V., A.M.A., A.D.G. and J.P.; Formal Analysis, N.D.V.; Investigation, N.D.V.; Resources, D.F.A., G.D.G. and C.Z.; Data Curation, N.D.V., A.M.A. and A.P.; Writing—Original Draft Preparation, N.D.V., A.M.A. and A.P.; Writing—Review & Editing, all authors. All authors have read and agreed to the published version of the manuscript.
Funding
This research received no external funding.
Institutional Review Board Statement
Not applicable.
Informed Consent Statement
Informed consent was obtained from all subjects involved in the study. All methods were carried out in accordance with relevant guidelines and regulations. The experimental protocol was approved by the ethics committee of the Azienda Ospedaliero-Universitaria Policlinico, Bari, Italy, and performed in compliance with the Declaration of Helsinki.
Data Availability Statement
The datasets used and/or analyzed during the current study are available from the corresponding author upon reasonable request.
Acknowledgments
The authors thank Agnese Dezi, Giovanni Tomasicchio, and Giuseppe Lucarelli for the linguistic revisions in the paper and their technical contributions. This work was supported by the University of Bari “Aldo Moro” and Azienda Ospedaliero-Univesitaria Policlinico, Bari, Italy.
Conflicts of Interest
The authors declare no conflict of interest.
Additional Information
Correspondence and requests for materials should be addressed to A.M. Aresta.
References
- Golshayan, D.; Pascual, M. Burden of end-stage renal disease and evolving challenges in kidney transplantation. Transpl. Int. 2019, 32, 889–891. [Google Scholar] [CrossRef] [PubMed]
- Sobh, M.; Moustafa, F.; Ghoniem, M. Value of renal biopsy in chronic renal failure. Int. Urol. Nephrol. 1988, 20, 77–83. [Google Scholar] [CrossRef] [PubMed]
- Gansevoort, R.T.; Bakker, S.J.L.; de Jong, P.L. Early detection of progressive chronic kidney disease: Is it feasible? J. Am. Soc. Nephrol. 2006, 17, 1218–1220. [Google Scholar] [CrossRef] [PubMed]
- Saalberg, Y.; Wolff, M. VOC breath biomarchers in lung cancer. Anal. Chim. Acta 2016, 459, 5–9. [Google Scholar]
- Capone, S.; Tufariello, M.; Forleo, A.; Longo, V.; Giampetruzzi, L.; Radogna, A.V.; Casino, F.; Siciliano, P. Chromatographic analysis of VOC patterns in exhaled breath from smokers and nonsmokers. Biomed. Chrom. 2018, 32, e4132. [Google Scholar] [CrossRef] [PubMed]
- Bohra, A.; Kapoor, N. Exhaled breath analysis of volatile organic compounds (VOC) in diagnosis of lung cancer a meta-analysis. Mol. Anal. Precis. Oncol. 2020, 31, s1237–s1238. [Google Scholar] [CrossRef]
- Haddadi, S.; Koziel, J.A.; Engelken, T.J. Analytical approaches for detection of breath VOC biomarkers of cattle diseases—A review. Anal. Chim. Acta 2022, 1206, 339565–339580. [Google Scholar] [CrossRef]
- Nakhleh, M.K.; Amal, H.; Jeries, R.; Broza, Y.Y.; Aboud, M.; Gharra, A.; Ivgi, H.; Khatib, S.; Badarneh, S.; Har-Shai, L.; et al. Diagnosis and classification of 17 diseases from 1404 subjects via pattern analysis of exhaled molecules. ACS Nano 2017, 11, 112–125. [Google Scholar] [CrossRef]
- Van Malderen, K.; Hanning, N.; Lambrechts, H.; Haverhals, T.; Van Marcke, S.; De Man, J.; De Winter, B.Y.; Lamote, K.; De Schepper, H.U. Discriminating patients with irritable bowel syndrome from healthy controls with volatile organic compound (VOC) profiling in breath and fecal samples. Gastroenterology 2022, 162, S1076. [Google Scholar] [CrossRef]
- Amann, A.; Miekisch, W.; Schubert, J.; Buszewski, B.; Ligor, T.; Jezierski, T.; Pleil, J.; Risby, T. Analysis of exhaled breath for disease detection. Annu. Rev. Anal. Chem. 2014, 7, 455–482. [Google Scholar] [CrossRef]
- Ghosh, C.; Leon, A.; Koshy, S.; Aloum, O.; Al-Jabawi, Y.; Ismail, N.; Weiss, Z.F.; Koo, S. Breath-based diagnosis of infectious diseases. A review of the current landscape. Clin. Lab. Med. 2021, 41, 185–202. [Google Scholar] [CrossRef] [PubMed]
- Gelin, M.F.; Blokhin, A.P.; Ostrozhenkova, E.; Apolonski, A.; Maiti, K.S. Theory helps experiment to reveal VOCs in human breath. Spectrochim. Acta Part A Mol. Biomol. Spectr. 2021, 258, 119785. [Google Scholar] [CrossRef] [PubMed]
- Agapiou, A.; Amann, A.; Mochalski, P.; Statheropoulos, M.K.; Thomas, C.L.P. Trace detection of endogenous human volatile organic compounds for search, rescue, and emergency applications. Trends Anal. Chem. 2015, 66, 158–175. [Google Scholar] [CrossRef]
- Hansel, A.; Jordan, A.; Holzinger, R.; Prazeller, P.; Vogel, W.; Lindinger, W. Proton-transfer reaction mass-spectrometry—Online trace gas analysis at the ppb level. Int. J. Mass Spectrom. 1995, 149, 609–619. [Google Scholar] [CrossRef]
- Blake, R.S.; Monks, P.S.; Ellis, A.M. Proton-transfer reaction mass spectrometry. Chem. Rev. 2009, 109, 861–896. [Google Scholar] [CrossRef]
- Yuan, B.; Koss, A.R.; Warneke, C.; Coggon, M.; Sekimoto, K.; de Gouw, J.A. Proton-transfer-reaction mass spectrometry: Applications in atmospheric sciences. Chem. Rev. 2017, 117, 13187–13229. [Google Scholar] [CrossRef]
- Nenadis, N.; Heenan, S.; Tsimidou, M.Z.; Van Ruth, S. Applicability of PTR-MS in the quality control of saffron. Food Chem. 2016, 196, 961–967. [Google Scholar] [CrossRef]
- Blake, R.S.; Whyte, C.; Hughes, C.O.; Ellis, A.M.; Monks, P.S. Demonstration of proton-transfer reaction time-of-flight mass spectrometry for real-time analysis of trace volatile organic compounds. Anal. Chem. 2004, 76, 3841–3845. [Google Scholar] [CrossRef]
- Brock, B.; Kamysek, S.; Silz, J.; Trefz, P.; Schubert, J.K.; Miekisch, W. Monitoring of breath VOCs and electrical impedance tomography under pulmonary recruitment in mechanically ventilated patients. J. Breath Res. 2017, 11, 1752–1763. [Google Scholar] [CrossRef]
- Stadler, S.; Stefanuto, P.H.; Brokl, M.; Forbes, S.L.; Focant, J.F. Characterization of volatile organic compounds from human analogue decomposition using thermal desorption coupled to comprehensive two-dimensional gas chromatography-time-of-flight mass spectrometry. Anal. Chem. 2013, 85, 998–1005. [Google Scholar] [CrossRef]
- Trefz, P.; Schubert, J.K.; Miekisch, W. Effects of humidity, CO2 and O2 on real-time quantitation of breath biomarkers by means of PTR-ToF-MS. J. Breath Res. 2018, 12, 2060–2074. [Google Scholar] [CrossRef] [PubMed]
- Smith, D.; Spanel, P. Selected ion flow tube mass spectrometry (SIFT-MS) for on-line trace gas analysis. Mass Spectrom. Rev. 2005, 24, 661–700. [Google Scholar] [CrossRef] [PubMed]
- Boshier, P.R.; Marczin, N.; Hanna, G.B. Repeatability of the measurement of exhaled volatile metabolites using selected ion flow tube mass spectrometry. J. Am. Soc. Mass Spectrom. 2010, 21, 1070–1074. [Google Scholar] [CrossRef] [PubMed]
- Chin, S.T.; Romano, A.; Sophie, L.F.; Doran, S.L.F.; Hanna, G.B. Cross-platform mass spectrometry annotation in breathomics of oesophageal-gastric cancer. Sci. Rep. 2018, 8, 5139–5149. [Google Scholar] [CrossRef] [PubMed]
- Hicks, L.C.; Huang, J.; Kumar, S.; Powles, S.T.; Orchard, T.R.; Hanna, G.B.; Williams, H.R. Analysis of exhaled breath volatile organic compounds in inflammatory bowel disease: A pilot study. J. Crohns Colitis 2015, 9, 731–737. [Google Scholar] [CrossRef]
- Alkhouri, N.; Singh, T.; Alsabbagh, E.; Guirguis, J.; Chami, T.; Hanouneh, I.; Grove, D.; Lopez, R.; Dweik, R. Isoprene in the exhaled breath is a novel biomarker for advanced fibrosis in patients with chronic liver disease: A pilot study. Clin. Translat. Gastroenterol. 2015, 6, e112–e119. [Google Scholar] [CrossRef]
- Van Mastrigt, E.; Reyes-Reyes, A.; Brand, K.; Bhattacharya, N.; Urbach, H.P.; Stubbs, A.P.; de Jongste, J.C.; Pijnenburg, M.W. Exhaled breath profiling using broadband quantum cascade laser-based spectroscopy in healthy children and children with asthma and cystic fibrosis. J. Breath Res. 2016, 10, 026003. [Google Scholar] [CrossRef]
- Tuetuencue, E.; Mizaikoff, B. Cascade laser sensing concepts for advanced breath diagnostics. Anal. Bioanal. Chem. 2019, 411, 1679–1686. [Google Scholar] [CrossRef]
- Handa, H.; Usuba, A.; Maddula, S.; Baumbach, J.I.; Mineshita, M.; Miyazawa, T. Exhaled breath analysis for lung cancer detection using ion mobility spectrometry. PLoS ONE 2014, 9, e114555. [Google Scholar] [CrossRef]
- Hagemann, L.T.; Repp, S.; Mizaikoff, B. Hybrid analytical platform based on field-asymmetric ion mobility spectrometry, infrared sensing, and luminescence-based oxygen sensing for exhaled breath analysis. Sensors 2019, 19, 2653–2671. [Google Scholar] [CrossRef]
- Brodrick, E.; Davies, A.; Neill, P.; Hanna, L.; Williams, E.M. Breath analysis: Translation into clinical practice. J. Breath Res. 2015, 9, 027109–027119. [Google Scholar] [CrossRef] [PubMed]
- Konvalina, G.; Haick, H. Sensors for breath testing: From nanomaterials to comprehensive disease detection. Acc. Chem. Res. 2014, 47, 66–76. [Google Scholar] [CrossRef] [PubMed]
- Hanson, C.W.; Thaler, E.R. Electronic nose prediction of a clinical pneumonia score: Biosensors and microbes. Anesthesiology 2005, 102, 63–68. [Google Scholar] [CrossRef]
- Gupta, A.; Singh, S.T.; Yadava, R.D.S. Mems sensor array-based electronic nose for breath analysis—A simulation study. J. Breath Res. 2019, 13, 016003–016022. [Google Scholar] [CrossRef] [PubMed]
- Van de Goor, R.; van Hooren, M.; Dingemans, A.M.; Kremer, B.; Kross, K. Training and validating a portable electronic nose for lung cancer screening. J. Thorac. Oncol. 2018, 13, 676–681. [Google Scholar] [CrossRef]
- Wilson, A.D. Application of electronic-nose technologies and VOC-biomarkers for the noninvasive early diagnosis of gastrointestinal diseases. Sensors 2018, 18, 2613–2632. [Google Scholar] [CrossRef] [PubMed]
- Monedeiro, F.; Monedeiro-Milanowski, M.; Ratiu, I.A.; Brożek, B.; Ligor, T.; Buszewski, B. Needle trap device-GC-MS for characterization of lung diseases based on breath VOC profiles. Molecules 2021, 26, 1789–1808. [Google Scholar] [CrossRef]
- Gashimova, E.; Temerdashev, A.; Porkhanov, V.; Polyakov, I.; Perunov, D.; Azaryan, A.; Dmitrieva, E. Investigation of different approaches for exhaled breath and tumor tissue analyses to identify lung cancer biomarkers. Helion 2020, 6, e04224. [Google Scholar] [CrossRef]
- Phillips, M.; Cataneo, R.N.; Cruz-Ramos, J.A.; Huston, J.; Ornelas, O.; Pappas, N.; Pathak, S. Prediction of breast cancer risk with volatile biomarkers in breath. Breast Canc. Res. Treat. 2021, 170, 343–350. [Google Scholar] [CrossRef]
- Davies, S.; Spanel, P.; Smith, D. Quantitative analysis of ammonia on the breath of patients in end-stage renal failure. Kidney Int. 1997, 52, 223–238. [Google Scholar] [CrossRef]
- Narasimhan, L.R.; Goodman, W.; Patel, C.K. Correlation of breath ammonia with blood urea nitrogen and creatinine during hemodialysis. Proc. Natl. Acad. Sci. USA 2001, 98, 4617–4621. [Google Scholar] [CrossRef] [PubMed]
- Endre, Z.H.; Pickering, J.W.; Storer, M.K.; Hu, W.P.; Moorhead, K.T.; Allardyce, R.; McGregor, D.O.; Scotter, J.M. Breath ammonia and trimethylamine allow real-time monitoring of haemodialysis efficacy. Physiol. Meas. 2011, 32, 115–130. [Google Scholar] [CrossRef] [PubMed]
- Simenhoff, M.L.; Burke, J.F.; Saukkonen, J.J.; Ordinario, A.T.; Doty, R. Biochemical profile of uremic breath. N. Engl. J. Med. 1977, 297, 132–135. [Google Scholar] [CrossRef] [PubMed]
- Giustarini, D.; Dalle-Donne, I.; Tsikas, D.; Rossi, R. Oxidative stress and human diseases: Origin, link, measurement, mechanisms, and biomarkers. Crit. Rev. Clin. Lab. Sci. 2009, 46, 241–281. [Google Scholar] [CrossRef]
- Alhamdani, M.S.; Al-Kassir, A.H.; Jaleel, N.A.; Hmood, A.M.; Ali, H.M. Elevated levels of alkanals, alkenals and 4-HO-alkenals in plasma of hemodialysis patients. Am. J. Nephrol. 2006, 26, 299–303. [Google Scholar] [CrossRef]
- Hermanns, R.C.; de Zwart, L.L.; Salemink, P.J.; Commandeur, J.N.; Vermeulen, N.P.; Meerman, J.H. Urinary excretion of biomarkers of oxidative kidney damage induced by ferric nitrilotriacetate. Toxicol. Sci. 1988, 43, 241–249. [Google Scholar]
- de Lacy Costello, B.; Amann, A.; Al-Kateb, H.; Flynn, C.; Filipiak, W.; Khalid, T.; Osborne, D.; Ratcliffe, N.M. A review of the volatiles from the healthy human body. J. Breath Res. 2014, 8, 014001–014031. [Google Scholar] [CrossRef]
- De Vietro, N.; Aresta, A.; Rotelli, M.T.; Zambonin, C.; Lippolis, C.; Picciariello, A.; Altomare, D.F. Relationship between cancer tissue derived and exhaled volatile organic compound from colorectal cancer patients. Preliminary results. J. Pharm. Biomed. Anal. 2020, 180, 113055–113065. [Google Scholar] [CrossRef]
- Altomare, D.F.; Picciariello, A.; Rotelli, M.T.; De Fazio, M.; Aresta, A.; Zambonin, C.G.; Vincenti, L.; Trerotoli, P.; De Vietro, N. Chemical signature of colorectal cancer: Case–control study for profiling the breath print. BJS Open Access 2020, 4, 1189–1199. [Google Scholar] [CrossRef]
- De Vietro, N.; Aresta, A.M.; Picciariello, A.; Rotelli, M.T.; Zambonin, C. Determination of VOCs in surgical resected tissues from colorectal cancer patients by solid phase microextraction coupled to gas chromatography–mass spectrometry. Appl. Sci. 2021, 11, 6910–6921. [Google Scholar] [CrossRef]
- Grabowska-Polanowska, B.; Faber, J.; Skowron, M.; Miarka, P.; Pietrzycka, A.; Sliwka, I.; Amann, A. Detection of potential chronic kidney disease markers in breath using gas chromatography with mass-spectral detection coupled with thermal desorption method. J. Chromatogr. A 2013, 1301, 179–189. [Google Scholar] [CrossRef] [PubMed]
- Grabowska-Polanowskaa, B.; Skowrona, M.; Miarka, P.; Pietrzycka, A.; Śliwkaa, I. The application of chromatographic breath analysis in the search of volatile biomarkers of chronic kidney disease and coexisting type 2 diabetes mellitus. J. Chromatogr. B 2017, 1060, 103–110. [Google Scholar] [CrossRef] [PubMed]


Disclaimer/Publisher’s Note: The statements, opinions and data contained in all publications are solely those of the individual author(s) and contributor(s) and not of MDPI and/or the editor(s). MDPI and/or the editor(s) disclaim responsibility for any injury to people or property resulting from any ideas, methods, instructions or products referred to in the content. |
© 2023 by the authors. Licensee MDPI, Basel, Switzerland. This article is an open access article distributed under the terms and conditions of the Creative Commons Attribution (CC BY) license (https://creativecommons.org/licenses/by/4.0/).