Abstract
Cable-supported photovoltaic systems (CSPSs) are a new technology for supporting structures that have broad application prospects owing to their cost-effectiveness, light weight, large span, high headroom, few pile foundations, short construction period, and symbiosis with fisheries and farms. Recently, a new CSPS with a much smaller settlement and stronger wind resistance was proposed. The new CSPS, with a 10% lower cost compared with traditional fix-tilted PV support, is a better alternative to traditional photovoltaic (PV) support systems. In this study, the failure models and bearing capacity of the primary structures of the new CSPS were investigated in detail using the FEM method, and a design method for the new structure was proposed based on the limit state design method. The results showed that the structure had a strong load-bearing capacity. Failure of the cables and triangular brackets are the two main types of failure of the primary structure. The cross-sectional area of the cables is the most important factor affecting the load-bearing capacity of the structure and directly affecting the failure modes of the CSPS. The numerical case verified that the proposed design method works well and that the designed structure has sufficient loading capacity and is cost-effective.
1. Introduction
PV modules have been widely used to collect solar energy to generate clean renewable electricity, and solar farms have become one of the primary solutions to climate change. The China Photovoltaic Industry Association (CPIA) reported the latest 2021–2022 China PV Industry Development Roadmap [1], providing the latest initial full investment cost of China’s ground-mounted solar farms. In the United States, the Solar Energy Industries Association (SEIA) and Wood Mackenzie reported the Q2 2022 US Solar Market Insight Executive Summary [2] and provided the full investment cost for different types of solar farms, including utility fixed-tilt and tracking solar farms.
Table 1 compares the investment cost percentages of the fixed-tilt solar farms in the two countries. The results showed that PV modules and their supporting systems account for more than 55% of the investment cost of the entire solar farm. Support systems are key components of solar farms and directly affect the safety of PV modules and construction investment. The wind load is the control load of the PV systems. Therefore, the optimal design of wind-resistant PV modules and their supporting systems has always been a hot topic in the fields of wind, PV, and transportation engineering [3].

Table 1.
Investment cost percentage of solar farms [1,2].
Most PV modules are supported by fixed structures, as illustrated in Figure 1. To accurately assess wind loads on PV modules, since the 1980s, many researchers have studied wind loads on fixed supporting structures for PV modules. Radu et al. [4] described the wind loads on PV module arrays on top of residential buildings via wind tunnel testing and observed that the average wind load of the rear modules markedly decreased owing to the shielding effect of the building and windward PV modules. Wood et al. [5] described the influence of the position of PV modules on the wind loads on both flat roofs and PV modules via wind tunnel testing. Warsido et al. [6] investigated the effects of array spacing on the shielding effect of the wind load on rooftop PV modules. Radu et al. [7] studied the effect of roof parapets on the wind load on roof PV modules. In recent years, Pratt and Kopp [8], Cao et al. [9], Banks [10], and Stathopoulos et al. [11,12] investigated wind loads on PV arrays with different aspect ratios on flat roofs and showed that wind loads on PV modules are primarily affected by the width of the building. Alrawashdeh and Stathopoulos [13] studied the influence of the geometric scale of roof PV modules on the wind pressure distribution and concluded that the geometric scale has a significant influence on the wind load of PV modules.
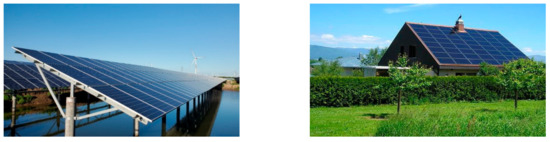
Figure 1.
Fixed support PV structure system.
For wind loads on ground-mounted PV modules, Bitsuamlak et al. [14] found that the wind load on leeward PV modules was 30% lower than that on the windward row through full-scale measurements and computational fluid dynamics (CFD) numerical simulations. In addition, they found that the CFD numerical simulation yielded similar wind pressure distribution rules to the full-scale measurement, but the pressure coefficients of the simulation results were smaller than those of the full-scale measurement. Shademan and Hangan [15] and Shademan et al. [16,17] studied the influence of distance and spacing from the ground on the wind loads on PV modules and showed that increasing the distance between the modules produced stronger vortex shedding, resulting in a greater average and fluctuating wind loads. When two adjacent PV modules reach a certain distance, the drag coefficient of the leeward PV modules decreases to a minimum. Aly and Bitsuamlak [18] and Aly [19] studied the wind load of ground-mounted PV modules via wind tunnel tests and CFD numerical simulations under different model scales and wind field characteristics. Their results showed that the geometric scale of the model and the characteristics of the wind field had little effect on the average wind pressure coefficient but markedly affected the peak pressure coefficient. Abiola-Ogedengbe et al. [20] studied the wind pressure field and loads of ground-mounted PV modules via CFD simulations and showed that the interpanel gap and tilt angle affect the surface pressure. Mammar et al. [21] studied the influence of column height and estimated steady and unsteady wind loads on heliostats through a wind tunnel test. The results show that an increase in column height produces larger steady and unsteady pressure wind loads, stronger vortex shedding, and higher shedding frequencies. Geurts and Steenbergen [22], Erwin et al. [23], Geurts and Blackmore [24], and Bender et al. [25] conducted field measurements of the wind loads on PV modules.
Recently, CSPSs have become popular because they save land resources and are cost-effective. Baumgartner et al. [26] first proposed a CSPS in their study; a sketch of the structure is shown in Figure 2. The CSPS has broad application prospects because of its light weight, few pile foundations, short construction period, good heat dissipation performance, large span, reduced land use, increased space utilization, and applicability to complex terrains [26,27,28]. Thus, the CSPS is an alternative solution that overcomes the drawbacks of conventional fixed-mounted PV systems. However, the original CSPS has high settlement because only two supporting cables bear self-weight, static wind loads, and/or snow loads. Reducing the settlement requires a higher pretension and larger cables. Moreover, the original CSPS is prone to strong wind-induced vibrations (WIV) because of its high flexibility.
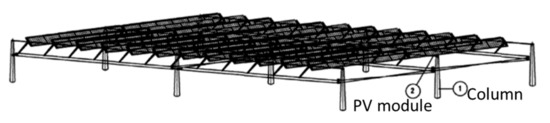
Figure 2.
Cable-supported PV system proposed by Czaloun [29].
Recently, the authors proposed a new CSPS [30], as shown in Figure 3, and verified its wind resistance capability [31]. A single element of the new CSPS consisted of three cables, four triangular brackets, and several lateral connectors. The upper two cables support the PV modules, and the lower cable supports the two upper cables in the four sections through triangular brackets. The new CSPS has a larger span and smaller deflection. The lateral connectors enhance the wind resistance of the CSPS.
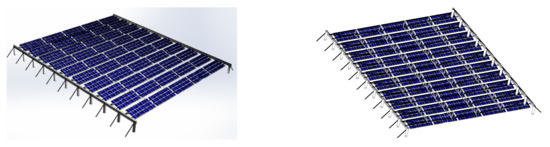
Figure 3.
Sketch of the new CSPS.
Compared with the traditional fixed-tilt PV support system, the new CSPS saves 10–15 tons of steel and 100–180 pile foundations per MW [31]. Therefore, the new CSPS has great potential for wide applications. Over the past three years, more than 20 new cable-supported solar farms have been built in China with a total capacity of more than 1 GW. In addition, an increasing number of CSPS solar farms will be built in the coming years.
To date, only China and Japan have published specifications [32,33] for the structural design of ground-mounted PV modules. As previously reported by Browne et al. [34], “Despite the current understanding of wind effects on ground-mounted multirow solar arrays, there is no comprehensive method in any building code/standard that provides appropriate guidance to practitioners designing these types of structures. Although numerous commercial wind loading studies on ground-mounted solar arrays have been carried out by wind tunnel laboratories worldwide, these data remain largely proprietary in nature and thus are not available in the public domain. Consequently, there is a need to establish a new design method for ground-mounted multi-row solar arrays…” The study on the design method of CSPVs is rare [34,35,36].
The cable design of the CSPVs mainly refers to JGJ 257-2012 (2012), JG/T 200-2007 (2007), ASCE/SEI 19-16 (2016), and BS EN 1993-1-11:2006 (2006) [37,38,39,40]. The wind load of the CSPS mainly refers to building load codes, such as GB50009-2012 (2012), ASCE 7-16 (2016), and AS/NZS 1170.2-2011 (2011) [41,42,43]. These codes were drafted to build the structures. Therefore, a design method for the CSPS is required for a better application of the new structure. The present study investigated the failure models and bearing capacity of the primary structures of the new CSPS using the FEM method and proposed a design procedure for the new structure based on the limit state design method. The effectiveness of the proposed design procedure was verified using a solar farm project.
2. Numerical Simulation
2.1. Finite Element Model
Finite-element simulation is an effective and efficient method for structural analysis. In this study, the finite element method was adopted to investigate the failure models and bearing capacity of the primary structures of the new CSPS. Different element types are used to simulate each component of the structure: (1) the columns and lateral beams are simulated with “Beam” elements; (2) the cables (load-bearing cables and anchor cables), triangle brackets, and lateral connectors are simulated using the “Link” element; and (3) the PV modules use “Shell” elements.
The boundary conditions are described as follows:
- (1)
- The PV modules are mounted on cables 1 and 2, and they are connected by nodes.
- (2)
- Both ends of cables 1, 2, and 3 were fixed on the beams.
- (3)
- The lower end of the anchor cable was fixed to the ground, and the upper end was fixed to the beam.
- (4)
- Triangular brackets are interconnected with cables 1, 2, and 3 by the nodes.
- (5)
- Beams were fixed at the top of the columns.
- (6)
- The bottom end of the column was fixed to the ground, and the upper ends were connected to the beam.
The prototype of the finite element modeling (FEM) model of the present study is a real CSPS solar farm built by the Tong Wei Group in Tianjin, China. The structural parameters and material properties of the CSPS are listed in Table 2. Figure 4 shows a comparison of the prototype and FEM models.
Table 2.
Example of a new CSPS [31].
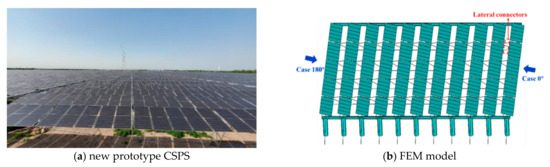
Figure 4.
Overview of the new prototype CSPS and its FEM model.
Static analyses were conducted, and the structural nonlinearity of large deformation was considered. The structure response is solved using the Newton–Raphson method, and the load substep is set as 20.
2.2. Wind Load
Previous wind tunnel tests have shown that lateral connectors can successfully suppress the strong WIV of a structure [30]. An equivalent static wind load was adopted for the structural design of the CSPS. As the most unfavorable loading condition is crosswind (Case 0° and Case 180°), in the present study, the equivalent static wind load of the PV modules under the two controlling cases were calculated according to [32,41]. Case 0° indicates that the wind is normal to the span of the PV array and hits the upper surface of the PV modules, and case 180° indicates that the wind hits the PV modules in the opposite direction, as shown in Figure 4. It is noteworthy that only the self-weight, prestressed load, and wind load were considered to simplify the design process.
According to the Chinese codes [32,41], the equivalent static wind load, , on ground-mounted PV modules is calculated as
where is the wind vibration coefficient at height , is the shape coefficient of the PV module, is the height variation factor of the wind pressure, is the reference wind pressure with a 25-year return period, and kg/m3 is the air density. In the present study, is measured as 1.6 trough wind tunnel testing; is equal to 0.8 or −0.95 in Case 0° and 180°, respectively; and is set as 1.0, because the prototype of the CSPS structure is lower than 10 m. The reference wind pressure of the prototype is 0.5 kN/m2.
3. Bearing Capacity and Failure Modes
To investigate the bearing capacity and failure modes of the CSPS, the equivalent static wind load was increased from 0 to 2.0 kN/m2 according to the Chinese wind environment. Theoretically, the design structure changes according to the wind load, . The required design parameters of the structure can be calculated for each wind load. In fact, the required design parameters are the minimum values at which the structure meets the structural internal force, stress, and deformation, which are curves that change dynamically with the calculated wind load. In this section, the internal force, stress, and deformation of the CSPS were calculated under different wind pressures using the basic model. The bearing capacity and failure modes are discussed below.
3.1. Bearing Capacity
The internal forces of cables 1, 2, and 3 are calculated when the wind load varies from 0 to 2.0 kN/m2 in the two control cases. The cross-sectional areas of the cables changed as the wind load increased. The internal forces of cables 1, 2, and 3 are also considered in relation to the required breaking forces of cables 1, 2, and 3 to ensure structural safety and are referred to as and , respectively.
The results of previous studies indicate that the and have different trends when the wind load is in the range of 0.15~2.0 kN/m2. The static wind load is supported by three cables in Case 0°, whereas only cables 1 and 2 bear the static wind load when the wind load is greater than 0.238 kN/m2 in Case 180°. In addition, the required breaking force of cables 1 and 2 in Case 0° () is always smaller than that in Case 180° (). In contrast, the required breaking force of cable 3 in Case 0° () is larger than that in Case 180° (), which means that Case 180° is the controlling condition of cables 1 and 2, and Case 0° is the controlling condition of cable 3 when the wind is in the range of 0 to 2.0 kN/m2 [31].
To ensure the structural safety of a given CSPS, the required breaking force should be lower than the cable resistance force. The load-bearing capacity was determined by the resistance forces of cables 1, 2, and 3. In Case 180°, the bearing capacity of the CSPS () is calculated by setting the resistance force of cables 1 and 2 equal to , and setting the resistance force of cable 3 to be higher than . In Case 0°, the load-bearing capacity of the CSPS () was calculated by setting the resistance force of cable 3 equal to , and setting the resistance force of cables 1 and 2 to be higher than . The load capacity of the CSPS was the minimum between and .
Figure 5 shows the vertical deformation at the midspan of the structure as the wind load increased in the two cases. The vertical deformation in Case 0° was downwards, and that in Case 180° was upward. In both cases, the midspan vertical deformation increased nonlinearly with increasing wind load, and the deformation increment decreased when the wind load increased. These results indicate that the vertical stiffness of the PV system increased with increasing deformation. When the wind load increases from 0.3 to 2.0 kN/m2, the midspan vertical deformation increased by 226.5% and 190%, respectively. The midspan vertical deformation in Case 180° was always greater than that in Case 0° when the wind load was higher than 0.238 kN/m2.
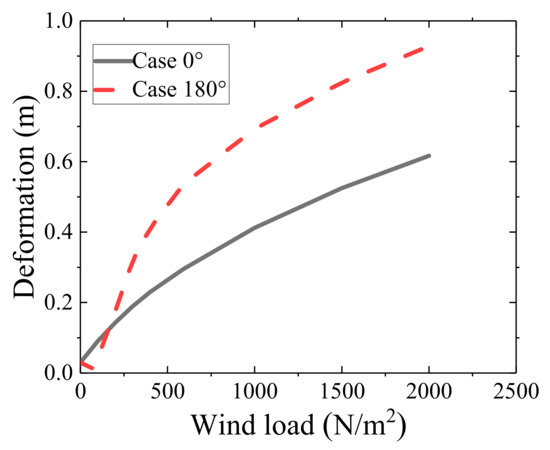
Figure 5.
Midspan vertical deformation of the structure as the wind load increases.
3.2. Failures of Cables
A given CSPS fails when the wind load continues to increase. Generally, the new CSPS fails owing to the failure of columns, beams, cables, triangle brackets, fasteners, or modules. Because columns, beams, fasteners, and modules are traditional components in normal arrangements, and their failure modes have been studied in detail, this subsection primarily focuses on the failures of cables and triangle brackets. A cable breaks when its internal force exceeds its resistance force. For the stainless-steel strand used in the proposed CSPS support system, the resistance force of the cables, , was calculated using Equation (2), as recommended by [38].
where is the strength reduction factor, is the sectional area (m2), and is the tensile strength (MPa).
Based on Equation (2), the required resistance force is transformed into the required sectional area S when only the control cases are considered. Figure 6 shows the required cross-sectional areas of cables 1 and 2 (), and cable 3 () as the wind load increases. The results show that and increase with increasing wind load. When the wind load is between 0 and 2.0 kN/m2, the curves of and separate the required cross-sectional area space into two areas. Under a given wind load, if the cross-sectional area is smaller than the required cross-sectional area, the structure fails under the corresponding control condition. Consequently, the failure modes of the CSPS are summarized as follows: (1) when the cross-sectional areas of cables 1 and 2 are smaller than and the cross-sectional area of cable 3 is larger than , the structure is prone to failure in Case 180°; (2) when the cross-sectional areas of cables 1 and 2 are larger than and that of cable 3 is smaller than , the structure is prone to failure in Case 0°; and (3) when the cross-sectional areas of cables 1, 2, and 3 are smaller than the required cross-sectional area, the structure is prone to failure in both cases 180° and 0°.
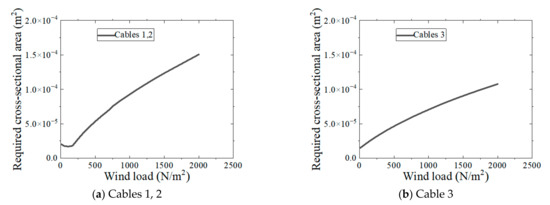
Figure 6.
Required cross-sectional area.
3.3. Failure of Triangle Brackets
Triangle brackets are analyzed in this subsection, and lateral connectors are not considered because they only enhance lateral stability. In Case 180°, the axial force of the lateral connectors and the triangular brackets are close to 0 when the wind load is greater than 0.238 kN/m2 because cable 3 no longer works; in Case 0°, the axial force of the lateral connectors is much smaller than that of the triangular brackets. Normally, the lateral connectors are set the same as those of the triangular brackets. Case 0° was the controlling case for the triangle brackets, and the axial forces of all triangle brackets in Case 0° were investigated in detail.
Each triangular bracket is composed of three slender steel pipes that bear only axial forces. The failure modes of the triangular brackets were either yielding or buckling. When the internal force of the steel pipes is larger than their yielding strength or buckling strength, the steel pipes fail and the CSPS breaks.
The internal forces of the triangular brackets at the 1/5 and 2/5 spans, as shown in Figure 7, were calculated when the wind load varied from 0 to 2.0 kN/m2. The results for Case 0° are shown in Figure 8. Rods 1, 3, 4, and 6 are in compression, whereas rods 2 and 5 are in tension. The maximum compressive force appears in rod 3, whereas the maximum tensile force appears in rod 2; the compression force is much higher than the tensile force. The internal forces of the rods increased with the wind load.
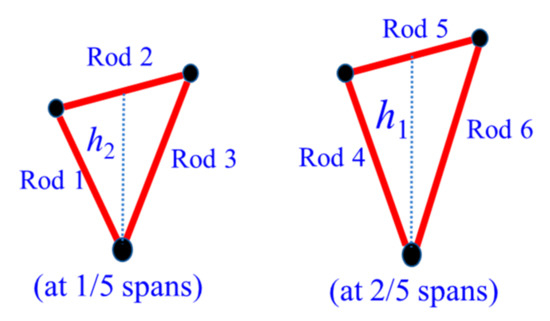
Figure 7.
Triangle brackets.
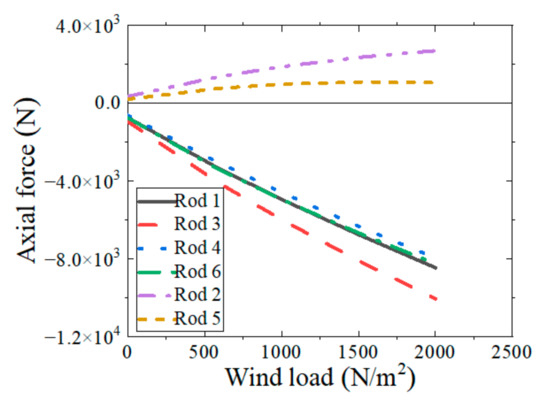
Figure 8.
Internal force of the six slender rods in Case 0°.
The internal forces in rods 1–6 are considered in relation to the load capacity of the rods to ensure the structural safety of the proposed system and are referred to as through , respectively. The rods should have sufficient cross-sectional area to withstand the required internal forces. The load capacity of the rod, , was calculated using Equation (3) while considering the yield strength of the rod. In addition, according to Euler’s formula, the load capacity of a slender compression rod, , which is hinged at both ends, is calculated using Equation (4) while considering the buckling strength. The required load capacity of the rods is the minimum of and :
where is the elastic modulus of the rod, is the minimum inertia moment of the cross section, is the calculation length, is the yielding strength, and and are the outer and inner diameters, respectively. In this study, is set equal to 0.01 m, and the required load capacity and outer diameter are calculated as follows:
Using Equation (6), the internal forces in Figure 8 were transformed into the required outer diameters. Figure 9 shows the required outer diameters of rods 1–6 ( to ) as the wind load increases. Rod 6 had the maximum required outer diameter, and rods 2 and 5 had the minimum required outer diameter. Wind strongly affects the required outer diameters of the compression rods but has little effect on the tensile rods. The required outer diameters of the compression rods increased nonlinearly as the wind load increased.
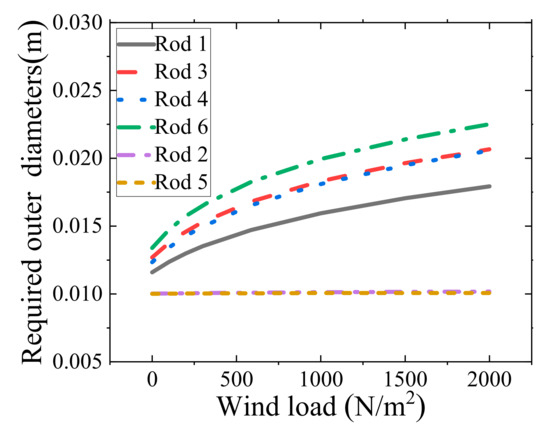
Figure 9.
Required outer diameters of the rods as the wind load increases.
Triangle brackets exhibit two different types of failure: yielding and buckling. Considering rod 6 as an example, the required outer diameter is calculated separately under the yielding and buckling conditions, and referred to as and , respectively. The calculation results are shown in Figure 10. Both and increase with increasing wind load, and is much higher than , which indicates that rod 6 is more prone to buckling than to yielding. The curves of and separate the figure into three areas, which indicate three possible states of the triangular brackets: (1) when the outer diameter area of rod 6 is smaller than , the structure is prone to yielding or buckling failure; (2) when the outer diameter area of rod 6 is higher than but lower than , the structure is prone to yielding failure; and (3) when the outer diameter area of rod 6 is higher than , the structure is safe under the given wind pressure.
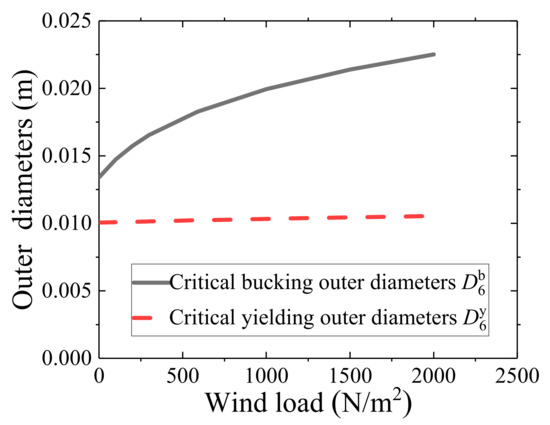
Figure 10.
Required outer diameters of rod 6 under yielding and buckling conditions.
4. Design Method
A design method for a CSPS based on the design standards [32]. Both the ultimate limit state and serviceability limit state were considered. Under the ultimate limit state, the strength of the cables and triangular brackets is determined by the internal forces. The structural deformation was checked under the serviceability limit state.
4.1. Limit States
The ultimate limit state means that the structure or structural component reaches the maximum load-bearing capacity or reaches the limit state of deformation, which is no longer suitable for load-bearing applications [32]. The following states are considered the ultimate limit states: (1) the cables have broken, (2) the triangular brackets have undergone buckling or yielding, (3) the structure or components have overturned or slipped, and (4) large vibrations causing serious damage have occurred.
The structure or component should have a normal service or durability performance under the serviceability limit state [32]. Under the serviceability limit state, the structure or structural components should have (1) no excessive midspan deformation compared to the criteria, (2) no partial damage, including cracks, that affects the normal use or durability of PV modules, and (3) no strong WIV that affects normal use or fatigue life.
In China, the designs of cables and triangle brackets were calculated under the ultimate limit state using Equation (7). The deformation of the structure at the midspan was checked using Equation (8) under the serviceability limit state: Equation (9) yields the following combination method for different types of loads [32,37]:
where the importance factor of the structure is 1.0 as suggested by Chinese standards [32]; and are the resistance force of the cables and triangle brackets, respectively; and are the safety factor of the cables and triangle brackets, which are set as 2.0 and 1.7, respectively; is the criterion of the midspan deformation; is the load combination effect (design value of the CSPV); , , and are the load effects of self-weight, prestressed load, and wind load, respectively; and , , and are the load factors of self-weight, prestressed load, and wind load, respectively. The load effect refers to the internal force and deformation of the structure caused by the self-weight of the PV modules, prestressed load, or wind load . Table 3 lists the load coefficients of the structure for the two limit states.
Table 3.
Design coefficient of the structure [32,37].
4.2. Design Procedure
A design method for the new CSPS was proposed, as shown in Figure 11. The design procedure is summarized as follows.
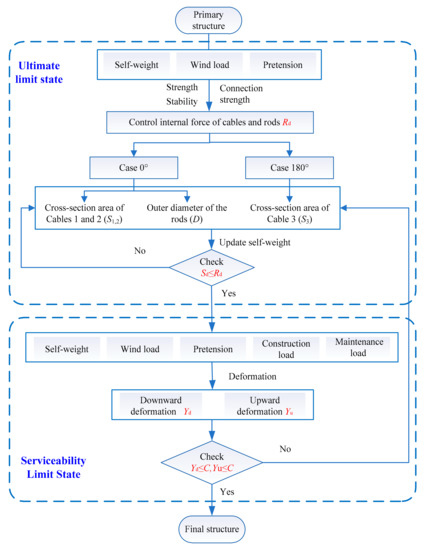
Figure 11.
Sketch of the overall view of the proposed method.
Step 1: Select the cross sections of cables 1 and 2 () under the ultimate limit state in Case 180°.
Step 2: Select the cross sections of cable 3 () and the outer diameter () of the rods under the ultimate limit state in Case 0°, and check the strength of cables 1 and 2.
Step 3: Check whether the deformation satisfies the requirements under the serviceability limit state in Cases 0° and 180°.
Step 4: Increase the sectional area of cable 3 () if the deformation in Case 0° exceeds the requirement under the serviceability limit state.
Step 5: Increase the sectional area of cables 1 and 2 () if the deformation in Case 180° exceeds the requirement under the serviceability limit state.
Step 6: Determine the product specifications of the cables and triangular brackets according to the parameters of the final structure.
4.3. A Case Study
The basic model shown in Table 2 under a basic wind load in Tianjin ( = 0.5 kN/m2) was redesigned using the proposed design procedures. In this case, only the wind load was considered, and according to Equation (1), the design wind load was calculated as = 0.64 kN/m2 and 0.76 kN/m2 (Case 0° and 180°). The tensions of cables 1 and 2 were set to be the same as those of the original structure ( = 30 kN). The tension of cable 3 was set to = 18 kN. The triangle bracket height and row spacing were set to = 1.5 m and 2.9 m, respectively.
According to the Chinese standards [37], the midspan deflection limit was set as 2% of the sag-to-span ratio in the serviceability limit state. Table 4 lists the allowable internal forces of the cables and triangular brackets of the primary structure, and Table 5 compares the parameters of the original structure and the redesigned structure per MW. The results show that, although the midspan deformation of the original structure can meet the requirements of the serviceability limit state, the design value of the wind load capacity is far less than the requirements under the ultimate capacity state, and the cable design parameters of the original structure are unreasonable. The redesigned structure meets the design requirements in both the ultimate and serviceability limit states. The design value of the wind load capacity of the redesigned structure was 1.33 kN/m2, which was much higher than that of the original structure (0.55 kN/m2). The redesigned structure had a similar resistance force in both cases of 0° and 180°. However, the resistance force of the original structure in Case 0° was much higher than that in Case 180°. Compared with the original structure, the outer diameter of the triangular brackets and the cross-sectional area of cable 3 in the redesigned structure were reduced by approximately 3%. The cross-sectional areas of cables 1 and 2 increased by approximately 87%. The steel consumption of the cables, triangular brackets, and lateral connectors was reduced by approximately 15.7%. This design method improves both the economy and bearing capacity of CSPS structures.
Table 4.
Required internal force of cables and triangle brackets.
Table 5.
Comparison of parameters between the original structure and the redesigned structure per MW.
5. Conclusions
In this study, the bearing capacity and failure modes of the primary structures of a new CSPS were investigated in detail using FEM. A design method for a new structure was proposed based on the limit state design method. The primary conclusions of this study are as follows.
(1) The proposed structure exhibited a strong load-bearing capacity. Case 180° is the controlling condition of cables 1 and 2, and Case 0° is the controlling condition of cable 3. When the internal forces of the three cables are equal to their resistance force, the wind load is supported by all three cables in Case 0°, whereas only cables 1 and 2 bear the wind load when the wind load is greater than a certain critical value in Case 180°.
(2) The failures of the cables and triangle brackets are the two primary types of failures of the primary structure. The cross-sectional area of the cables is the most important factor affecting the load-bearing capacity of the structure and directly affecting the failure modes of the PV system. Case 0° is the controlling condition of the triangular brackets, the buckling or yielding of which is closely related to the outer diameter of the rods.
(3) The proposed limit state design method was shown to be cost-effective, and the designed structure had less steel consumption and a strong load capacity.
Author Contributions
Conceptualization, H.D. and H.J.; methodology, H.D. and H.J.; formal analysis, H.D. and H.J.; investigation, H.D. and H.J.; data curation, H.D., X.H. and H.J.; writing—original draft preparation, H.D., X.H. and H.J.; writing—review and editing, all authors; supervision, X.H., X.W. (Xiaoping Wu) and X.W. (Xiaojun Weng). All authors have read and agreed to the published version of the manuscript.
Funding
This research was funded by the National Natural Science Foundation of China, grant number 51925808, U1934209, and 52078502; the Key R&D projects of Hunan Province, grant number 2022GK2053; the Science and Technology Innovation Program of Hunan Province, grant number No. 2021RC3017; and the Tencent Foundation, grant name Xplorer Prize 2021.
Institutional Review Board Statement
Not applicable.
Informed Consent Statement
Not applicable.
Data Availability Statement
Not applicable.
Acknowledgments
This research was financially supported by Tong Wei Limited Company, the National Natural Science Foundation of China (No. 51925808, U1934209, and 52078502), the Key R&D projects of Hunan Province (2022GK2053), the science and technology innovation Program of Hunan Province (No. 2021RC3017), and the Tencent Foundation (Xplorer Prize 2021). We also thank the anonymous reviewers for their constructive feedback on the initial manuscript.
Conflicts of Interest
The authors declare no conflict of interest.
Nomenclature
| CSPS | Cable-supported photovoltaic system |
| PV | Photovoltaic |
| CPIA | China Photovoltaic Industry Association |
| SEIA | Solar Energy Industries Association |
| CFD | Computational fluid dynamics |
| FEM | Finite element modeling |
| WIV | Wind-induced vibration |
References
- China Photovoltaic Industry Association. China PV Industry Development Roadmap; China Photovoltaic Industry Association: Beijing, China, 2022. [Google Scholar]
- SEIA; Wood Mackenzie. Q2 2022 US Solar Market Insight Executive Summary; SEIA: Washington, DC, USA, 2022. [Google Scholar]
- Jaffery, S.H.I.; Khan, M.; Ali, L.; Khan, H.A.; Mufti, R.A.; Khan, A.; Khan, N.; Jaffery, S.M. The potential of solar powered transportation and the case for solar powered railway in Pakistan. Renew. Sustain. Energy Rev. 2014, 39, 270–276. [Google Scholar] [CrossRef]
- Radu, A.; Axinte, E.; Theohari, C. Steady wind pressures on solar collectors on flat-roofed buildings. J. Wind Eng. Ind. Aerodyn. 1986, 23, 249–258. [Google Scholar] [CrossRef]
- Wood, G.S.; Denoon, R.O.; Kwok, K.C.S. Wind loads on industrial solar panel arrays and supporting roof structure. Wind Struct. 2001, 4, 481–494. [Google Scholar] [CrossRef]
- Warsido, W.P.; Bitsuamlak, G.T.; Barata, J.; Chowdhury, A.G. Influence of spacing parameters on the wind loading of solar array. J. Fluid Struct. 2014, 48, 295–315. [Google Scholar] [CrossRef]
- Radu, A.; Axinte, E. Wind forces on structures supporting solar collectors. J. Wind Eng. Ind. Aerodyn. 1989, 32, 93–100. [Google Scholar] [CrossRef]
- Pratt, R.N.; Kopp, G.A. An initial study of the aerodynamics of photovoltaic panel arrays mounted on large flat-roofs. In Proceedings of the 7th International Colloquium on Bluff Body Aerodynamics and Applications (BBAA7), Shanghai, China, 2–6 September 2012. [Google Scholar]
- Cao, J.; Yoshida, A.; Saha, P.K.; Tamura, Y. Wind loading characteristics of solar arrays mounted on flat roofs. J. Wind. Eng. Ind. Aerodyn. 2013, 123, 214–225. [Google Scholar] [CrossRef]
- Banks, D. The role of corner vortices in dictating peak wind loads on tilted flat solar panels mounted on large, flat roofs. J. Wind Eng. Ind. Aerodyn. 2013, 123, 192–201. [Google Scholar] [CrossRef]
- Stathopoulos, T.; Zisis, I.; Xypnitou, E. Local and overall wind pressure and force coefficients for solar panels. J. Wind. Eng. Ind. Aerodyn. 2014, 125, 195–206. [Google Scholar] [CrossRef]
- Stathopoulos, T.; Zisis, I.; Xypnitou, E. Wind loads on residential scale rooftop photovoltaic panels. J. Wind Eng. Ind. Aerodyn. 2017, 168, 228–246. [Google Scholar]
- Alrawashdeh, H.; Stathopoulos, T. Wind loads on solar panels mounted on flat roofs: Effect of geometric scale. J. Wind Eng. Ind. Aerodyn. 2020, 206, 104339. [Google Scholar] [CrossRef]
- Bitsuamlak, G.; Dagnew, A.; Erwin, J. Evaluation of wind loads on solar panel modules using CFD. In Proceedings of the 5th International Symposium on Computational Wind Engineering (CWE2010), Chapel Hill, NC, USA, 23–27 May 2010. [Google Scholar]
- Shademan, M.; Hangan, H. Wind loading on solar panels at different inclination angles. In Proceedings of the 11th American Conference on Wind Engineering, San Juan, Puerto Rico, 22–26 June 2009. [Google Scholar]
- Shademan, M.; Balachandar, R.; Barron, R.M. Detached eddy simulation of flow past an isolated inclined solar panel. J. Fluids Struct. 2014, 50, 217–230. [Google Scholar] [CrossRef]
- Shademan, M.; Barron, R.M.; Balachandar, R.; Hangan, H. Numerical simulation of wind loading on ground-mounted solar panels at different flow configurations. Can. J. Civ. Eng. 2014, 41, 728–738. [Google Scholar] [CrossRef]
- Aly, A.M.; Bitsuamlak, G. Aerodynamics of ground-mounted solar panels: Test model scale effects. J. Wind Eng. Ind. Aerodyn. 2013, 123, 250–260. [Google Scholar] [CrossRef]
- Aly, A.M. On the evaluation of wind loads on solar panels: The scale issue. Sol. Energy 2016, 135, 423–434. [Google Scholar] [CrossRef]
- Abiola-Ogedengbe, A.; Hangan, H.; Siddiqui, K. Experimental investigation of wind effects on a standalone photovoltaic module. Renew Energy 2015, 78, 657–665. [Google Scholar] [CrossRef]
- Mammar, M.; Djouimaa, S.; Gartner, U.; Hamidat, A. Wind loads on heliostats of various column heights: An experimental study. Energy 2018, 143, 867–880. [Google Scholar] [CrossRef]
- Geurts, C.; Steenbergen, R. Full scale measurements of wind loads on stand-off photovoltaic systems. In Proceedings of the 5th European and African Conference on Wind Engineering, Florence, Italy, 19–23 July 2009. [Google Scholar]
- Erwin, J.; Chowdhury, A.G.; Bitsuamlak, G.; Guerra, C. Wind effects on photovoltaic panels mounted on residential roofs. In Proceedings of the Thirteenth International Conference on Wind Engineering, Amsterdam, The Netherlands, 10–15 July 2011. [Google Scholar]
- Geurts, C.; Blackmore, P. Wind loads on stand-off photovoltaic systems on pitched roofs. J. Wind Eng. Ind. Aerodyn. 2013, 123, 239–249. [Google Scholar] [CrossRef]
- Bender, W.; Waytuck, D.; Wang, S.; Reed, D.A. In situ measurement of wind pressure loadings on pedestal style rooftop photovoltaic panels. Eng. Struct. 2018, 163, 281–293. [Google Scholar] [CrossRef]
- Baumgartner, F.P.; Büchel, A.; Bartholet, R. Solar wings: A new lightweight photovoltaic tracking system. In Proceedings of the 23rd European Photovoltaic Solar Energy Conference, Valencia, Spain, 1–5 September 2008. [Google Scholar]
- Baumgartner, F.P.; Büchel, A.; Bartholet, R. Experiences with cable-based solar wings tracking system and progress towards two axis large scale solar systems. In Proceedings of the 24th European Photovoltaic Solar Energy Conference, Hamburg, Germany, 21–24 September 2009. [Google Scholar]
- Baumgartner, F.P.; Büchel, A.; Bartholet, R. Cable-based solar wings tracking system: Two-axis system and progress of one-axis system. In Proceedings of the 25th European Photovoltaic Solar Energy Conference, Valencia, Spain, 6–9 September 2010. [Google Scholar]
- Czaloun, H. Supporting Cable Structure for PV Modules. patent WO2018 185128A1, 11 October 2018. [Google Scholar]
- He, X.H.; Ding, H.; Jing, H.Q.; Zhang, F.; Wu, X.P.; Weng, X.J. Wind-induced vibration and suppression of photovoltaic modules supported by suspension cables. J. Wind Eng. Ind. Aerodyn. 2020, 206, 104275. [Google Scholar] [CrossRef]
- He, X.H.; Ding, H.; Jing, H.Q.; Zhang, F.; Wu, X.P.; Weng, X.J. Mechanical characteristics of a new type of cable-supported photovoltaic module system. Sol. Energy 2021, 226, 408–420. [Google Scholar] [CrossRef]
- NB/T 10115-2018; Code for Design of Photovoltaic Modules Support Structures. General Electric Power Planning and Design Institute: Beijing, China, 2018.
- JIS C 8955; Load Design Guide on Structures for Photovoltaic Array. Japanese Standards Association: Tokyo, Japan, 2017.
- Browne, M.T.L.; Taylor, Z.J.; Li, S. A wind load design method for ground-mounted multi-row solar arrays based on a compilation of wind tunnel experiments. J. Wind Eng. Ind. Aerodyn. 2020, 205, 104294. [Google Scholar] [CrossRef]
- Yemenici, O.; Aksoy, M.O. An experimental and numerical study of wind effects on a ground-mounted solar panel at different panel tilt angles and wind directions. J. Wind Eng. Ind. Aerodyn. 2021, 213, 104630. [Google Scholar] [CrossRef]
- Jubayer, C.M.; Hangan, H. A numerical approach to the investigation of wind loading on an array of ground mounted solar photovoltaic (PV) panels. J. Wind Eng. Ind. Aerodyn. 2016, 153, 60–70. [Google Scholar] [CrossRef]
- JGJ 257-2012; Technical specification for Cable Structures. Ministry of Housing and Urban-Rural Construction of the People’s Republic of China: Beijing, China, 2012.
- JG/T 200-2007; Stainless Steel Strand For Structures. Ministry of Construction of the People’s Republic of China: Beijing, China, 2012.
- ASCE/SEI 19-16; Structural Applications of Steel Cables for Buildings. American Society of Civil Engineers: Reston, VA, USA, 2016.
- BS EN 1993-1-11:2006; Eurocode 3-Design of Steel Structures-Part 1–11: Design of Structures with Tension Components. British Standards Institution: London, UK, 2006.
- GB50009-2012; Load Code for the Design of Building Structures. Ministry of Housing and Urban-Rural Construction of the People’s Republic of China: Beijing, China, 2012.
- ASCE 7-16; Minimum Design Loads for Buildings and Other Structures. American Society of Civil Engineers: Reston, VA, USA, 2016.
- AS/NZS 1170.2; Australian/New Zealand Standards, Structural Design Actions-Part 2. Wind Actions. Standards Australia International Ltd.: Wellington, New Zealand, 2012.


Disclaimer/Publisher’s Note: The statements, opinions and data contained in all publications are solely those of the individual author(s) and contributor(s) and not of MDPI and/or the editor(s). MDPI and/or the editor(s) disclaim responsibility for any injury to people or property resulting from any ideas, methods, instructions or products referred to in the content. |
© 2023 by the authors. Licensee MDPI, Basel, Switzerland. This article is an open access article distributed under the terms and conditions of the Creative Commons Attribution (CC BY) license (https://creativecommons.org/licenses/by/4.0/).