Article

Comparative Insights into the Microbial Diversity and Community Structure of Striga hermonthica-Infested Maize Rhizosphere

by
Olumayowa Mary Olowe
1,
Ayansina Segun Ayangbenro
1,
Akinlolu Olalekan Akanmu
1,
Funso Raphael Kutu
2,
Jude J. O. Odhiambo
3 and
Olubukola Oluranti Babalola
1,*
1
Food Security and Safety Focus Area, Faculty of Natural and Agricultural Sciences, North-West University, Private Bag X2046, Mmabatho 2735, South Africa
2
School of Agricultural Sciences, University of Mpumalanga, Private Bag X11283, Mbombela 1200, South Africa
3
Department of Plant and Soil Sciences, Faculty of Science, Engineering and Agriculture, University of Venda, Thohoyandou 0950, South Africa
*
Author to whom correspondence should be addressed.
Appl. Sci. 2023, 13(5), 3260; https://doi.org/10.3390/app13053260
Submission received: 13 February 2023 / Revised: 27 February 2023 / Accepted: 2 March 2023 / Published: 3 March 2023
(This article belongs to the Special Issue Sustainable Strategies for Pest Management in Plants and Animals)

Abstract

:
The damaging competition between crops and parasitic weeds has a negative impact on agricultural productivity; however, the impact of disturbance on the soil’s microbial community has received less attention. Hence, this study investigates the microbial composition and diversity of the maize rhizosphere infected with Striga hermonthica using a shotgun sequencing approach from two maize-growing fields (Eruwa, Nigeria and Mbuzini, South Africa). The rhizosphere soil DNA was extracted from infested soil using a Nucleospin soil genomic DNA extraction kit and sequenced on an Illumina platform. The dominant phyla were Actinobacteria, Bacteroidetes, Deinococcus-Thermus, Acidobacteria, Chloroflexi, Cyanobacteria, Planctomycetes, Verrucomicrobia, Chlorobi, Proteobacteria, Firmicutes, Nitrospirae, Thermotogae, Synergistetes, Ascomycota, Euryarchaeota, and Crenarchaeota. Bacteria phyla were observed to be of higher proportion in the rhizosphere soil samples obtained from Striga-infested maize field in Eruwa (Es) than those recovered from Mbuzini (Ms). The alpha diversity of microbial communities indicated insignificance differences (p > 0.05) between the five taxonomical groups (phylum, class, order, family, and genus), while the beta diversity produced a significant (p = 0.01, R = 0.52) difference in the microbial diversity of the infested soil. In summary, the study sheds light on the diversity and composition of the microbiome of Striga hermonthica-infested soil, which influences the microbial functions in the management and sustenance of plant health against parasitic weeds.

1. Introduction

Striga hermonthica is a hemiparasite of grasses of the Orobanchaceae family that affects crops in Sub-Saharan Africa (SSA). These species of Striga attack crops, such as maize, sorghum, finger millet, rice, and pearl millet, thereby causing major annual harvest yield reductions and decreasing crop productivity [1]. It depends entirely on its host plants for nutrients and growth, which results in significant crop damage, such as wilted silk, reduced height, thin stalks, total crop loss, or death in farmlands with a heavy infestation. The infestation of the parasitic weed is particularly pronounced in the region with poor management practices, typical poor soil, and intensive farming. The most prevalent and agronomically important Striga species in Sub-Saharan Africa are Striga hermonthica, S. aspera, S. forbesii, and S. asiatica [2,3]. They parasitize a wide range of cereal crops, such as Zea mays, Sorghum bicolor, Eleusine coracana L., and Oryza spp. L., and Pennisetum glaucum L. In addition, dicots, such as Vigna unguiculata L., Nicotiana tabacum L., Vigna subterranean L., and Ipomea batata L. are parasitized by Striga gesnerioides [4].
Striga spp. were identified as the main biotic constraints to the production of cereal in SSA with a significant reduction in quality and yield ranging from 30% to 90% [5,6]. According to Ejeta [7] and Scholes and Press [8], it was estimated that approximately 100 million people are faced with food insecurity due to the impacts of Striga, resulting in an annual economic loss of about USD 1 billion.
Many studies have shown the damaging impact of competition between crops and weeds on agricultural output; however, the microbiological component is given less attention [9,10,11]. A wide diversity of microorganisms, including beneficial, harmful, and neutral microbes, may interact with plant roots simultaneously in the rhizosphere during plant growth and development. Meanwhile, an extensive study has been conducted to determine how disturbances affect the composition of the soil microbial population [12,13].
Seasonal fluctuations may differ in terms of temperature, soil nutrient concentration, and rainfall. In contrast to seasons with low temperatures and soil moisture, such as spring, seasons with high temperatures and soil moisture, such as summer, enhance microbial activities and nutrient cycling [14]. Considering cultivated agricultural soils, Lin, et al. [15] showed that changes in environmental conditions had a significant impact on the diversity and composition of bacteria, particularly on the dominating bacterial population. In addition, it was found that Chloroflexi and Actinobacteria were significantly higher in summer, whereas Acidobacteria was significantly higher in spring [16]. It is therefore necessary to understand the effect of season on soil microorganisms in agricultural soil infested with S. hermonthica.
In addition, several researchers have reported the impact of land use types on soil properties, such as organic carbon, soil pH, and soil water content, which are closely related to the structure and diversity of microbial communities [17,18,19]. Grasslands for animal feed and cropland for yields are two common types of land use in agriculture. Decline in soil microbial diversity and related soils have been linked to crop management methods, such as the use of inorganic fertilizers, intense tillage, and monoculture [20]. However, various studies have revealed varied impacts of cropland and grassland management on certain microorganisms because of differences in soil characteristic functions, experimental sites, and setups [21]. Based on the results of the high-throughput sequencing, Liu, et al. [22] observed significant levels of α diversity in the farmland for both bacteria and fungi. In another study, the abundance of Verrumicrobiota increased in cropland and decreased in grasslands in European soils [23]. In addition, Sui et al. [17] revealed that microbial community structures are affected by the agricultural cultivation of wetlands by altering the pools of available soil carbon, nitrogen, and phosphorus.
The recent development in next-generation DNA sequencing (NGS) technology, including metagenomics analysis, has given the opportunity to enhance our understanding of the composition and function of soil microbial communities. The composition and diversity of fungi in soil and plant samples have been studied using molecular techniques, such as internal transcribed spacer (ITS), whereas bacteria have been studied using 16S rRNA. However, to examine the total microbial community in an environment, shotgun metagenomics has turned out to be more advantageous than other metagenomics techniques [24]. It allows the taxonomic and functional classification of the total microbial community in a particular environment. Currently, there exists a paucity of knowledge regarding the effects of seasonal variations and land use patterns on the soil microbial community in the parasitic weed infested maize fields. We, therefore, postulate that increased microbial diversity will improve the functions of the soil ecosystem and its tolerance to both seasonal changes and other associated effects of land use disturbances. However, a decrease in diversity could result in the loss of ecological systems, which would decrease the stability of the system. To ensure the sustainable provision of ecosystem services, soil microbial diversity is therefore important. Thus, we reveal the microbial diversity and composition within the maize rhizosphere in the Striga hermonthica-infected field using a shotgun metagenomics sequencing approach. This improved ecological understanding will open up avenues to develop practical control strategies for S. hermonthica.

2. Materials and Methods

2.1. Soil Sample Collection

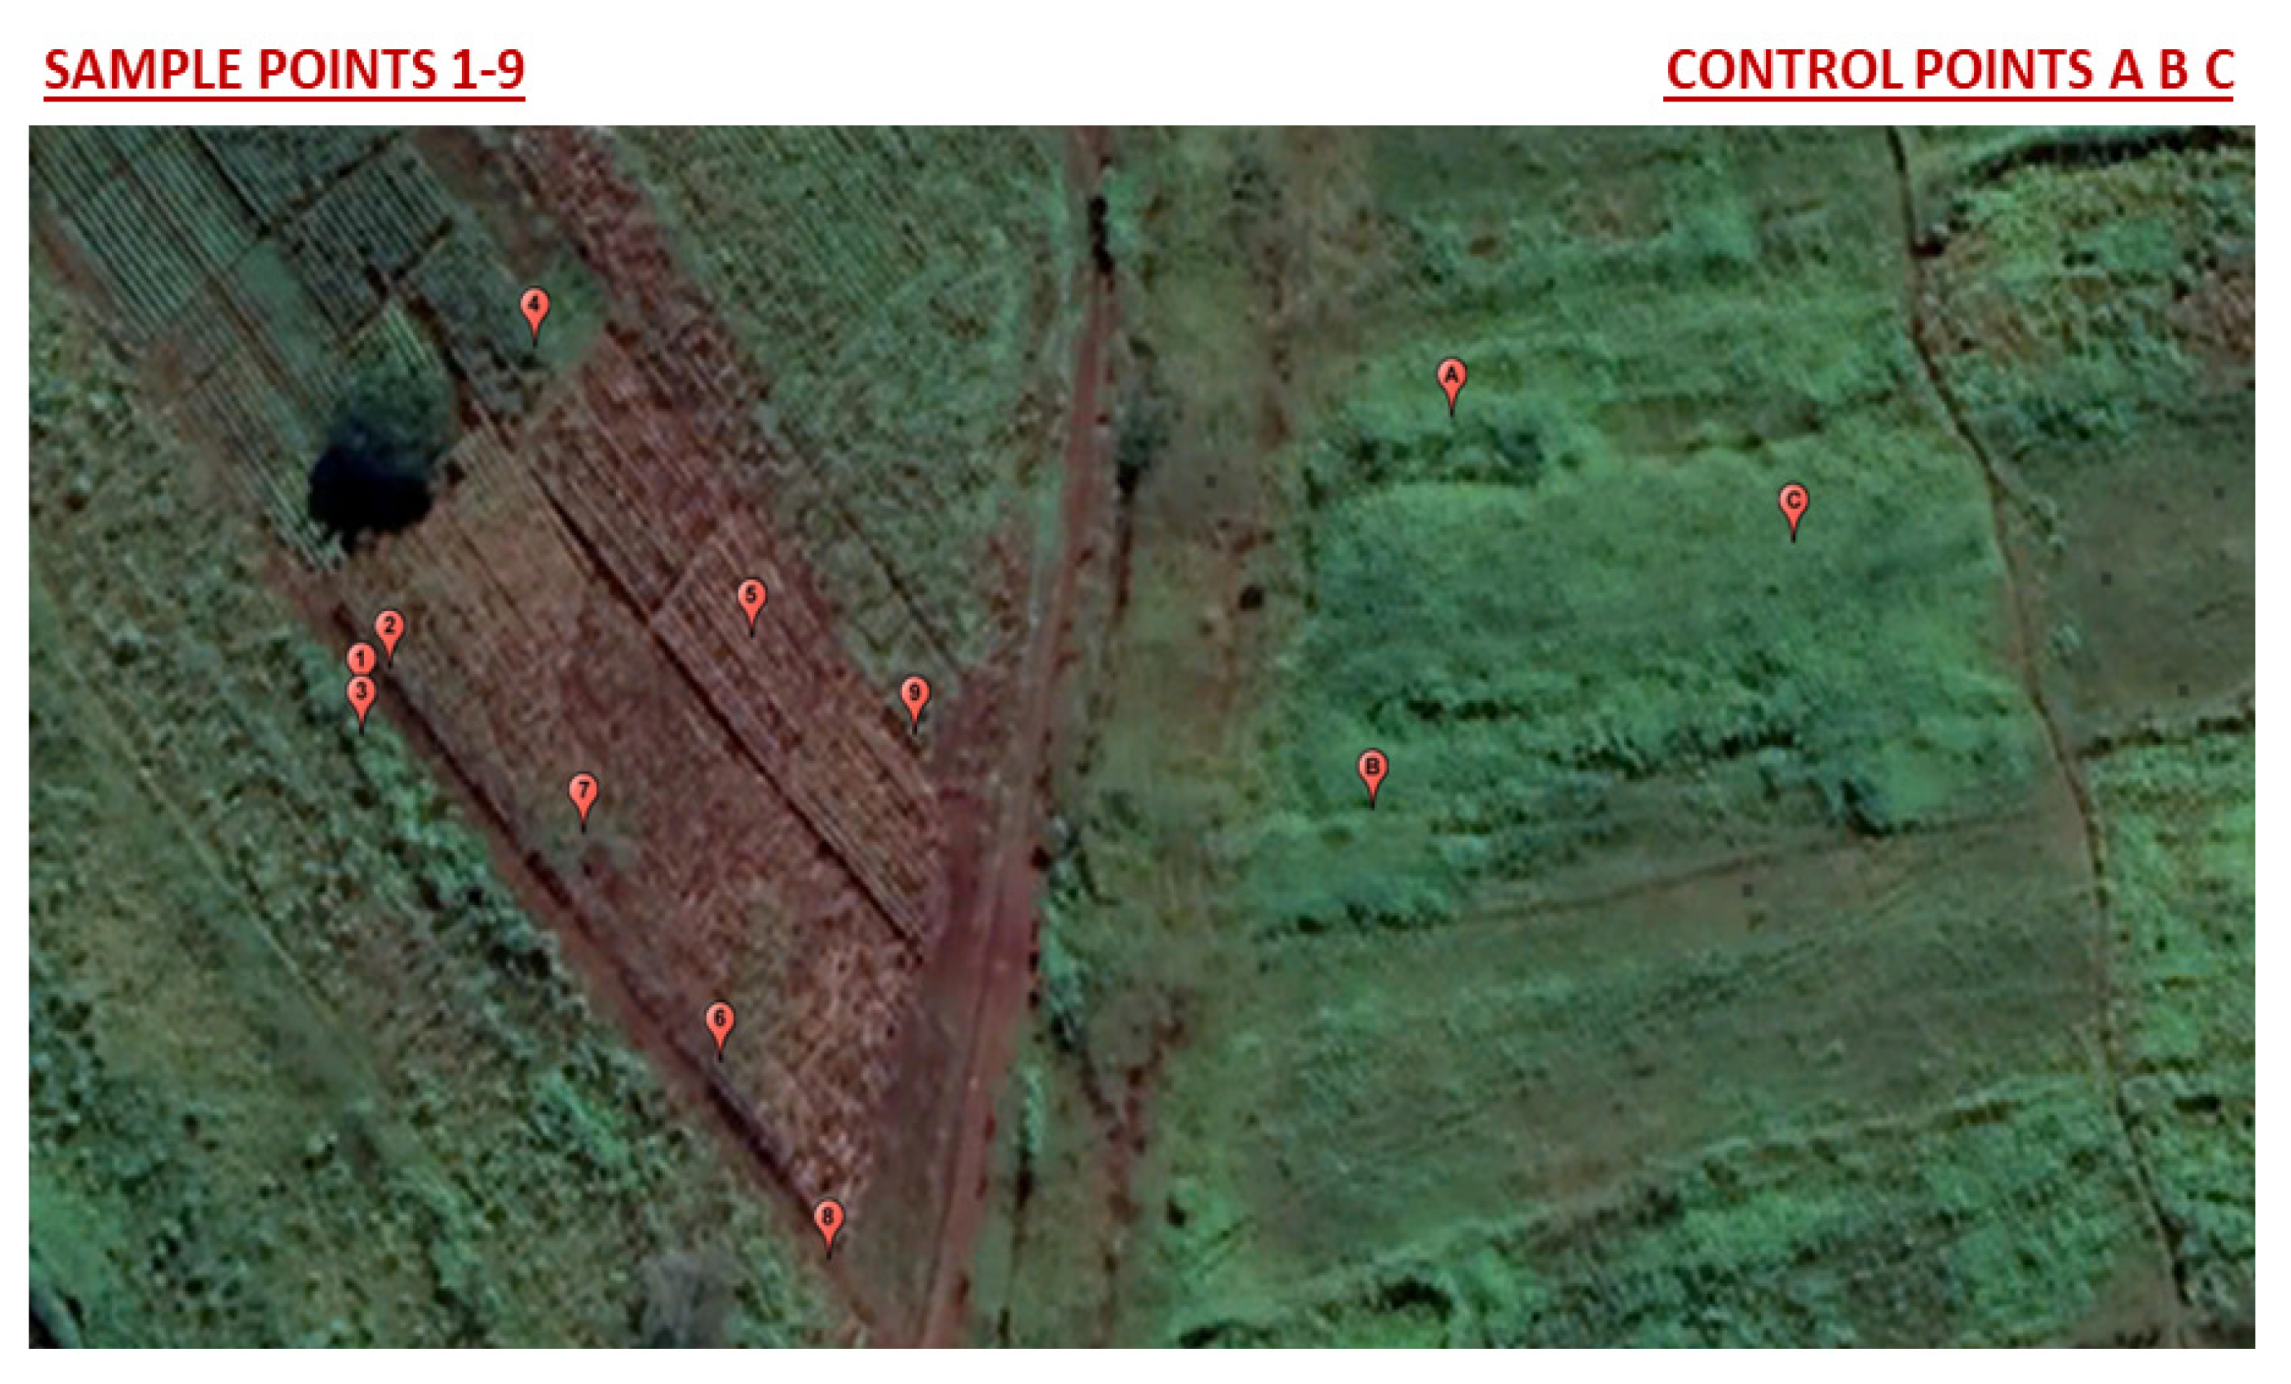
Rhizosphere soil samples were collected from maize-cultivated fields in Eruwa, Oyo state, Nigeria (7°28′2.034″ N 3°28′21.671″ E) and Mbuzini, Mpumalanga Province, South Africa (25°55′30.90″ S 31°56′11.70″ E). Maize has been cultivated on the two sampled fields in the two locations for more than a decade, and they both had a history of Striga hermonthica infestation. The rhizosphere soil samples were collected in January 2022 during the dry season in Eruwa, Nigeria, with an average temperature of 33 °C and cumulative rainfall of 8 mm, while in Mbuzini, Mpumalanga Province of South Africa, rhizosphere soil samples were collected in March 2022 with an average temperature of 21 °C and cumulative rainfall of 38 mm. The soil samples were obtained randomly in three replicates at four different points on the Striga-infested sites, while uninfected soil samples (bulk) were also taken at a depth and diameter of 15 cm and 8 cm, respectively (Figure 1 and Figure 2). Each sample was divided into two parts. Before analyzing the physicochemical characteristics, one part was air-dried and homogenized, while the other part was kept at −80 °C for DNA extraction.

2.2. Analysis of the Physicochemical Properties of Soil

A total of 500 grams of soil were taken from an air-dried sample and then sieved through a 2 mm porosity sieve to eliminate dirt. After combining the samples with distilled water at a ratio of 1:2.5 soil, the pH of the mixtures was measured using a pH meter (Jenway, Bibby Scientific Ltd., Stone, Staffs, UK). The organic matter (OM) was determined by loss of ignition method [25]; organic carbon (Org-C) was quantified by the method of Walkley and Black [26]; and total carbon and nitrogen were determined using the dry combustion method [27]. The exchangeable N-NH4 and N-NO3 were calculated in 1 M KCl solution in accordance with Kachurina, et al. [28], and the absorbance was measured spectrophotometrically (Helios Epsilon, Thermo Scientific, USA) at 260 nm and 220 nm. Using Bray No. 1 solution as the extractant, the phosphorus content of the soil was calculated [29]. The sulfate content of the soil was measured as described by Calvo, et al. [30], while sodium and potassium were determined by flame photometer (model FP6410, Drawell International Technology Limited, Shanghai, China) [31].

2.3. DNA Extraction of Soil Samples and Library Preparation

The rhizosphere soil DNA was extracted from a 500 mg soil sample using a Nucleospin soil genomic DNA extraction kit according to manufacturer’s instructions. The Illumina sequencing platform was used for shotgun whole-genome sequencing at Novogene AIT Genomics Singapore Pte Ltd. A Nextera DNA flex library kit was used to prepare libraries containing 20–50 ng of DNA. The samples were then fragmented simultaneously, and adapter sequences were added. The concentration of the libraries was measured using the Qubit® dsDNA HS Assay Kit (Life Technologies, Carlsbad, CA, USA), and the average library size was determined using an Agilent 2100-Bioanalyzer. The libraries were pooled and diluted to 0.6 nM before being sequenced for 300 cycles on the Illumina NovaSeq 6000 platform.

2.4. Metagenome Sequence Annotation and Statistical Analysis

The uploaded raw metagenome sequences on a metagenomics rapid annotation subsystem technology (MG-RAST) server were subsequently subjected to quality filtering using SolexaQA to trim low-quality reads, and the metagenome datasets were dereplicated [32]. The quality control process involves the elimination of the artificial sequences, the filtering of ambiguous bases, the determination of a minimum read size, and length filtering. Subsequently, the sequences produced were annotated using BLAT against the M5NR database, the allowing for non-redundant integration of several datasets [33,34]. More than 90% of the taxonomic classifications were assigned along with other domains in the SEED subsystems database on the MG-RAST platform. The unclassified reads related to the microbial domain were retained for statistical analysis after sorting and agglomerating the replicates’ mean abundance values. The normalization option on the MG-RAST was chosen to reduce the effects of the experimental error. The identified microbiomes were organized based on the taxonomic classification, and the unclassified sequence reads were retained for statistical analysis. The relative abundance of the taxa was calculated in percentages following an independent analysis of the 24 sequences using MG-RAST. The average relative abundance values from the three replicates for each sample site (Es1, Es2, Es3 Ec and Ms1, Ms2, Ms3 Mc) were used for the statistical analysis. The accession number for these sequences may be obtained on the NCBI SRA collection under the Bioproject accession number PRJNA888840 for soil samples from Eruwa (Es) and PRJNA889583 for Mbuzini (Ms).
After the data was modified, the Shinyheatmap was used to plot the relative abundance graph of microbial communities at the phylum level [35]. PAST version 3.20 was used to calculate the Shannon diversity and Pielou Evenness indices for each sampling site, and the Kruskal–Wallis test was used to compare the indices between the sites. Primary coordinate analysis using a Euclidean distance matrix was used to determine the beta diversity, and one-way analysis of similarities was used to evaluate the variances in the community structure between the locations (ANOSIM) [36].

3. Results

3.1. Physicochemical Properties of Striga Hermonthica-Infested Maize Rhizosphere and Bulk Soils

The outcomes of a comparison of the physicochemical characteristics between the two sampling sites, (Eruwa, Nigeria and Mbuzini, South Africa) are shown in Table 1. The S. hermonthica-infested soil samples revealed that the pH in soil samples Es2 and Es3 was basic in comparison to Es1 and Ec (bulk soil), which were acidic, and that soil samples Ms1, Ms2, Ms3, and Mc (bulk) were all acidic. When compared to soil samples E3 and Ec (bulk), available phosphorus, organic carbon, organic matter, total nitrogen, and total carbon were more significant (p ≤ 0.05) in soil samples E1 and E2, while potassium, sodium, ammonium, and sulfate were more significant (p ≤ 0.05) in soil samples Ms1 and Ms2 compared to M3 and Mc (bulk) (Table 1).

3.2. Metagenome Dataset of the Striga Hermonthica-Infested Soil across the Sampling Sites

The raw sequences uploaded for analysis on MG-RAST server showed the mean value of samples from the rhizosphere of Striga-infested maize from Eruwa, Nigeria were Es1—3,728,213.3, Es2—29,591,867, Es—333,321,075, and Ec—4,130,496, and those from Mbuzini, South Africa were Ms1—3,318,161.3, Ms2—5,201,988, Ms3—4,989,910.67, and Mc—5,029,225 (Supplementary Table S1). The quality of retained mean sequences after the quality control (QC) assessment were recorded as Es1—2,946,553.3, Es2—23,440,439.7, Es3—27,489,973.5, and Ec—274,899,73.5, for Eruwa, Nigeria and Ms1—2,628,894.3, Ms2—4,361,224.5, Ms3—4,112,527.33, and Mc—4,192,873.67 for Mubizini, South Africa for the rhizosphere and bulk samples (Supplementary Table S1).

3.3. Distribution of the Major Microbiome Phyla in the Infected Soil Samples

The major bacteria, fungi, and archaea, and their abundance, are presented in Figure 3. Except for Actinobacteria and Gemmatinonadetes, the majority of the phyla are more prevalent in the rhizosphere soils from Eruwa (Es1, Es2, Es3, and Ec) than in the rhizosphere soil from Mbuzini (Ms1, Ms2, Ms3, and Mc).
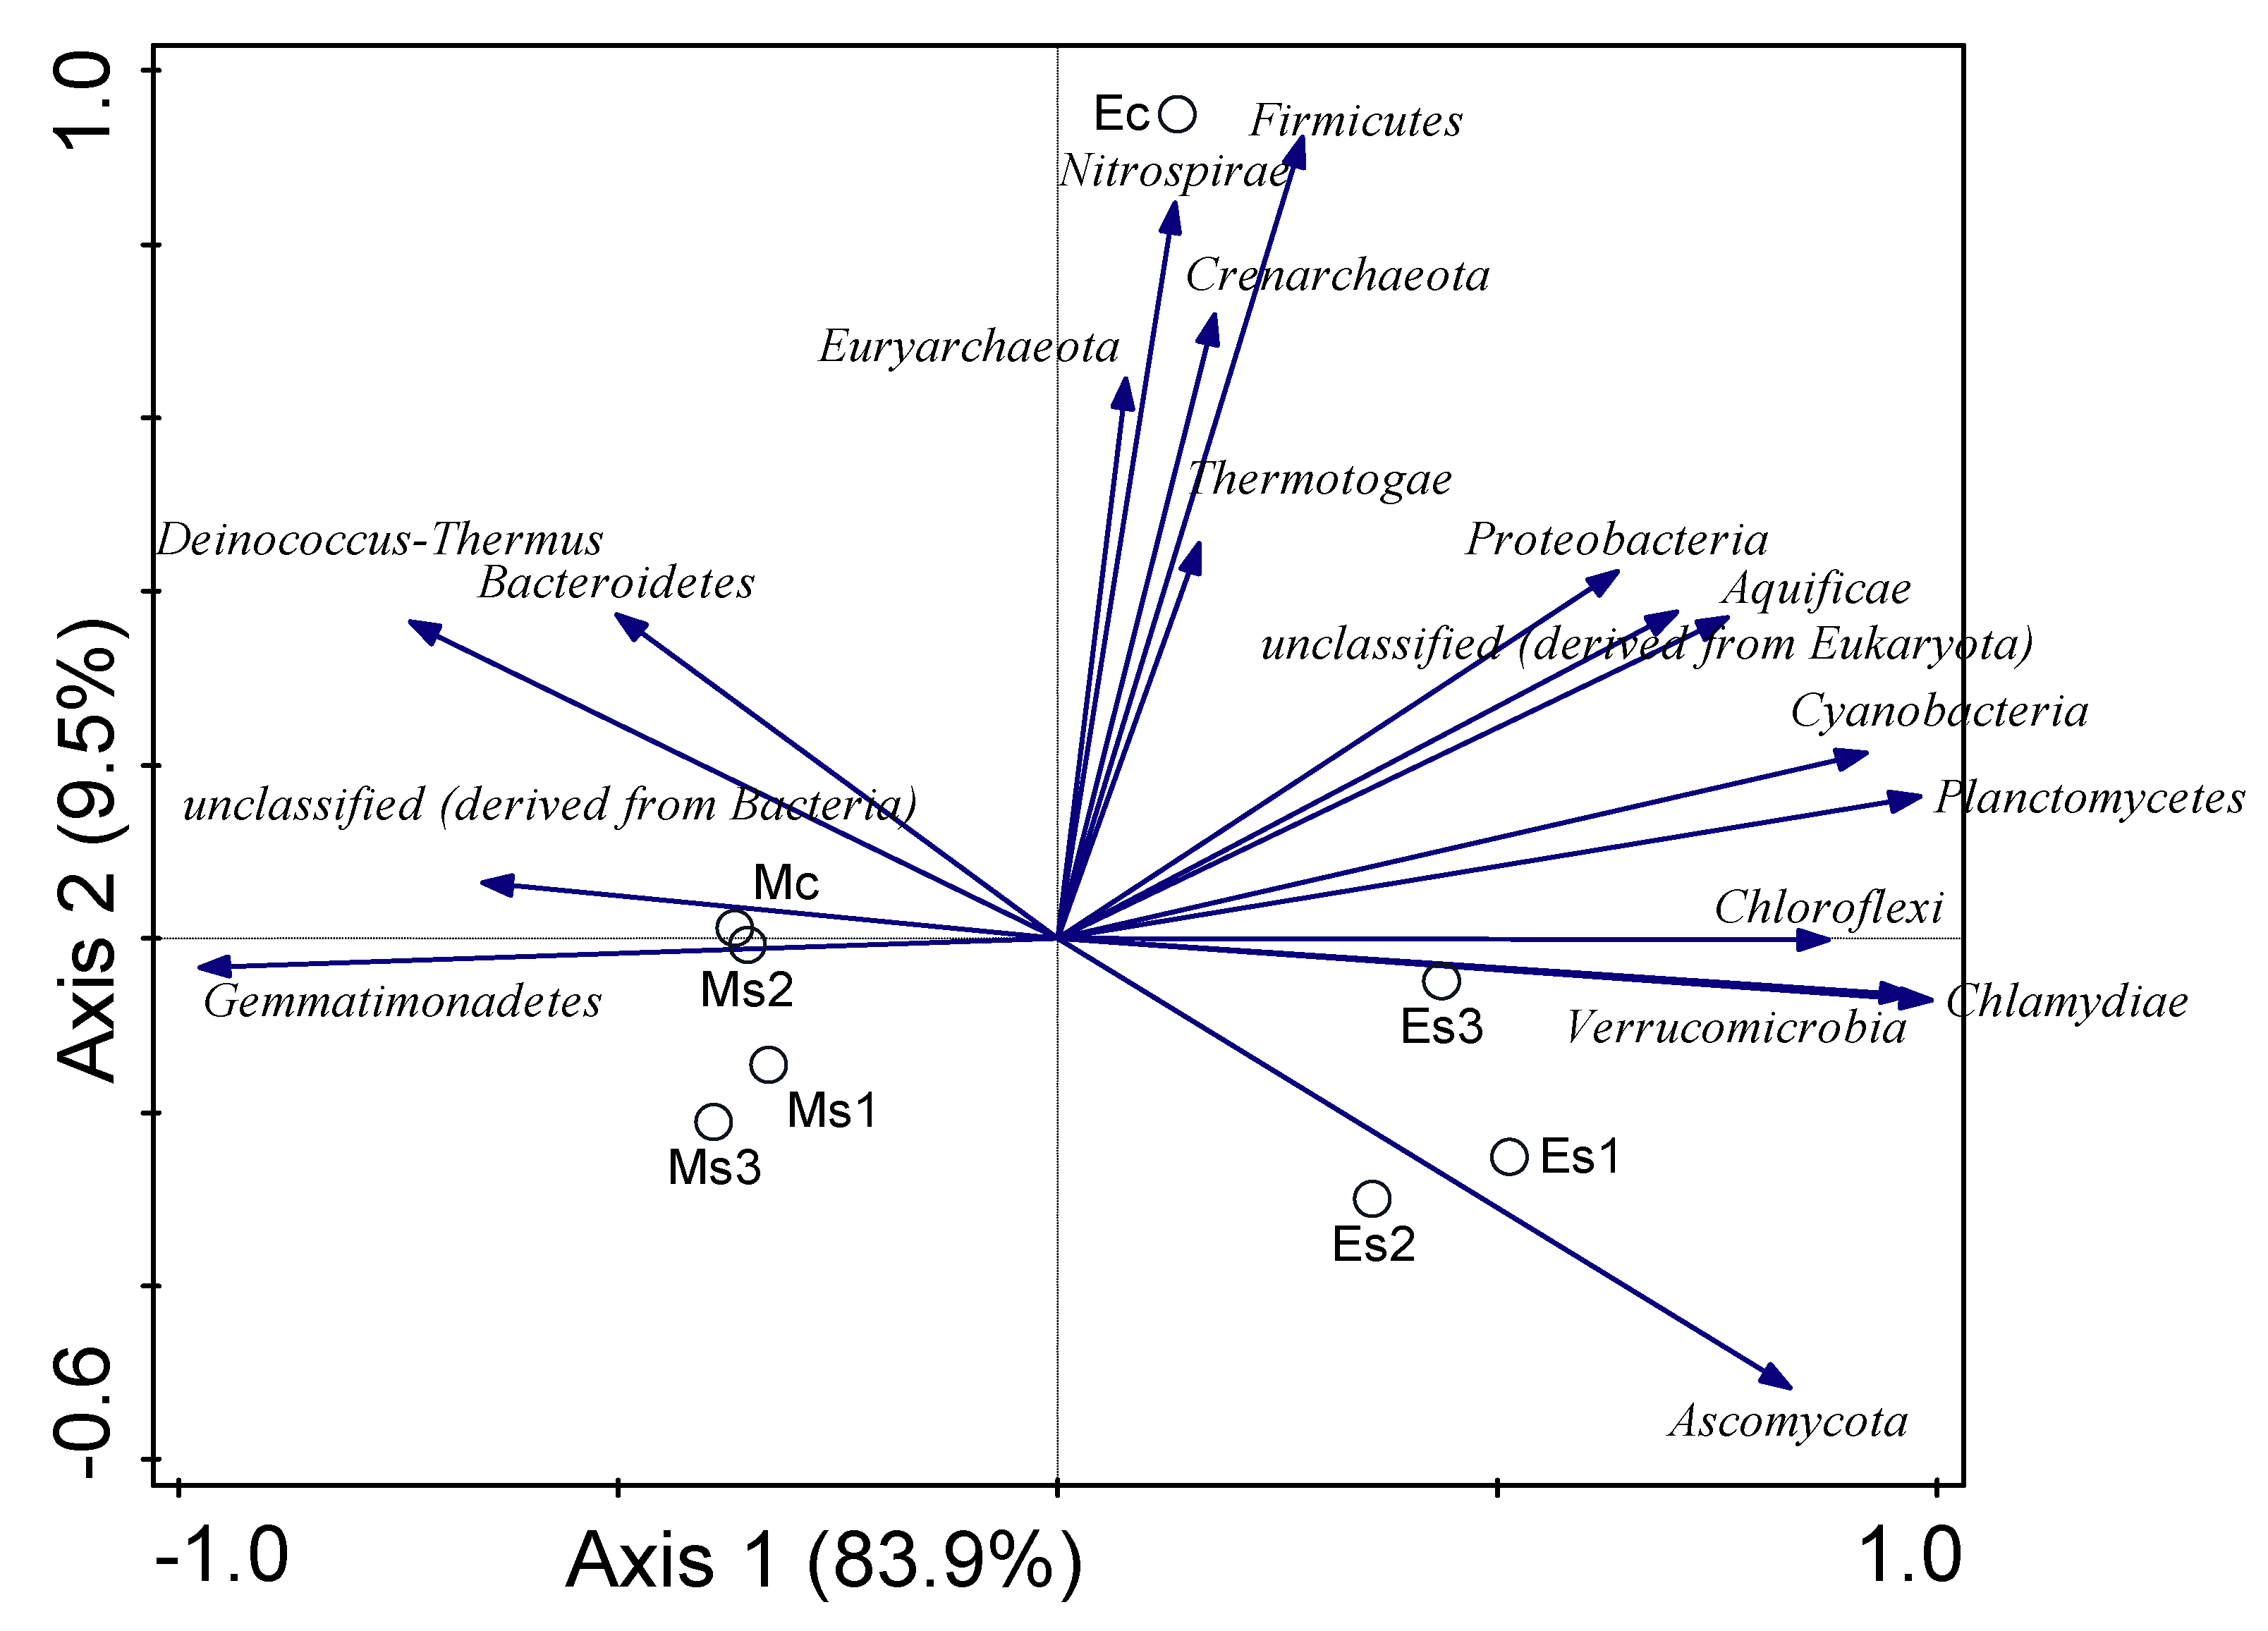
Actinobacteria, Bacteroidetes, Deinococcus-Thermus, Acidobacteria, Chloroflexi, Cyanobacteria, Planctomycetes, Verrucomicrobia, Chlamydiae, Aquificae, Spirochaetes, Chlorobi, Deferribacteres, proteobacteia, fermicutes, Nitrospirae, Thermotogae, and Synergistetes are the main bacteria phyla, while Archaea and fungal phyla consisted of Euryarchaeota, Crenarchaeota, and Ascomycota, respectively (Figure 3). In soil samples from Eruwa, Nigeria, and Mbuzini, South Africa, which had been infested by Striga hermonthica, and in the bulk soil sample, the microbial community was found to be more abundant, including Es1, Es2, Es3, and Ec (bulk soil), as well as Ms1, Ms2, Ms3, and Mc (bulk soil), as shown in Figure 2. Moreover, treatment Ec (bulk soil) had the highest bacterial phyla distribution as depicted by the principal component analysis (Figure 4).
Bacterial phyla were observed to be of higher proportion in the rhizosphere soil samples obtained from Striga-infested maize field in Eruwa (Es) than those recovered from Mbuzini (Ms). The bacterial phyla include Proteobacteria (Es1 = 39.11%, Es3 = 40.80%, and Ec = 42.04%), Firmicutes (Es1 = 5.55%, Es3 = 5.23%, and Ec = 7.10%), Planctomycetes (Es1 = 4.30%, Es2 = 3.80%, Es3 = 4.50%, and Ec = 3.6%), Choroflexi (Es1 = 4.51%, Es2 = 3.38%, Es3 = 3.85%, and Ec = 3.55%), Cyanobacteria (Es1 = 3.22%, Es2 = 2.53%, Es3 = 2.76%, and Ec = 2.80%), Verrucomicrobia (Es1 = 2.83%, Es2 = 2.69%, Es3 = 2.44%, and Ec = 2.15%), Chlamidae (Es1 = 0.14%, Es2 = 0.09%, Es3 = 0.010%, and Ec = 0.11%), Bacteroidetes (Ms1 = 2.71%, Ms2 = 2.37%, Ms3 = 2.29, and Mc = 2.11%), Deinococcus-Thermus (Es1 = 0.84%, Es2 = 0.87%, Es3 = 0.86%, and Ec = 0.90%), Gemmatimonadetes (Es1 = 1.47%, Es2 = 1.47%, Es3 = 1.22, and Ec = 1.30%), and unclassified bacteria (Es1 = 0.34%, Es2 = 0.33%, Es3 = 0.35%, and Ec = 0.35%). Euryarcheota (Es1= 0.89%, Es3 = 0.81%, and Ec = 0.91%) (Ms1 = 0.82%, Ms2 = 0.81, and Mc = 0.84%) showed higher abundance in both infected soil samples collected from both Eruwa and Mbuzini, while Crenarcheota (Es1 = 0.16%, Es3 = 0.16, and Ec = 0.18%) were more predominant and showed higher abundance in infected soil from Eruwa. Ascomycota (Es1 = 1.41%, Es2 = 0.97%, and Es3 = 0.95%) was also observed to have higher proportion in Striga-infested soil from Eruwa (Es) (Figure 3).
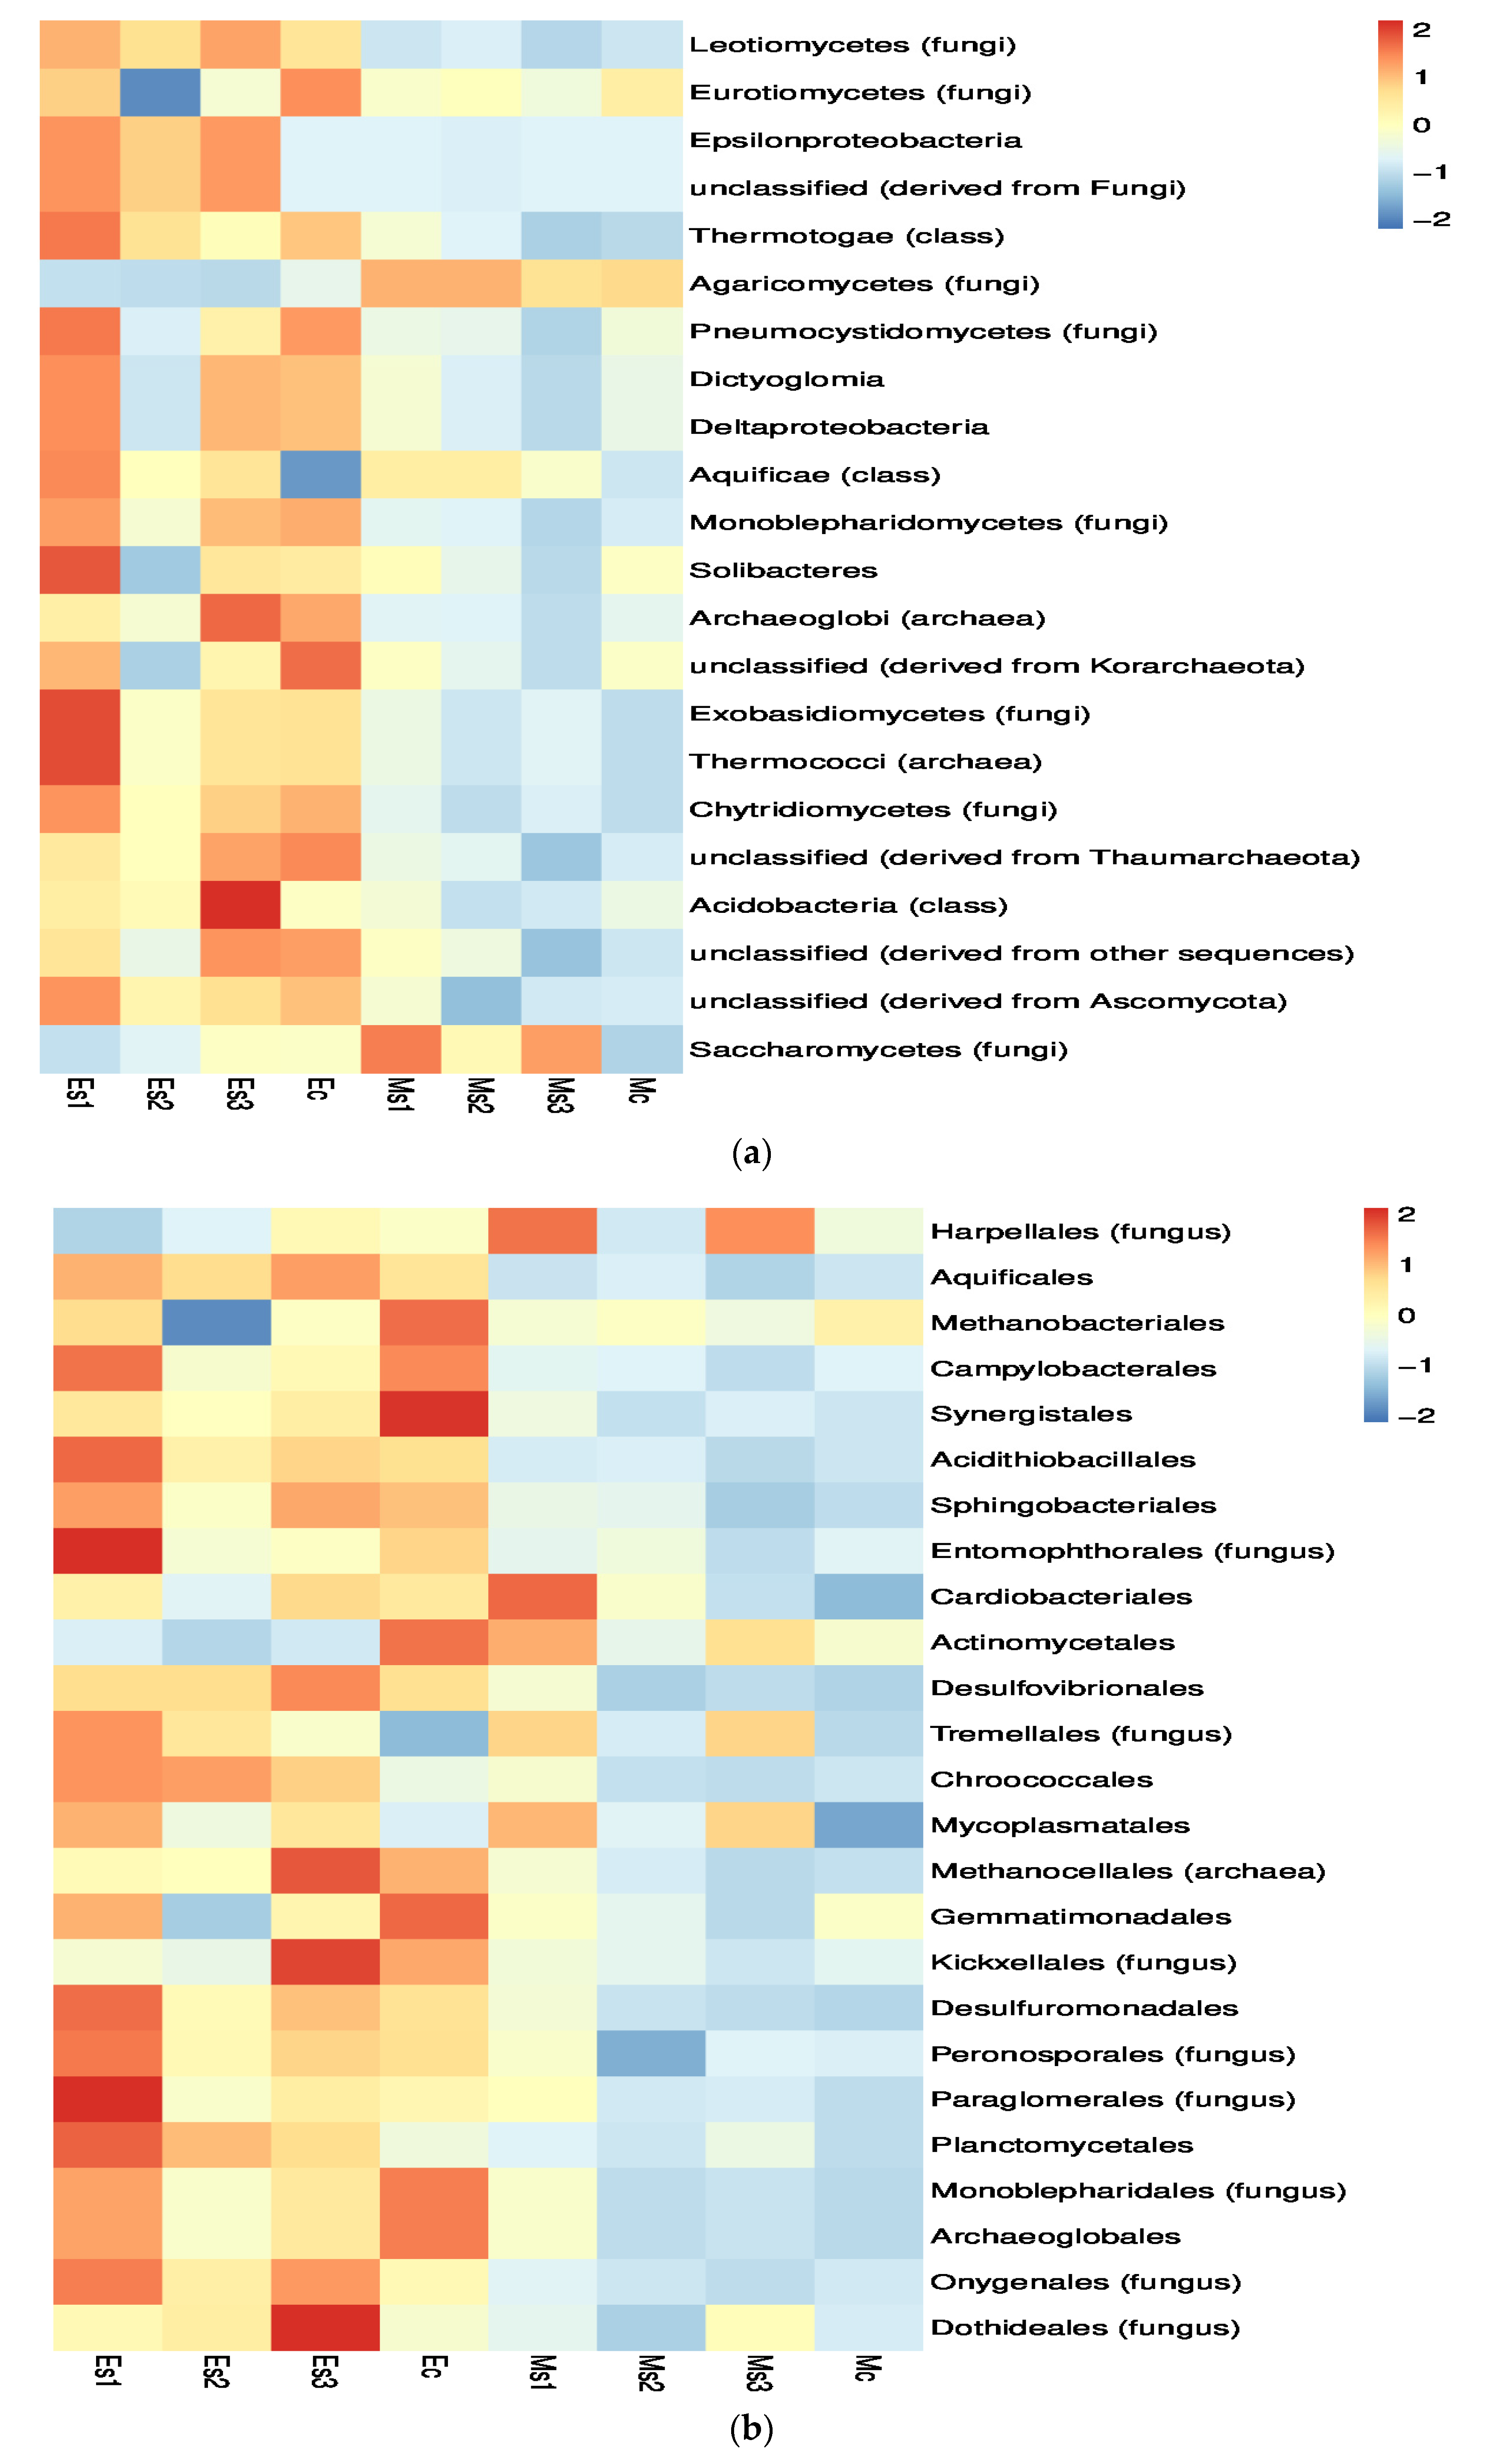
With the exception of Agaricomycetes (fungi) (Ms1 = 1.47%, Ms2 = 1.47%, Ms3 = 1.22%, and Mc 1.30%) and Saccharomycetes (fungi) (Ms1 = 0.009%, Ms2 = 0.007%, Ms3 = 0.008%, and Mc = 0.005%), the class revealed that there were more fungi in Eruwa than Mbuzini. Eurotiomycetes (fungi) (Es1 = 3.01%, Es3 = 2.80%, and Ec = 3.12%) (Ms1 = 2.80%, Ms2 = 2.85%, and Mc= 2.92%) and Pneumocystidomycetes (fungi) (Es1 = 0.35%, Es3 = 0.32%, and Ec = 0.34%) (Ms1 = 0.29%, Ms2 = 0.29%, and Mc = 0.30%) showed higher abundance in both infected soil samples collected from both Eruwa and Mbuzini. Class bacteria showed higher abundance from Striga-infested and bulk soil samples recovered from both Eruwa and Mbuzini, with the exception of Epsilonproteobacteria (Es1 = 1.56%, Es2 = 1.31%, Es3 = 1.55%, and 0.48%), Thermotogae (class) (Es1 = 0.57%, Es2 = 0.51%, Es3 = 0.47%, and 0.53%) and Acidobacteria (class) (Es1 = 0.01%, Es2 = 0.01%, Es3 = 0.02%, and 0.01%). Class Archaea consisting of Archaeoglobi (Es1 = 0.06%, Es2 = 0.06%, Es3 = 0.07%, and Ec = 0.05%), unclassified (derived from Korarchaeota) (Es1 = 0.05%, Es2 = 0.04%, Es3 = 0.04%, and Ec = 0.53%), Thermococci (archaea) (Es1 = 0.03%, Es2 = 0.02%, Es3 = 0.03%, and Ec = 0.03%) and unclassified (derived from Thaumarchaeota) (Es1 = 0.02%, Es2 = 0.02%, Es3 = 0.02%, and Ec = 0.02%) were observed to show more abundance in the soil sample from Eruwa (Es) (Figure 5a).
Other bacteria were more predominant in infested rhizosphere soil and bulk samples (Es and Ec) obtained from Eruwa compared to soil samples from Mbuzini (Ms and Mc). The Order bacteria were observed to be more predominant and showed more abundance in soil samples obtained from Eruwa, with the exception of Methanobacteriales (Ms1 = 2.0%, Ms2 = 2.0%, Ms3 = 2.0%, and Mc = 2.1%) and Actinomycetales (Ms1 = 0.22%, Ms2 = 0.18%, Ms3 = 0.21%, and Mc = 0.19%). In addition, Mycoplasmatales (Es1 = 0.07% and Es3 = 0.07%) and (Ms1 = 0.07% and Ms3 = 0.07%) was in abundance in both infected soil samples collected from both Eruwa and Mbuzini. The order fungi consisting of Entomophthorales (Es1 = 0.40%, Es2 = 0.31%, Es3 = 0.32%, and Ec = 0.35%), Kickxellales (Es1 = 0.03%, Es2 = 0.03%, Es3 = 0.03%, and Ec = 0.03%), Peronosporales (Es1 = 0.006%, Es2 = 0.005%, Es3 = 0.006%, and Ec = 0.006%), Paraglomerales (Es1 = 0.004%, Es2 = 0.002%, Es3 = 0.003%, and Ec = 0.003%), Monoblepharidales (Es1 = 0.003%, Es2 = 0.003%, Es3 = 0.003%, and Ec = 0.003%), Onygenales (Es1 = 0.0005%, Es2 = 0.0004%, Es3 = 0.0005%, and Ec = 0.0004%), and Dothideales (Es1 = 0.0003%, Es2 = 0.0003%, Es3 = 0.0004%, and Ec = 0.0002%) were observed to be more predominant and showed more abundance in the infected rhizosphere soil samples obtained from Eruwa (Es) compared to Mbuzini (Ms). The fungi that were in abundance in both sampling sites include Harpellales (Es1 = 5.7%, Es2 = 5.9%, Es3 = 6.1%, and Ec = 6.0%) (Ms1 = 6.6%, Ms2 = 5.8%, Ms3 = 6.5%, and Mc = 6.0%) and Tremellales (Es1 = 0.1% and 0.1%) and (Ms1 = 0.1% and 0.1%). Methanocellales (archaea) (Es1 = 0.07%, Es2 = 0.07%, Es3 = 0.08%, and Ec = 0.07%) were also observed to have a higher proportion in Striga-infested soil from Eruwa (Es) (Figure 5b).
Bacterial families are predominant and showed high abundance in the Striga-infested rhizosphere and bulk soil samples recovered from Eruwa (Es). Meanwhile, Nannocystaceae (Ms = 0.051%, Ms2 = 0.062%, Ms3 = 0.060%, and Mc = 0.63%) showed more abundance in Striga-infested and bulk soil samples obtained from Mbuzini (Ms). In addition, Thermaceae was observed to be abundant in Es1 = 0.027%, Es3 = 0.023%, and Ec = 0.026%, Ms1 = 0.024%, Ms2 = 0.023%, and Mc = 0.024%, Heliobacteraceae, Es3 = 0.14%, Ec = 0.13%, and Ms1= 0.13% and Ms3= 018%, unclassified (derived from Thermotogales) Es1 = 0.048%, Ec = 0.062%, and Ms1 = 0.052% and Ms2 = 0.049%, Hahellaceae Es1 = 0.045%, Es3 = 0.042%, Ec = 0.051%, and Ms1 = 0.044%, Ms2 = 0.043%, and Mc = 0.044%, and Rickettsiaceae Ec= 0.032%, Ec = 0.048%, and Ms1 = 0.031%, Ms = 0.031%; that is, they showed abundance in the soil samples from both sites. All fungal families present showed high abundance in soil samples from Eruwa, compared to Mbuzini except for Xylariaceae (fungus) (Ms1 = 0.20%, Ms2 = 0.23%, Ms3 = 0.23%, and Mc = 0.25%). Ferroplasmaceae (archaea) was more predominant in soil samples Ms1 = 0.21%, Ms2 = 0.23%, Ms3 = 0.23%, and Mc = 0.24% recovered from Mbuzini, while Nitrosopumilaceae (archaea) was more abundant in Eruwa soil samples (Ms1 = 0.87%, Ms2 = 0.65%, Ms3 = 0.70%, and Mc = 0.72%) when compared to Eruwa (Es) (Figure 5c).
Generally, there were more predominant bacterial genera in infested and bulk rhizosphere soil samples from Eruwa (Es1, Es2, Es3, and Ec), with the exception of Epulopiscium (Ms1 = 0.81%, Ms2 = 0.65%, Ms3 = 0.67%, and Mc = 0.64%) obtained from soil samples from Mbuzini. In addition, there were bacteria genera that showed abundance in some of the soil samples obtained from both sampling sites, such as, Ammonifex (Es3 = 0.003% and Ec = 0.004%) (Ms1 = 0.003% and Ms2 = 0.003%), Butyrivibrio (Es1 = 0.23%, Es2 = 0.22%, Es3 = 0.24%, and Ec = 0.23%) (Ms1 = 0.24%), Ralstonia (Es1 = 0.08%, Es2 = 0.08%, and Es3 = 0.07%) (Ms1 = 0.06%), Filifactor (Es1 = 0.05%, Es2 = 0.05%, Es3 = 0.05%, and Ec = 0.07%) (Ms1 = 0.05%), Sideroxydans (Es1 = 0.05%, Esc = 0.06%) (Ms1 = 0.05%, Ms2 = 0.05%, and Ms3 = 0.04%), Aurantimonas (Es3 = 0.03%, and Ec = 0.03%) (Ms1 = 0.03% and 0.03%), Citrobacter (Es1 = 0.02%, Ms3 = 0.02%, and Ec = 0.02%) (Ms2 = 0.02%, Ms3 = 0.02%, and Mc = 0.02%), and Pelobacter (Es1 = 0.02%, Es3 = 0.02%, and Ec = 0.02%) (Mc= 0.02%). Most of the fungal genus showed abundance in both sampling sites, except Nectria (fungus) (Es1 = 0.23%, Es2 = 0.23%, Es3 = 0.26%, and Ec = 0.20%) and Schismatomma (fungus) (Es1 = 0.09%, Es2 = 0.09%, Es3 = 0.09%, and Ec = 0.12%), which were more abundant in rhizosphere soil samples obtained from Eruwa. Similarly, Filobasidiella (Es1 = 0.36%, Es2 = 0.42%, Es3 = 0.45%, and Ec = 0.42%) obtained from Mbuzini, and Ignisphaera (archaea) showed more abundance than those from Eruwa (Es1 = 0.012%, Es3 = 0.018%, and Ec = 0.020%) soil samples, while Methanoregula (archaea) showed similar abundance in from both sampling sites (Es1 = 0.08%, Es3 = 0.08%, and Ec = 0.10%) (Ms2 = 0.08% and Mc = 0.08%) (Figure 5d).

3.4. Diversity Indices of the Microbiome of the Striga-Infested Sampling Sites

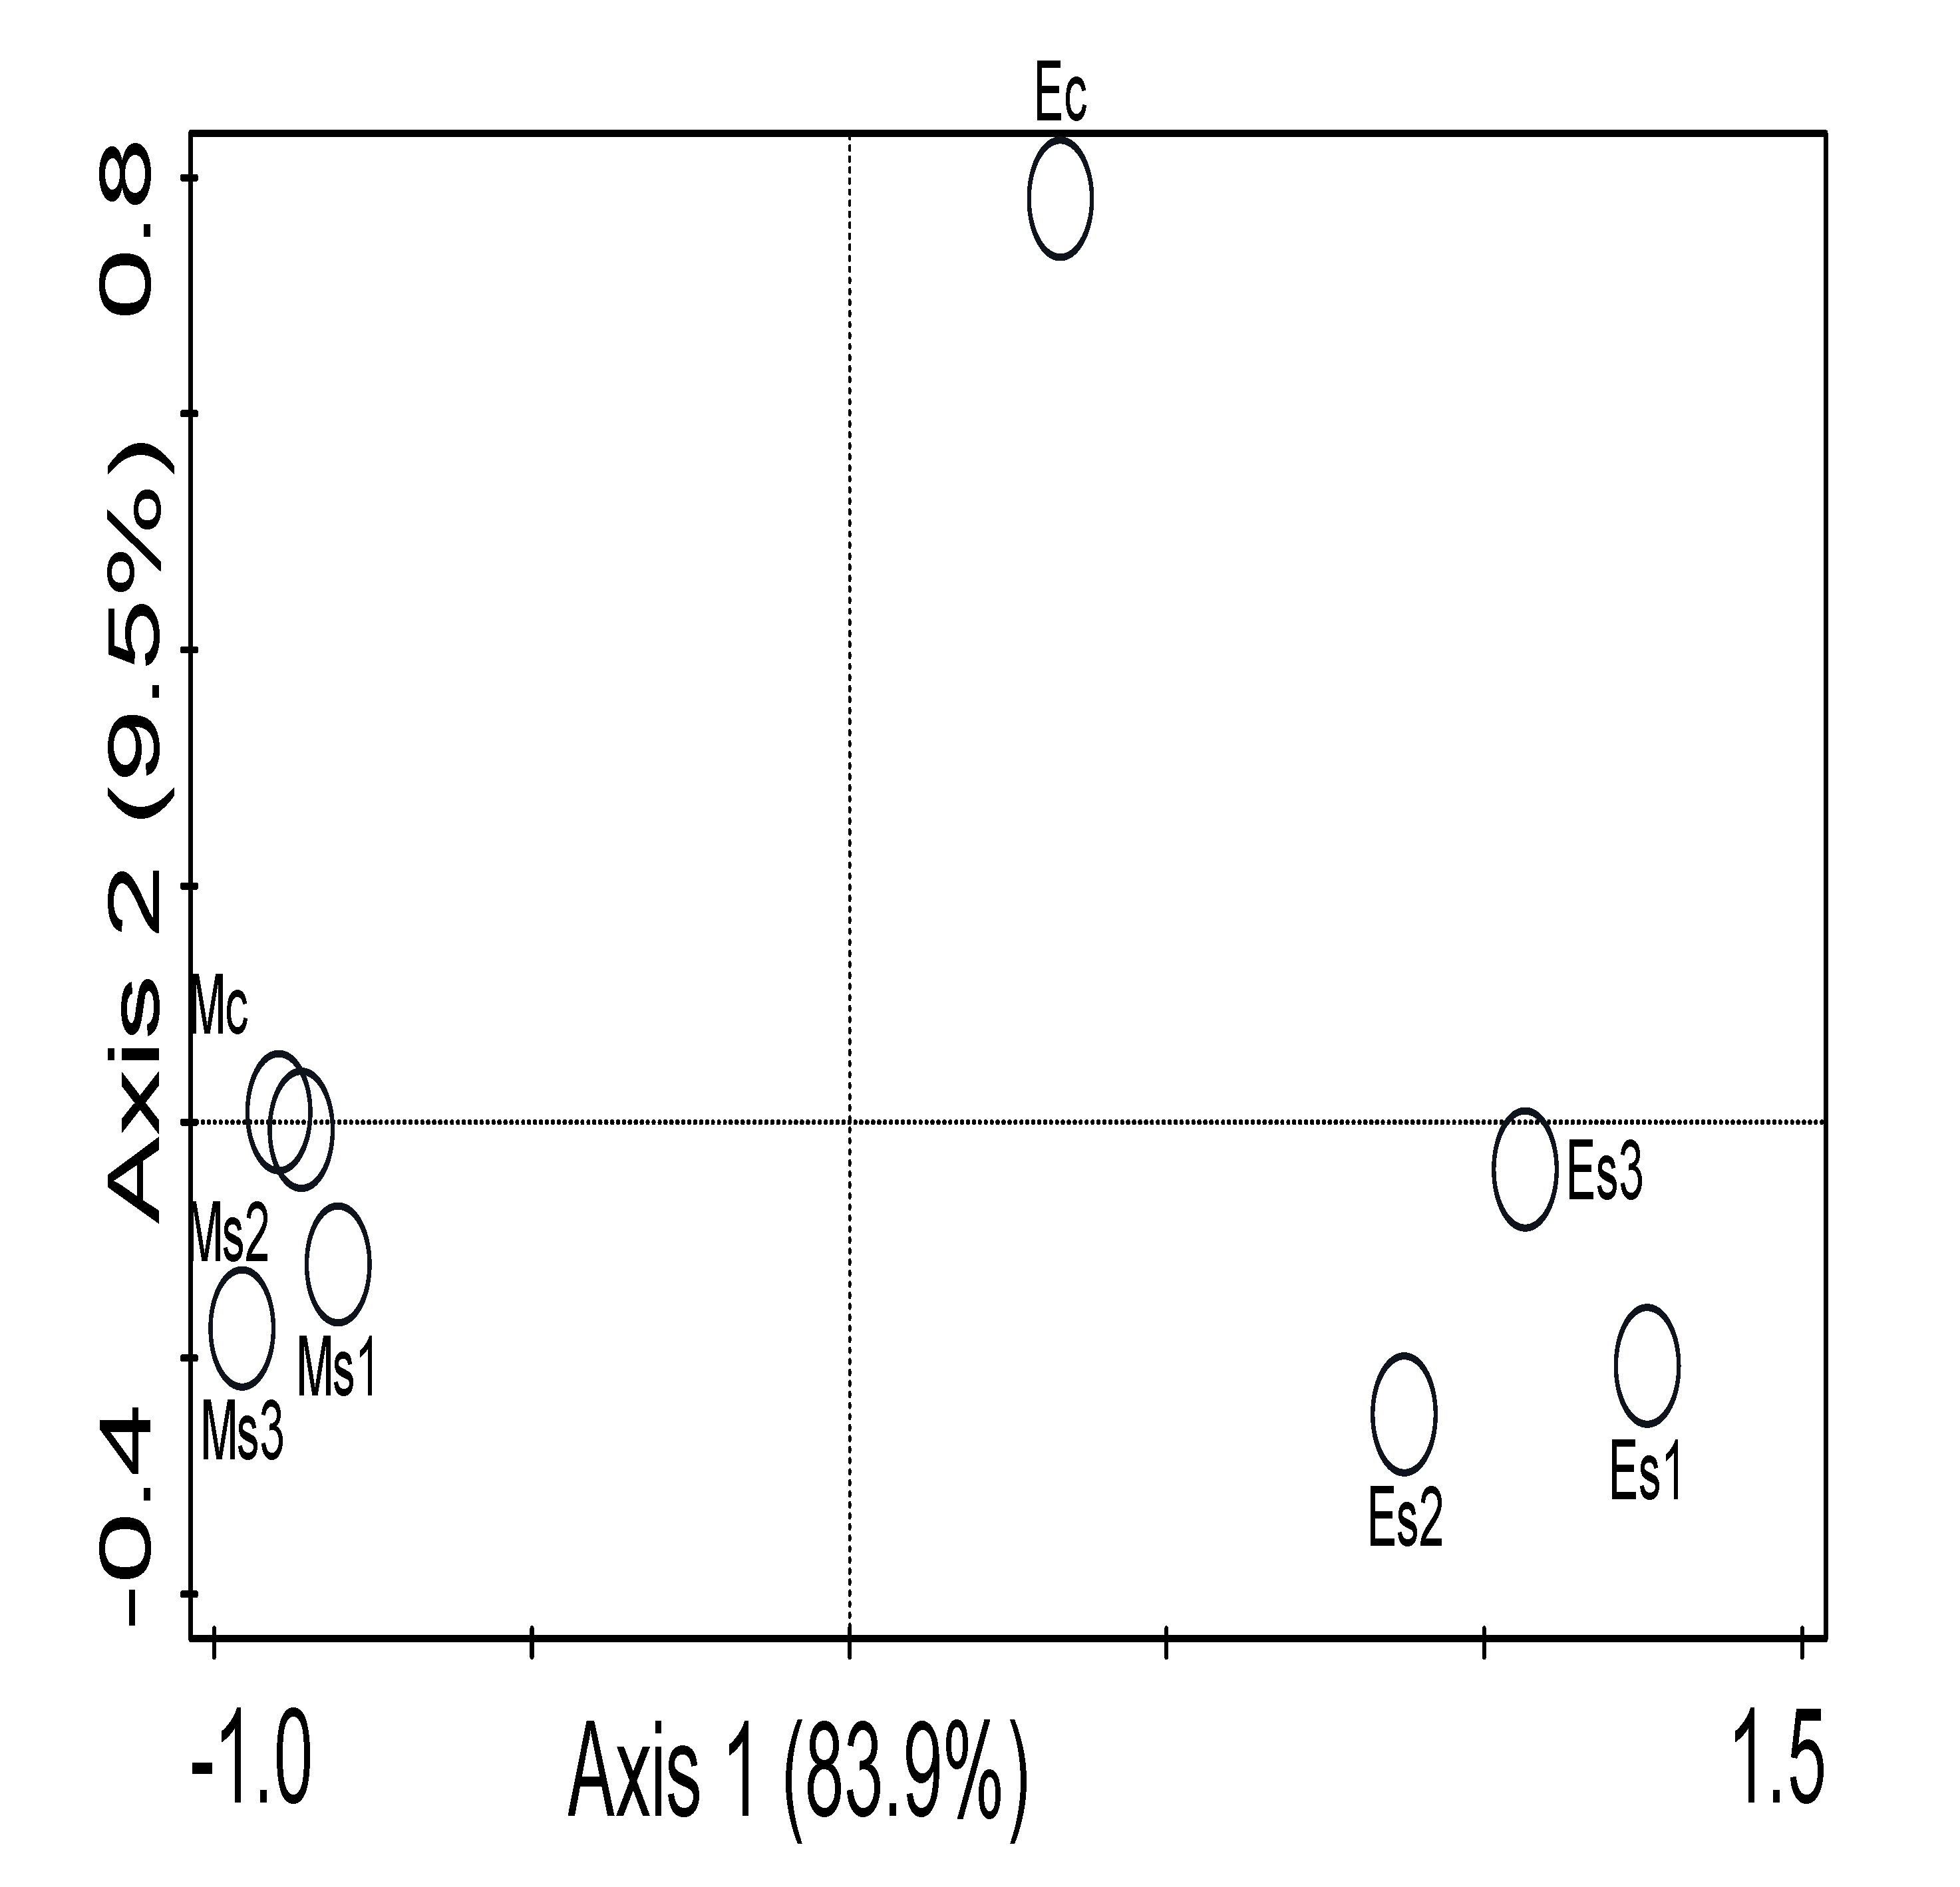
The microbial community of Striga-infected rhizosphere soil and bulk samples of the two sampling sites were evaluated using Pielou evenness and Shannon diversity. With Kruskal–Wallis one-way analysis of variance, alpha diversity of microbial communities indicated insignificant differences (p > 0.05) between the five taxonomical groups (phylum, class, order, family, and genus) (Table 2). In addition, the PCoA analysis revealed the composition of the Striga-infected soil and bulk samples sites showed a more significant difference between Es1, Es2, Es3, and Ec compared to Ms1, Ms2, Ms3, and Mc (Figure 6). The PCoA inference was validated by analysis of similarity (ANOSIM) (p =0.01, R = 0.52).

3.5. Influence of Environmental Variables on the Microbial Community

Canonical correspondence analysis (CCA) was used to depict the relationship between the measured physicochemical factors and the relative abundances of the microbiome phyla. Based on their impacts on the dispersion of microbes between the two locations and a significant test utilizing forward selection of environmental factors, four physicochemical parameters—available phosphorus, nitrate, sulfate, and pH—were selected (Figure 7). The CCA established that the microbiome structure of the two sampling sites was influenced by soil physicochemical variables with the CCA permutation test = 0.00. Chloroflexi, Planctomycetes, and Aquifica were positively correlated with available phosphorus but negatively correlated with pH, nitrate, and sulfate. However, Chlamydiae, Ascomycota, Acidobacteria, and Verrucomicrobia were positively correlated with available phosphorus and were negatively correlated with nitrate, pH, and sulfate. Likewise, Gemmatimonadetes, Crenarchaeota, Nitrospirae, Firmicutes, Deinococcus-Thermus, Bacteroidetes, and Proteobacteria were positively correlated with nitrate and sulfate but negatively correlated with available phosphorus and pH (Figure 7). The forward selection of environmental variables was used to test the factors that best explain the variation in the microbial community. CCA showed that available phosphorus significantly (p = 0.006) contributed 86.0% of the variation, pH insignificantly (p = 0.002) contributed 78.5% variation, sulfate insignificantly (p = 0.084) contributed 35.7%, while pH insignificantly (p = 0.034) contributed 66.8% of the variation of the microbial community in the two sampling sites (Table 3).

4. Discussion

Soil microbiomes significantly boost their genetic potential, aiding in nutrient uptake, promoting plant growth, and increasing their ability to withstand abiotic challenges. Striga hermonthica is an important yield-limiting factor of a number of staple crops, especially in developing nations such as Nigeria and South Africa. The two infested sites, which are located in the two countries, have some notable differences in their microbial communities. There are a few bacterial phyla in common, their relative abundances vary, and the similarities are mostly confined to the family level and higher. This emphasizes that different microbiomes with associated climatic and anthropogenic activities represent significant challenges to adaptation. Some phyla, such as Proteobacteria, Crenarchaeota, and Firmicutes are more abundant in Eruwa than in Mbuzini, and vice versa, suggesting a certain evolutionary conservatism in microbial niches. It is possible that many of these differences are due to climatic conditions and land use types on soil properties. Here, in this study, we employed shotgun sequencing approach to unveil the microbial diversity and composition within the maize rhizosphere infected with Striga hermonthica from two locations with different weather conditions and land use types.
The diversity and composition of the microbiome from the two locations are strongly influenced by soil pH, and it has been discovered that pH was primarily responsible for driving microbial community in agricultural soils [37,38]. Some rhizosphere soil samples obtained from Eruwa (Es) showed that they had alkaline pH values, while others were acidic (Es1 = 6.8, Es = 7.5, Es3 = 7.1, and Ec = 6.1). This indicates that the soil pH is in the optimal range (pH 6–8) for microbial growth [39], and those soil samples of Mbuzini are all acidic (Ms1 = 5.6, Ms2 = 5.4, Ms3 = 5.4, and Mc = 5.3) (Table 1). The soil acidification in Mbuzini may be a result of the intensive use of nitrogen fertilizers, which could be the main cause of the decrease in soil pH [40]. Our result is in line with those earlier reported by Fierer and Jackson [38] and Rousk, et al. [41], in which soil pH played a significant role in defining microbial diversity by influencing the homeostasis of microbes or regulating the availability of soil nutrients.
Furthermore, it has been established that the proliferation of soil microbiome is influenced by soil nutrient status [42]. It is observed that the microbial community composition is sensitive to the levels of nitrogen, phosphorus, and potassium in soil [43]. Moreover, increasing N input suppresses the soil microorganisms in unmanaged ecosystems [44]. In this study, the high significant impact of organic carbon on soil samples obtained from Eruwa was in agreement with the results of other studies that showed that OC had the greatest effect on soil bacterial community structure [45,46]. The presence of organic carbon also indicates that microbial communities exhibit a uniform distribution pattern regardless of soil water content and depth [47]. Furthermore, the majority of bacteria, fungi, and Actinomycetes are demonstrated to be positively correlated with soil organic carbon concentration [48]. For available phosphorus, the result indicates that the available phosphorus had a stronger influence on the microbial community composition of the soil samples recovered from Eruwa (Es1 and Es3), which is in accordance with the studies of Yao, et al. [49] and Fierer and Jackson [38]. This finding implies that the availability of available p in acidic soils is a more significant mediator of microbial community composition.
The composition of the microbiome of the soil samples from Eruwa and Mbuzini based on their abundances are as follows. Proteobacteria showed the largest relative abundance in Eruwa ((Es1 = 39.11%, Es3 = 40.80%, and Ec = 42.04%) (Figure 2). This is in line with the results of other studies suggesting the dominance of Proteobacteria [50,51]. The microbial phyla include Proteobacteria, Firmicutes, Planctomycetes, Choroflexi, Cyanobacteria, Verrucomicrobia, Gemmatimonadetes, and unclassified bacteria Chlamidae, Euryarcheota, Crenarcheota, and Ascomycota comprise most of the microbiome of soil samples from Eruwa, with differences in abundance and composition at lower taxonomic levels, which may be a result of the soil nutrients, environmental condition, and anthropogenic activities [52,53,54,55], thereby influencing soil microbial colonization and thus changing the soil microbial community occupancy. Ascomycota is the dominant fungal phylum, and most Ascomycota are saprophytic [56], which can decompose recalcitrant substances, such as lignin and keratin, and thus improve soil quality.
There was no significant difference in the richness and diversity of the microbiome of Striga-infested soil from both sites, revealing a close index of the microbial community at each level. This is not in agreement with Dube, et al. [57], who reported that there was higher bacterial diversity of land under intensive agricultural production for over 50 years compared to uncultivated land. The principal component analysis (PCA), PCA 1, contributed nearly 83.9% to the total variations, indicating a higher abundance of microbial phyla in soil sample Ec (bulk soil) from Eruwa. Likewise, the principal coordinate analysis (PCoA) contributed 83.9% variation in the microbial communities of the soil samples from Eruwa, with higher disparity recorded in Eruwa (Es1, Es2, Es3, and Ec). It can be deduced from this observation that microbial diversity in soil plays an essential role in crop production sustainability by enriching the soil and reducing the biotic and abiotic stressors, such as S. hermonthica [58,59].

5. Conclusions

In this study, shotgun metagenomics was employed to determine the composition and diversity of the microbiome of S. hermonthica-infested maize rhizosphere soils from Eruwa, Nigeria and Mbuzini, South Africa, in order to establish a link between the microbiome and physicochemical characteristics of the S. hermonthica-infested soil that might have been impacted by weather conditions and human activities. Our findings established that differences in the microbial community structure of the two sampling sites are more likely from climatic conditions and the type of land use practiced on the two sampling sites. Therefore, this study will help in further understanding of the microbial functions in the management of abiotic and biotic stresses and the sustenance of plant health.

Supplementary Materials

The following supporting information can be downloaded at: https://www.mdpi.com/article/10.3390/app13053260/s1, Table S1: Diversity evaluation of the shotgun metagenome analysis from the rhizosphere of Striga-infested maize from Eruwa, Nigeria and Mbuzini, South Africa.

Author Contributions

Conceptualization, O.M.O., A.S.A., A.O.A., F.R.K., J.J.O.O. and O.O.B.; Methodology, O.M.O., A.S.A. and A.O.A.; Formal analysis, O.M.O.; Investigation, O.M.O., A.S.A., A.O.A. and O.O.B.; Resources, O.O.B.; Writing—original draft, O.M.O.; Writing—review & editing, A.S.A., A.O.A., F.R.K., J.J.O.O. and O.O.B.; Project administration, F.R.K., J.J.O.O. and O.O.B.; Funding acquisition, O.O.B. Every author on the list has consented to the publication of their work and has made a major direct and intellectual contribution to it. All authors have read and agreed to the published version of the manuscript.

Funding

This research was funded by the National Research Foundation of South Africa with grant number UID132595 jointly awarded to O.O.B. and J.J.O.O.

Institutional Review Board Statement

Not applicable.

Informed Consent Statement

Not applicable.

Data Availability Statement

The data files (reads in FASTQ format) were deposited at the NCBI SRA database under the BioProject accession No. PRJNA888840 and PRJNA889583.

Conflicts of Interest

The authors declare no conflict of interest.

References

  1. David, O.G.; Ayangbenro, A.S.; Odhiambo, J.J.; Babalola, O.O. Striga hermonthica: A highly destructive pathogen in maize production. Environ. Chall. 2022, 8, 100590. [Google Scholar] [CrossRef]
  2. Atera, E.A.; Itoh, K.; Onyango, J.C. Evaluation of Ecologies and Severity of Striga Weed on Rice in Sub-Saharan Africa. Agric. Biol. J. N. Am. 2011, 2, 752–760. [Google Scholar] [CrossRef]
  3. Babalola, O.O.; Odhiambo, G.D. Effect of Inoculation with Klebsiella oxytoca ‘10 mkr 7’on Striga Suicidal Germination in Zea mays. World Appl. Sci. J. 2008, 3, 57–62. [Google Scholar]
  4. Mounde, L.G.; Anteyi, W.O.; Rasche, F. Tripartite interaction between Striga spp., cereals, and plant root-associated microorganisms: A review. CAB Rev. 2020, 15, 1–17. [Google Scholar]
  5. Seck, P.A.; Diagne, A.; Mohanty, S.; Wopereis, M. Crops that feed the world 7: Rice. Food Secur. 2012, 4, 7–24. [Google Scholar] [CrossRef]
  6. Gressel, J.; Meir, S.; Herschkovitz, Y.; Al-Ahmad, H.; Babalola, O.; Amsellem, Z. Transgenic biocontrol agents to overcome evolutionary barriers. In Integrating New Technologies for Striga Control: Towards Ending the Witch-Hunt; World Scientific: Singapore, 2007; pp. 313–323. [Google Scholar]
  7. Ejeta, G. Breeding for Striga resistance in sorghum: Exploitation of an intricate host–parasite biology. Crop Sci. 2007, 47, S-216–S-227. [Google Scholar] [CrossRef]
  8. Scholes, J.D.; Press, M.C. Striga infestation of cereal crops—An unsolved problem in resource limited agriculture. Curr. Opin. Plant Biol. 2008, 11, 180–186. [Google Scholar] [CrossRef]
  9. Massenssini, A.; Bonduki, V.; Melo, C.; Tótola, M.; Ferreira, F.; Costa, M. Soil microorganisms and their role in the interactions between weeds and crops. Planta Daninha 2014, 32, 873–884. [Google Scholar] [CrossRef] [Green Version]
  10. Babalola, O.O.; Sanni, A.I.; Odhiambo, G.D.; Torto, B. Plant growth-promoting rhizobacteria do not pose any deleterious effect on cowpea and detectable amounts of ethylene are produced. World J. Microbiol. Biotechnol. 2007, 23, 747–752. [Google Scholar] [CrossRef]
  11. Babalola, O.O.; Osir, E.O.; Sanni, A.I. Characterization of potential ethylene-producing rhizosphere bacteria of Striga-infested maize and sorghum. Afr. J. Biotechnol. 2002, 1, 67–69. [Google Scholar]
  12. Crowther, T.W.; Maynard, D.S.; Leff, J.W.; Oldfield, E.E.; McCulley, R.L.; Fierer, N.; Bradford, M.A. Predicting the responsiveness of soil biodiversity to deforestation: A cross-biome study. Glob. Chang. Biol. 2014, 20, 2983–2994. [Google Scholar] [CrossRef] [PubMed]
  13. Johnson, D.W.; Curtis, P.S. Effects of forest management on soil C and N storage: Meta analysis. For. Ecol. Manag. 2001, 140, 227–238. [Google Scholar] [CrossRef]
  14. Yang, T.; Ala, M.; Zhang, Y.; Wu, J.; Wang, A.; Guan, D. Characteristics of soil moisture under different vegetation coverage in Horqin Sandy Land, northern China. PLoS ONE 2018, 13, e0198805. [Google Scholar] [CrossRef]
  15. Lin, G.; He, Y.; Lu, J.; Chen, H.; Feng, J. Seasonal variations in soil physicochemical properties and microbial community structure influenced by Spartina alterniflora invasion and Kandelia obovata restoration. Sci. Total Environ. 2021, 797, 149213. [Google Scholar] [CrossRef]
  16. Li, Y.; Zhang, J.; Zhang, J.; Xu, W.; Mou, Z. Microbial Community Structure in the Sediments and Its Relation to Environmental Factors in Eutrophicated Sancha Lake. Int. J. Environ. Res. Public Health 2019, 16, 1931. [Google Scholar] [CrossRef] [Green Version]
  17. Sui, X.; Zhang, R.; Frey, B.; Yang, L.; Li, M.-H.; Ni, H. Land use change effects on diversity of soil bacterial, Acidobacterial and fungal communities in wetlands of the Sanjiang Plain, northeastern China. Sci. Rep. 2019, 9, 18535. [Google Scholar] [CrossRef] [PubMed] [Green Version]
  18. Zhao, Y.; Cartabia, A.; Lalaymia, I.; Declerck, S. Arbuscular mycorrhizal fungi and production of secondary metabolites in medicinal plants. Mycorrhiza 2022, 32, 221–256. [Google Scholar] [CrossRef]
  19. Babalola, O.; Sanni, A.; Odhiambo, G. Isolation of rhizobacteria associated with maize and assessment of their potential for use in Striga hermonthica (Del.) Benth. suicidal germination. J. Trop. Microbiol 2004, 3, 64–70. [Google Scholar] [CrossRef]
  20. Liu, W.; Wang, Q.; Wang, B.; Wang, X.; Franks, A.E.; Teng, Y.; Li, Z.; Luo, Y. Changes in the abundance and structure of bacterial communities under long-term fertilization treatments in a peanut monocropping system. Plant Soil 2015, 395, 415–427. [Google Scholar] [CrossRef]
  21. Dai, Z.; Liu, G.; Chen, H.; Chen, C.; Wang, J.; Ai, S.; Wei, D.; Li, D.; Ma, B.; Tang, C. Long-term nutrient inputs shift soil microbial functional profiles of phosphorus cycling in diverse agroecosystems. ISME J. 2020, 14, 757–770. [Google Scholar] [CrossRef] [Green Version]
  22. Liu, L.; Zhu, N.; Zhou, G.; Dang, P.; Yang, X.; Qiu, L.; Huang, M.; Gong, Y.; Zhao, S.; Chen, J. Response of soil microbial community to plant composition changes in broad-leaved forests of the karst area in Mid-Subtropical China. PeerJ 2022, 10, e12739. [Google Scholar] [CrossRef] [PubMed]
  23. Szoboszlay, M.; Dohrmann, A.B.; Poeplau, C.; Don, A.; Tebbe, C.C. Impact of land-use change and soil organic carbon quality on microbial diversity in soils across Europe. FEMS Microbiol. Ecol. 2017, 93, fix146. [Google Scholar] [CrossRef] [PubMed] [Green Version]
  24. Fadiji, A.E.; Ayangbenro, A.S.; Babalola, O.O. Organic farming enhances the diversity and community structure of endophytic archaea and fungi in maize plant: A shotgun approach. J. Soil Sci. Plant Nutr. 2020, 20, 2587–2599. [Google Scholar] [CrossRef]
  25. Hoogsteen, M.J.; Lantinga, E.A.; Bakker, E.J.; Groot, J.C.; Tittonell, P.A. Estimating soil organic carbon through loss on ignition: Effects of ignition conditions and structural water loss. Eur. J. Soil Sci. 2015, 66, 320–328. [Google Scholar] [CrossRef]
  26. Walkley, A.; Black, I.A. An examination of the Degtjareff method for determining soil organic matter, and a proposed modification of the chromic acid titration method. Soil Sci. 1934, 37, 29–38. [Google Scholar] [CrossRef]
  27. Wright, A.F.; Bailey, J.S. Organic carbon, total carbon, and total nitrogen determinations in soils of variable calcium carbonate contents using a Leco CN-2000 dry combustion analyzer. Commun. Soil Sci. Plant Anal. 2001, 32, 3243–3258. [Google Scholar] [CrossRef]
  28. Kachurina, O.; Zhang, H.; Raun, W.; Krenzer, E. Simultaneous determination of soil aluminum, ammonium-and nitrate-nitrogen using 1M potassium chloride extraction. Commun. Soil Sci. Plant Anal. 2000, 31, 893–903. [Google Scholar] [CrossRef]
  29. Bray, R.H.; Kurtz, L.T. Determination of total, organic, and available forms of phosphorus in soils. Soil Sci. 1945, 59, 39–46. [Google Scholar] [CrossRef]
  30. Calvo, N.I.R.; Echeverría, H.E.; Rozas, H.S. Determination of sulfate concentration in soil: Depth of sampling. Commun. Soil Sci. Plant Anal. 2009, 40, 1624–1633. [Google Scholar] [CrossRef]
  31. Gammon, N.J. Determination of total potassium and sodium in sandy soils by flame photometer. Soil Sci. 1951, 71, 211–214. [Google Scholar] [CrossRef]
  32. Meyer, F.; Paarmann, D.; D’Souza, M.; Olson, R.; Glass, E.M.; Kubal, M.; Paczian, T.; Rodriguez, A.; Stevens, R.; Wilke, A. The metagenomics RAST server—A public resource for the automatic phylogenetic and functional analysis of metagenomes. BMC Bioinform. 2008, 9, 386. [Google Scholar] [CrossRef] [PubMed] [Green Version]
  33. Kent, W.J. BLAT—The BLAST-like alignment tool. Genome Res. 2002, 12, 656–664. [Google Scholar] [PubMed] [Green Version]
  34. Wilke, A.; Harrison, T.; Wilkening, J.; Field, D.; Glass, E.M.; Kyrpides, N.; Mavrommatis, K.; Meyer, F. The M5nr: A novel non-redundant database containing protein sequences and annotations from multiple sources and associated tools. BMC Bioinform. 2012, 13, 141. [Google Scholar] [CrossRef] [Green Version]
  35. Khomtchouk, B.B.; Hennessy, J.R.; Wahlestedt, C. shinyheatmap: Ultra fast low memory heatmap web interface for big data genomics. PLoS ONE 2017, 12, e0176334. [Google Scholar] [CrossRef] [PubMed] [Green Version]
  36. Carrell, A.A.; Frank, C. Bacterial endophyte communities in the foliage of coast redwood and giant sequoia. Front. Microbiol. 2015, 6, 1008. [Google Scholar] [CrossRef] [PubMed] [Green Version]
  37. Wang, C.-Y.; Zhou, X.; Guo, D.; Zhao, J.-H.; Yan, L.; Feng, G.-Z.; Gao, Q.; Yu, H.; Zhao, L.-P. Soil pH is the primary factor driving the distribution and function of microorganisms in farmland soils in northeastern China. Ann. Microbiol. 2019, 69, 1461–1473. [Google Scholar] [CrossRef] [Green Version]
  38. Fierer, N.; Jackson, R.B. The diversity and biogeography of soil bacterial communities. Proc. Natl. Acad. Sci. USA 2006, 103, 626–631. [Google Scholar] [CrossRef] [PubMed] [Green Version]
  39. Maier, R.M.; Pepper, I.L. Earth environments. In Environmental Microbiology; Elsevier: Amsterdam, The Netherlands, 2009; pp. 57–82. [Google Scholar]
  40. Guo, J.H.; Liu, X.J.; Zhang, Y.; Shen, J.; Han, W.; Zhang, W.; Christie, P.; Goulding, K.; Vitousek, P.; Zhang, F. Significant acidification in major Chinese croplands. Science 2010, 327, 1008–1010. [Google Scholar] [CrossRef] [Green Version]
  41. Rousk, J.; Bååth, E.; Brookes, P.C.; Lauber, C.L.; Lozupone, C.; Caporaso, J.G.; Knight, R.; Fierer, N. Soil bacterial and fungal communities across a pH gradient in an arable soil. ISME J. 2010, 4, 1340–1351. [Google Scholar] [CrossRef]
  42. Dasgupta, D.; Brahmaprakash, G. Soil microbes are shaped by soil physico-chemical properties: A brief review of existing literature. Inter-Natl. J. Plant Soil Sci. 2021, 59–71. [Google Scholar] [CrossRef]
  43. Dai, Z.; Su, W.; Chen, H.; Barberán, A.; Zhao, H.; Yu, M.; Yu, L.; Brookes, P.C.; Schadt, C.W.; Chang, S.X. Long-term nitrogen fertilization decreases bacterial diversity and favors the growth of Actinobacteria and Proteobacteria in agro-ecosystems across the globe. Glob. Chang. Biol. 2018, 24, 3452–3461. [Google Scholar] [CrossRef] [PubMed]
  44. Dong, W.-Y.; Zhang, X.-Y.; Dai, X.-Q.; Fu, X.-L.; Yang, F.-T.; Liu, X.-Y.; Sun, X.-M.; Wen, X.-F.; Schaeffer, S. Changes in soil microbial community composition in response to fertilization of paddy soils in subtropical China. Appl. Soil Ecol. 2014, 84, 140–147. [Google Scholar] [CrossRef]
  45. Guo, Z.; Han, J.; Li, J.; Xu, Y.; Wang, X. Effects of long-term fertilization on soil organic carbon mineralization and microbial community structure. PLoS ONE 2019, 14, e0211163. [Google Scholar]
  46. McGowan, A.R.; Nicoloso, R.S.; Diop, H.E.; Roozeboom, K.L.; Rice, C.W. Soil organic carbon, aggregation, and microbial community structure in annual and perennial biofuel crops. Agron. J. 2019, 111, 128–142. [Google Scholar] [CrossRef] [Green Version]
  47. Wu, H.; Adams, J.M.; Shi, Y.; Li, Y.; Song, X.; Zhao, X.; Chu, H.; Zhang, G.-L. Depth-dependent patterns of bacterial communities and assembly processes in a typical red soil critical zone. Geomicrobiol. J. 2020, 37, 201–212. [Google Scholar] [CrossRef]
  48. You, Y.; Wang, J.; Huang, X.; Tang, Z.; Liu, S.; Sun, O.J. Relating microbial community structure to functioning in forest soil organic carbon transformation and turnover. Ecol. Evol. 2014, 4, 633–647. [Google Scholar] [CrossRef] [PubMed]
  49. Yao, Q.; Liu, J.; Yu, Z.; Li, Y.; Jin, J.; Liu, X.; Wang, G. Changes of bacterial community compositions after three years of biochar application in a black soil of northeast China. Appl. Soil Ecol. 2017, 113, 11–21. [Google Scholar] [CrossRef]
  50. Spain, A.M.; Krumholz, L.R.; Elshahed, M.S. Abundance, composition, diversity and novelty of soil Proteobacteria. ISME J. 2009, 3, 992–1000. [Google Scholar] [CrossRef]
  51. Alotaibi, M.O.; Mohammed, A.E.; Eltom, K.H. Metagenomic analysis of bacterial communities of Wadi Namar Lake, Riyadh, Saudi Arabia. Saudi J. Biol. Sci. 2022, 29, 3749–3758. [Google Scholar] [CrossRef]
  52. Kim, M.; Kim, W.-S.; Tripathi, B.M.; Adams, J. Distinct bacterial communities dominate tropical and temperate zone leaf litter. Microb. Ecol. 2014, 67, 837–848. [Google Scholar] [CrossRef]
  53. Akinola, S.A.; Ayangbenro, A.S.; Babalola, O.O. Metagenomic insight into the community structure of maize-rhizosphere bacteria as predicted by different environmental factors and their functioning within plant proximity. Microorganisms 2021, 9, 1419. [Google Scholar] [CrossRef]
  54. Chukwuneme, C.F.; Ayangbenro, A.S.; Babalola, O.O. Impacts of land-use and management histories of maize fields on the structure, composition, and metabolic potentials of microbial communities. Curr. Plant Biol. 2021, 28, 100228. [Google Scholar] [CrossRef]
  55. Fadiji, A.E.; Ayangbenro, A.S.; Babalola, O.O. Metagenomic profiling of the community structure, diversity, and nutrient pathways of bacterial endophytes in maize plant. Antonie Van Leeuwenhoek 2020, 113, 1559–1571. [Google Scholar] [CrossRef] [PubMed]
  56. Al-Sadi, A.M.; Al-Khatri, B.; Nasehi, A.; Al-Shihi, M.; Al-Mahmooli, I.H.; N Maharachchikumbura, S.S. High Fungal Diversity and Dominance by Ascomycota in Dam Reservoir Soils of Arid Climates. Int. J. Agric. Biol. 2017, 19, 682–688. [Google Scholar] [CrossRef]
  57. Dube, J.P.; Valverde, A.; Steyn, J.M.; Cowan, D.A.; Van der Waals, J.E. Differences in bacterial diversity, composition and function due to long-term agriculture in soils in the eastern free State of South Africa. Diversity 2019, 11, 61. [Google Scholar] [CrossRef] [Green Version]
  58. Chaparro, J.M.; Sheflin, A.M.; Manter, D.K.; Vivanco, J.M. Manipulating the soil microbiome to increase soil health and plant fertility. Biol. Fertil. Soils 2012, 48, 489–499. [Google Scholar] [CrossRef]
  59. Jat, S.L.; Suby, S.; Parihar, C.M.; Gambhir, G.; Kumar, N.; Rakshit, S. Microbiome for sustainable agriculture: A review with special reference to the corn production system. Arch. Microbiol. 2021, 203, 2771–2793. [Google Scholar] [CrossRef]
Figure 1. Map of geographical location of sampling sites in Eruwa, Oyo State Nigeria.
Applsci 13 03260 g001
Figure 2. Map of geographical location of sampling sites in Mbuzini, Mpumalanga Province, South Africa.
Applsci 13 03260 g002
Figure 3. The predominant microbiome phyla of Striga hermonthica-infested soil as revealed by heatmap. Es—Eruwa rhizosphere sample, Ec—Eruwa bulk (control) sample, Ms—Mbuzini rhizosphere sample, Mc—Mbuzini bulk (control) sample.
Applsci 13 03260 g003
Figure 4. The PCA graph of average soil microbial community phyla of Striga hermonthica-infected soil. Es—Eruwa rhizosphere sample, Ec—Eruwa bulk (control) sample, Ms—Mbuzini rhizosphere sample, Mc—Mbuzini bulk (control) sample.
Applsci 13 03260 g004
Figure 5. (a) The main microbiome class (b) order (c) family and (d) genus of Striga hermonthica-infested soil as revealed by heatmap. Es—Eruwa rhizosphere sample, Ec—Eruwa bulk (control) sample, Ms—Mbuzini rhizosphere sample, Mc—Mbuzini bulk (control) sample.
Applsci 13 03260 g005aApplsci 13 03260 g005b
Figure 6. PCoA graph of the soil microbial community based on Bray–Curtis dissimilarities. Es—Eruwa rhizosphere sample, Ec—Eruwa bulk (control) sample, Ms—Mbuzini rhizosphere sample, Mc—Mbuzini bulk (control) sample.
Applsci 13 03260 g006
Figure 7. The forward selection of environmental variables predicts the variance and influence on the microbial diversity as explain by canonical correspondence analysis (CCA).
Applsci 13 03260 g007
Table 1. Chemical analysis of the Striga hermonthica-infested and bulk rhizosphere soil samples from Eruwa, Nigeria and Mbuizi, South Africa.
pHE.CPotassiumSodiumAvailable
Phosphorus
Organic CarbonOrganic
Matter
Total NitrogenTotal CarbonNitrateAmmoniumSulfate
Es16.8 c14.0 g0.1 g1.0 h50.0 a11.4 c19.7 c1.3 c57.0 c0.3 f0.01 f0.0 e
Es27.5 a54.0 d0.4 e1.1 f33.8 d17.4 a29.10 a1.9 a87.0 a0.8 e0.02 e0.0 e
Es37.1 b18.0 f0.20 f1.2 e41.7 b12.6 b21.6 b1.4 b63.0 b0.3 h0.01 g0.0 e
Ec6.1 d11.0 h0.1 h1.1 g40.3 c6.9 d11.9 d0.8 d34.0 d0.3 g0.01 f0.0 e
Ms15.6 e195.0 a569.0 a9.6 b2.4 e1.02 h0.1 e0.1 g1.1 h56.6 a5.2 d17.8 a
Ms25.4 f71.0 c248.0 c11.9 a0.5 h2.8 e0.0 h0.2 e3.0 e42.2 b15.3 a4.4 c
Ms35.4 f101.3 b338.3 b9.1 c1.2 f1.6 f0.04 g0.1 f1.8 f40.6 c8.1 b7.9 b
Mc5.3 g38.0 e198.0 d5.9 d0.7 g1.1 g0.1 f0.1 h1.2 g22.9 d6.3 c1.6 d
Means with different letters along the row are significantly (p ≤ 0.05) different. Es—Eruwa rhizosphere sample, Ec—Eruwa bulk soil sample, Ms—Mbuzini rhizosphere sample, Mc—Mbuzini bulk soil sample.
Table 2. Alpha diversity indices of microbiomes across the sampling sites.
Es1Es2Es3EcMs1Ms2MS3Mcp-Value
PhylumSimpson_1-D0.7670.750.7550.740.730.7190.7110.7140.998
Shannon_H1.9361.8341.881.8361.771.7331.6941.709
Evenness_e^H/S0.2890.26090.2730.26130.240.23570.2270.23
ClassSimpson_1-D0.6720.6580.6410.6570.790.770.7970.7830.976
Shannon_H1.6511.6031.5641.6841.941.8781.9811.929
Evenness_e^H/S0.20840.1990.19110.2150.280.2620.290.275
OrderSimpson_1-D0.7930.7720.7770.7920.740.7640.7320.7560.998
Shannon_H1.9521.8841.8941.9491.881.9151.8451.892
Evenness_e^H/S0.28170.2630.2660.2810.260.2720.2530.265
FamilySimpson_1-D0.8520.8430.8450.8510.870.8750.870.8741
Shannon_H2.2562.2342.2372.2722.382.3862.3782.349
Evenness_e^H/S0.3820.3740.3750.3880.430.4350.4320.491
GenusSimpson_1-D0.8150.7680.760.8870.850.8570.8610.8490.991
Shannon_H2.3142.1522.1432.6052.412.4382.4342.323
Evenness_e^H/S0.4050.3440.3410.5410.450.4580.4560.408
p-Value was based on Kruskal–Wallis one-way analysis of variance. Es—Eruwa rhizosphere sample, Ec—Eruwa bulk (control) sample, Ms—Mbuzini rhizosphere sample, Mc—Mbuzini bulk (control) sample.
Table 3. Impact of environmental parameters on the microbiome composition of soil sample as depicted by the forward selection of environmental variables.
Physicochemical ParameterContribution %Pseudo Fp-Value
Available Phosphorus86.022.00.006
pH78.515.20.002
Nitrate66.89.40.034
Sulfate35.72.90.084
Disclaimer/Publisher’s Note: The statements, opinions and data contained in all publications are solely those of the individual author(s) and contributor(s) and not of MDPI and/or the editor(s). MDPI and/or the editor(s) disclaim responsibility for any injury to people or property resulting from any ideas, methods, instructions or products referred to in the content.