Abstract
With the development of communication technology, traditional distribution networks have gradually developed into cyber–physical systems (CPSs), from which the cyber system provides more protection for the grid and brings new security threat–cyber disturbances. Current research cannot scientifically measure the impact of cyber disturbances on the system and lacks reliability indices for a comprehensive quantitative assessment of CPS reliability from the perspective of cyber–physical fusion. If the impact of information disturbances on system reliability is not assessed accurately, it will not be possible to provide a scientific and reasonable decision basis for system planning and operation. Therefore, a set of reliability assessment methods and indices for distribution network CPSs considering cyber disturbances is proposed. Firstly, a reliability modeling method combining fault tree and Petri net is proposed to model the reliability of a distribution network CPS, which can improve the efficiency and accuracy of the modeling. Secondly, the system state is divided into two categories: normal operation state and cyberattack state. Then, generalized reliability indices considering cyber disturbances for distribution network CPSs are defined. Finally, through the tests on the modified IEEE RBTS BUS2 distribution network CPS, an analysis of the effects of information component failures, cyberattacks, and access network structures on system reliability is conducted in this paper to verify the efficiency of the proposed method and the rationality of the newly defined reliability indices.
1. Introduction
With the wide application of information technology, the traditional distribution network has gradually developed into a highly integrated cyber–physical system (CPS), in which energy support is provided for the cyber system by the physical system, while the cyber system provides 3C (communication, computation, control) technical support for the physical system to achieve collaborative interaction between information flow and energy flow [1,2]. However, compared with the traditional distribution network reliability assessment, the physical system in the distribution network CPS is highly dependent on the cyber system, which makes it face many new challenges in the system reliability assessment [3]. On the one hand, the interaction mechanism of CPS is more ambiguous, which significantly increases the complexity of the distribution network CPS analysis. On the other hand, cyberattacks and information component failures will have a potential negative impact on the reliability of CPS operation in distribution networks, with a strong dependence on the cyber–physical infrastructure. In recent years, malicious cyberattacks have been occurring, affecting the operational status of the system and subsequently the economic and social stability of the city [4]. The failure to make prompt decisions and take reasonable action in response to changes in the system status is the cause of severe losses. Consequently, there is an urgent need to analyze the impact of various types of cyber disturbances, such as external and internal threats, on the reliability of CPSs in distribution networks.
In Table 1, a comparative review of the available research works in the area of the reliability assessment of distribution network CPSs is presented.
In the field of reliability assessment methods, available reliability assessments are divided into three main categories according to the different methods used for cyber systems and physical systems [5]: analytical methods for both cyber systems and physical systems, analytical methods for cyber systems and simulation methods for physical systems, and simulation methods for both cyber systems and physical systems. The simulation method is mainly based on probability and statistics, using computers for simulation [6]. For instance, reference [7] improves the sampling method of the Monte Carlo method. The improved important sampling algorithm realizes the optimization of the state probability distribution for the power system. The non-sequential Monte Carlo method is used in [8] to assess the reliability of the system. However, the computational efficiency problem and sampling difficulty of the simulation method are increasingly highlighted due to the increase in the scale of the system and the diversity of various component states. The main principle of the analysis method is to accurately calculate the reliability indices of the system in accordance with the parameters of each system component by analyzing the logical relationship between each component and the system [9]. Reference [10] uses the analytical method to calculate the availability of protection and monitoring functions and equates them to the corresponding physical components, which contribute to increasing the effectiveness of the CPS reliability assessment.
In the field of reliability modeling, a fault tree analysis represents the logical relationships between systems and components by diagrams [11]. A fault tree analysis has been used in [12,13,14] to assess system reliability. However, certain application bottlenecks of the fault tree analysis method are reflected in the problem of space explosion in calculations with the increasing system scale [15]. Therefore, the method of solving the minimum cut set by using fault trees is only applicable to simple distribution networks, and the calculation is too complicated to be applied to the reliability index calculation of distribution network CPSs. Additionally, Petri net is a graphical and formal modeling tool, with the benefits of expansibility and portability, which has been widely used in the reliability modeling of distributed systems, cyber systems, and discrete systems [16]. Moreover, Petri nets can be easily transformed from fault trees, with a strong logical description capability. Reference [17] establishes a Petri net representation of various complex fault tree relationships and verifies that Petri nets are more efficient than fault trees by using an example of a fault tree with five layers and seven bottom events.
In terms of reliability indices adopted in the reliability assessment, there are currently three main categories: traditional distribution network reliability indices, reliability indices that consider the impact of cyber failures on control, and power supply reliability indices that consider the impact of cyber failures [18]. Traditional distribution network reliability indices mainly quantify the impact of cyber or physical systems on the reliability of the load, including two main aspects: load point reliability indices and reliability indices for systems [19]. With in-depth research on the impact of cyber–physical interactions, it is impossible to comprehensively, quantitatively, and in detail evaluate the operational characteristics of distribution network CPSs and the impact of cyber failures, especially cyber disturbances, on the system state by using the traditional distribution network reliability indices. Hence, the traditional index evaluation scope needs to be extended. Direct load outages, system control failures, and even certain reliability threats will all be brought by a cyber component failure. For example, a set of reliability assessment indices are defined in [20] to quantitatively describe the impact of component failures leading to control function failures on system reliability. Compared with the traditional distribution network reliability indices, these indices take into account the impact of component failures in cyber systems on system control. However, some of the parameters calculated by these indices come from the simulation method sampling; thus, they are only applicable to the simulation method. These indices have some limitations without considering the influence of cyber disturbances on the system reliability. Reference [21] proposes a reliability state model for different types of cyber disturbances and analyzes the impact of different types of cyber disturbances on network availability. In [22], a network reliability model that considers both cyber device failures and cyberattacks is provided, in which the cyber system status is integrated into the malfunction probability modeling of switches for the reliability assessment. Although research on cyber disturbances has steadily advanced, most studies still follow the traditional distribution network reliability assessment methods, which do not account for the impact of cyber disturbances on system reliability in the indices [13,23,24,25].
As seen in the summary of the literature review of the CPS reliability assessment, few studies have defined new indices for a reliability assessment in the area of assessment indices; only a few studies have considered the impact of physical system failures, information component failures, and cyberattacks on system reliability when performing a reliability assessment of the system simultaneously. Consequently, the relevant research still has the following shortcomings: on the one hand, the research on the cyber–physical interaction has been deepened and the consequences generated by cyber failures have been refined, which require the impact of the cyber disturbance on the system state to be reflected in the indices, thus reflecting the impact on the system reliability. On the other hand, reliability indices that can make comprehensive quantitative assessments of CPS reliability are lacking and unable to scientifically measure the impact of cyber disturbances on the system. A breakthrough from the limitations of the traditional distribution network reliability assessment indices is needed from the perspective of cyber–physical integration.
The contributions of this paper are listed as follows:
- Considering the complexity of distribution network CPS in terms of structure and characteristics, a combination of fault tree and Petri net is used to model the reliability of the system, which realizes the unification of the physical system and cyber system in modeling and gives full play to their own and the combined advantages of fault tree and Petri net.
- To take into account the influence of cyber disturbances on system reliability, the system states are divided, and the probability of the system being in each state is calculated based on the probability of successful cyberattacks, thus achieving an accurate calculation of each load point and system reliability indices.
- In response to the lack of reliability indices for the comprehensive quantitative assessment of cyber–physical system reliability in the existing studies, the generalized distribution network CPS reliability assessment indices are defined, which can accurately assess the system reliability under the influence of cyber disturbances.
This paper consists of five sections, and the parts of this paper are organized as follows. A general description of the research object and the methods used in this paper is provided in Section 2, with a brief description and explanation of each method. In Section 3, reliability modeling of the distribution network CPSs is proposed, with simple examples of how the fault tree model and the Petri net model are modeled as well as the advantages of the modeling method. The generalized distribution network CPS reliability assessment indices considering cyber disturbances and a detailed description of the new indices are defined in Section 4, with the process of the reliability assessment of the distribution network CPS described in detail. In Section 5, a modified IEEE RBTS BUS2 system is taken as an example to verify the validity of the proposed modeling method and indices. Section 6 concludes the paper.

Table 1.
Comparative literature review of reliability assessment in distribution network CPS.
Table 1.
Comparative literature review of reliability assessment in distribution network CPS.
| References | Years | Study Subjects | Modeling Methods | Assessment Methods | Assessment Indices | Influencing Factors | |||||||
|---|---|---|---|---|---|---|---|---|---|---|---|---|---|
| Physical System | Cyber System | Fault Tree | Petri Net | Others | Analytical Method | Simulation Method | Traditional Indices | New Indices | Physical System Failures | Information Component Failures | Cyber Attacks | ||
| [16] | 1997 | ✓ | ✓ | ✓ | ✓ | ✓ | |||||||
| [15] | 2012 | ✓ | ✓ | ✓ | ✓ | ✓ | |||||||
| [10] | 2015 | ✓ | ✓ | ✓ | ✓ | ✓ | ✓ | ✓ | |||||
| [26] | 2016 | ✓ | ✓ | ✓ | ✓ | ✓ | ✓ | ✓ | |||||
| [23] | 2016 | ✓ | ✓ | ✓ | ✓ | ✓ | ✓ | ✓ | |||||
| [9] | 2017 | ✓ | ✓ | ✓ | ✓ | ✓ | |||||||
| [27] | 2017 | ✓ | ✓ | ✓ | ✓ | ✓ | ✓ | ✓ | |||||
| [14] | 2017 | ✓ | ✓ | ✓ | ✓ | ✓ | ✓ | ✓ | |||||
| [25] | 2018 | ✓ | ✓ | ✓ | ✓ | ✓ | ✓ | ✓ | |||||
| [21] | 2018 | ✓ | ✓ | ✓ | ✓ | ✓ | ✓ | ✓ | ✓ | ||||
| [20] | 2019 | ✓ | ✓ | ✓ | ✓ | ✓ | ✓ | ✓ | |||||
| [7] | 2020 | ✓ | ✓ | ✓ | ✓ | ✓ | |||||||
| [8] | 2020 | ✓ | ✓ | ✓ | ✓ | ✓ | ✓ | ✓ | |||||
| [12] | 2021 | ✓ | ✓ | ✓ | ✓ | ✓ | |||||||
| [13] | 2021 | ✓ | ✓ | ✓ | ✓ | ✓ | |||||||
| [16] | 2022 | ✓ | ✓ | ✓ | ✓ | ✓ | |||||||
| [22] | 2022 | ✓ | ✓ | ✓ | ✓ | ✓ | ✓ | ✓ | ✓ | ||||
| Proposed method | ✓ | ✓ | ✓ | ✓ | ✓ | ✓ | ✓ | ✓ | ✓ | ||||
2. Problem Description
2.1. Structure of Distribution Network CPS
In a distribution network CPS, the physical system is composed mainly of traditional components such as overhead lines, isolation switches, and transformers, which provide energy support for the cyber system, while the cyber system mainly includes components such as servers, switches, and intelligent electronic devices (IEDs), which monitor, control, and protect the physical system [28]. The structure of the distribution network CPS is shown in Figure 1.
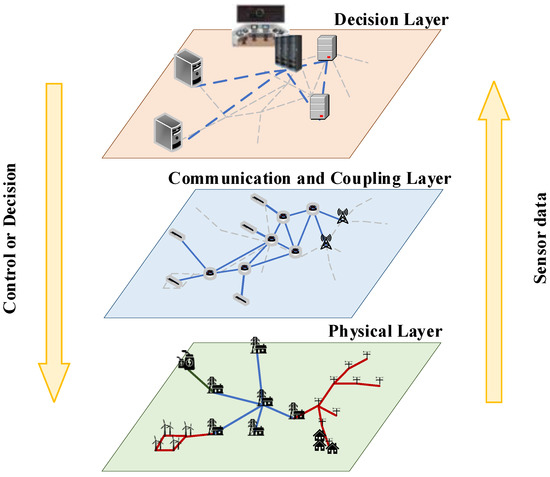
Figure 1.
The structure of the distribution network CPS.
The physical layer, the communication and coupling layer, and the decision layer all combine to form the distribution network CPS. The physical layer consists of equipment of the traditional power system needed to generate, transmit, and distribute power. However, the introduction of sensors and communication networks further increases the possibility of the reliable and efficient operation of the power system, with the communication and coupling layer making it possible to use real-time data from the physical layer for real-time decision making [29].
This section may be divided into subheadings. It should provide a concise and precise description of the experimental results, their interpretation, as well as the experimental conclusions that can be drawn.
The schematic diagram of the IED model is shown in Figure 2. IED is an interface device that consists of fault detection units, relay protection units, and control units connecting the cyber system and the physical system [30]. Based on the collected data, the master server makes decisions on scheduling, processes various incidents, and sends control signals to the IEDs, which in turn communicate the commands to the primary equipment through various interactions, thus effectively coupling the physical system with the cyber system [31].
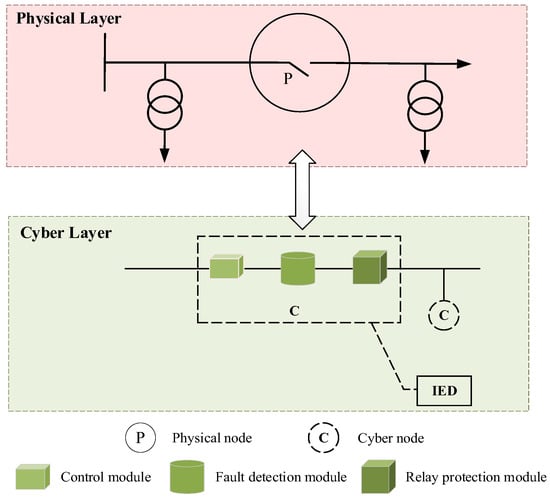
Figure 2.
Schematic diagram of the cyber–physical interface IED model.
2.2. The Proposed Reliability Assessment Method
The distribution network CPS reliability assessment method proposed in this paper is shown in Figure 3. A combination of fault tree and Petri net is used in the modeling; the reliability indices are defined by considering the influence of cyber disturbances on the system state, and the minimum cut set in the analysis method is used in the reliability assessment. The specific details of the proposed methods are described as follows.
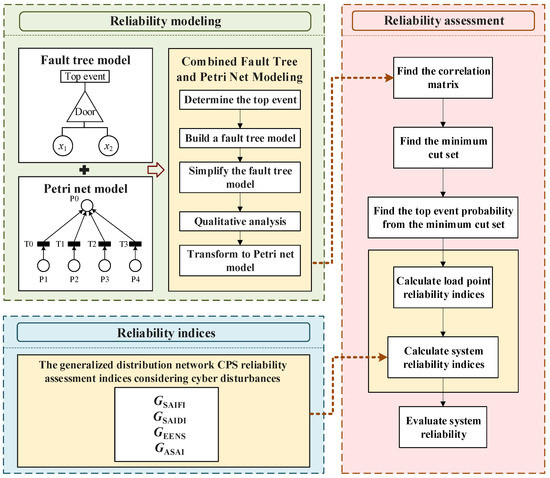
Figure 3.
Block diagram of the proposed reliability assessment method.
2.2.1. Reliability Modeling Methods—Fault Trees and Petri Nets
In distribution network CPS reliability modeling, since the fault tree model presents clear and graphic causality with comprehensive and concise descriptions of the various causes and logical relationships leading to accidents, fault trees can provide a clear and accurate analysis of the causes of load failures in the system. However, for complex systems, additional steps are required to compile the fault tree, which also needs to establish a relatively large-scale fault tree model [32]. Meanwhile, the calculation is more complicated, which brings difficulties to the qualitative and quantitative analyses. Additionally, the fault tree model is a static analysis model, which makes it unable to study the dynamic process of the reliability of the system under investigation. In contrast, one of the main advantages of Petri nets is the capability to deal with concurrent, synchronous, asynchronous, parallel, nondeterministic, and other practical phenomena that are difficult to solve with general methods. Having simple, well-defined syntax and semantics, the Petri net can describe different levels of abstraction of a system [14]. The reachability of Petri nets is utilized to determine whether the system may operate to a given state under a given initial state. However, the analysis method for Petri net modeling is based on abstract formal definitions, with more complex model description methods. Therefore, the combination of the two is associated with providing a new idea and method to solve the reliability problem of the system, and the fault trees can be easily represented by Petri nets. As a result, a combination of a fault tree and Petri net is used to model the system for reliability modeling in this paper.
2.2.2. Reliability Indices—The Generalized Distribution Network CPS Reliability Assessment Indices Considering Cyber Disturbances
Cyberattacks are the primary external security threats in cyber disturbances, which normally exploit the security weaknesses of elements and tamper with the original data by injecting false data [33]. The internal threats are mainly information component failures. Since the failure rate of the information component is the inherent nature of the component that does not change with external factors, is used to represent the failure rate of the information component, while the success rate of the information component cyberattack is represented by . Since cyberattacks against IEDs have the greatest impact on the system, IED cyberattacks are used as an example for analysis and calculation, and other cyberattacks are calculated as IED cyberattacks. Based on the characteristics and impacts of the two security threats, the system state is divided into a normal operation state and a cyberattack state, while information component failures may occur at any time in both states.
The number of switches, IEDs, and servers in the minimum set cut for a load point failure are defined as , , and , respectively, and the probability that the load point is under a cyberattack can be derived as follows:
where is the successful probability of IED cyberattacks.
The probability of the load point being in normal operation is . The number of load outages , the duration of outages , and the amount of lost load caused by information component failures are calculated as follows:
where , , and denote the component failure rates of IEDs, switches, and servers, respectively; , , and are the annual failure times of individual IED, switch, and server, respectively; and represents the average load at the load point.
The number of load outages , the duration of outages , and the amount of lost load caused by cyberattacks are calculated as:
where represents the number of IEDs subjected to cyberattacks.
2.2.3. Reliability Assessment Method—Solving the Minimum Cut Set Using Petri Nets
The method of minimum cut set analysis essentially finds the minimum cut set for the load points in the network and calculates the reliability indices, which can reflect the least failure composition pattern of the system failure occurrence and is the necessary condition for system failure. The reliability analysis of the system can be easily performed based on the minimum cut set. Due to the reachability and boundedness of Petri nets, various common phenomena in complex systems are well described with abundant analysis methods [14]. Among them, the analysis method based on the correlation matrix is suitable for large-scale Petri net models with high complexity. In this paper, based on the Petri net model, the topological relations embodied in the Petri net model are calculated and transformed into the form of a correlation matrix, from which the minimum cut set is solved, and finally the top event occurrence probability is calculated according to the failure rate of each component in the minimum cut set; thus, the system reliability indices are solved.
- Find the correlation matrix by Petri net:
The structure of Petri nets can be represented by a matrix, which allows the introduction of a linear algebra approach to the analysis of Petri net properties.
Let be a Petri net, where , . is the set of places, representing the state of the system; is the set of transitions, representing the consumption, use of resources, and the changes that make the state of the system; is the set of input and output functions, called flow relations, establishing a unidirectional connection from places to transitions and from transitions to places; and is the identity vector on the set of places. Then, the structure of the Petri net can be represented by an n-row and m-column matrix :
and is called the association matrix of .
- Find the minimum cut set from the correlation matrix:
Solving the system minimum cut set from the correlation matrix, the steps refer to [34].
- Find the top event probability from the minimum cut set:
The probability of occurrence of the top event is determined using the probability of occurrence of the minimum cut set . The mathematical expression is as follows:
where is the probability of the top event , is the probability of the h-th cut set, and is the maximum of the number of minimum cut sets.
3. Distribution Network CPS Reliability Modeling
3.1. Fault Tree Analysis Model
Fault trees are logic diagrams that describe event causality by event symbols, transfer symbols, and logic gate symbols [34]. The fault tree analysis is an analysis method that analyzes the causes of faults in each component of the distribution network CPS to determine all combinations of the fault causes and the probability of occurrence [35]. The analysis steps of the fault tree are shown in Figure 4.
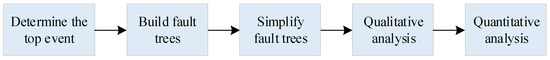
Figure 4.
Block diagram of the reliability assessment method.
The procedure of constructing the fault tree in this paper includes the following: first, determining the top event, which is the most undesired situation of the system; then analyzing all possible causes of the top event, analyzing the logical relationship between the causes, and connecting them with logic gates; and then analyzing whether the input events directly connected with the top event can be further decomposed, and if so, treating them as the input events of the next level of events and decomposing them until all the input events are no longer decomposable, and the events that cannot be decomposed are the bottom events.
A typical distribution system is shown in Figure 5. The distribution system is a typical radial distribution system consisting of two feeders, with three main lines L1, L2, and L3, and three branch lines L4, L5, and L6. The main lines are separated from each other by isolation switches, and T is the contact switch.
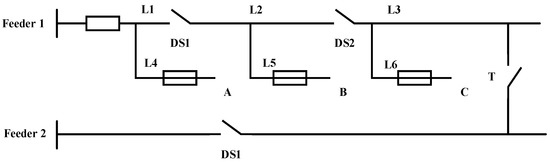
Figure 5.
Typical power distribution system structure.
Taking the top event of Load B failure as an example, the possible causes of the top event include the failure of main line L2, failure of branch line L5, and disconnection of the isolation switch. Since the failure of the main line L1 and main line L3 is the cause of the isolation switch disconnection, and as long as one of all possible causes occurs, Load B is bound to fail. Therefore, without considering the failure of the circuit breaker and contact switch inputs, the fault tree of Load B is shown in Figure 6.
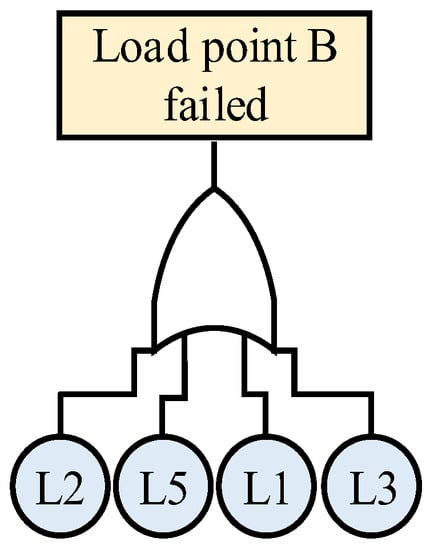
Figure 6.
Fault tree of Load B failure.
In Figure 6, L2 and L5 represent the failure of the main line L2 and the branch line L5, respectively; L1 and L3 represent the disconnection of the isolation switch due to the main lines L1 and L3, respectively. All the possible causes of Load B failure in the typical radial distribution system of Figure 5 are clearly represented in Figure 6. The analysis of the fault tree allows the Petri net model of the system to be obtained, which in turn enables a series of reliability indices to be solved.
3.2. Petri Net Model
Although the network structure of Petri nets is static, the tokens in them can flow through the network according to defined occurrence rules; thus, Petri nets are dynamically executable. Consequently, it is feasible to model the CPS with event-driven characteristics using Petri nets.
In this paper, a combination of a fault tree and Petri net is used for CPS reliability modeling of distribution networks, and the fault tree model is transformed into a Petri net model, which is based on the Petri net model and defines a quaternion as:
where is the set of places, representing the fault tree in failures of lines, transformers, switching components, servers, switches and IEDs, etc.; is the set of transitions, representing the fault transformation process in the fault tree; is the directed arc, which is the set of input and output functions, indicating the transmission direction of the fault; and is the initial token of the system.
A fault tree is a logical relationship of fault propagation in a system that can be easily transformed into a Petri net representation. The Petri net representation of the logic “with, or, not” when transformed from a fault tree to a Petri net is shown in Figure 7.

Figure 7.
Petri net representation of logical “with, or, or not”: (a) logical “with”; (b) logical “or”; (c) logical “not”.
According to the transformation rules of the logic, the fault tree model of Load B in Figure 6 is transformed into the Petri net model as shown in Figure 8.

Figure 8.
Petri net diagram of Load B failure.
3.3. Advantages of Combining Fault Trees and Petri Nets
The combination of the two modeling methods can make full use of the advantages and make up for the shortcomings of the two modeling methods to improve the efficiency and accuracy of modeling and analysis when dealing with system topology changes. The advantages of combining the two methods are as follows.
3.3.1. Comprehensive and Accurate Models
The combination of the two modeling methods maximizes the advantages of fault tree modeling. With clear and graphic causality, the fault tree can make a comprehensive and concise description of the various causes and logical relationships that lead to failures, which enables both a qualitative analysis and quantitative analysis. By utilizing this fault analysis method, the reliability modeling of distribution network CPSs is capable of providing a comprehensive and accurate description of various causes of failures.
3.3.2. High Efficiency in Solving
When taking an example of a case with five levels and seven bottom events, solving the minimum cut set by a fault tree requires eight steps, while solving it by Petri nets takes only three steps to complete [36]. Thus, by using fault tree modeling to transform into Petri nets and then solving for the minimum cut set, the efficiency of solving the system can be effectively improved. In addition, a distribution network CPS includes a cyber system to monitor and control the physical system, which makes the system structure more complex, and it is very complicated and time-consuming to calculate the minimum cut set of the system by using the fault tree model only. Therefore, the combination of the two methods greatly improves the efficiency and accuracy of solving the system reliability.
3.3.3. Visual Fault Transmission Process
The reachability of Petri nets allows determining whether the system may run to a given state under an initial state. Using this feature of Petri nets, the software PIPE supports the initial identification of any place in the diagram when defining the initial state. When running this Petri net, the transfer process of tokens, that is, the transfer process of the fault, can be clearly seen, and the final reached place, the result of the fault, can be immediately obtained, which provides convenience to the system fault analysis and reliability calculation. The initial identification assigned to Place L2 in the Petri network in Figure 8 is shown in Figure 9, indicating that L2 is faulty at this time, and then the program is run to obtain the operation results shown in Figure 10, showing that Load B is faulty.
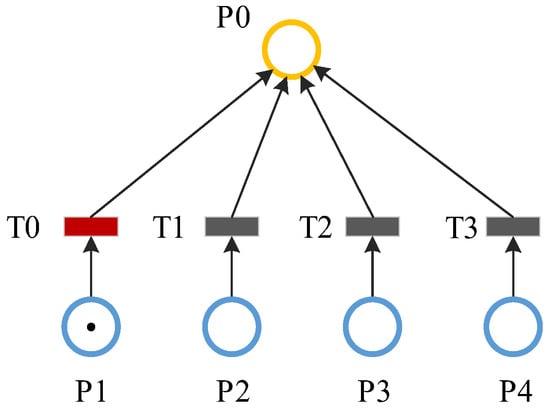
Figure 9.
Assign the initial value to Place L2.
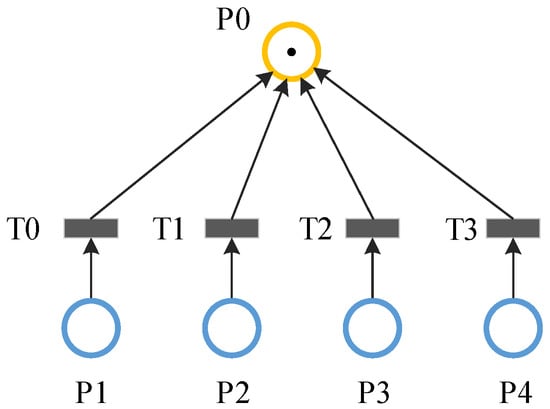
Figure 10.
Running results.
3.3.4. Fast Response to System Topology Changes
With only the fault tree analysis method, when the system topology is changed, the entire system needs to be reanalyzed and the fault tree model reconstructed; however, when using a combination of the two methods for modeling, only the correlation matrix of the Petri net needs to be partially modified, so that reliability indices can be calculated for the system after the topology change.
The output and input matrices of the Petri net in Figure 8 are shown in (14) and (15), respectively.
Using (14) and (15), the correlation matrix corresponding to this Petri net can be derived, as shown in (16).
Taking the distribution system in Figure 5 as an example, due to the disconnection of isolation switch DS2 for reasons such as the failure of L3, the main line L3 and the load carried by it are supplied by Feeder 2. To evaluate the reliability of the system at this time, if only fault tree modeling is used, the system structure needs to be analyzed again and the fault tree model needs to be reconstructed. However, if the combination of fault tree and Petri net is adopted for modeling, only the output and input matrix need to be changed as shown in (17) and (18), and then the minimum cut set can be solved. This method significantly reduces the modeling time and thus improves the modeling efficiency. Especially for the distribution network CPS, the addition of a cyber system leads to a more complex system structure and more frequent interactions among the parts.
The advantages of combining the two methods in modeling are shown above and will be further demonstrated in Section 5.
4. Reliability Assessment of Distribution Network CPS
4.1. Reliability Assessment Indices
To take into account the impact of cyber disturbances on system reliability, generalized distribution network CPS reliability assessment indices considering cyber disturbances are defined in this paper, which account for load shedding caused by information component failures and cyberattacks and characterize the changes in system reliability resulting from control failures caused by physical component failures and cyber disturbances. Based on the annual average outage frequency (times/a) and annual average outage time (h/a) at load points, the generalized distribution network CPS reliability assessment indices considering cyber disturbance are defined.
4.1.1. The Generalized System Average Interruption Frequency Index-
reflects the frequency of load shedding due to control failures caused directly by physical component failures or through cyber disturbances. This index is defined as follows:
where represents the number of load points; represents the number of users of the l-th load point; denotes the number of load points shed due to the direct failure of physical components; means the number of load points shed due to control failure caused by the failure of information components; and stands for the number of load points shed due to control failure caused by cyberattacks.
4.1.2. The Generalized System Average Interruption Duration Index-
reflects the annual average duration of load shedding due to control failures caused directly by physical component failures or through cyber disturbances. This index is defined as follows:
where represents the annual outage time at the load point due to the failure of physical components; denotes the annual outage time at the load point due to control failure caused by the failure of the information components; and indicates the annual outage time at the load point due to control failure caused by cyberattacks.
4.1.3. Generalized Expectation of Energy Not Supply-
reflects the expected amount of energy not supplied by the system due to control failures caused directly by physical component failures or through cyber disturbances. This index is defined as follows:
where represents the expected value of the power shortage due to the failure of physical components directly; means the expected value of the power shortage due to control failure caused by the failure of information components; indicates the expected value of the power shortage due to control failure caused by cyberattacks.
4.1.4. The Generalized Average Service Availability Index-
is the ratio of the number of hours without power supply to the total number of hours of power supply required by customers in the system. This index is defined as follows:
The reliability indices defined in this paper are applicable not only to the case where cyber disturbances affect the system state but also to other disturbances that cause changes in the system state.
4.2. Reliability Assessment Process
The reliability assessment model of the distribution network CPS is constructed by combining a fault tree and Petri net, and the reliability assessment is carried out by finding its corresponding correlation matrix from the Petri net model and then finding the minimum cut set. In the selection of reliability indices, the generalized distribution network CPS reliability assessment indices considering cyber disturbances are defined. The flow chart of the reliability assessment for the distribution network CPS proposed in this paper is presented in Figure 11.
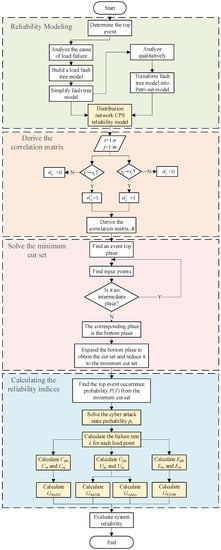
Figure 11.
Flow chart of distribution network CPS reliability assessment.
On the basis of the above discussion, the reliability assessment process proposed in this paper is divided into the following four stages:
- Stage I: Establish the reliability model of the distribution network CPS, which can be divided into the following three steps.
- Step 1: Determine the top event of the failure according to the topology and coupling relationship of the system.
- Step 2: Analyze the causes of load failures so that a load fault tree model can be built and simplified.
- Step 3: Perform a qualitative analysis of the fault tree model, and the fault tree model will be transformed into the corresponding Petri net model.
- Stage II: Solve the corresponding correlation matrix in the reliability model, which is divided into the following two steps.
- Step 1: Solve the input and output matrices of the model according to the structure of Petri nets.
- Step 2: Solve the correlation matrix based on the input matrix and output matrix.
- Stage III: Solve the minimum cut set from the correlation matrix. This phase is divided into the following three steps.
- Step 1: Find the top place of the event and the input event.
- Step 2: Determine whether the event is an intermediate place, if not, it is the bottom library house; otherwise, go back to Step 1.
- Step 3: Expand all the bottom places to obtain the cut set and simplify it to the minimum cut set.
- Stage IV: Calculate the system reliability indices. This stage can be divided into the following six steps.
- Step 1: Solve for the probability of occurrence of the top event based on the minimum cut set.
- Step 2: Solve for the probability of a load point in the state of cyberattacks.
- Step 3: Calculate the failure rate of each load point.
- Step 4: Calculate based on the failure rate of each load point.
- Step 5: Calculate the reliability indices of each system.
- Step 6: Evaluate the system reliability.
5. Case Study
5.1. Introduction of Case
In this paper, the IEEE RBTS BUS2 [37] is modified to construct a distribution network CPS for case studies, and the topology is shown in Figure 12. A star topology is used for the cyber system, with ethernet passive optical network communication for data. Fiber optics, a control center server, several switches, and IEDs for controlling individual switch components are laid along the primary grid of the distribution network, as shown in Figure 13.
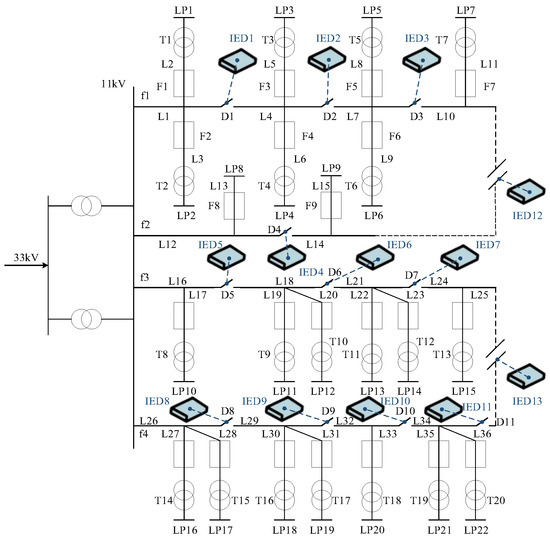
Figure 12.
Structure of the distribution network CPS.

Figure 13.
Cyber system structure.
The failure rate and repair time of each component in the cyber system are shown in Table 2, and the reliability parameters of the physical system are detailed in Table A1, Table A2 and Table A3 in Appendix A.
Table 2.
Reliability parameters of information components.
The actual distribution network CPS structure is complex, with more uncertainties and more complicated calculations. Therefore, this paper makes some assumptions in the calculation, which narrow the scope of consideration and simplify the calculation process.
- (1)
- Since this paper focuses on the distribution network CPS, the other two important systems of the power system, namely, the generation system and the transmission system, are considered to be reliable at the time of the study.
- (2)
- Power limitation is not considered.
- (3)
- The components are independent.
- (4)
- Only the steady-state effects of faults are considered.
- (5)
- The effects of other factors such as weather are not considered, only outages caused by equipment failure.
- (6)
- The load of the intact section can be fully transferred after a contact switch failure.
- (7)
- The initial power supply is absolutely reliable.
5.2. Analysis of Results
Taking the LP1 fault as an example, the fault tree in Figure A1 in Appendix A is built. According to the transformation rules between the fault tree and Petri net model, the fault tree model in Figure A1 is transformed into the Petri net model shown in Figure A2.
To assess the impact of cyber systems on the reliability of physical systems, the following two cases can be studied.
- Case 1: The impact of the cyber system is considered.
- Case 2: The cyber system is assumed to be completely reliable.
The reliability indices of the two cases are calculated separately, and the results of Case 2 are compared with the results of [38,39], which are shown in Table 3.
Table 3.
Comparison of reliability indices results.
As shown in Table 3, when the cyber system is assumed to be completely reliable, the change rates of GSAIFI, GSAIDI, GEENS, and GASAI are within acceptable limits. The calculation results are highly consistent, proving that the accuracy of our method can be guaranteed.
As shown in Table 3, the system reliability of Case 1 is significantly lower than that of Case 2, indicating that cyber system failure will lead to a significant reduction in the reliability of the system. The reason is that considering the cyber system influence increases the uncertainty in the system, which is also affected by cyber system failure, leading to a decrease in the system reliability. Therefore, although cyber systems help to improve the efficiency of the fault management process, the reliability impact caused by them should not be ignored, especially in the future when the coupling between cyber and physical systems becomes deeper, which reflects the importance of considering cyber systems for distribution network CPS reliability assessments.
5.2.1. Impact of Information Component Failure Rate on CPS Reliability of Distribution Network
To investigate the influence of various types of information components on system reliability at different failure rates, a single failure of an information component on the reliability of the distribution network CPS is considered in this paper. A certain component is selected as an unreliable component, and the other components are considered to be completely reliable. The failure rate of each type of information component is gradually increased or decreased by a certain percentage, and the failure rate of other equipment is kept constant so that the average value is obtained for the results of multiple calculations. Through the change in the indices, the trend of the system reliability index GSAIDI can be obtained for each type of information component under different failure rates, as shown in Figure 14.
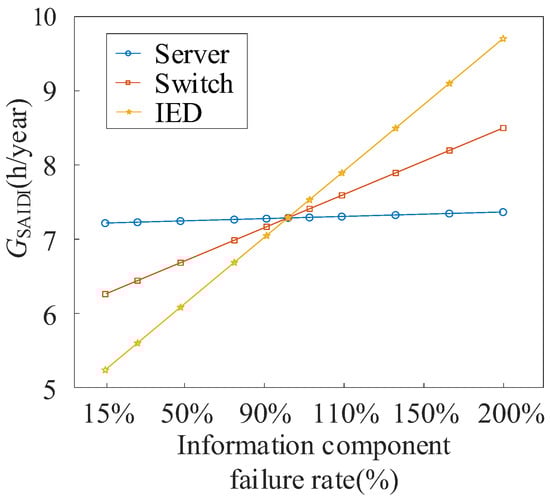
Figure 14.
Trend of GSAIDI under different fault rates.
As shown in Figure 14, the changes in the failure rate of different devices have a variability in the impact on the reliability of the distribution network CPS. The impact of single information component failure on CPS reliability is ranked as follows: IEDs > switches > servers. Among them, the change in server failure has less impact on reliability compared to IEDs as well as switches. The main reason is that at this stage, sufficient protection measures are available for servers, which greatly reduce the failure rate of servers; thus, server interruptions have little impact on the reliability of distribution network CPSs.
5.2.2. Impact of Cyberattacks on System Reliability
In the distribution network CPS, the main potential points of attack are the servers in the control center and the IEDs connected through the switches. The various cyberattacks are shown below.
- The distribution network is operating normally, and the cyber attacker attacks the IED:
- If the IED fails, the cyberattack will not affect the system’s reliability;
- If the IED is attacked during normal operation, the consequences are related to the number and location of the attacked IEDs.
- The distribution network is operating normally, and the cyber attacker attacks the master server:
- If the cyber system fails completely, the master server cannot be attacked;
- If a part of the cyber system fails, the attacker can use the master to control the IEDs;
- If the cyber system is normal, the attacked master server may cause the whole system to be paralyzed.
To analyze the impact of different cyberattack objects on the system reliability, the calculation is divided into three cases below, and the results are shown in Figure 15.

Figure 15.
Reliability indices under different attack objects.
- Case 3: The object of the attack is the master server.
- Case 4: The object of the attack is one IED.
- Case 5: The object of the attack is two IEDs.
As shown in Figure 15, the impact of the cyberattack object on the system reliability is from one IED to two IEDs and the master server in order from large to small, indicating that for cyber systems, choosing the method with a higher success rate to carry out cyberattacks will cause greater economic losses to the system.
To study the impact of specific IED attacks on system reliability, based on the situation of the normal operation of the physical system, various scenarios of cyberattacks on one IED and two IEDs are calculated separately. The types of scenes are shown in Table 4.
Table 4.
Scenario division of cyberattack IED.
The calculation results of the reliability indices for each scenario are shown in Figure 16, Figure 17, Figure 18 and Figure 19.
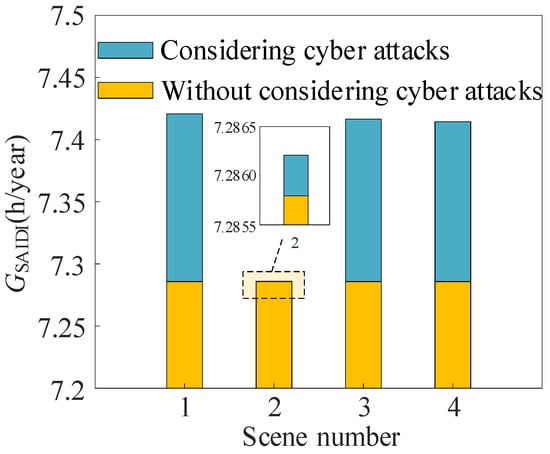
Figure 16.
Impact of attacking one IED on GSAIDI.
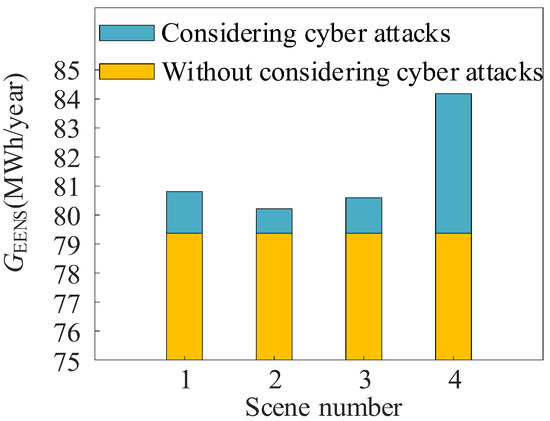
Figure 17.
Impact of attacking one IED on GEENS.
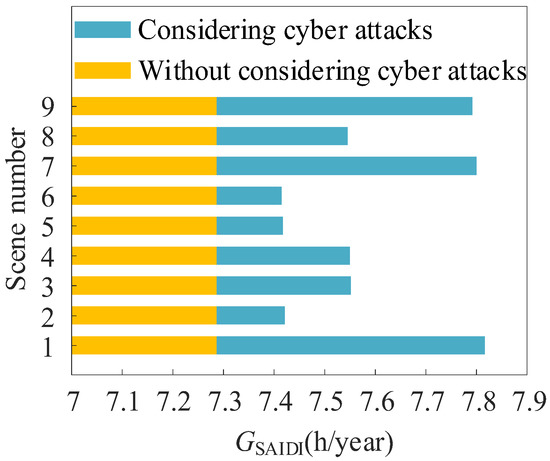
Figure 18.
Impact of attacking two IEDs on GSAIDI.

Figure 19.
Impact of attacking two IEDs on GEENS.
From Figure 16 and Figure 17, it can be seen that the reliability indices of the system increase to different degrees when attacking one IED compared with the reliability indices without considering cyberattacks. This indicates that attacking one IED makes the system reliability decrease, and the fewer the number of switches on the bus where the IED control switch is located and the fewer the number of connected IEDs under the normal operation of the physical system, the smaller its impact on the reliability of the system.
From Figure 18 and Figure 19, it can be seen that the reliability indices of the system when attacking two IEDs increase to different degrees compared with the reliability indices without considering cyberattacks. This indicates that attacking two IEDs makes the system reliability decrease, and for cyberattacking two IEDs, the longer the distance between two IEDs in the attacked IED combination, the greater the impact on reliability. Accordingly, it can provide a reference for the investment of defense resources.
5.2.3. Impact of Access Network Structure on CPS Reliability of Distribution Network
In addition, the cyber system network topology is also an important factor affecting the reliability of CPSs in distribution networks. Therefore, the impact of various different access network structures, such as bus-type, star-type, tree-type, and net-type, on the CPS reliability of the distribution network is studied in this paper. The schematic diagram of each access network structure is shown in Figure 20.
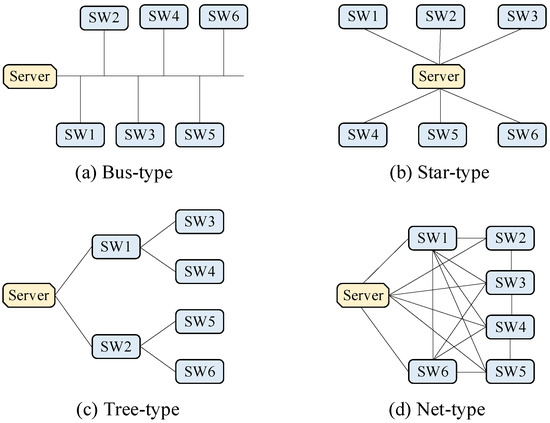
Figure 20.
Schematic diagram of access network structure.
The results of the effects of different access network structures on the system reliability indices are shown in Figure 21.
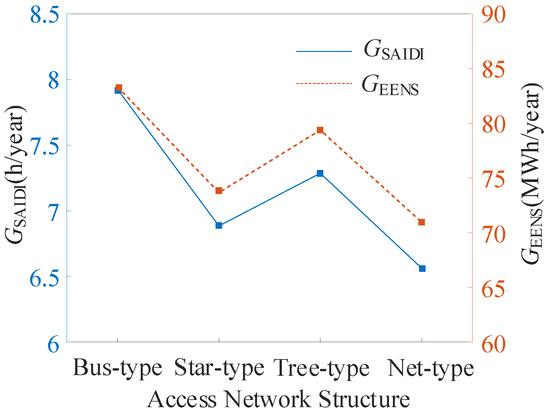
Figure 21.
Reliability indices of different access network structures.
Figure 21 shows that the net-type has the smallest reliability indices and the highest system reliability because more redundant communication lines are available as backups to improve the reliability of the system. Furthermore, the reliability indices of the star-type are slightly higher than those of the net-type, but the variation of the reliability indices is smaller compared with the rest of the structures. Therefore, a suitable access network structure needs to be selected according to the reliability requirements.
In the calculation of reliability indices for different access network structures, the superiority of the combined method of fault tree and Petri net in this paper is also reflected, as only the correlation matrix of Petri net needs to be changed to continue the calculation, which greatly improves the efficiency of the reliability assessment.
6. Conclusions
A reliability assessment model of a distribution network CPS is constructed in this paper by considering the coupling characteristics of the physical system and cyber system of the distribution network using a combination of a fault tree and Petri net. The reliability assessment indices of distribution network CPSs considering cyber disturbances are defined. The effects of different cyber disturbances on system reliability are analyzed to meet the development of new distribution systems with increasing scale and complex structure. The main conclusions are as follows.
- (1)
- The proposed reliability model for distribution network CPSs and the combination of fault trees and Petri nets greatly improve the modeling efficiency.
- (2)
- The defined reliability assessment indices for distribution network CPSs considering cyber disturbances are able to characterize changes in system reliability caused by control failures due to failures of physical components and cyber disturbances, enabling a comprehensive quantitative assessment of CPS reliability, with simple modifications to be applied to other kinds of disturbances that affect the system state.
- (3)
- The impact in the different cyber disturbances on system reliability is analyzed, concluding that the changes in failure rate of different information components have different degrees of impact on system reliability, the number and location of objects of cyberattacks also have a greater impact on system reliability, and a certain impact of access network structure is also caused. With the methods in this paper, system planning, construction, operation, and maintenance protection can be provided for reference.
Author Contributions
Conceptualization, B.Z. and T.Z.; methodology, Y.C. and J.W.; software, Y.C. and B.S.; validation, B.Z., Y.C. and T.Z.; formal analysis, Y.C. and T.Z.; investigation, Y.C. and J.W.; resources, Y.C. and B.S.; data curation, Y.C. and S.C.; writing—original draft preparation, B.Z., Y.C. and T.Z.; writing—review and editing, B.Z., Y.C., T.Z. and S.C.; visualization, T.Z. and Y.C.; supervision, B.Z. and T.Z.; project administration, T.Z. and B.Z.; funding acquisition, T.Z. All authors have read and agreed to the published version of the manuscript.
Funding
This research was supported in part by the National Science Foundation of China (No. 51907097) and National Key R&D Program of China (No. 2021YFB4000500).
Institutional Review Board Statement
Not applicable.
Informed Consent Statement
Not applicable.
Data Availability Statement
Not applicable.
Conflicts of Interest
The authors declare no conflict of interest.
Appendix A
Table A1.
Component reliability raw data.
Table A1.
Component reliability raw data.
| Components | (Times/km·Year) | (Hour/Times) | (Hour) | (Hour) |
|---|---|---|---|---|
| Transformer | 0.0150 | 200 | 10 | 1.0 |
| Overhead line | 0.0650 | 5 | 1.0 |
is the permanent failure rate; is the average fault repair time; is the standby replacement time; and is the switchover time.
Table A2.
Feeder type and length for RBTS-BUS2.
Table A2.
Feeder type and length for RBTS-BUS2.
| Feeder Type | Length (km) | Corresponding Feeder Number |
|---|---|---|
| 1 | 0.60 | 2,6,10,14,17,21,25,28,30,34 |
| 2 | 0.75 | 1,4,7,9,12,16,19,22,24,27,29,32,35 |
| 3 | 0.80 | 3,5,8,11,13,15,18,20,23,26,31,33,36 |
Table A3.
Load point user type and peak load.
Table A3.
Load point user type and peak load.
| Load Point | Number of Load Points | Average Load (MW) | Number of Users |
|---|---|---|---|
| 1,2,3,10,11 | 5 | 0.535 | 210 |
| 12,17,18,19 | 4 | 0.450 | 200 |
| 8 | 1 | 1.00 | 1 |
| 9 | 1 | 1.15 | 1 |
| 4,5,13,14,20,21 | 6 | 0.566 | 1 |
| 6,7,15,16,22 | 5 | 0.454 | 10 |
| Total | 22 | 12.291 | 1908 |

Figure A1.
Fault tree for LP1.
Figure A1.
Fault tree for LP1.


Figure A2.
Petri net for LP1.
Figure A2.
Petri net for LP1.

References
- Wang, T.; Liu, W.; Cabrera, L.V.; Wang, P.; Wei, X.; Zang, T. A Novel Fault Diagnosis Method of Smart Grids Based on Memory Spiking Neural P Systems Considering Measurement Tampering Attacks. Inf. Sci. 2022, 596, 520–536. [Google Scholar] [CrossRef]
- Wang, Y.; Liu, D.; Xu, X.; Dai, H. Cyber-Physical Power System Modeling for Timing-Driven Control of Active Distribution Network. J. Mod. Power Syst. Clean Energy 2020, 8, 549–556. [Google Scholar] [CrossRef]
- Ni, M.; Li, M.; Li, J.; Wu, Y.; Wang, Q. Concept and Research Framework for Coordinated Situation Awareness and Active Defense of Cyber-Physical Power Systems Against Cyber-Attacks. J. Mod. Power Syst. Clean Energy 2021, 9, 477–484. [Google Scholar] [CrossRef]
- Li, Y.; Li, T.; Zhang, H.; Xie, X.; Sun, Q. Distributed Resilient Double-Gradient-Descent Based Energy Management Strategy for Multi-Energy System Under DoS Attacks. IEEE Trans. Netw. Sci. Eng. 2022, 9, 2301–2316. [Google Scholar] [CrossRef]
- Liu, W.; Gong, Q.; Guo, J.; Shan, X.; Wang, Z. Reliability Simulation of ADN Cyber-Physical System Based on Hybrid Communication Network. Proc. Chin. Soc. Electr. Eng. 2018, 38, 1706–1718. [Google Scholar] [CrossRef]
- Beyza, J.; Yusta, J.M.; Evangelista, M.A.; Artal-Sevil, J.S.; Rendon, J.A. Evaluation of Reliability and Robustness of Electric Power Systems with Renewable Energies. In Proceedings of the 2021 IEEE International Autumn Meeting on Power, Electronics and Computing (ROPEC), Ixtapa, Mexico, 10–12 November 2021; Volume 5, pp. 1–6. [Google Scholar]
- Liu, J.; Shen, H.; Yang, F. Reliability Evaluation of Distribution Network Power Supply Based on Improved Sampling Monte Carlo Method. In Proceedings of the 2020 5th Asia Conference on Power and Electrical Engineering (ACPEE), Chengdu, China, 4–7 June 2020; pp. 1725–1729. [Google Scholar]
- Xu, D.; Wang, Y. Reliability Assessment of Active Distribution Network Considering Cyber Failure in Uncertain Environment. Autom. Electr. Power Syst. 2020, 44, 134–142. [Google Scholar] [CrossRef]
- Ma, T.; Wu, J.; Niu, X. Reliability Assessment Indices and Method for Urban Microgrid. CIRED-Open Access Proc. J. 2017, 2017, 837–840. [Google Scholar] [CrossRef]
- Han, Y.; Wen, Y.; Guo, C.; Huang, H. Incorporating Cyber Layer Failures in Composite Power System Reliability Evaluations. Energies 2015, 8, 9064–9086. [Google Scholar] [CrossRef]
- Ding, R.; Liu, Z.; Xu, J.; Meng, F.; Sui, Y.; Men, X. A Novel Approach for Reliability Assessment of Residual Heat Removal System for HPR1000 Based on Failure Mode and Effect Analysis, Fault Tree Analysis, and Fuzzy Bayesian Network Methods. Reliab. Eng. Syst. Saf. 2021, 216, 107911. [Google Scholar] [CrossRef]
- Zhang, N.; Chen, Y.; Yang, W.; Zhang, Z.; Liu, Y.; Mao, W. Application of Fault Tree Analysis for Reliability Evaluation and Weak Link Identification of Stadium Power Supply System Using Monte Carlo Simulation. In Proceedings of the 2021 IEEE Sustainable Power and Energy Conference (iSPEC), Nanjing, China, 23–25 December 2021; pp. 4209–4214. [Google Scholar]
- Chen, H.; Chen, L.; Zhang, Y. Research on Reliability Analysis Method Based on Dynamic Fault Tree. J. Phys. Conf. Ser. 2021, 1802, 042064. [Google Scholar] [CrossRef]
- Deng, L.; Liu, Y.; Yu, Y.; Bai, T. Reliability Assessment of Distribution Network CPS Considering Whole Fault Processing. Electr. Power Autom. Equip. 2017, 37, 22–29. [Google Scholar] [CrossRef]
- Xiong, X.; Tan, J.; Lin, X. Reliability Analysis of Communication Systems in Substation Based on Dynamic Fault Tree. Proc. Chin. Soc. Electr. Eng. 2012, 32, 135–141. [Google Scholar] [CrossRef]
- Kumari, R.; Naick, B.K. Reliability Assessment of Distribution System Considering Protection Coordination. In Proceedings of the 2022 2nd International Conference on Emerging Frontiers in Electrical and Electronic Technologies (ICEFEET), Patna, India, 24–25 June 2022; pp. 1–5. [Google Scholar]
- Liu, T.S.; Chiou, S.B. The Application of Petri Nets to Failure Analysis. Reliab. Eng. Syst. Saf. 1997, 57, 129–142. [Google Scholar] [CrossRef]
- Guo, J.; Liu, W.; Zhang, J.; Ma, T. A Survey of Reliability Modeling and Evaluation Methods for Active Distribution Cyber-Physics Systems. Power Syst. Technol. 2019, 43, 10. [Google Scholar] [CrossRef]
- Zhao, Y.; Li, P.; Gao, M.; Niu, B.; Hou, C.; Xiang, T. Reliability Classification Standard and Evaluation Method of Distribution Network. In Proceedings of the 2021 IEEE 5th Conference on Energy Internet and Energy System Integration (EI2), Taiyuan, China, 22–24 October 2021; pp. 1384–1389. [Google Scholar]
- Guo, J.; Zhao, T.; Liu, W.; Zhang, J. Reliability Modeling and Assessment of Isolated Microgrid Considering Influences of Frequency Control. IEEE Access 2019, 7, 50362–50371. [Google Scholar] [CrossRef]
- Chen, B.; Lu, Z.; Zhou, H. Reliability Assessment of Distribution Network Considering Cyber Attacks. In Proceedings of the 2018 2nd IEEE Conference on Energy Internet and Energy System Integration (EI2), Beijing, China, 20–22 October 2018; pp. 1–6. [Google Scholar]
- Zeng, G.; Yu, T.; Wang, Z.; Lin, D. Analytical Reliability Assessment of Cyber-Physical Distribution System with Distributed Feeder Automation. Electr. Power Syst. Res. 2022, 208, 107864. [Google Scholar] [CrossRef]
- Bessani, M.; Fanucchi, R.Z.; Delbem, A.C.C.; Maciel, C.D. Impact of Operators’ Performance in the Reliability of Cyber-Physical Power Distribution Systems. IET Gener. Transm. Distrib. 2016, 10, 2640–2646. [Google Scholar] [CrossRef]
- Hashemi-Dezaki, H.; Askarian-Abyaneh, H.; Haeri-Khiavi, H. Impacts of Direct Cyber-Power Interdependencies on Smart Grid Reliability under Various Penetration Levels of Microturbine/Wind/Solar Distributed Generations. IET Gener. Transm. Distrib. 2016, 10, 928–937. [Google Scholar] [CrossRef]
- Luo, F.; Yang, W.; Zhang, T.; Wang, C.; Wei, G.; Yao, L. Influence of Distribution Automation Data Transmission Errors on Power Supply Reliability of Distribution System. Dianli Xitong Zidonghua/Autom. Electr. Power Syst. 2018, 42, 10–17. [Google Scholar] [CrossRef]
- Zhang, T.; Luo, F.; Wang, C.; Wang, X.; Jin, Z.; Liu, Y. Influence of Information System on Microgrid Operation Reliability. Autom. Electr. Power Syst. 2016, 40, 28–35. [Google Scholar] [CrossRef]
- Wang, C.; Zhang, T.; Luo, F.; Li, F.; Liu, Y. Impacts of Cyber System on Microgrid Operational Reliability. IEEE Trans. Smart Grid 2019, 10, 105–115. [Google Scholar] [CrossRef]
- Li, H.; Guo, X. Reliability Evaluation of Cyber-Physical System of Distribution Network Based on Petri Net. Power Syst. Technol. 2023, 47, 347–359. [Google Scholar] [CrossRef]
- Wang, S.; Wu, Z.; Su, A.; Jin, S.; Xia, Y.; Zhao, D. Reliability Modeling and Simulation of Cyber-Physical Power Distribution System Considering the Impacts of Cyber Components and Transmission Quality. In Proceedings of the 2018 37th Chinese Control Conference (CCC), Wuhan, China, 25–27 July 2018; pp. 6166–6171. [Google Scholar]
- Lin, Z.; Wang, Z.; Li, X. Reliability Modeling and Fast Evaluation Method of Active Distribution System Considering Cyber Invalidity. Master’s Thesis, North China Electric Power University, Beijing, China, 2021. [Google Scholar] [CrossRef]
- Sun, X.; Liu, Y.; Deng, L. Reliability Assessment of Cyber-Physical Distribution Network Based on the Fault Tree. Renew. Energy 2020, 155, 1411–1424. [Google Scholar] [CrossRef]
- Bobbio, A.; Franceschinis, G.; Gaeta, R.; Portinale, L. Parametric Fault Tree for the Dependability Analysis of Redundant Systems and Its High-Level Petri Net Semantics. IEEE Trans. Softw. Eng. 2003, 29, 270–287. [Google Scholar] [CrossRef]
- Wu, Y.; Xu, H.; Ni, M. Defensive Resource Allocation Method for Improving Survivability of Communication and Information System in CPPS Against Cyber-Attacks. J. Mod. Power Syst. Clean Energy 2020, 8, 750–759. [Google Scholar] [CrossRef]
- Bhardwaj, M.; Agrawal, R. Application of Fault Tree Analysis and Petri Net Modeling in Perishable Product Supply Chain. In Proceedings of the 2020 IEEE International Conference on Industrial Engineering and Engineering Management (IEEM), Marina Bay Sands, Singapore, 14–17 December 2020; pp. 1189–1193. [Google Scholar]
- Niloofar, P.; Lazarova-Molnar, S. Fusion of Data and Expert Knowledge for Fault Tree Reliability Analysis of Cyber-Physical Systems. In Proceedings of the 2021 5th International Conference on System Reliability and Safety (ICSRS), Palermo, Italy, 24–26 November 2021; pp. 92–97. [Google Scholar]
- Allan, R.N.; Billinton, R.; Sjarief, I.; Goel, L.; So, K.S. A Reliability Test System for Educational Purposes-Basic Distribution System Data and Results. IEEE Trans. Power Syst. 1991, 6, 813–820. [Google Scholar] [CrossRef]
- Akula, S.; Salehfar, H. Comprehensive Reliability Modeling of Grid-Tied Microgrids Using Fault Tree Analysis. In Proceedings of the 2020 52nd North American Power Symposium (NAPS), Tempe, AZ, USA, 11–13 April 2021; Volume 9, p. 4. [Google Scholar]
- Billinton, R.; Wang, P. Distribution System Reliability Cost/Worth Analysis Using Analytical and Sequential Simulation Techniques. IEEE Trans. Power Syst. 1998, 13, 1245–1250. [Google Scholar] [CrossRef]
- Rong, X.; Huang, Y.; Ye, Y.; Li, G.; Bie, Z. Graph Theory-Based Distribution System Reliability Evaluation. In Proceedings of the 2022 China International Conference on Electricity Distribution (CICED), Changsha, China, 7–8 September 2022; pp. 1062–1066. [Google Scholar]


Disclaimer/Publisher’s Note: The statements, opinions and data contained in all publications are solely those of the individual author(s) and contributor(s) and not of MDPI and/or the editor(s). MDPI and/or the editor(s) disclaim responsibility for any injury to people or property resulting from any ideas, methods, instructions or products referred to in the content. |
© 2023 by the authors. Licensee MDPI, Basel, Switzerland. This article is an open access article distributed under the terms and conditions of the Creative Commons Attribution (CC BY) license (https://creativecommons.org/licenses/by/4.0/).