Article

Quantitative Tissue Elasticity Measurement of Human Cadaver Oesophagus by Using Vibrational Optical Coherence Elastography

1
School of Science and Engineering, University of Dundee, Dundee DD1 4HN, UK
2
Centre for Anatomy and Human Identification, University of Dundee, Dundee DD1 4HN, UK
*
Authors to whom correspondence should be addressed.
These authors contributed equally to this work.
Appl. Sci. 2023, 13(6), 3844; https://doi.org/10.3390/app13063844
Submission received: 16 February 2023 / Revised: 10 March 2023 / Accepted: 14 March 2023 / Published: 17 March 2023

Abstract

:
The mechanical properties and structure alteration (e.g., layer morphology and thickness) of the oesophagus wall can reflect its pathological conditions. Hence, quantitative measurement of the above-mentioned properties can play a significant role in aiding the disease diagnosis in clinical application. As a fast and non-invasive imaging modality, Optical coherence tomography (OCT) and vibrational elastography can provide high resolution (<10 µm) structural and mechanical mapping of soft tissue. This study is a preliminary study to explore the potential of OCT and VOCE to evaluate both structural and mechanical properties of the oesophagus wall. Jn total, 52 oesophageal tissue samples were acquired from seven human Thiel-embalmed cadavers and were examined by the vibrational OCE. Both the OCT structure image and quantitative elasticity of each sample layer were obtained. In the OCT structure image, the averaged thickness for each sample layer was measured and corresponded with the histological image. Lamina propria has the largest thickness of 158.14 ± 8.75 µm, submucosa is the thinnest with a thickness of 143.19 ± 10.11 µm, and the thickness of muscularis mucosa is 149.49 ± 10.85 µm. Averaged intensity of back-scattered light from each sample layer was evaluated. Intensity of lamina propria layer, muscularis mucosa layer, and submucosa layer have an average value of 79.27 ± 0.51 dB, 69.83 ± 0.56 dB, and 76.10 ± 0.55 dB, respectively. The quantitative elasticity of each sample layer was evaluated in OCE. Elasticity of the lamina propria layer, muscularis mucosa layer, and submucosa layer were estimated as 115.64 ± 8.80 kPa, 60.28 ± 5.27 kPa, and 205.25 ± 19.03 kPa, respectively. The quantitative elasticity results obtained by vibrational OCE corresponded with the collagen distribution trend in each sample layer. This study demonstrates the ability of OCT and vibrational OCE in the characterisation and quantitative evaluation of human cadaver oesophagus wall-structure properties and mechanical properties. The feasibility of applying OCT and vibrational OCE in clinical diagnosis of oesophageal disease is also discussed.

1. Introduction

Cancer is still one of the top diseases which causes death in the world [1]. In the past few decades, there has been apparent fast growth in the incidence rate of oesophageal cancer [2,3,4]. Due to its aggressive nature and poor survival rate [5], an early diagnosis of oesophageal cancer is important and could contribute to the treatment. The clinical diagnosis golden standard for oesophageal cancer is gastroscopy. The diagnosis and staging of oesophageal cancer can be verified with histopathological results from a target biopsy [6]. In the field of staging of oesophageal cancer, computed tomography (CT), endoscopic ultrasound (EUS) and endosonography are involved as well. Some studies reported that staging oesophageal cancer by using EUS and enosonography should be reconsidered due to its low diagnostic accuracy [7,8]. Histopathology analysis is time consuming; in addition, the outcome of the histopathology analysis is highly dependent on the examiner’s consistency, for example, the pathologist’s experience [9,10,11]. From a biological perspective, carcinoma causes pathological change to the tissue, not only the biological properties, but also the tissue’s physical properties. In practical diagnosis, clinicians perform a general diagnosis methodology which includes palpation where the tumours can be differentiated from the healthy tissue based on the elasticity properties. For example, breast cancer and prostate cancer tissue show different elastic properties from normal tissue, which can be considered a biomarker for cancer diagnosis [12,13]. An understanding of the quantitative mechanical characteristics of tissues constituting the human oesophagus wall is necessary to investigate its behaviour as well as the conditions of failure. It will contribute to the disease diagnosis and to developing the biomaterial for replacement, when needed.
As a high-resolution, non-invasive technique, OCT is capable of providing a cross-section micro-structure image of tissue by measuring back-scattered light energy intensity [14]. The reflected light power intensity is subjected to the optical properties of tissue [15,16]. The optical properties of the tissue could be applied to the characterisation and differentiation of the histopathological change of soft tissue [17,18]. By combining external stimulation devices, OCT is integrated into OCE, in which the quantitative mechanical properties can be estimated. Our research group raised the vibrational OCE by combining OCT with an external vibration stimulator in 2013 [19]. Vibrational OCE has shown promising results in soft-tissue elastic property characterisation [20,21]. Across the types of OCE methods, the resolution of vibrational OCE is higher than the SAW-OCE and SW-OCE [22]. The vibrational OCE has been reported to be used in detecting and characterising cancerous tissue, such as suspected prostate cancer [23,24]. Thus, OCT and vibrational OCE could be applied to investigate both structural and elastic properties of human cadaver oesophageal tissue.
In this research project, a Phase-sensitive OCT (PhS-OCT) with ultra-high resolution [25] and integrated vibrational OCE were applied to explore the layers’ structure and elastic properties of human cadaver oesophageal tissue. This is the first study which quantitatively evaluates both the optical properties and elastic properties of human Thiel-embalmed cadavers, as well as the structural information, by employing OCT/OCE. This study reveals the feasibility of OCT and OCE in investigating both optical and elastic properties of human cadaver oesophageal tissue which could potentially contribute to the clinical diagnosis of oesophageal disease.

2. Materials and Methods

2.1. OCT/OCE System Configuration and Imaging Protocol

The system setup is schematically shown in Figure 1. This OCE system consisted of two main parts, which are the signal detection part and the signal stimulation part. For signal detection, the PhS-OCT system employed a super luminescent diode (Thorlabs S5FC series) for the laser source. The laser source had a central wavelength of 1310 nm, the spectral bandwidth was 85 nm and the axial resolution was 8.8 μ m theoretically. A 50 mm focal length objective lens was selected, which resulted in a lateral resolution of 16 μ m in air and 11.85 μ m in the oesophageal sample with a refraction index n = 1.35. The interfered signal was captured by a CCD camera (SUI-GL20448L; UTC Aerospace) with a 20,730 Hz sampling frequency.
To stimulate the oesophageal tissue sample, a commercial electric–magnetic shaker (LDS V201, Brüel & Kjær Sound and Vibration Measurement A/S, Teknikerbyen 28, DK-2830 Virum, Denmark) was employed. The shaker is driven by a signal generator (33220A.; Agilent Technologies, Santa Clara, CA 95051, USA) and a power amplifier (7724 DC-enabled AC power amplifier; AE Techron, Elkhart, IN 46516, USA) directly with a sinusoidal wave input signal to generate periodic stimulation to the sample. Based on the previous work carried out by our research group regarding the optimal stimulation frequency for vibrational OCE [26], the input sinusoidal signal was set at 650 Hz with a peak-to-peak amplitude of 30 milli-volts, which resulted in a vibration amplitude of 150–250 nm. The vibration amplitude was transmitted from the shaker to the sample and reference material via a solid-sample holder plate; the vibration amplitude was assumed to be uniformly distributed both in the sample and reference material layers.
For the data acquisition protocol, it was set as the MB-scan mode. Each A-line scan represented depth information of the sample; 512 pixels were selected for depth information based on the current system; 512 A-line scans formed an M-scan. Thus, one cross-section of the sample consisted of 512 pixels × 512 pixels. Each B-scan consisted of 512 M-scans. The scan protocol was controlled by the dual-axis galvanometer (Thorlabs, GVS002, New Jersey, USA) and the CCD camera trigger. Based on the current system setup, the actual scanning ranges in axial and lateral direction were 4.68 μ m / p i x e l and 6.25 μ m / p i x e l , respectively, in OCT structure image.

2.2. OCT Intensity and Tissue Layer Thickness Measurement

In this study, the OCT structure images were obtained for each human cadaver’s oesophageal tissue. Each two-dimensional image was reconstructed by the scattered OCT signal intensity from the examined sample. The sample consisted of one reflective layer at each depth position z , the spectral interferogram was a function of wavelengths of the broadband source. In the current OCT setup, the spectral interferogram I D ( k ) is given by [27]:
I D ( k ) S ( k ) n = 1 N R S R R ( cos 2 k z n )
where k is the wavenumber, the I D ( k ) denotes power intensity of the interference pattern captured by the linear detector, S ( k ) describes the power density of the light source. R S R R describes the reflectivity from sample surface and reference surface and n is the depth number. After a Fourier transformation of I D k , the scattered OCT power intensity will be given into a complex domain signal in logarithmic scale. In this study, each pixel in the OCT structure image was represented by the power density of the interference light. To evaluate the OCT intensity, the power density for each pixel was extracted.
The thickness of each oesophagus layer was measured from the cross-sectional OCT image, with pixel numbers from top to bottom of each layer. As each pixel represents a certain length for current system setup, the thickness of the oesophagus layer can be expressed as:
T L = P l × N L
where the T L represents the thickness of the oesophagus layer, P l is the actual length of one pixel, and N L is the number of pixels which cover each layer region.
The maximum thickness of each layer was extracted, and all the data were averaged by the total sample numbers to represent the thickness of each layer.

2.3. OCE Results Processing Method

To obtain the elastography results from the vibrational optical-coherence elastography, a mathematical model was proposed by our research group [19]. For each scanning position, the A-scan was repeated 512 times, and the phase difference between the first scan with each of the rest scans was obtained. Thus, fast Fourier transform (FFT) was applied to the phase difference; the phase FFT amplitude as function of depth was procured. The phase FFT amplitude was prompted by the vibration stimulation, and directly related to the sample strain ( ε ) under the stress ( σ ), the higher elasticity material with a lower phase FFT amplitude and lower elasticity material with a higher phase FFT amplitude. After that, a linear polynomial model was applied to the phase FFT amplitude, by which the slope of phase FFT amplitude was calculated. As the phase FFT amplitude is directly correlated with the sample strain, the ratio of slopes from different elasticity samples equals the strain ratio for different elasticity samples. In this model, the sample and the reference material were considered as an elastic material and the vibration amplitude was uniformly transmitted to the sample and reference material, which means the stress applied on reference material and sample was the same. Therefore, the strain ratio of sample and reference material was inversely proportional to the ratio of sample elasticity and reference material. Sample elasticity was estimated by using the reference material’s known elasticity multiplied by the ratio of reference material strain and sample strain, which can be expressed as Equations (3) and (4):
E s E R = σ S ε S σ R ε R = σ S ε R σ R ε S ε R ε S
E E R ε R ε S
where E S denotes sample elasticity, E R denotes reference material elasticity, σ S denotes sample stress, σ R denotes the stress of reference material, and ε S and ε R are the strain of sample and reference material, respectively. In the application of OCE, the constant stress field is assumed to be applied to the sample and reference material. Thus, the stress applied to sample and reference material can be considered the same.
In this work, the reference material was fabricated using a silicone material (Ecoflex 00-30; Smooth-on Inc., Macungie, PA, USA), according to the manufacturer’s manual with a thickness of 0.5 mm, and 20 mm in length and 15 mm in width. The elasticity was evaluated as 170.96 kPa with a mechanical compression test.

2.4. Oesophagus Wall Tissue Sample Handling

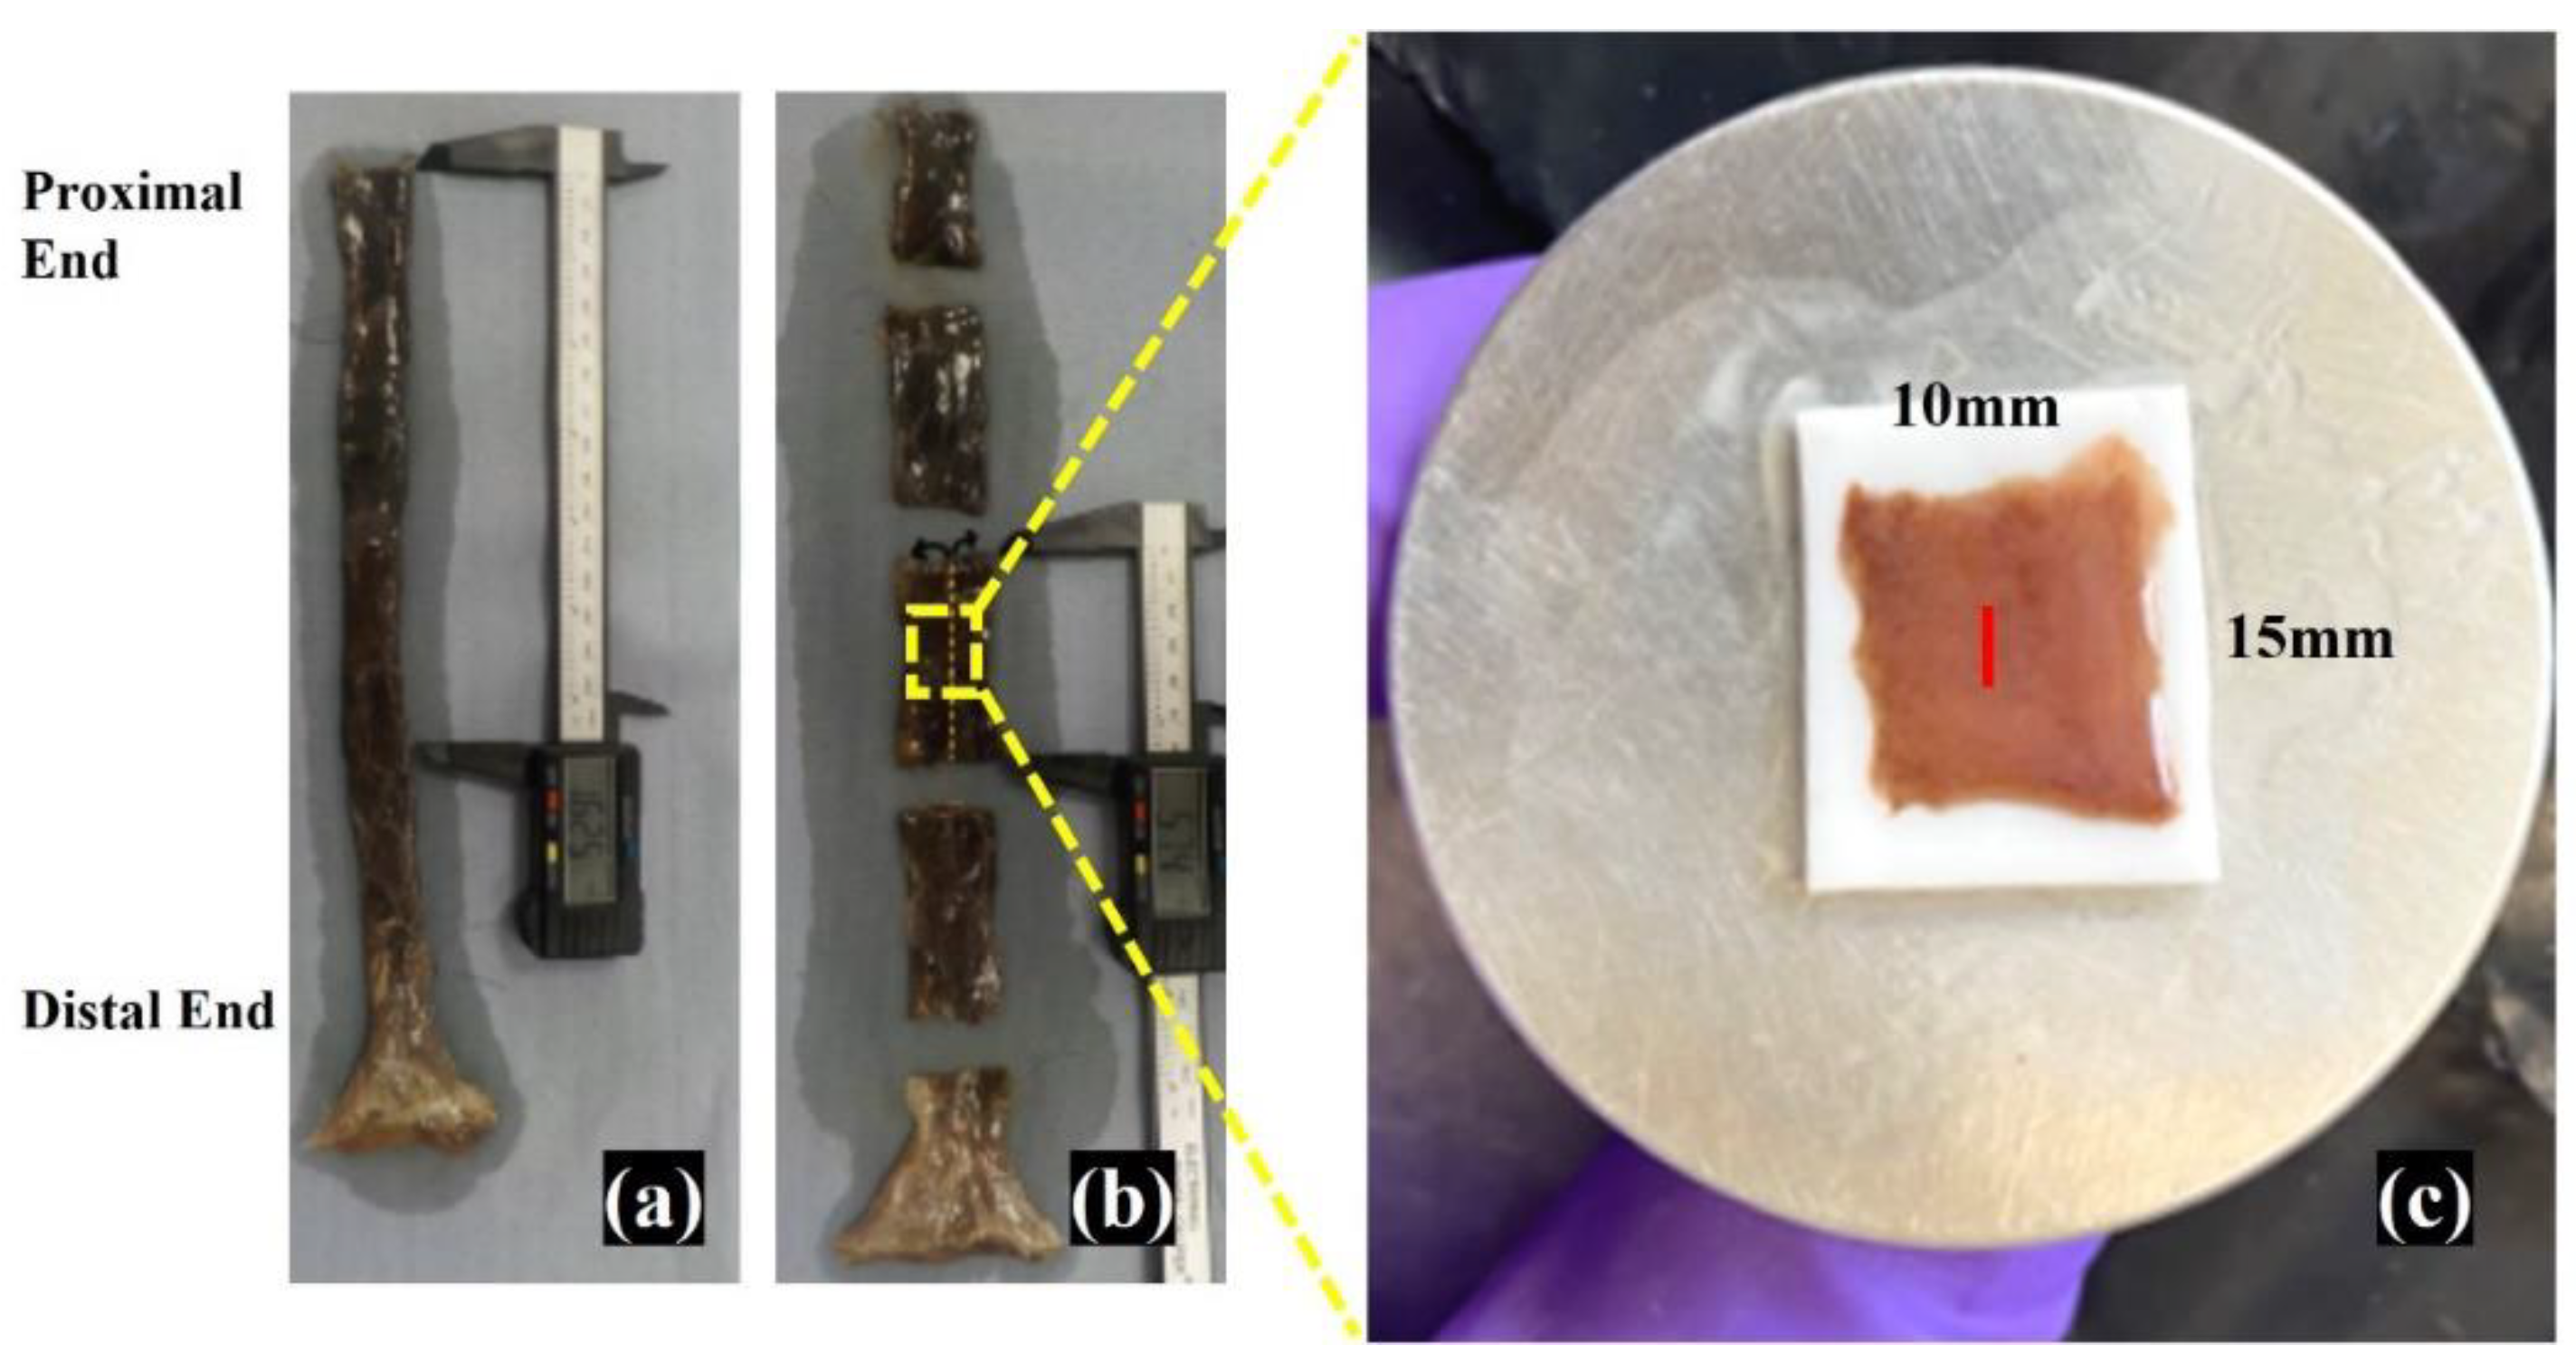
Samples from 7 human Thiel-embalmed cadavers, 3 male and 4 female, provided by the Centre of Anatomy and Human Identification (CAHID) at the University of Dundee, were used in this research (see Table 1). All cadavers with a cause of death related to oesophageal disease or damage to the oesophagus were excluded from the study to ensure that the elastic properties of normal human tissue were considered. The oesophagus was incised through a longitudinal incision along the tissue wall allowing the entire luminal surface to be exposed. Samples with a dimension of 20 mm × 10 mm were obtained. To achieve an ideal imaging depth, the mucosal and submucosal layers were microscopically separated from the muscularis propria and adventitia and immediately preserved in Thiel-embalming solution to prevent dehydration. The quantity of samples dissected from each cadaver varied due to differences in tissue sample quality, with only the samples that showed reasonable structural information being selected. A total of 52 samples were prepared. After the incision process of the sample, the sample was placed on the sample holder with the silicone reference material underneath it. Figure 2 shows the oesophageal tissue sample handling process.

2.5. Histological Imaging

After the OCT/OCE examination, as a three-colour staining histology method, Masson’s trichrome (MT) stain was selected to obtain histological results for all samples. This method is a widely used histological stain to differentiate collagen cells and muscular cells [28]. After the OCT/OCE examination, the samples were dehydrated in graded ethanol and xylene by employing an automatic tissue processor. The samples were then embedded in paraffin, and then sectioned with 5 μ m thickness in preparation for the MT stain. Moreover, the cutting orientation was kept the same as the OCT/OCE scan. In the MT stain, the collagen cell and muscular cell were observed in blue and red colour, respectively. Light red/pink represents the cytoplasm. Nuclei were in brown colour.

3. Results

3.1. Cross-Section Observation of Oesophageal Tissue

Figure 3 shows an OCT structure image of oesophageal tissue sample (a) and its corresponding MT-stained histological sample (b). The results highlight observable similarities between the OCT result and the histological sample. The tissue sample was histologically analysed in the same orientation as the OCT examination. By comparing with the histological sample, the layers shown in the OCT result can be identified. In the histology result, the lamina propria and submucosa are expected to demonstrate a high presence of collagen, specifically type I and type III in the lamina propria [29,30,31,32] whereas the muscularis mucosa is composed predominantly of muscle tissue [33,34], as shown in Figure 3. The layer boundaries are clearly observed in the OCT structure image, which indicates three layers were shown, which are lamina propria, muscularis mucosa, and submucosa from top to bottom, respectively.
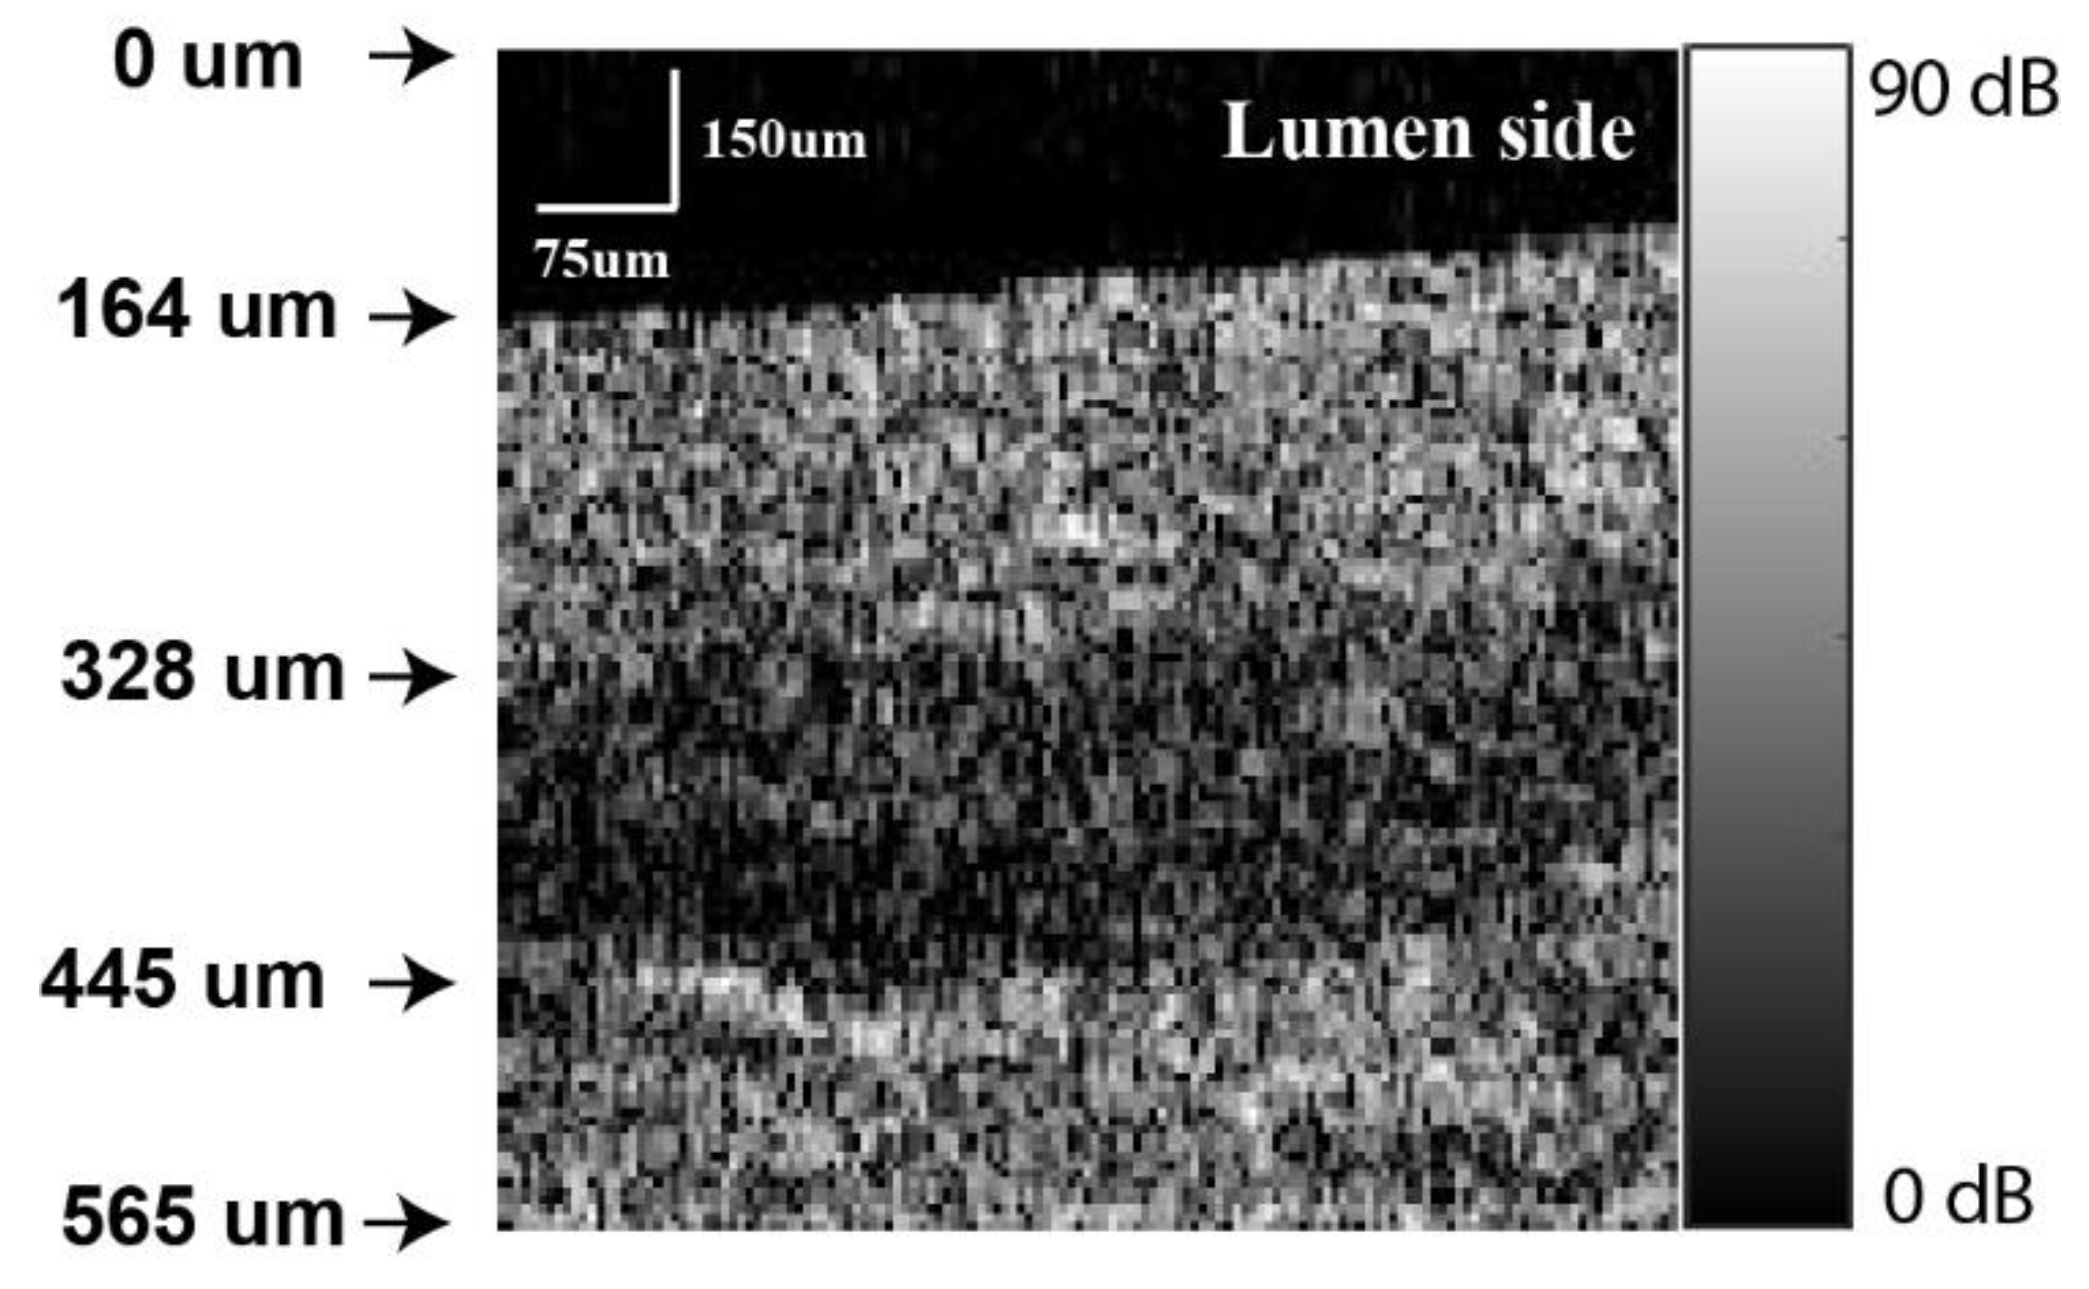
The measurement results of the OCT intensity in multiple layers are depicted in Figure 4a, which demonstrates the OCT intensity scattered back from each layer of the total 52 oesophageal tissue samples. The results are extracted from OCT structure image results, the intensity images by selecting each individual layer region with a maximum effective rectangle shape area, then the results are averaged to represent the OCT intensity of each layer. The differences of the back-scattered intensity from each layer are clearly shown in Figure 4a. Figure 4b represents a structure image of cadaver oesophageal tissue; layers are indicated. The averaged back-scattered intensity of each oesophagus layer is given in Table 2.

3.2. Oesophagus Layer Thickness Measurement

The oesophagus layers’ thickness was measured from the OCT structure images (Figure 5). Each layer was identified by cross-correlating the OCT structure image with the histology result. The maximum thickness was selected to represent the layer thickness.
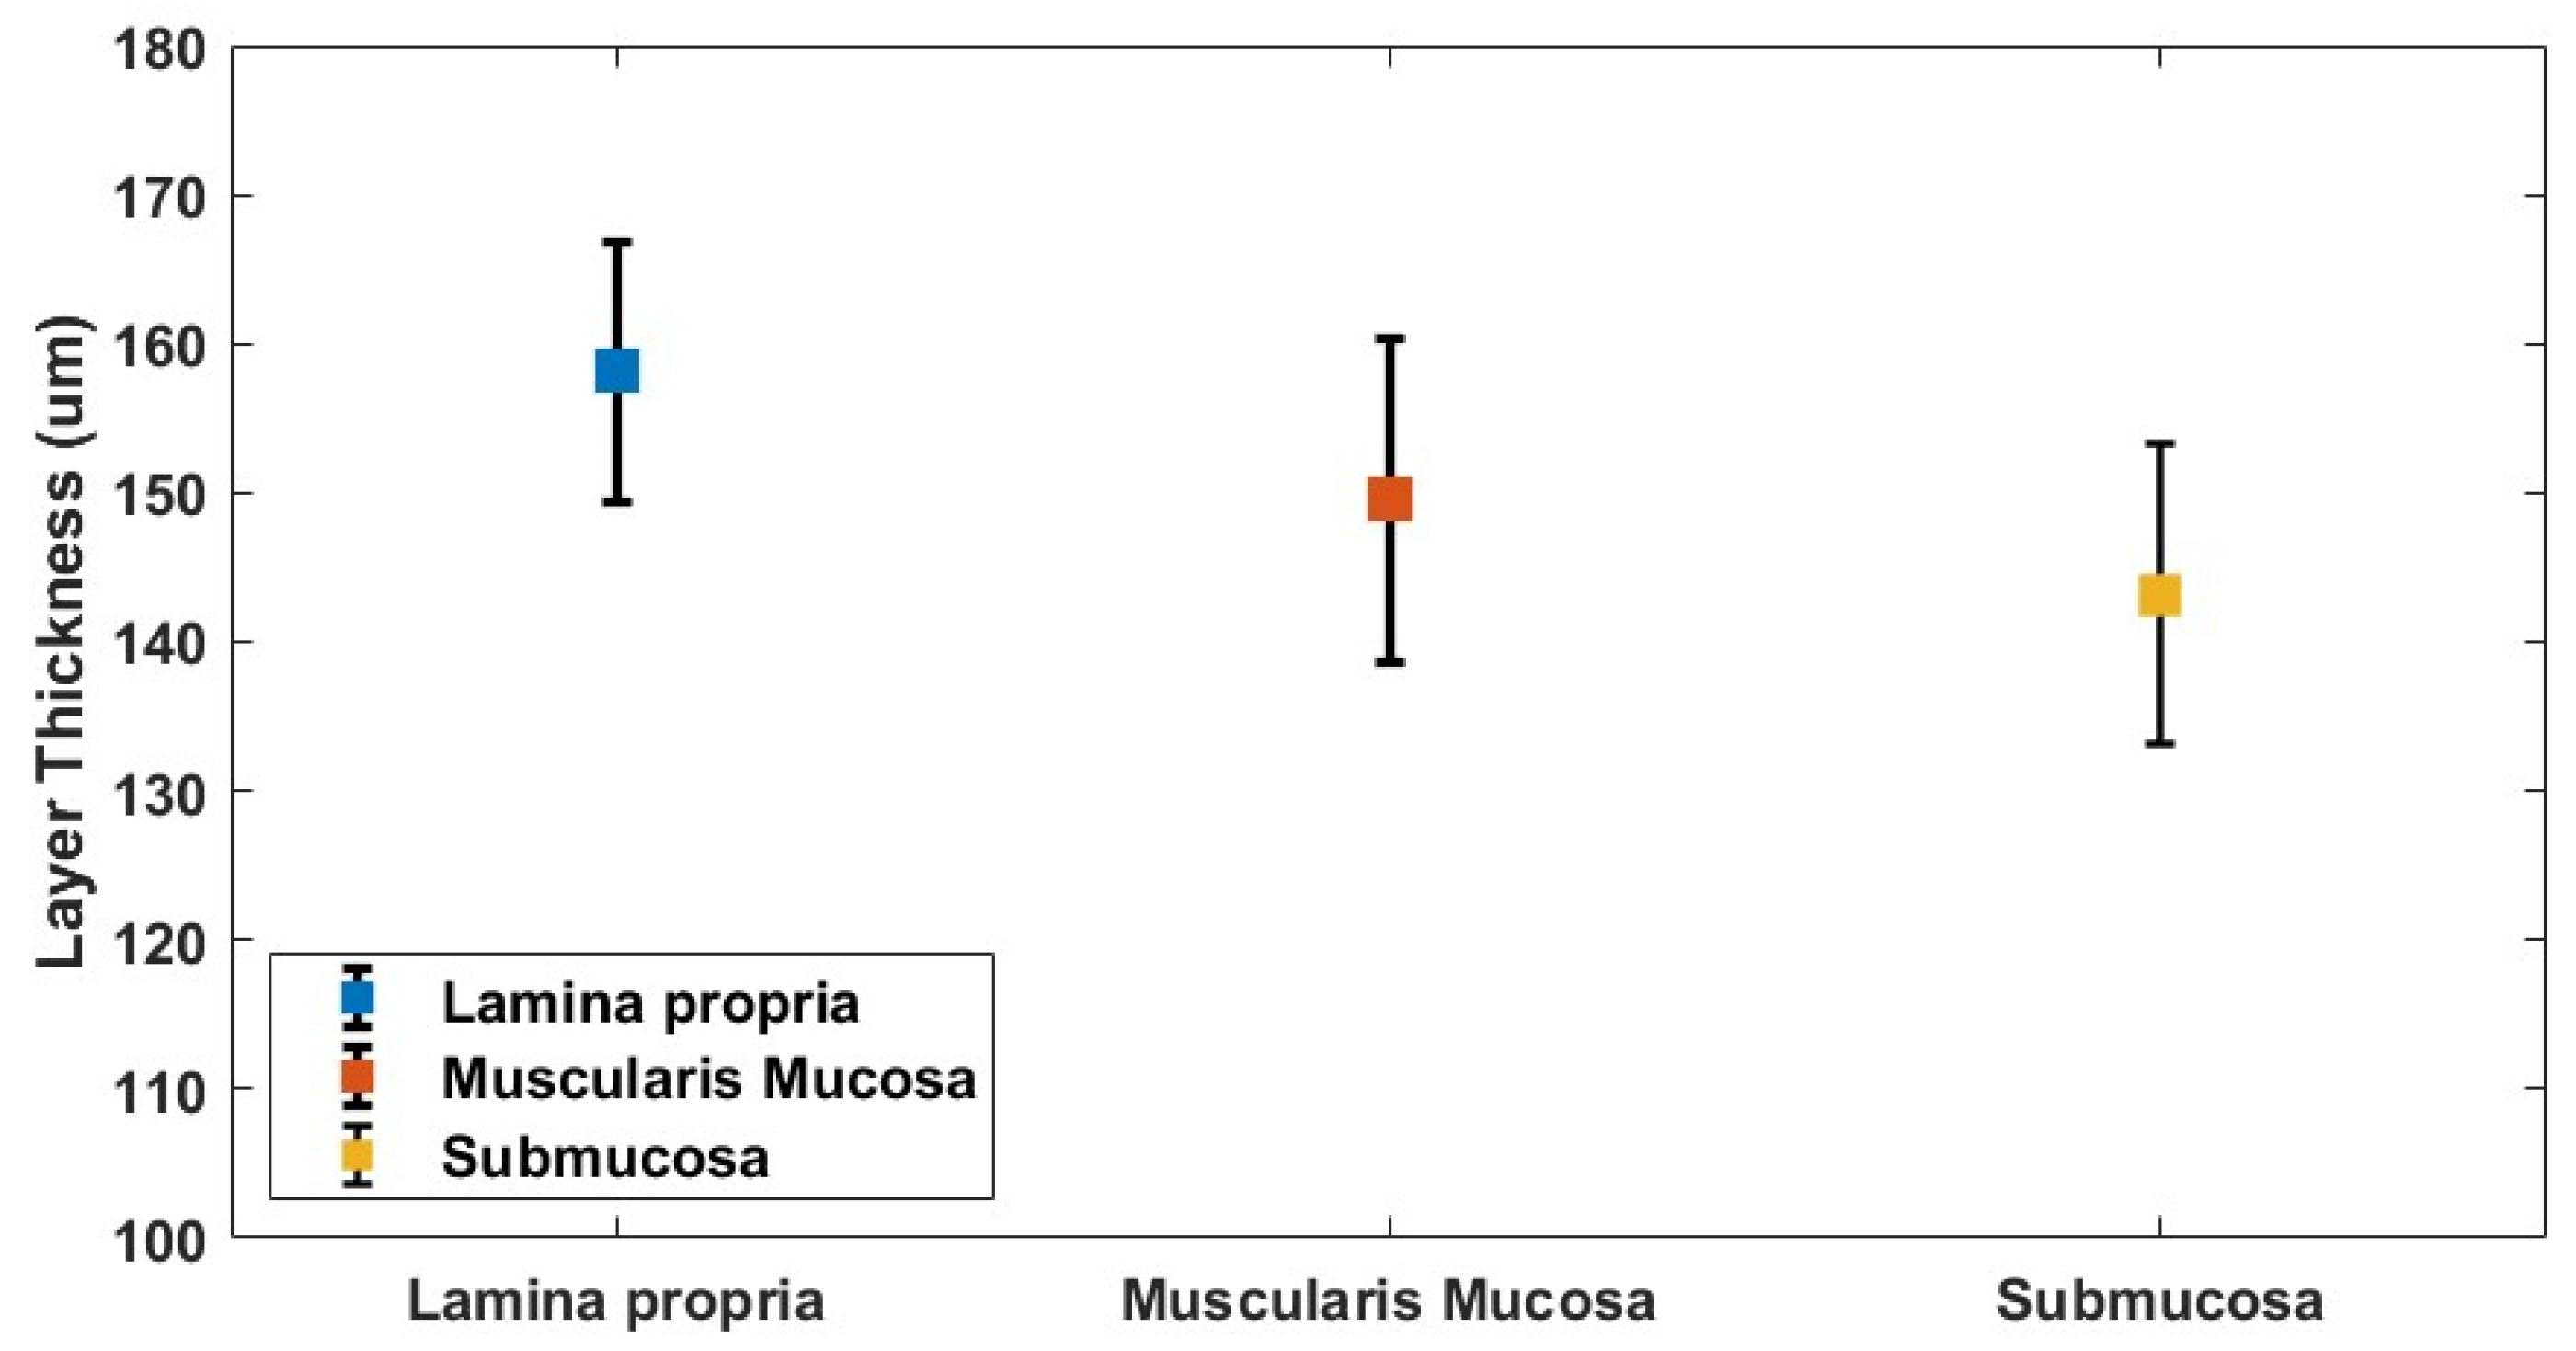
The layer thickness for a total of 52 samples was evaluated. Figure 6 shows each averaged layer thickness for all tissue samples. Lamina propria has the largest thickness of 158.14 ± 8.75 µm, the submucosa is the thinnest with a thickness of 143.19 ± 10.11 µm and the thickness of the muscularis mucosa is 149.49 ± 10.85 µm.

3.3. Vibrational OCE Results of Oesophageal Tissue Sample

To estimate the elastic properties of the oesophageal tissue sample quantitatively, the elasticity values were extracted from the elasticity image by selecting a maximum effective coverage region of each layer. Each sample was examined by the OCT/OCE. Both the OCT structural and OCE elasticity images were obtained for each sample. The aim for generating both the structure and elasticity image is to associate the OCE elasticity image with the OCT structure to investigate the elasticity variation regarding layer differences. Figure 7 demonstrates the OCT structure image (a), elasticity image (b) and the overlaid image (c) of oesophageal tissue sample. The boundary between sample and reference material can be observed in the structure image, which is indicated by the yellow arrow. Clear elasticity differences are seen in (b) by following the tissue boundaries which are observed in the OCT structure image.
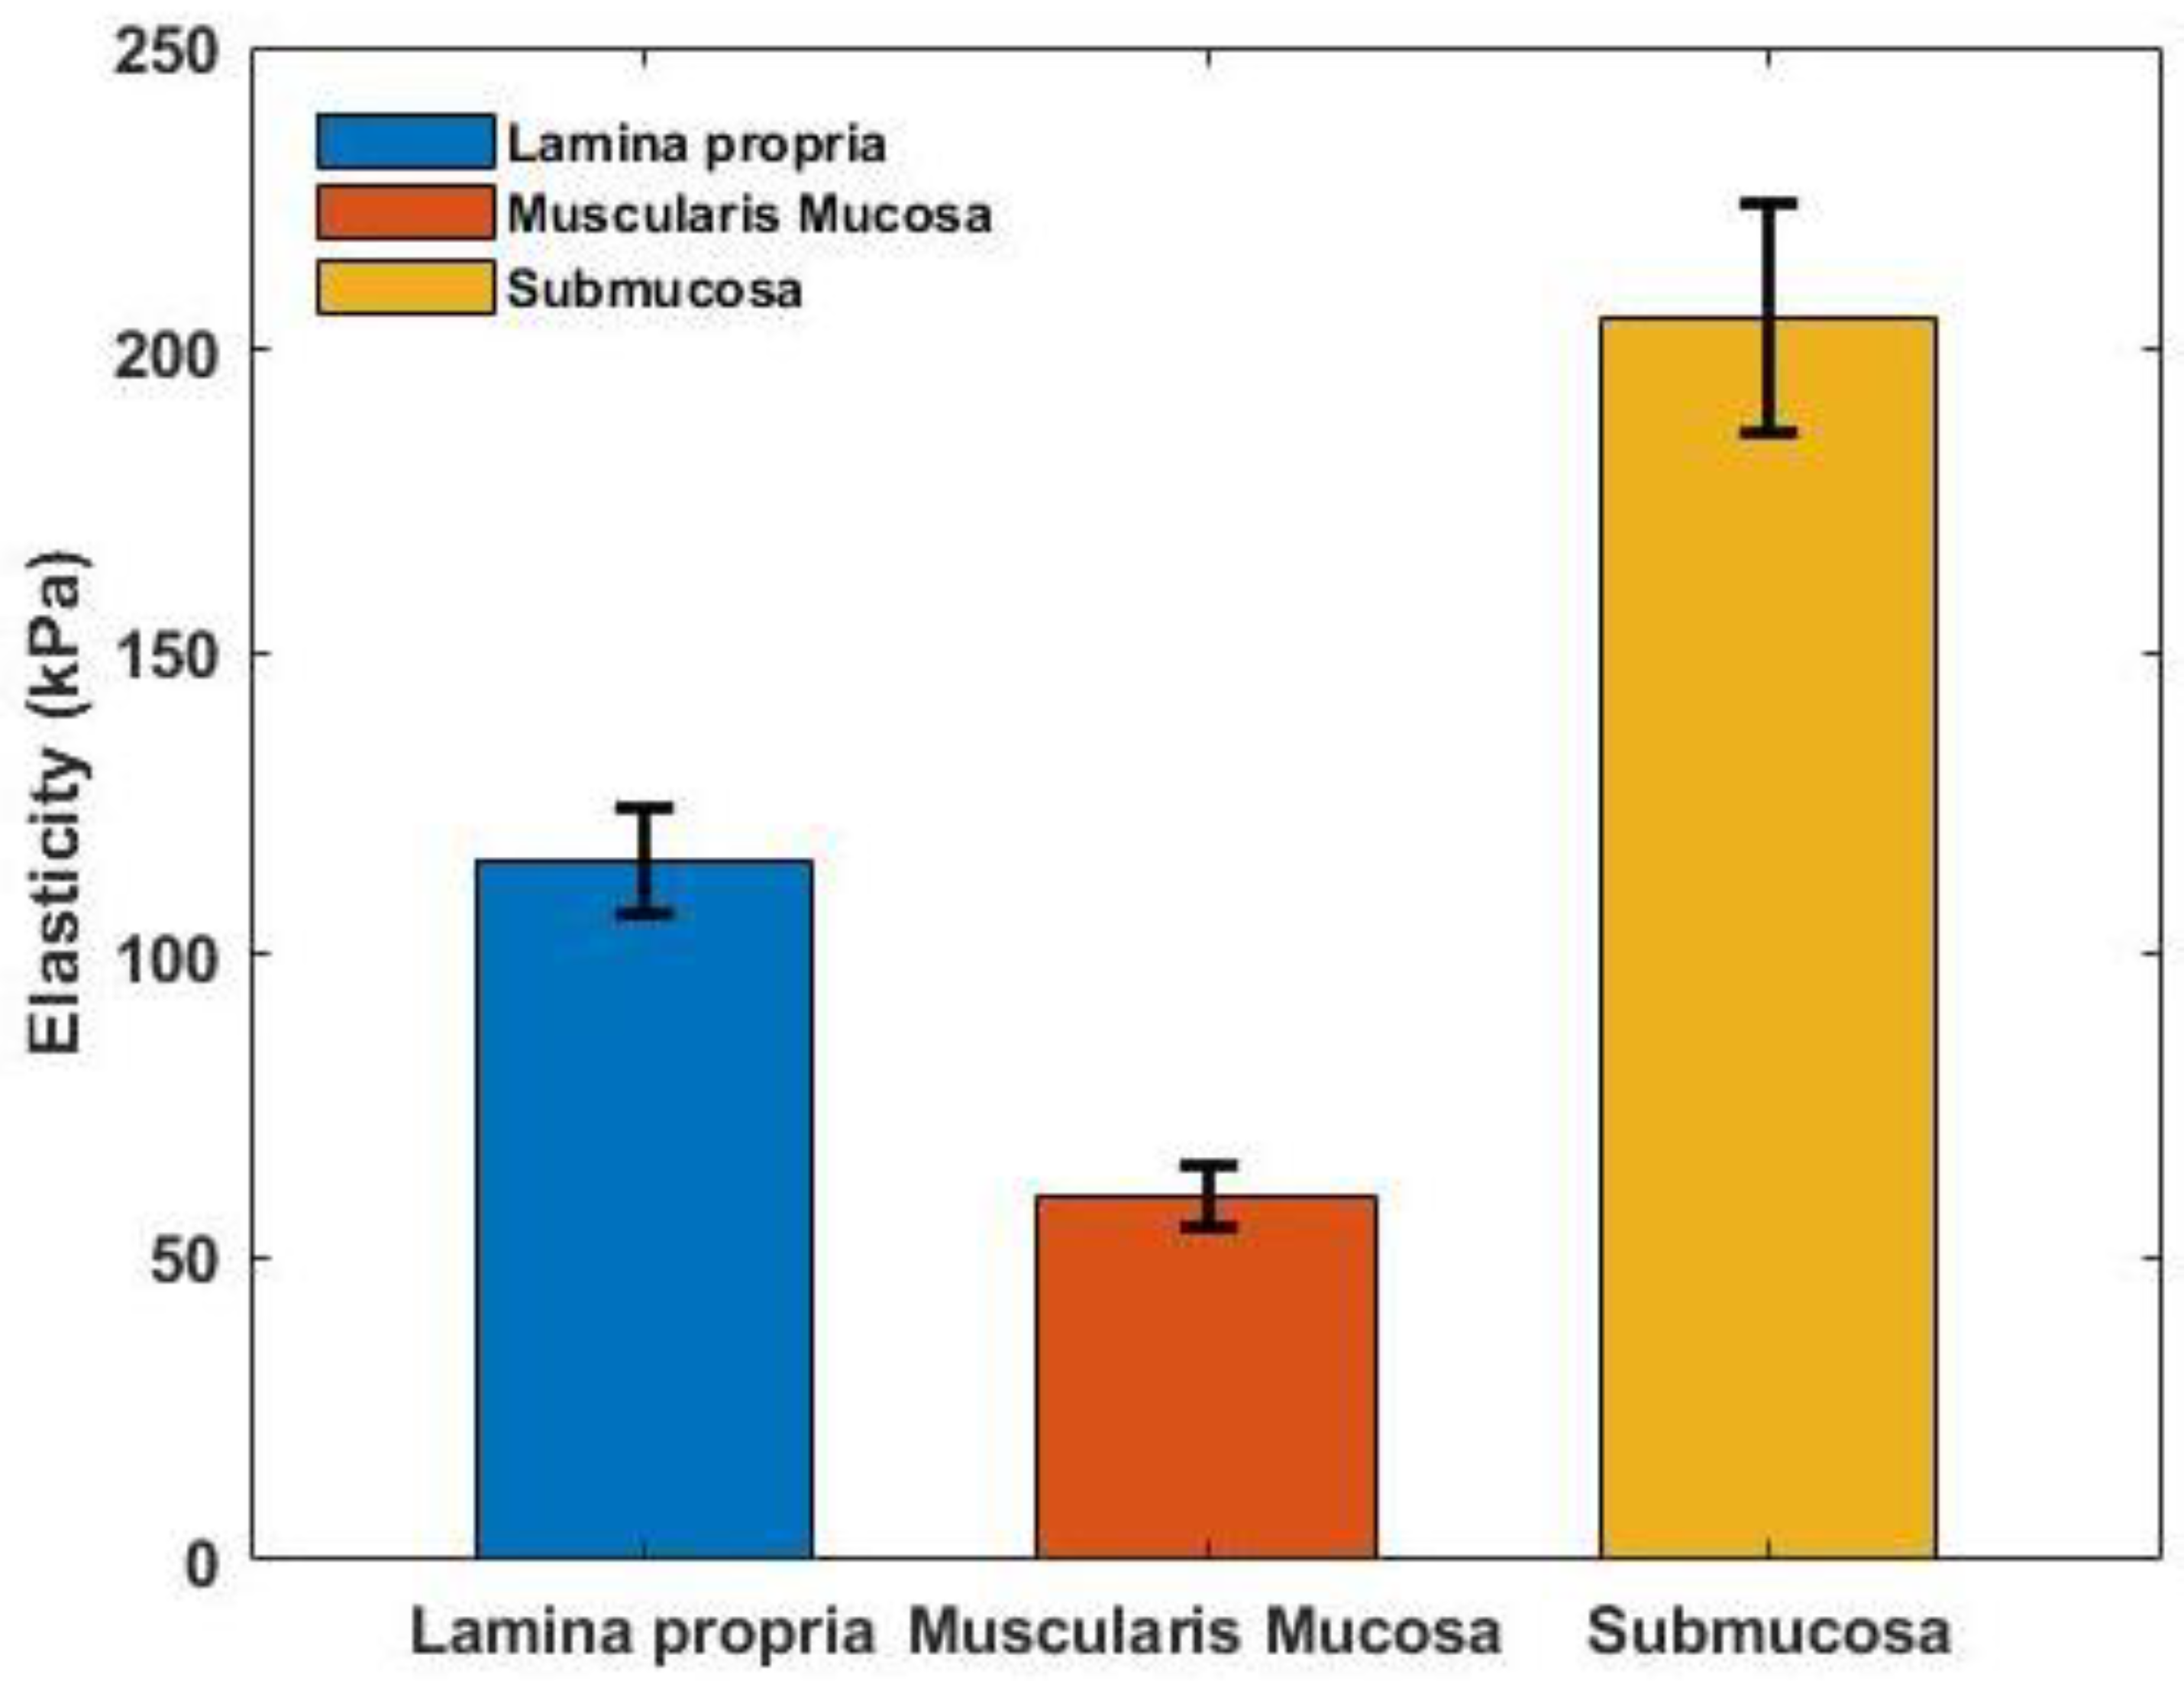
The mean elasticity value of each cadaver’s oesophagus layer was estimated for 52 samples and demonstrates remarkable differences in elasticity values between the layers (see Figure 8). A trend was seen across all samples where the highest elasticity was observed in the submucosa layer with the highest averaged elasticity of 205.25 ± 19.03 kPa and followed by the lamina propria and muscularis mucosa layers, with an averaged elasticity of 115.64 ± 8.80 kPa and 60.28 ± 5.27 kPa, respectively.

4. Discussion

This study demonstrated the structural information of human Thiel-embalmed cadavers by using PhS-OCT; in addition, the mechanical properties involving the three different layers were evaluated quantitatively by vibrational OCE. Prominently, mechanical property differences throughout layers were compared.
As a biological tissue, human oesophageal tissue contains several different layers. There are limited studies and research focused on the mechanical behaviour of human oesophageal cancer tissue; the mechanical behaviour of human oesophageal cancer tissue is still under investigation, especially the heterogeneous mechanical properties of human oesophageal tissue layers.
The most recent study investigated the muscular layer of human formalin solution-embalmed cadaver oesophagus wall by using the tensile cyclic test, due to the anisotropy and viscoelastic behaviour of the oesophagus wall. The mechanical behaviour in longitudinal and circumferential direction was compared. No quantitative evaluation was performed [35]. Ultrasound was employed to investigate the human oesophagus wall biomechanics, but the oesophagus wall was treated as a homogenous tissue [36]. Several studies investigated layers of rat oesophageal tissues; the connection to human tissue is still under doubt [37,38,39]. There is no standard method and technology to quantitatively measure the mechanical properties of human oesophageal tissue. In this study, the proposed VOCE system generates the deformation to the sample without direct contact to study the elasticity of different layers of the human cadaver oesophagus wall. The quantitative mechanical properties of layered human cadaver oesophagus samples are presented. The mechanical property differences between tissue layers were clearly shown in the results.
Quantitative optical properties of object sample tissue offer an extra classification parameter [40]. Analysis of the optical properties of the oesophageal tissue sample could allow us to differentiate the sample layers by the quantitative data, not the histological results. The averaged OCT intensity for each oesophageal tissue layer was evaluated and are presented in Figure 4a and Table 2. The contrast differences between each layer should be caused by the coefficients of tissue attenuation and reflection. In Table 2, the OCT intensity for each layer was presented. As the light penetrates from the top to bottom along the depth direction within the OCT structure image, the light energy should decrease along the depth direction as the light energy was absorbed by each layer. However, the OCT intensity for the bottom layer which is the submucosa shows a relatively higher value than the muscularis mucosa layer which is in the middle. It should be caused by the reflection coefficient of submucosa being higher than the muscularis mucosa layer. From the results in Figure 4a and Table 2, the clear differences and small standard error indicated that the OCT intensity could be used as an objective parameter for layer classification in oesophageal tissue investigation.
In the OCE experiment, the periodical sinusoidal vibrational deformation was assumed to be uniformly distributed to the tissue sample and reference material. The strain can be determined from displacement-generated vibration [41]. The peak-to-peak deformation was measured as under a 200 nm range, which is lower than a 0.067% strain. This deformation value ensures the strain was in pure linear-elastic regime. It has been described that when evaluating the elasticity of a designated sample region, the strain values extracted from the sample region and the reference material region were obtained; the sample elasticity will be estimated by multiplying the strain ratio with the known reference material elasticity. To obtain an accurate result, the strain value of the reference material is obtained by calculating the mean value of the entire reference material region.
It has been described that collagen mainly provides the stiffness and strength in biological tissues [42]. Compared with the collagen fibre, the elastic fibre is more flexible [43], which means the elasticity of the elastic fibre should be lower than the collagen fibre. By comparing the histology results (see Figure 3b), the distribution of the collagen fibre and elastic fibre are clearly shown. Those main elements significantly contribute to the mechanical behaviour of the tissue. By evaluating the layers’ mechanical properties throughout 52 samples, the OCE results represent the same phenomenon depending on the fibre composition of each layer. The different elements’ distribution in the tissue leads to big differencesin the elastic properties which can be observed in Figure 8. The fact that the samples were obtained from different human cadavers, as well as the preservation conditions, could potentially lead to a variation in the elasticity value. However, a clear trend was found, which is that the submucosa layer has the highest elasticity, muscularis mucosa has the lowest elasticity and the lamina propria has the middle value. This quantitative elasticity of the oesophagus layers could be used as a parameter to characterize the pathological conditions.
It is noticed that the silicone reference material shows an appearance of inhomogeneity in OCE results, which can be observed in Figure 7b. The yellow arrow in Figure 7a indicates the boundary between the sample and the silicone reference material. The silicone reference material region shows an unsmooth, plaque pattern. This phenomenon may affect the sample elasticity evaluation. In practice, the commercial silicone material (Ecoflex, 00-30; Smooth-on Inc., Macungie, PA, USA) was fabricated via an aqueous emulsion process. From the technical data, there is no information supplied regarding the silicone particle size, whereas the study investigated the silicone elastomeric particle size in silicone rubber and demonstrated that the mean size of the silicone particle is 2 μ m to 10 μ m [44]. Due to the resolution of the OCE result being in micro-metre scale, the relatively large particle size caused the pattern to appear in the reference material region. As the mean strain value of the reference material is obtained for the elasticity evaluation, the impact of the reference material’s inhomogeneous appearance is minimized.
We performed both OCT and OCE results for 52 specimen samples from 7 different human Thiel-embalmed cadavers. By comparing the corresponding histology results, the boundaries between layers were clearly observed within OCT/OCE results. Optical, structure and elastic properties were quantitatively evaluated and summarized. The results demonstrated the clinical feasibility of OCT/OCE in the investigation of oesophageal tissue. By way of the OCT/OCE results which indicate the clear differences between layers in quantitative data, the characterizing of layers and monitoring of tissue abnormality can be achieved. Studies have shown that ultrasound elastography can be easily included in clinical diagnosis of oesophageal cancer, and the staging of oesophageal cancer can be improved [45,46]. Compared with ultrasound elastography imaging, OCT/OCE could offer higher resolution results in both structure and elasticity images which could potentially contribute to the future diagnosis and staging of oesophageal cancer.
However, the imaging depth may limit the application of OCT/OCE in clinical practice. Even the literature indicates that OCT/OCE can reach the depth of 4 mm to 5 mm [47]. Based on the system setup in this study and practice with human Thiel-embalmed oesophageal tissue, the actual imaging depth is around 1.5 mm to 2 mm. To scan the entire oesophagus wall, multiple scanning can be considered to solve this limitation.
Another limitation of this study is that there was no control group of fresh human tissues used. The Thiel-embalmed oesophageal tissue was obtained from bodies that had been previously used for teaching. Therefore, cadaveric tissue was exposed to air for periods of time. The tissues were consistently sprayed with Thiel fluid to minimise drying out. All samples used in this study were stored in a small quantity of Thiel fluid to prevent drying out. Moreover, the Thiel embalming technique can preserve the cadaver with a soft texture and close to living organism colour; it has been demonstrated that Thiel embalming can cause an increase in the elastic property of the tissue [48]. Additional investigation should be carried out to investigate fresh human cadavers or fresh human oesophageal tissue.

5. Conclusions

In conclusion, we demonstrate the capability of PhS-OCT and vibrational OCE in the characterisation of human cadaver oesophageal tissue. A quantitative measurement of human cadaver oesophageal tissue layer elasticity was carried out by using the VOCE. This is the first study about the mechanical property quantitative-evaluation of human Thiel-embalmed oesophageal tissue. Three different layers’ elasticity of the oesophageal tissue were estimated, and we demonstrated the differences in each oesophageal tissue layer. The inhomogeneity in the layer’s elastic properties was evaluated quantitatively. Meanwhile, the optical property of each oesophageal tissue layer was investigated based on the OCT intensity in dB scale quantitatively. The proposed techniques and method are capable of characterizing the mechanical properties of human oesophageal tissue, and can be applied in the assessment of the pathological changes in the human oesophagus. Moreover, the feasibility of the OCT/OCE in clinical diagnostic of oesophageal diseases was discussed.

Author Contributions

Methodology, M.W.; software, M.W.; validation, M.W., J.L. and M.B.; formal analysis, M.W.; investigation, M.W., J.L. and M.B.; resources, C.L. and L.R.; writing—original draft preparation, M.W.; writing—review and editing, M.W., C.L. and L.R.; visualization, M.W.; supervision, C.L. and L.R.; project administration, M.W., C.L., L.R. and Z.H.; funding acquisition, C.L., Z.H. and L.R. All authors have read and agreed to the published version of the manuscript.

Funding

This research received no external funding.

Institutional Review Board Statement

This study did not require ethical approval due to consent being given during the bequeathal process.

Informed Consent Statement

Not applicable.

Data Availability Statement

The data presented in this study are available on request from the corresponding author. The data are not publicly available due to ethical restrictions.

Acknowledgments

I would like to express my gratitude to Yilong Zhang, Markus Pakleppa for their support. The authors would like to express the highest gratitude to those who donated their bodies to science for the furtherment of anatomical education and research.

Conflicts of Interest

The authors declare no conflict of interest.

References

  1. Torre, L.A.; Siegel, R.L.; Ward, E.M.; Jemal, A. Global Cancer Incidence and Mortality Rates and Trends—An Update Global Cancer Rates and Trends—An Update. Cancer Epidemiol. Biomark. Prev. 2016, 25, 16–27. [Google Scholar] [CrossRef] [Green Version]
  2. Blot, W.J.; Devesa, S.S.; Fraumeni, J.F. Continuing Climb in Rates of Esophageal Adenocarcinoma: An Update. JAMA 1993, 270, 1320. [Google Scholar] [CrossRef] [PubMed]
  3. Blot, W.J.; Devesa, S.S.; Kneller, R.W.; Fraumeni, J.F. Rising Incidence of Adenocarcinoma of the Esophagus and nGastric Cardia. JAMA 1991, 265, 1287–1289. [Google Scholar] [CrossRef] [PubMed]
  4. Cook, M.; Chow, W.; Devesa, S. Oesophageal cancer incidence in the United States by race, sex, and histologic type, 1977–2005. Br. J. Cancer 2009, 101, 855–859. [Google Scholar] [CrossRef] [Green Version]
  5. Zhang, Y. Epidemiology of esophageal cancer. World J. Gastroenterol. 2013, 19, 5598. [Google Scholar] [CrossRef] [PubMed]
  6. Meves, V.; Behrens, A.; Pohl, J. Diagnostics and Early Diagnosis of Esophageal Cancer. Visc. Med. 2015, 31, 315–318. [Google Scholar] [CrossRef] [Green Version]
  7. Thomas, T.; Gilbert, D.; Kaye, P.; Penman, I.; Aithal, G.; Ragunath, K. High-resolution endoscopy and endoscopic ultrasound for evaluation of early neoplasia in Barrett’s esophagus. Surg. Endosc. 2010, 24, 1110–1116. [Google Scholar] [CrossRef] [PubMed]
  8. Falk, G.W.; Catalano, M.F.; Sivak, M.V., Jr.; Rice, T.W.; Van Dam, J. Endosonography in the evaluation of patients with Barrett’s esophagus and high-grade dysplasia. Gastrointest. Endosc. 1994, 40, 207–212. [Google Scholar] [CrossRef]
  9. Bayramoglu, N.; Kannala, J.; Heikkila, J. Deep learning for magnification independent breast cancer histopathology image classification. In Proceedings of the 2016 23rd International Conference on Pattern Recognition (ICPR), Cancun, Mexico, 4–8 December 2016; pp. 2440–2445. [Google Scholar]
  10. Belsare, A.; Mushrif, M. Histopathological image analysis using image processing techniques: An overview. Signal Image Process. 2012, 3, 23. [Google Scholar] [CrossRef]
  11. Hanby, A. The pathology of breast cancer and the role of the histopathology laboratory. Clin. Oncol. 2005, 17, 234–239. [Google Scholar] [CrossRef] [PubMed]
  12. Boyd, N.F.; Li, Q.; Melnichouk, O.; Huszti, E.; Martin, L.J.; Gunasekara, A.; Mawdsley, G.; Yaffe, M.J.; Minkin, S. Evidence That Breast Tissue Stiffness Is Associated with Risk of Breast Cancer. PLoS ONE 2014, 9, e100937. [Google Scholar] [CrossRef] [PubMed]
  13. Hoyt, K.; Castaneda, B.; Zhang, M.; Nigwekar, P.; di Sant’Agnese, P.A.; Joseph, J.V.; Strang, J.; Rubens, D.J.; Parker, K.J. Tissue elasticity properties as biomarkers for prostate cancer. Cancer Biomarkers 2008, 4, 213–225. [Google Scholar] [CrossRef] [PubMed] [Green Version]
  14. Tomlins, P.H.; Wang, R. Theory, developments and applications of optical coherence tomography. J. Phys. D Appl. Phys. 2005, 38, 2519–2535. [Google Scholar] [CrossRef]
  15. Cheong, W.-F.; Prahl, S.A.; Welch, A.J. A review of the optical properties of biological tissues. IEEE J. Quantum Electron. 1990, 26, 2166–2185. [Google Scholar] [CrossRef] [Green Version]
  16. Tuchin, V.V. Tissue Optics: Light Scattering Methods and Instruments for Medical Diagnosis; SPIE Press Book: Bellingham, WA, USA, 2007; p. 840. [Google Scholar]
  17. Zhou, F.; Wei, H.; Ye, X.; Hu, K.; Wu, G.; Yang, H.; He, Y.; Xie, S.; Guo, Z. Influence of nanoparticles accumulation on optical properties of human normal and cancerous liver tissue in vitro estimated by OCT. Phys. Med. Biol. 2015, 60, 1385. [Google Scholar] [CrossRef]
  18. Qin, N.; Liu, Y.; Huang, L.; Xin, Y.; Zhang, X.; Hu, X.; Li, Q. Research on optical properties of cardiovascular tissues based on OCT data. J. Innov. Opt. Health Sci. 2021, 14, 2140007. [Google Scholar] [CrossRef]
  19. Guan, G.; Li, C.; Ling, Y.; Yang, Y.; Vorstius, J.B.; Keatch, R.; Wang, R.; Huang, Z. Quantitative evaluation of degenerated tendon model using combined optical coherence elastography and acoustic radiation force method. J. Biomed. Opt. 2013, 18, 111417. [Google Scholar] [CrossRef] [PubMed]
  20. Zhang, D.; Wang, J.; Zhou, K.; Wang, R.; Li, C.; Huang, Z. Optimal frequency for vibrational optical coherence elastography (OCE) on tissue mechanical properties characterization. In Optical Elastography and Tissue Biomechanics VI; SPIE: Bellingham, WA, USA, 2019; Volume 10880, pp. 15–20. [Google Scholar]
  21. Zhang, Y.; Ling, Y.; Zhang, D.; Wang, M.; Purslow, C.; Yang, Y.; Li, C.; Huang, Z. Quantitative measurement of mechanical properties in wound healing processes in a corneal stroma model by using vibrational optical coherence elastography (OCE). Biomed. Opt. Express 2021, 12, 588–603. [Google Scholar] [CrossRef]
  22. Zvietcovich, F.; Yao, J.; Chu, Y.-J.; Meemon, P.; Rolland, J.P.; Parker, K.J. A comparative study of shear wave speed estimation techniques in optical coherence elastography applications. In Optical Elastography and Tissue Biomechanics III; SPIE: Bellingham, WA, USA, 2016; Volume 9710, pp. 99–109. [Google Scholar]
  23. Li, C.; Guan, G.; Ling, Y.; Hsu, Y.-T.; Song, S.; Huang, J.T.-J.; Lang, S.; Wang, R.K.; Huang, Z.; Nabi, G. Detection and characterisation of biopsy tissue using quantitative optical coherence elastography (OCE) in men with suspected prostate cancer. Cancer Lett. 2015, 357, 121–128. [Google Scholar] [CrossRef]
  24. Yuting, L.; Li, C.; Zhou, K.; Guan, G.; Appleton, P.L.; Lang, S.; McGloin, D.; Huang, Z.; Nabi, G. Microscale characterization of prostate biopsies tissues using optical coherence elastography and second harmonic generation imaging. Lab. Investig. 2018, 98, 380–390. [Google Scholar] [CrossRef] [PubMed] [Green Version]
  25. Brezinski, M.; Fujimoto, J. Optical coherence tomography: High-resolution imaging in nontransparent tissue. IEEE J. Sel. Top. Quantum Electron. 1999, 5, 1185–1192. [Google Scholar] [CrossRef]
  26. Zhang, D.; Wang, J.; Li, C.; Huang, Z. Optimal stimulation frequency for vibrational optical coherence elastography. J. Biophotonics 2019, 13, e201960066. [Google Scholar] [CrossRef]
  27. Bille, J.F. High Resolution Imaging in Microscopy and Ophthalmology: New Frontiers in Biomedical Optics; Springer: Berlin/Heidelberg, Germany, 2019. [Google Scholar]
  28. Suvik, A.; Effendy, A. The use of modified Masson’s trichrome staining in collagen evaluation in wound healing study. Mal. J. Vet. Res. 2012, 3, 39–47. [Google Scholar]
  29. Tateya, T.; Tateya, I.; Bless, D.M. Immuno-scanning electron microscopy of collagen types I and III in human vocal fold lamina propria. Ann. Otol. Rhinol. Laryngol. 2007, 116, 156–159. [Google Scholar] [CrossRef]
  30. Madruga de Melo, E.C.; Lemos, M.; Filho, J.A.X.; Sennes, L.U.; Saldiva, P.H.N.; Tsuji, D.H. Distribution of collagen in the lamina propria of the human vocal fold. Laryngoscope 2003, 113, 2187–2191. [Google Scholar] [CrossRef]
  31. Hahn, M.S.; Kobler, J.B.; Starcher, B.C.; Zeitels, S.M.; Langer, R. Quantitative and Comparative Studies of the Vocal Fold Extracellular Matrix I: Elastic Fibers and Hyaluronic Acid. Ann. Otol. Rhinol. Laryngol. 2006, 115, 156–164. [Google Scholar] [CrossRef] [PubMed]
  32. Shankar, K.G.; Kumar, S.U.; Sowndarya, S.; Babu, P.S.; Rose, C. Isolation, characterization, and in vitro evaluation of bovine rumen submucosa films of collagen or chitosan-treated collagen. J. Biomater. Appl. 2015, 30, 780–792. [Google Scholar] [CrossRef]
  33. Kilarski, W.; Bigaj, J. The fine structure of striated muscle fibres of tunica muscularis of the intestine in some teleosts. Zeitschrift für Zellforschung und Mikroskopische Anatomie 1971, 113, 472–489. [Google Scholar] [CrossRef] [PubMed]
  34. Kallmünzer, B.; Sorensen, B.; Neuhuber, W.L.; Wörl, J. Enteric co-innervation of striated muscle fibres in human oesophagus. Neurogastroenterol. Motil. 2008, 20, 597–610. [Google Scholar] [CrossRef]
  35. Durcan, C.; Hossain, M.; Chagnon, G.; Perić, D.; Bsiesy, L.; Karam, G.; Girard, E. Experimental investigations of the human oesophagus: Anisotropic properties of the embalmed muscular layer under large deformation. Biomech. Model. Mechanobiol. 2022, 21, 1169–1186. [Google Scholar] [CrossRef]
  36. Takeda, T.; Kassab, G.; Liu, J.; Puckett, J.L.; Mittal, R.R.; Mittal, R.K. A novel ultrasound technique to study the bio-mechanics of the human esophagus in vivo. Am. J. Physiol. Gastrointest. Liver Physiol. 2002, 282, G785–G793. [Google Scholar] [CrossRef] [Green Version]
  37. Yang, J.; Liao, N.; Zhao, J.; Gregersen, H. Shear modulus of elasticity of the esophagus. Ann. Biomed. Eng. 2004, 32, 1223–1230. [Google Scholar] [CrossRef]
  38. Yang, J.; Zhao, J.; Liao, D.; Gregersen, H. Biomechanical properties of the layered oesophagus and its remodelling in experimental type-1 diabetes. J. Biomech. 2006, 39, 894–904. [Google Scholar] [CrossRef] [PubMed]
  39. Fan, Y.; Gregersen, H.; Kassab, G.S. A two-layered mechanical model of the rat esophagus. Experiment and theory. Biomed. Eng. Online 2004, 3, 40. [Google Scholar] [CrossRef] [Green Version]
  40. Sirotkina, M.A.; Shirmanova, M.V.; Bugrova, M.; Elagin, V.V.; Agrba, P.A.; Kirillin, M.Y.; Kamensky, V.A.; Zagaynova, E.V. Continuous optical coherence tomography monitoring of nanoparticles accumulation in biological tissues. J. Nanoparticle Res. 2011, 13, 283–291. [Google Scholar] [CrossRef]
  41. Kennedy, B.F.; Hillman, T.R.; McLaughlin, R.A.; Quirk, B.C.; Sampson, D.D. In vivo dynamic optical coherence elastography using a ring actuator. Opt. Express 2009, 17, 21762–21772. [Google Scholar] [CrossRef]
  42. Henninger, H.B.; Ellis, B.J.; Scott, S.A.; Weiss, J.A. Contributions of elastic fibers, collagen, and extracellular matrix to the multiaxial mechanics of ligament. J. Mech. Behav. Biomed. Mater. 2019, 99, 118–126. [Google Scholar] [CrossRef] [PubMed]
  43. Kristensen, J.H.; Karsdal, M.A. Elastin. In Biochemistry of Collagens, Laminins and Elastin; Elsevier: Amsterdam, The Netherlands, 2016; pp. 197–201. [Google Scholar]
  44. Liles, D.T.; Lin, F. Silicone Elastomeric Particles in Skin Care Applications. In Polymeric Delivery of Therapeutics; American Chemical Society: Washington, DC, USA, 2010; Volume 1053, pp. 207–219. [Google Scholar] [CrossRef]
  45. Knabe, M.; Günter, E.; Ell, C.; Pech, O. Can EUS elastography improve lymph node staging in esophageal cancer? Surg. Endosc. 2012, 27, 1196–1202. [Google Scholar] [CrossRef]
  46. Sazuka, T.; Akai, T.; Uesato, M.; Horibe, D.; Kuboshima, M.; Kitabayashi, H.; Matsunaga, A.; Kagaya, A.; Muto, Y.; Takeshita, N.; et al. Assessment for diagnosis of lymph node metastasis in esophageal cancer using endoscopic ultrasound elastography. Esophagus 2016, 13, 254–263. [Google Scholar] [CrossRef] [PubMed] [Green Version]
  47. Li, C.; Guan, G.; Cheng, X.; Huang, Z.; Wang, R.K. Quantitative elastography provided by surface acoustic waves measured by phase-sensitive optical coherence tomography. Opt. Lett. 2012, 37, 722–724. [Google Scholar] [CrossRef] [PubMed]
  48. Ling, Y.; Li, C.; Feng, K.; Duncan, R.; Eisma, R.; Huang, Z.; Nabi, G. Effects of fixation and preservation on tissue elastic properties measured by quantitative optical coherence elastography (OCE). J. Biomech. 2016, 49, 1009–1015. [Google Scholar] [CrossRef] [PubMed] [Green Version]
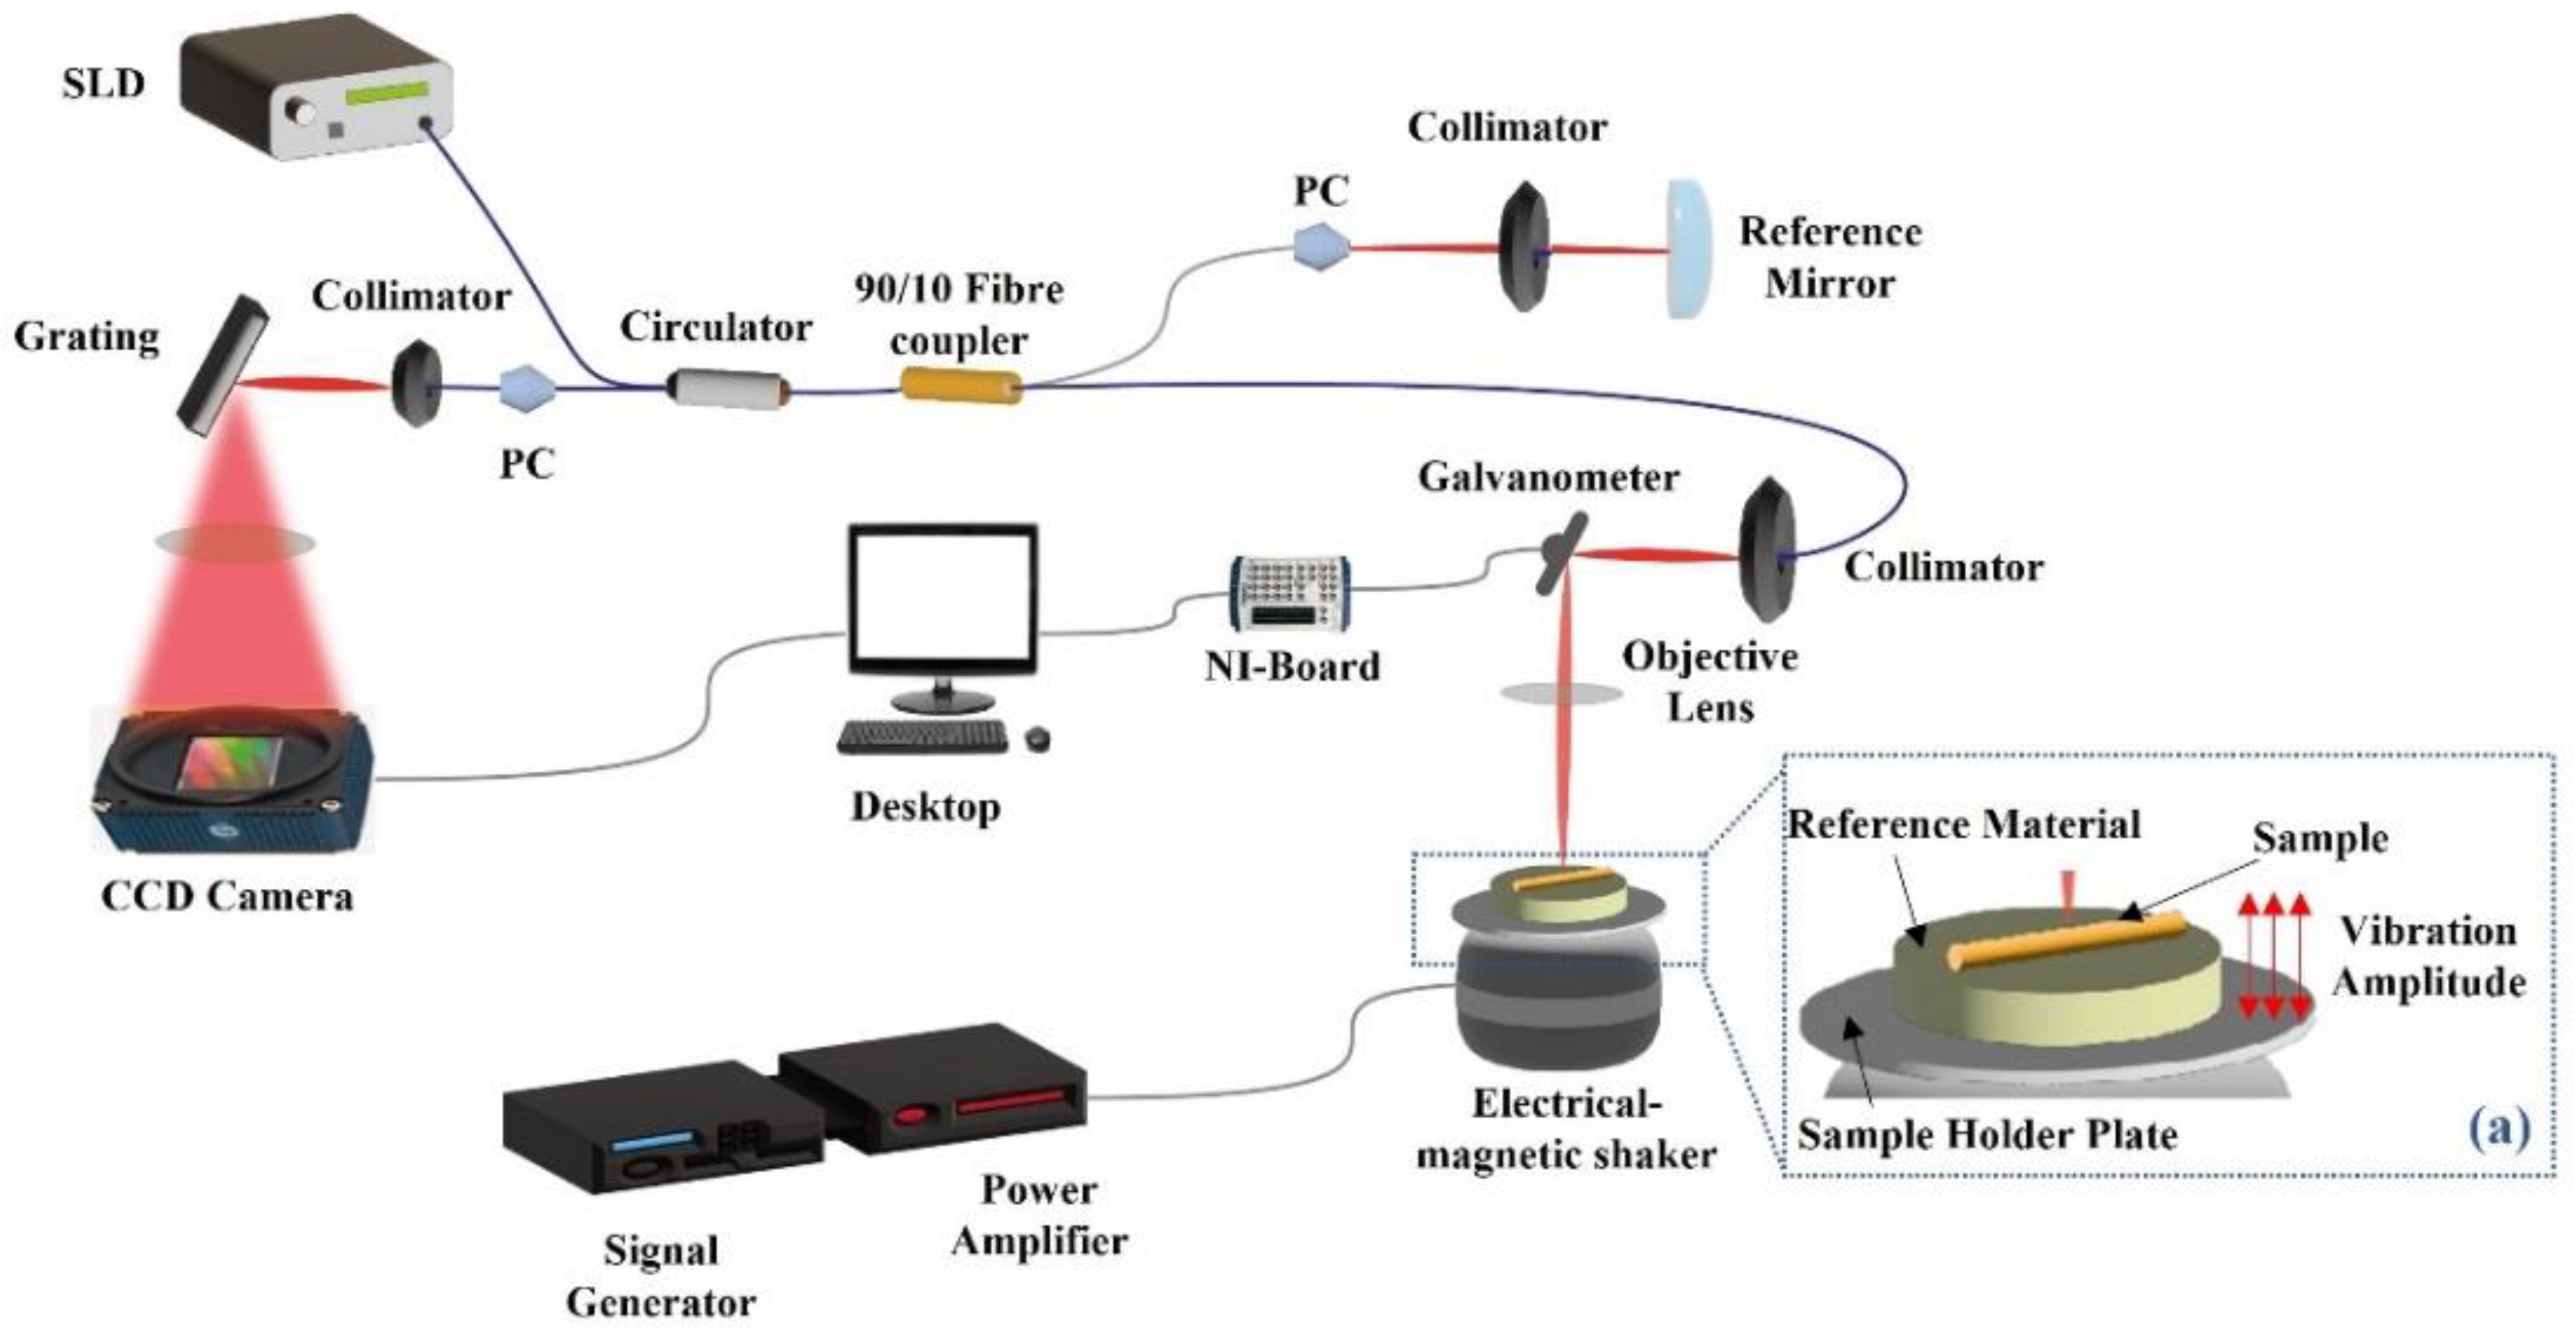
Figure 1. System setup of PhS-OCT-based vibrational OCE for human cadaver oesophageal tissue elasticity-evaluation. Dashed window (a) shows the sample and reference material placement on the shaker; the vibration amplitude is transmitted uniformly to the sample and reference material.
Applsci 13 03844 g001
Figure 2. The oesophagus was shown in (a), it was divided into five same length sections. (b) The gastro–oesophageal transition zone is selected for the OCT/OCE examination. (c) indicates that a sample with 15 mm (Longitudinal) and 10 mm (Transverse) was incised off from the gastro–oesophageal transition zone sample. The sample was placed on the sample holder with silicone reference material (White) underneath it. A red line on the sample indicates the OCT/OCE scan position.
Applsci 13 03844 g002
Figure 3. OCT structure image (a), and corresponding histology results (b), respectively. The yellow dashed lines indicate the boundaries between each layer.
Applsci 13 03844 g003
Figure 4. (a) OCT intensity values of different oesophageal tissue layer for each of the 52 samples. The OCT intensity is in dB scale. (b) OCT structure image, which the yellow dashed lines indicate the boundary between layers, from lumen side, top to bottom, the layers are Lamina propria, Muscularis Mucosa, and Submucosa respectively.
Applsci 13 03844 g004
Figure 5. An example of layer thickness measurement of oesophageal tissue layer.
Applsci 13 03844 g005
Figure 6. Averaged oesophagus sample layers thickness for 52 tissue samples.
Applsci 13 03844 g006
Figure 7. (a) Structure image of oesophageal tissue sample in dB scale; (b) Elasticity image of the corresponding oesophageal tissue sample in kPa scale; (c) Overlaid image of structure and elasticity image.
Applsci 13 03844 g007
Figure 8. Averaged elastic modulus of lamina propria, muscularis mucosa and submucosa for 52 oesophageal tissue samples.
Applsci 13 03844 g008
Table 1. Sample information, cadavers’ information and the number of samples obtained from each cadaver.
Cadaver No.Days in TankAge at DeathGenderSample Number
144485Female6
229888Female14
316490Male2
416689Female1
516189Male4
615595Male3
747881Female21
Table 2. Averaged back-scattered OCT intensity from each oesophagus layer.
Lamina PropriaMuscularis MucosaSubmucosa
79.27 ± 0.51 dB 69.83 ± 0.56 dB 76.10 ± 0.55 dB
Disclaimer/Publisher’s Note: The statements, opinions and data contained in all publications are solely those of the individual author(s) and contributor(s) and not of MDPI and/or the editor(s). MDPI and/or the editor(s) disclaim responsibility for any injury to people or property resulting from any ideas, methods, instructions or products referred to in the content.